")
Back to Journals » OncoTargets and Therapy » Volume 10
Nuclear factor-kappa B1 inhibits early apoptosis of glioma cells by promoting the expression of Bcl-2
Authors Yang TQ, Chen M, Wang YQ, Xu W, Han Y, Xu J, Xiang YJ, Yuan B, Wang HZ, Zhou YX
Received 14 June 2017
Accepted for publication 25 July 2017
Published 31 August 2017 Volume 2017:10 Pages 4305—4313
DOI https://doi.org/10.2147/OTT.S144014
Checked for plagiarism Yes
Review by Single anonymous peer review
Peer reviewer comments 2
Editor who approved publication: Dr Yao Dai
This paper has been retracted.
Tian-quan Yang, 1,* Min Chen, 1,* Yong-qiang Wang, 1 Wei Xu, 1 Yong Han, 1 Jin Xu, 1 Yong-jun Xiang, 1 Bin Yuan, 1 Hang-zhou Wang, 1 You-xin Zhou 2
1Department of Neurosurgery, Children’s Hospital of Soochow University, 2Department of Neurosurgery and Brain and Nerve Research Laboratory, The First Affiliated Hospital of Soochow University, Suzhou, People’s Republic of China
*These authors contributed equally to this work
Abstract: Glioma is one of the most common types of adult primary brain tumors, and the underlying molecular mechanisms still remain unclear. Nuclear factor-kappa B1 (NF-κB1) is involved in a variety of malignancies and is widely expressed in malignant tumors. However, the expression of NF-κB1 in different grades of glioma, the correlation between NF-κB1 and Bcl-2 expressions in gliomas, and the research between NF-κB1 and early apoptosis of glioma cells have not been reported so far. In this study, the expression level of NF-κB1 in 31 human glioma tissues and six nonneoplastic brain tissues was determined using quantitative real-time polymerase chain reaction. Results showed that the expression of NF-κB1 in human glioma tissues and glioma cell lines, SHG44 and U87, was significantly higher compared to noncancerous brain tissues and that the expression increased with increasing degrees of tumor malignancy. Similar results were demonstrated with the expression of Bcl-2 in the same human glioma specimens. Flow cytometry results showed that inhibition of NF-κB1 expression significantly promoted apoptosis of SHG44 and U87 in human glioma cells. Western blot analysis further confirmed decreased expression of Bcl-2 protein after inhibition of NF-κB1 protein expression. Taken together, NF-κB1 overexpression inhibits early apoptosis of glioma cells and high expression of NF-κB1 promotes the expression of antiapoptotic gene Bcl-2. Therefore, our study results provide a theoretical basis for antiapoptotic mechanism of tumor cells in association with NF-κB1.
Keywords: NF-κB1, Bcl-2, glioma, apoptosis
Introduction
Glioma is one of the most common types of primary brain tumors in adults, accounting for nearly 40% of all central nervous system malignancies,1,2 and is one of the most aggressive and lethal human cancer types.3 They have the ability of higher proliferation, invasion, migration, and lower apoptosis. In spite of advances in surgery, radiation therapy, and chemotherapy, the prognosis of patients with gliomas has not significantly improved, and the median survival time of patients is expected to be 12–15 months.4,5 The unrestricted growth of glioma is not only the result of abnormal cell differentiation and proliferation but also closely related to the inhibition of apoptosis.6 During the occurrence and development process of glioma, abnormal expression or mutation of apoptosis-related genes not only block apoptosis but also promote the occurrence and development of tumor.7 Therefore, studying the underlying mechanism of glioma apoptosis is of great significance.
Nuclear factor-kappa B1 (NF-κB1) is a member of the Rel gene family and involved in the control of tumor cell growth, immune response, apoptosis, and transcriptional regulation.8 Studies have shown the association of NF-κB1 gene with thyroid cancer, oral squamous cell carcinoma, and colorectal cancer.9–11 However, there is little research on the association of NF-κB1 and gliomas. According to our previous study, NF-κB1 was highly expressed in gliomas.12 However, the expression of NF-κB1 in different grades of gliomas, the correlation between NF-κB1 and Bcl-2 expressions in gliomas, and the research between NF-κB1 and early apoptosis of glioma cells have not been reported so far. Hence, in this study, the expression of NF-κB1 protein in U87 and SHG44 glioma cells was downregulated by transfecting the cells to NF-κB1 shRNA plasmid vector and, then, observing the changes of early apoptosis of glioma cells. Also, the correlation between NF-κB1 and Bcl-2 was explored by in vitro experiments, which indicated that NF-κB1 inhibited the early apoptosis of glioma cells by promoting the expression of Bcl-2.
Materials and methods
Human tissue samples
For the study, 31 glioma samples were obtained from 31 Chinese patients between March 2000 and September 2016 from the Children’s Hospital of Soochow University and The First Affiliated Hospital of Soochow University (Suzhou, China). Patients included 19 men and 12 women. There were eight cases of grade I glioma (pilocytic astrocytoma [PA]), nine cases of grade II (diffuse astrocytoma [DA]), seven cases of grade III (anaplastic astrocytoma [AA]), and seven cases of grade IV (primary brain glioblastoma [GBM]), according to the 2007 World Health Organization classification system. Six samples of nonneoplastic brain tissue samples were obtained from adult patients with craniocerebral injuries, for whom a partial resection of brain tissue was required as decompression treatments to reduce intracranial pressure. This research was permitted and approved by the ethics committees of the Children’s Hospital of Soochow University and The First Affiliated Hospital of Soochow University. All human samples were used in accordance with the policies of the ethics committee. Informed written consents were obtained from the children’s parents prior to participation in the study.
Cell source and culture
Human glioma cell lines U87 and SHG44 were purchased from the Cell Bank Type Culture Collection of the Chinese Academy of Sciences (Shanghai, China). Cells were maintained in Dulbecco’s Modified Eagle’s Medium (DMEM; U87; Hyclone, Thermo Fisher Scientific, Waltham, MA, USA) or RPMI-1640 medium (SHG44; Hyclone, Thermo Fisher Scientific) supplemented with 10% fetal bovine serum (FBS) and 100 U/mL penicillin/streptomycin. All cultures were maintained in a humidified atmosphere of 5% CO2 at 37°C.
RNA extraction and quantitative real-time PCR
Total RNA from tissues (100 mg) and cells (1×10⁷ cells) were isolated using the TRIzol reagent (Thermo Fisher Scientific) for both mRNA and miRNA analyses. Relative levels of NF-κB1 and Bcl-2 mRNA were examined using SYBR green quantitative real-time polymerase chain reaction (qRT-PCR) (LightCycler® 480; Hoffman-La Roche Ltd., Basel, Switzerland) and were normalized to levels of GAPDH mRNA. The following primers were used: NF-κB1 forward, 5′-CCTCTCTCTAATCAGCCCTCTG-3′; NF-κB1 reverse, 5′-GAGGACCTGGGAGTAGATGAG-3′; GAPDH forward, 5′-AGAAGGCTGGGGCTCATTTG-3′; GAPDH reverse, 5′-AGGGGCCATCCACAGTCTTC-3′. Each sample was performed in triplicate, and the program was set at 95°C 1 min, 95°C 10 s, 59°C 20 s, and 72°C 10 s, in Roche 480 quantitative PCR instrument for 45 cycles. The results were analyzed with 2−ΔΔCT values.
Plasmid transfection and experimental grouping
U87 and SHG44 cells in the logarithmic growth phase were inoculated into six-well plates 1 day before transfection. The cells were divided into blank control group (mock), no-load plasmid group (negative), NF-κB1 silencing group (NF-κB1 shRNA), NF-κB1 overexpression group (NF-κB1), Bcl-2 silencing group (Bcl-2 shRNA), and NF-κB1 overexpression + Bcl-2 silencing group (NF-κB1 + Bcl-2 shRNA), and three replicates in each group. When the cells reached a confluence of 40%–50%, Lipofectamine 2000 was used to mediate no-load plasmid, NF-κB1 shRNA plasmid, NF-κB1 overexpression plasmid, and Bcl-2 shRNA plasmid transfections. In the human glioma cell lines, U87 and SHG44, Lipofectamine 2000 was used to mediate NF-κB1 overexpression plasmid and, then, the stable expression of the cell line was screened. The Bcl-2 shRNA plasmid was further transfected with the Lipofectamine 2000 reagent (Thermo Fisher Scientific) according to the manufacturer’s instructions. Grouped cells were collected at 24, 48, and 72 h after transfection.
Analysis of apoptosis
Cells were allowed to attach and proliferate in six-well plates for 24 h before transfection with no-load plasmid and NF-κB1 shRNA plasmid. Human glioma cell lines U87 and SHG44 were collected at 24, 48, and 72 h after transfection. Then, the proportion of cells in early-stage apoptosis was detected using the annexin V-PE Apoptosis Detection Kit (eBioscience, San Diego, CA, USA) and flow cytometry (FACSCanto; BD Biosciences, San Jose, CA, USA). Cells were washed once in phosphate buffered solution ([PBS]; Gibco, Thermo Fisher Scientific USA) and once in 1× binding buffer. Cells were resuspended in 1× binding buffer at 1–5×10⁶/mL. Fluorochrome-conjugated annexin V (5 μL) was added to 100 μL cell suspension. Cells were incubated for 10–15 min at room temperature. Cells were washed in 1× binding buffer and resuspended in 200 μL of 1× binding buffer. The 7-AAD Viability Staining Solution (5 μL) was added, and the cells were analyzed by flow cytometry. All analyses were carried out in triplicate.
Western blot analysis
After 72 h of transfection, the total protein of the abovementioned experimental group was extracted, quantified by Bradford method, and 20 μL was added to each sample (protein amount 30 μg). Protein samples were separated with 12% sodium dodecyl sulfate polyacrylamide gel electrophoresis and transferred onto nitrocellulose membranes. Membranes were incubated with primary antibodies overnight at 4°C. Membranes were washed and incubated for 2 h with horseradish peroxidase-conjugated antirabbit secondary antibodies (ProSci, Poway, CA, USA), followed by detection and visualization using electrochemiluminescence Western blotting detection reagents (Pierce antibodies; Thermo Fisher Scientific). The primary antibodies used were anti-NF-κB1 (Abcam, Tokyo, Japan) and anti-Bcl-2 (Abcam).
Statistical methods
The data were analyzed using the SPSS 17.0 statistical software (SPSS Inc., Chicago, IL, USA). Data were expressed as mean ± standard deviation (χ ± s). Statistical significance of the two means was analyzed by single factor analysis of variance (ANOVA) and least square difference (LSD) t-test. P<0.05 was considered statistically significant.
Results
NF-κB1 and Bcl-2 were highly expressed in glioma, and the expression trend was consistent
To assess NF-κB1 and Bcl-2 expressions in noncancerous brain tissues and in different grades of glioma, we detected mRNA expression levels of NF-κB1 and Bcl-2 in six nonneoplastic brain tissues and in 31 human glioma tissue samples. qRT-PCR results revealed that the expression of NF-κB1 and Bcl-2 in the tissue specimens of five groups was statistically significant (P<0.05; Figure 1A and B). Data showed that the expression of NF-κB1 in glioma was significantly higher than that in nonneoplastic brain tissues (P<0.01; Figure 1A), and the expression of NF-κB1 in I, II, III, and IV grades of glioma was gradually increased; the difference was statistically significant (P<0.05; Figure 1A). At the same time, Bcl-2 expression in the same brain glioma specimens was significantly higher than that of the nontumor brain tissues (P<0.01; Figure 1B), and the expression of Bcl-2 in I, II, III, and IV grades of glioma was gradually increased; the difference was statistically significant (P<0.05; Figure 1B). In addition, we found that the expression of NF-κB1 in glioma cell lines, U87 and SHG44, was higher compared to noncancerous brain tissues (P<0.01; Figure 1C). Therefore, the expression trend of NF-κB1 and Bcl-2 in the same glioma specimens was consistent.
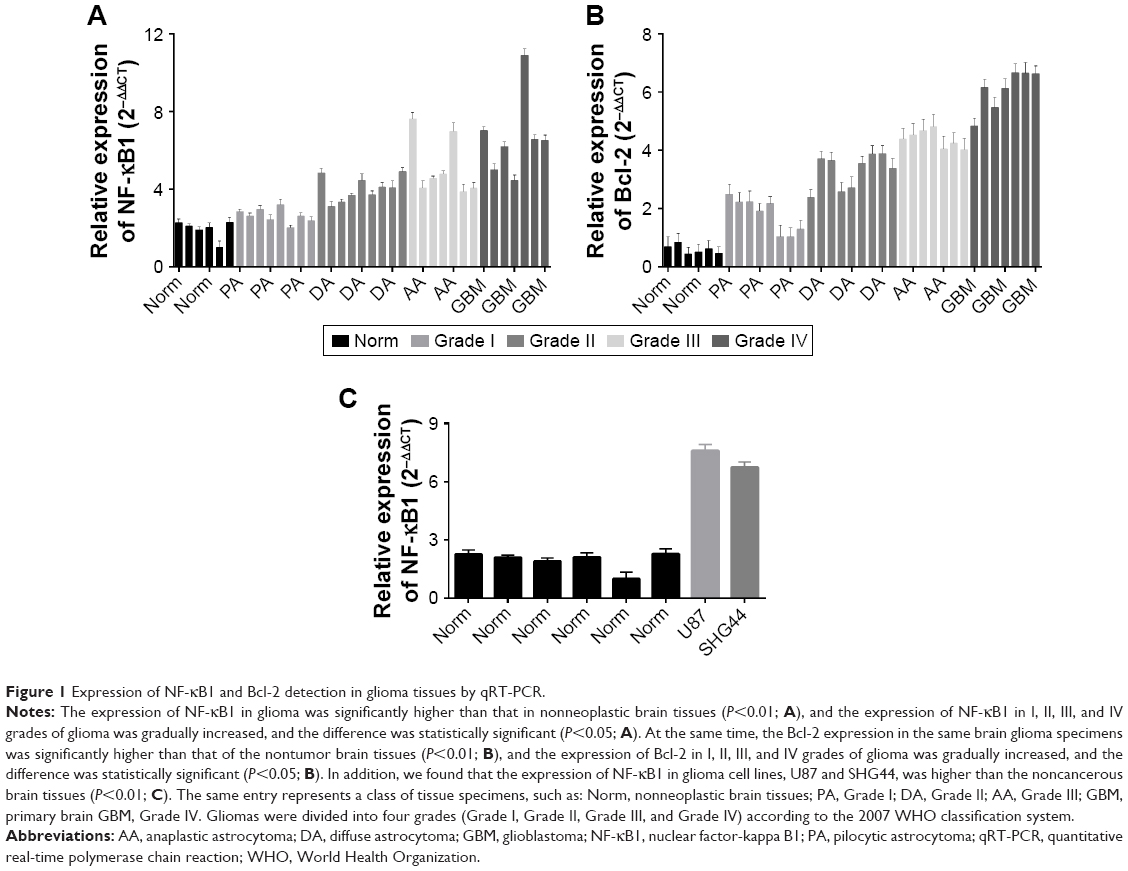 | Figure 1 Expression of NF-κB1 and Bcl-2 detection in glioma tissues by qRT-PCR. |
NF-κB1 inhibits early apoptosis of glioma cells
The experiment was divided into blank group (mock), no-load plasmid group (negative), and NF-κB1 shRNA plasmid group (NF-κB1 shRNA). NF-κB1 shRNA plasmids were transfected into glioma cell lines (U87 and SHG44). The cells were collected from each group at 24, 48, and 72 h after transfection. The experimental procedure was performed and detected the proportion of cells in early-stage apoptosis by flow cytometry (Figure 2A–F). Results showed that the apoptotic rate of glioma cell lines (U87 and SHG44) was significantly increased after silencing of NF-κB1 expression compared to blank and no-load plasmid groups. The difference was statistically significant (P<0.01; Figure 3A and B).
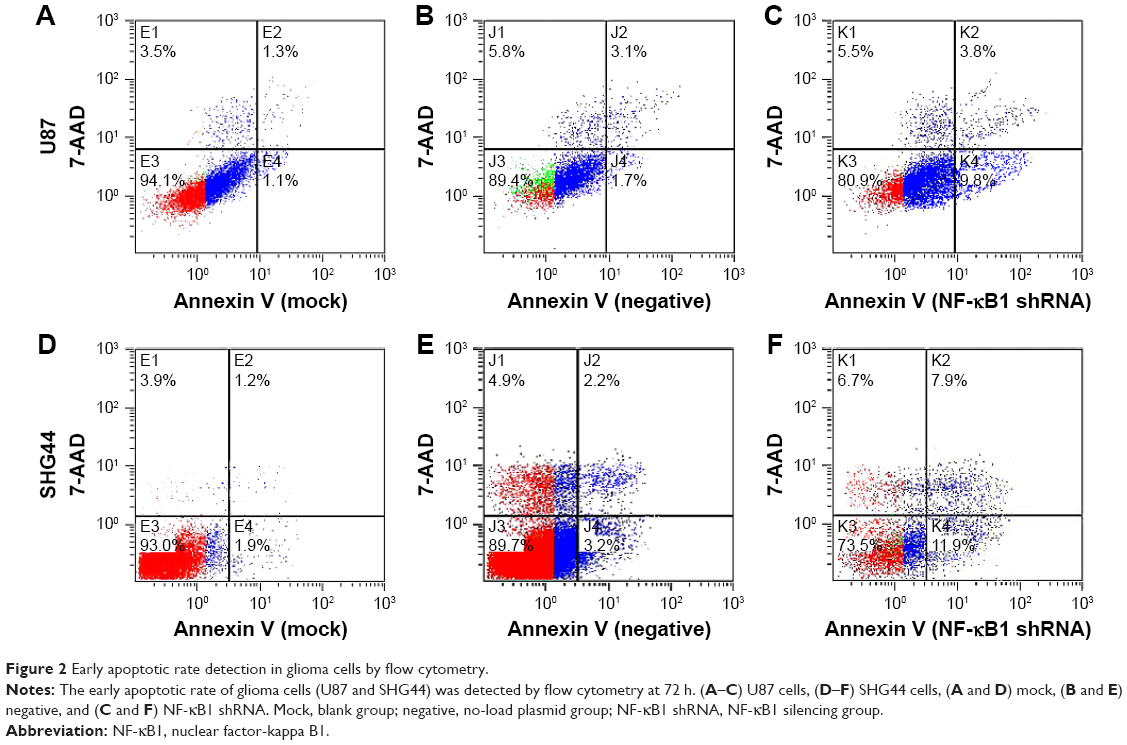 | Figure 2 Early apoptotic rate detection in glioma cells by flow cytometry. |
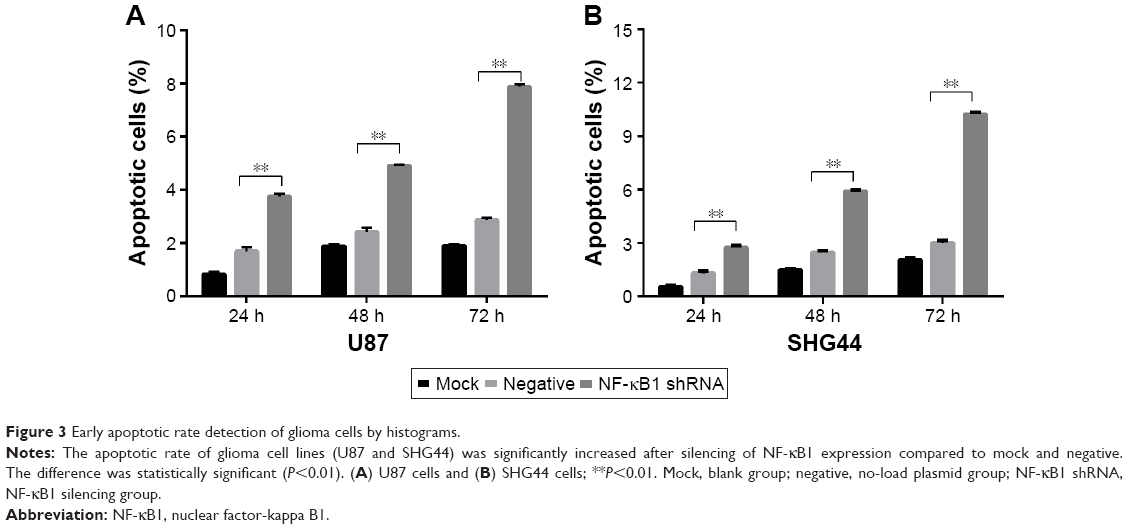 | Figure 3 Early apoptotic rate detection of glioma cells by histograms. |
NF-κB1 affects the expression of Bcl-2 mRNA
The relative expression levels of NF-κB1 and Bcl-2 mRNA in each group (blank control group, no-load plasmid group, NF-κB1 overexpression group, NF-κB1 silencing group, and BCL2 silencing group) were analyzed by qRT-PCR. The relative quantitative analysis of NF-κB1 mRNA expression showed that compared to the blank and no-load plasmid groups 2−ΔΔCt value, NF-κB1 shRNA plasmid group 2−ΔΔCt value was significantly decreased and the difference was statistically significant (compared with the blank group and no-load plasmid group, the expression of Bcl-2 in U87 and SHG44, P<0.05; Table 1). In addition, the expression of NF-κB1 mRNA showed no increase after silencing the expression of Bcl-2 and no statistical significance was observed (compared with the blank group and no-load plasmid group, the expression of NF-κB1 in U87 and SHG44, P>0.05; Table 1). The relative quantitative analysis of Bcl-2 mRNA expression showed that the expression of Bcl-2 mRNA was significantly decreased after silencing NF-κB1 gene expression compared to blank and no-load plasmid groups, and the difference was statistically significant (compared with the blank group and no-load plasmid group, the expression of Bcl-2 in U87 and SHG44, P<0.05; Table 1). On the contrary, the expression of Bcl-2 mRNA was increased after overexpression of NF-κB1, and the difference was statistically significant (compared with the blank group and no-load plasmid group, the expression of Bcl-2 in U87 and SHG44, P<0.05; Table 1).
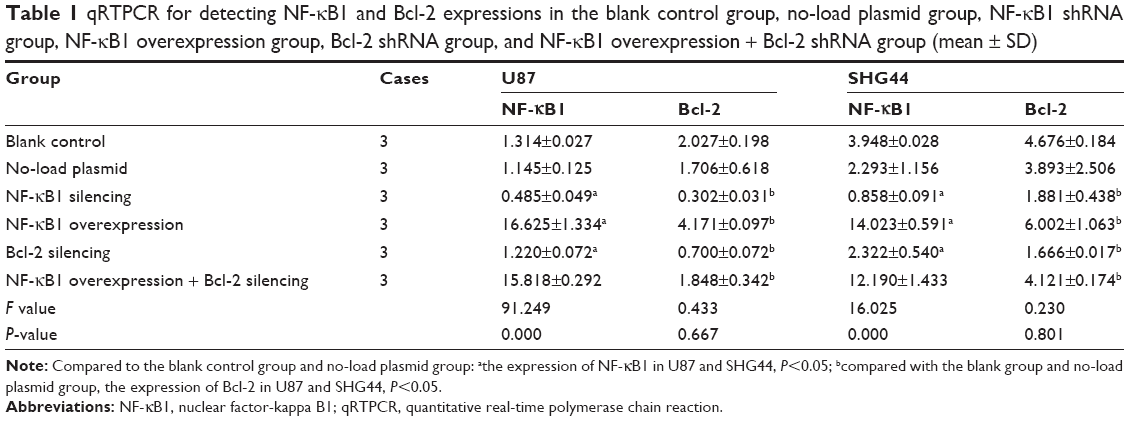 | Table 1 qRTPCR for detecting NF-κB1 and Bcl-2 expressions in the blank control group, no-load plasmid group, NF-κB1 shRNA group, NF-κB1 overexpression group, Bcl-2 shRNA group, and NF-κB1 overexpression + Bcl-2 shRNA group (mean ± SD) |
qRT-PCR was performed to evaluate the mRNA levels of blank group, no-load plasmid group, and NF-κB1 overexpression + Bcl-2 shRNA plasmid groups. Results showed that compared to blank and no-load plasmid groups, the expression of Bcl-2 mRNA was not significantly reduced after NF-κB1 overexpression and silencing of Bcl-2 expression, and the difference was not statistically significant (compared with the blank group and no-load plasmid group, the expression of Bcl-2 in U87 and SHG44, P>0.05; Table 1). These results confirmed that NF-κB1 affected the expression of Bcl-2 mRNA.
NF-κB1 affects the expression of Bcl-2 protein
After 72 h of transfection, the total protein was extracted from each group (blank control group, no-load plasmid group, NF-κB1 silencing group, NF-κB1 overexpression group, Bcl-2 silencing group, and NF-κB1 overexpression + Bcl-2 silencing group). The expression levels of NF-κB1 and Bcl-2 proteins were analyzed by Western blotting (Figure 4) and the gray value (Figure 5). Results showed that the expression of NF-κB1 and Bcl-2 proteins in NF-κB1 shRNA plasmid group was significantly decreased compared to the blank group and no-load plasmid group (Figure 4A and B), and the difference was statistically significant (P<0.01; Figure 5A and B). The expression of NF-κB1 and Bcl-2 proteins was increased significantly in NF-κB1 overexpression plasmid group (Figure 4C and D), and the difference was statistically significant (P<0.05; Figure 5C and D). The expression of Bcl-2 protein was not significantly reduced in NF-κB1 overexpression + Bcl-2 silencing group (Figure 4E and F), and the difference was not statistically significant (P>0.05; Figure 5E and F). In addition, the expression of NF-κB1 protein was not significantly increased after silencing of Bcl-2 gene expression (Figure 4C and D), and the difference was not statistically significant (P>0.05; Figure 5C and D).
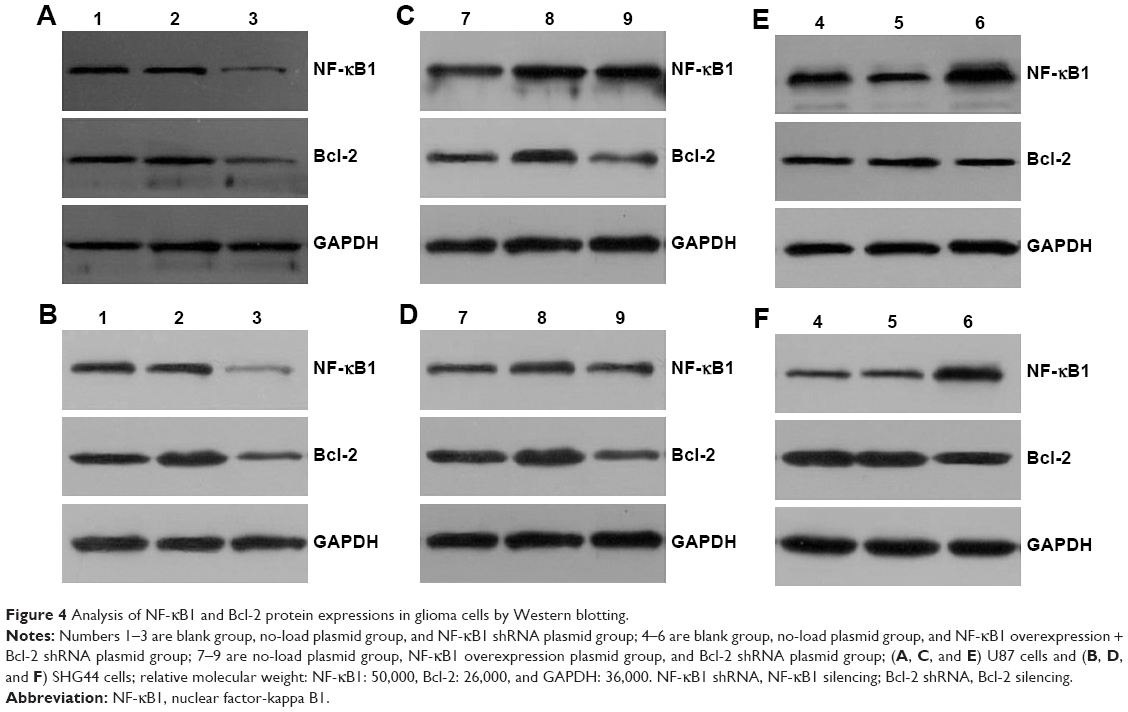 | Figure 4 Analysis of NF-κB1 and Bcl-2 protein expressions in glioma cells by Western blotting. |
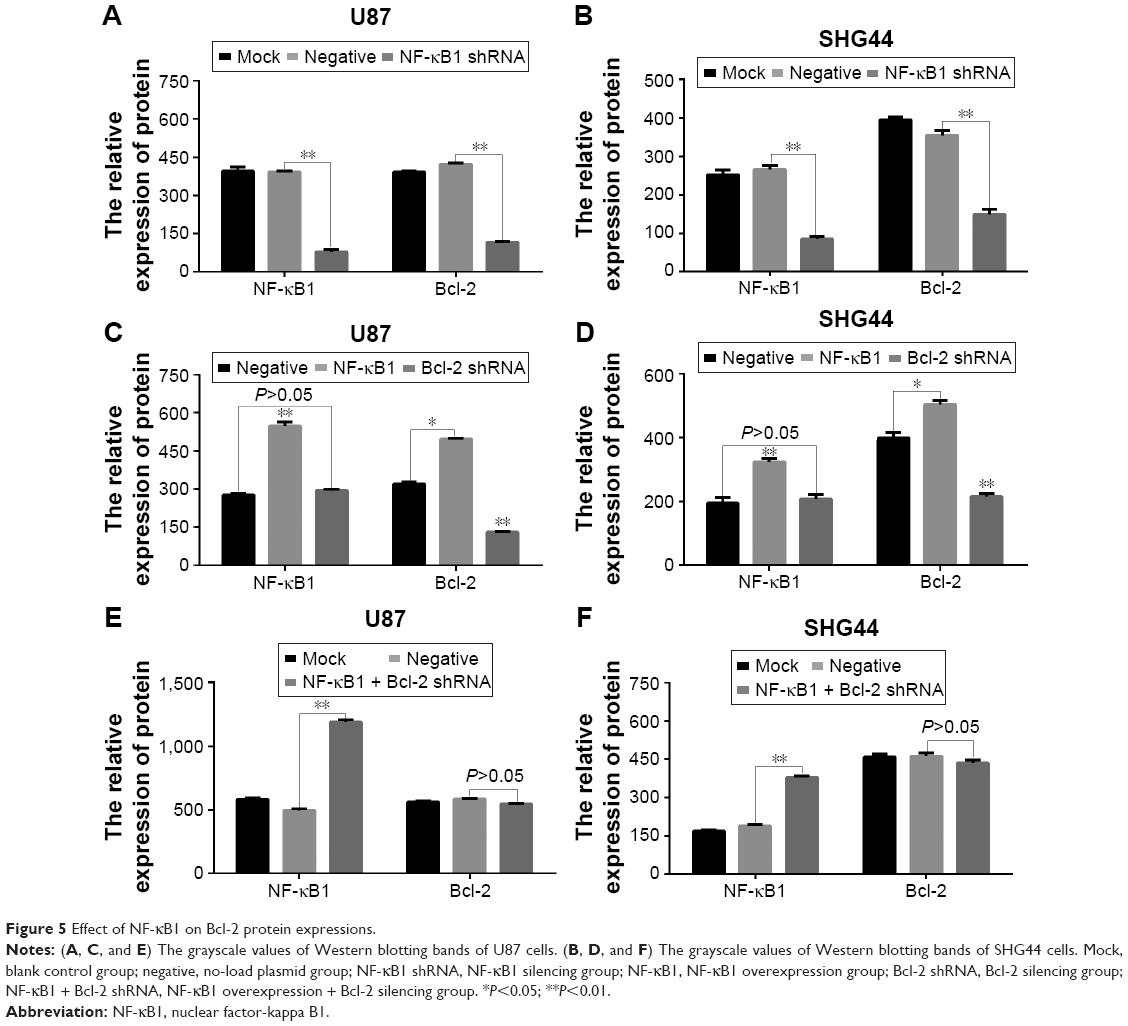 | Figure 5 Effect of NF-κB1 on Bcl-2 protein expressions. |
Discussion
NF-κB1 gene is located on human chromosome 4q24 and is a key transcription factor of the NF-κB signaling pathway. In recent years, NF-κB1 has been shown to be involved in a variety of malignancies and is widely expressed in several types of malignant tumors.13,14 Previous studies have shown that NF-κB1 can promote invasion of glioma cell lines by MMP9.12 However, the correlation between NF-κB1 and Bcl-2 expressions in gliomas and the underlying mechanism between NF-κB1 and early apoptosis of glioma cells have not been reported so far.
Glioma is one of the most common types of adult primary brain tumors.15 The unrestricted growth of tumors is not only due to abnormal cell differentiation and proliferation but is also closely associated with inhibition of cell apoptosis. Therefore, early apoptosis of glioma cells is of great significance. NF-κB1 acts as a DNA-binding subunit in NF-κB complex.16 After being stimulated by cytokines, such as TNF-α or DNA damage, the activated NF-κB then enters the nucleus and initiates the expression of downstream target genes, thereby activating a series of cellular responses.17 The study has reported that NF-κB pathway can enhance the expression of manganese superoxide dismutase to remove reactive oxygen species and thus induces cell apoptosis.18 In addition, NF-κB can also inhibit cell apoptosis by negatively regulating the activation of c-Jun N-terminal kinase which is also known as stress-activated protein kinase and is a mitogen-activated protein kinase signaling pathway of another subclass.19 Finally, NF-κB can activate Akt and promote cell survival and proliferation by downregulating the expression of phosphatase and tensin homolog deleted on chromosome ten.20 This study attempts to identify the expression of NF-κB1 in glioma cells. We found that NF-κB1 was highly expressed in most of the glioma cells, especially in high-grade glioma cells. Preliminary experiment results revealed that the expression of NF-κB1 in human glioma was significantly higher than that in normal brain tissues, and the expression of NF-κB1 in I, II, III, and IV grades of glioma was increased gradually; the difference was statistically significant. In this study, we found that the early apoptotic rate of U87 and SHG44 cells was significantly increased after NF-κB1 shRNA transfection. It was found that the expression level of NF-κB1 was related to the early apoptosis of glioma cells.
Antiapoptotic gene Bcl-2 plays a crucial role in carcinogenesis. It exists in mitochondria and has antiapoptotic protein effect.21 Bcl-2 is different from the general oncogene and tumor suppressor genes. The apoptotic gene controls cell survival and does not affect cell proliferation.22 The antiapoptotic mechanisms of Bcl-2 include inhibition of ion channel opening that is activated by IP3R, which thereby inhibits the release of Ca2+ from the endoplasmic reticulum and produces antiapoptotic effect.23 The coexpression of Bcl-2 and P53 genes could delay the role of P53 gene-induced apoptosis. Meanwhile, the synergistic effect of Bcl-2 and c-myc could block the entry of P53 gene into the nucleus, thus blocking the effect of P53 on apoptosis and growth arrest.24 In addition, Bcl-2 can inhibit apoptosis by participating in signal transmission.25 Few studies have demonstrated a close association of Bcl-2 in glioma development.26,27 The results of this study showed that Bcl-2 expression in human glioma specimens was significantly higher than normal brain tissues, and the expression of Bcl-2 in I, II, III, and IV grades of glioma was increased gradually; the difference was statistically significant. Hussein et al28 demonstrated that the expression of Bcl-2 protein was increased gradually with the increasing malignancy of human gliomas, and our study results were consistent with these. It was found that the expression trend of Bcl-2 and NF-κB1 was similar in the same glioma specimens, which indicated that NF-κB1 was closely related with Bcl-2. In vitro experiments revealed that silencing of NF-κB1 expression could inhibit the expression of Bcl-2, while overexpression of NF-κB1 could promote the expression of Bcl-2. Furthermore, overexpression of NF-κB1 silenced the expression of Bcl-2 by salvage strategy of the experiment. Results showed that the expression level of Bcl-2 was not significantly decreased. These data suggest that NF-κB1 can promote the expression of Bcl-2.
Conclusion
NF-κB1 overexpression can inhibit the early apoptosis of glioma cells, and high expression of NF-κB1 can promote the expression of antiapoptotic gene Bcl-2, which is closely related to each other. In glioma cells, antiapoptotic mechanism of NF-κB1 may be achieved by promoting Bcl-2 expression and provides a theoretical basis for studying the antiapoptotic mechanism of tumor cells in association with NF-κB1.
Acknowledgments
We thank our central laboratory for providing technical instruction and assistance. This work was partly supported by the Fund Projects: National Natural Science Foundation of China (NSFC 81372689), the Jiangsu Province Health and Family Planning Commission (Q201606), and the Suzhou City Health Bureau Science and Education project (kjxw2016020).
Disclosure
The authors report no conflicts of interest in this work.
References
Furnari FB, Fenton T, Bachoo RM, et al. Malignant astrocytic glioma: genetics, biology, and paths to treatment. Genes Dev. 2007;21(21):2683–2710. | ||
Tang SL, Gao YL, Hu WZ. PAQR3 inhibits the proliferation, migration and invasion in human glioma cells. Biomed Pharmacother. 2017;18(92):24–32. | ||
Chen B, Lei Y, Wang H, et al. Repression of the expression of TET2 by ZEB1 contributes to invasion and growth in glioma cells. Mol Med Rep. 2017;15(5):2625–2632. | ||
Bao Z, Xu X, Liu Y, et al. CBX7 negatively regulates migration and invasion in glioma via Wnt/β-catenin pathway inactivation. Oncotarget. 2017;5(28):1–16. | ||
Gabriely G, Wurdinger T, Kesari S, et al. MicroRNA 21 promotes glioma invasion by targeting matrix metalloproteinase regulators. Mol Cell Biol. 2008;28(17):5369–5380. | ||
Mao K, You C, Lei D, Zhang H. Potential regulation of glioma through the induction of apoptosis signaling via Egl-9 family hypoxia-inducible factor 3. Oncol Lett. 2017;13(2):893–897. | ||
Sato A, Mizobuchi Y, Nakajima K, et al. Blocking COX-2 induces apoptosis and inhibits cell proliferation via the Akt/survivin- and Akt/ID3 pathway in low-grade-glioma. J Neurooncol. 2017;132(2):231–238. | ||
Shuang T, Wang M, Zhou Y, Shi C, Wang D. NF-κB1, c-Rel, and ELK1 inhibit miR-134 expression leading to TAB1 upregulation in paclitaxel-resistant human ovarian cancer. Oncotarget. 2017;8(15):24853–24868. | ||
Wang X, Peng H, Liang Y, et al. A functional insertion/deletion polymorphism in the promoter region of the NFKB1 gene increases the risk of papillary thyroid carcinoma. Genet Test Mol Biomarkers. 2015;19(3):167–171. | ||
Lin SC, Liu CJ, Yeh WI, Lui MT, Chang KW, Chang CS. Functional polymorphism in NFKB1 promoter is related to the risks of oral squamous cell carcinoma occurring on older male areca (betel) chewers. Cancer Lett. 2006;243(1):47–54. | ||
Mohd Suzairi MS, Tan SC, Ahmad Aizat AA, et al. The functional-94 insertion/deletion ATTG polymorphism in the promoter region of NFKB1 gene increases the risk of sporadic colorectal cancer. Cancer Epidemiol. 2013;7(5):634–638. | ||
Yang TQ, Lu XJ, Wu TF, et al. MicroRNA-16 inhibits glioma cell growth and invasion through suppression of BCL2 and the nuclear factor-κB1/MMP9 signaling pathway. Cancer Sci. 2014;105(3):265–271. | ||
Shuang T, Wang M, Zhou Y, Shi C. Over-expression of nuclear NF-κB1 and c-Rel correlates with chemoresistance and prognosis of serous epithelial ovarian cancer. Exp Mol Pathol. 2016;100(1):139–144. | ||
Kravtsova-Ivantsiv Y, Shomer I, Cohen-Kaplan V, et al. KPC1-mediated ubiquitination and proteasomal processing of NF-κB1 p105 to p50 restricts tumor growth. Cell. 2015;161(2):333–347. | ||
Wiese M, Walther N, Diederichs C, et al. The β-catenin/CBP-antagonist ICG-001 inhibits pediatric glioma tumorigenicity in a Wnt-independent manner. Oncotarget. 2017;8(16):27300–27313. | ||
Jacque E, Schweighoffer E, Visekruna A, et al. IKK-induced NF-κB1 p105 proteolysis is critical for B cell antibody responses to T cell-dependent antigen. J Exp Med. 2014;211(10):2085–2101. | ||
Huang H, Ma L, Li J, et al. NF-κB1 inhibits c-Myc protein degradation through suppression of FBW7 expression. Oncotarget. 2014;5(2):493–505. | ||
Hussain AR, Ahmed SO, Ahmed M, et al. Cross-talk between NFkB and the PI3-kinase/AKT pathway can be targeted in primary effusion lymphoma (PEL) cell lines for efficient apoptosis. PLoS One. 2012;7(6):1–12. | ||
Xuan Y, Chi L, Tian H, et al. The activation of the NF-κB-JNK pathway is independent of the PI3K-Rac1-JNK pathway involved in the bFGF-regulated human fibroblast cell migration. J Dermatol Sci. 2016;82(1):28–37. | ||
Ma J, Liu J, Wang Z, et al. NF-kappaB-dependent microRNA-425 upregulation promotes gastric cancer cell growth by targeting PTEN upon IL-1β induction. Mol Cancer. 2014;26(13):1–11. | ||
Wang JH, Bi XW, Li PF, et al. Overexpression of MYC and BCL2 predicts poor prognosis in patients with extranodal NK/T-cell lymphoma, nasal type. J Cancer. 2017;8(5):793–800. | ||
Conti A, Majorini MT, Fontanella E, et al. Lemur tyrosine kinase 2 (LMTK2) is a determinant of cell sensitivity to apoptosis by regulating the levels of the BCL2 family members. Cancer Lett. 2017;28(389):59–69. | ||
Singh K, Briggs JM. Functional implications of the spectrum of BCL2 mutations in lymphoma. Mutat Res Rev Mutat Res. 2016;6(16):1–18. | ||
Patel JH, McMahon SB. BCL2 is a downstream effector of MIZ-1 essential for blocking c-MYC-induced apoptosis. J Biol Chem. 2007;282(1):5–13. | ||
Song W, Song C, Chen Y, et al. Polysaccharide-induced apoptosis in H22 cells through G2/M arrest and BCL2/BAX caspase-activated Fas pathway. Cell Mol Biol (Noisy-le-grand). 2015;61(7):88–95. | ||
Harmalkar M, Upraity S, Kazi S, Shirsat NV. Tamoxifen-induced cell death of malignant glioma cells is brought about by oxidative-stress-mediated alterations in the expression of BCL2 family members and is enhanced on miR-21 inhibition. J Mol Neurosci. 2015;57(2):197–202. | ||
Li W, Qian C, Wang L, et al. Association of BCL2-938C>A genetic polymorphism with glioma risk in Chinese Han population. Tumour Biol. 2014;35(3):2259–2264. | ||
Hussein MR, El-Ghorori RM, El-Rahman YG. Alterations of p53, BCL-2, and hMSH2 protein expression in the normal brain tissues, gliosis, and gliomas. Int J Exp Pathol. 2006;87(4):297–306. |
 © 2017 The Author(s). This work is published and licensed by Dove Medical Press Limited. The full terms of this license are available at https://www.dovepress.com/terms.php and incorporate the Creative Commons Attribution - Non Commercial (unported, v3.0) License.
By accessing the work you hereby accept the Terms. Non-commercial uses of the work are permitted without any further permission from Dove Medical Press Limited, provided the work is properly attributed. For permission for commercial use of this work, please see paragraphs 4.2 and 5 of our Terms.
© 2017 The Author(s). This work is published and licensed by Dove Medical Press Limited. The full terms of this license are available at https://www.dovepress.com/terms.php and incorporate the Creative Commons Attribution - Non Commercial (unported, v3.0) License.
By accessing the work you hereby accept the Terms. Non-commercial uses of the work are permitted without any further permission from Dove Medical Press Limited, provided the work is properly attributed. For permission for commercial use of this work, please see paragraphs 4.2 and 5 of our Terms.