")
Back to Journals » Neuropsychiatric Disease and Treatment » Volume 13
Novel urinary metabolite signature for diagnosing postpartum depression
Received 20 February 2017
Accepted for publication 18 April 2017
Published 10 May 2017 Volume 2017:13 Pages 1263—1270
DOI https://doi.org/10.2147/NDT.S135190
Checked for plagiarism Yes
Review by Single anonymous peer review
Peer reviewer comments 2
Editor who approved publication: Professor Wai Kwong Tang
Lin Lin, Xiao-mei Chen, Rong-hua Liu
Department of Obstetrics and Gynecology, Linyi People’s Hospital, Shandong, People’s Republic of China
Background: Postpartum depression (PPD) could affect ~10% of women and impair the quality of mother–infant interactions. Currently, there are no objective methods to diagnose PPD. Therefore, this study was conducted to identify potential biomarkers for diagnosing PPD.
Materials and methods: Morning urine samples of PPD subjects, postpartum women without depression (PPWD) and healthy controls (HCs) were collected. The gas chromatography-mass spectroscopy (GC-MS)-based urinary metabolomic approach was performed to characterize the urinary metabolic profiling. The orthogonal partial least-squares-discriminant analysis (OPLS-DA) was used to identify the differential metabolites. The logistic regression analysis and Bayesian information criterion rule were further used to identify the potential biomarker panel. The receiver operating characteristic curve analysis was conducted to evaluate the diagnostic performance of the identified potential biomarker panel.
Results: Totally, 73 PPD subjects, 73 PPWD and 74 HCs were included, and 68 metabolites were identified using GC-MS. The OPLS-DA model showed that there were 22 differential metabolites (14 upregulated and 8 downregulated) responsible for separating PPD subjects from HCs and PPWD. Meanwhile, a panel of five potential biomarkers – formate, succinate, 1-methylhistidine, a-glucose and dimethylamine – was identified. This panel could effectively distinguish PPD subjects from HCs and PPWD with an area under the curve (AUC) curve of 0.948 in the training set and 0.944 in the testing set.
Conclusion: These results demonstrated that the potential biomarker panel could aid in the future development of an objective diagnostic method for PPD.
Keywords: postpartum depression, gas chromatography-mass spectroscopy, biomarker, metabolomics
Introduction
Major depressive disorder (MDD) affects ~15% of the population and is a source of substantial financial burden on society and individuals.1 The mechanisms associated with the pathogenesis of MDD have yet to be completely understood, and the current treatments remain ineffective in a large subset of patients.2,3 To date, the most consistent findings across studies about MDD might be the disproportionate prevalence in women.4 Women are more vulnerable to experience MDD during periods of marked hormonal fluctuations, especially during pregnancy and the postpartum. The interactions between gonadal and stress hormones might play an important role in predisposing women to MDD.5
Antenatal depression means the depression that starts during the pregnancy, and the postpartum depression (PPD) means the depression that starts after birth. The greatest risk factor for PPD is depression prior to pregnancy, but ~40% of women with PPD have the first episode of depression after birth.6 A review reported that there was moderate evidence that PPD could affect the mother–infant interaction patterns, which in turn might contribute to a disturbed neurobiological development of her child.7 Meanwhile, Murray et al8 found that the impairments in mother–infant interactions were related to adverse child outcomes. Previous studies reported that the prevalence of PPD worldwide was estimated to range from 3% to 19%.9,10 However, there are still no objective methods to diagnose PPD. Using the new Diagnostic and Statistical Manual of Mental Disorders (DSM-5) to diagnose PPD is very time-consuming and always results in a considerable error rate.11 Moreover, the DSM-5 criteria could encompass only the first f4 weeks postpartum, but the greatest incidence of new PPD always occurs 2–3 months after parturition.10,12 Given these facts, it is urgently needed to develop an objective method to diagnose PPD.
Currently, metabolomics and other methods have been developed to identify the potential biomarkers for neuropsychiatric disorders,13,14 including depression, bipolar disorder and schizophrenia.15–17 Through metabolomics, previous studies found that there were urinary metabolic abnormalities in patients with MDD.15,18 Therefore, there might also be divergent urinary metabolic phenotypes between PPD subjects and healthy controls (HCs), and the differential metabolites might be biologically correlated with depression in postpartum women and could be used to develop an objective method for diagnosing PPD. In this study, gas chromatography-mass spectroscopy (GC-MS), one of the main analytical techniques for nontargeted metabolomics mapping, was used to profile 45 PPD subjects, 43 postpartum women without depression (PPWD) and 40 HCs to determine whether this method could effectively separate PPD subjects from PPWD and HCs, and the differential metabolites were further analyzed to identify a potential biomarker panel for diagnosing PPD. Meanwhile, we used 28 PPD subjects, 30 PPWD and 34 HCs to independently validate the diagnostic performance of the identified potential biomarker panel.
Materials and methods
Recruiting subjects
This study was reviewed and approved by the Ethical Committee of Linyi People’s Hospital. The included PPD subjects met the DSM-IV criteria for depression, and the 17-item Hamilton Depression Rating Scale (HDRS) was used to measure the severity of depression. Two experienced psychiatrists were in charge of recruiting PPD subjects and PPWD by systematically interviewing. Postpartum women with an HDRS score of >8 were included into the PPD group, and PPWD were included into the PPWD group. All recruited postpartum women were from the Department of Obstetrics and Gynecology of Linyi People’s Hospital. Meanwhile, the HCs were recruited from the Medical Examination Center of Linyi People’s Hospital. The PPD subjects had no pre-existing physical diseases, psychiatric comorbidities or other mental disorders. The HCs and PPWD had no systemic medical illness, neurological disease and current or previous lifetime history of DSM-IV Axis I/Axis II disorder. All the recruited subjects provided written informed consent. We recruited only women 8–12 weeks postpartum. Finally, 73 PPD subjects, 73 PPWD and 74 HCs were included.
GC-MS acquisition
Morning urine samples of subjects were collected between 9 am and 10 am using a sterile cup and then quickly transferred into a sterile tube. Urine samples were sent to the laboratory under low-temperature condition for centrifugation (1,500× g ×10 minutes). After centrifugation, the resulting supernatant was immediately divided into equal aliquots and then quickly stored at −80°C for subsequent analysis. The procedure for GC-MS preparation was performed according to the previous study.18 Briefly, 1) the 10 μL internal standard solution (L-leucine-13C6, 0.02 mg/mL) and 15 μL aliquot of urine were mixed and vortexed; 2) into the mixed solution, 15 μL urease was added to degrade the urea (37°C, 60 minutes); 3) the mixture was successively extracted using 240 μL and 80 μL of ice-cold methanol, and the obtained mixture was vortexed for 30 seconds; 4) after centrifugation (4°C, 14,000 rpm and 5 minutes), 224 μL supernatant was transferred to a glass vial for vacuum drying at room temperature, and then 30 μL of methoxyamine (20 mg/mL) was used to derivatize the dried metabolic extract (37°C, 90 minutes); 5) 30 μL of N,O-bis(trimethylsilyl) trifluoroacetamide with 1% trimethylchlorosilane was added into the dried metabolic extract, and then the mixture was heated (70°C, 60 minutes) to obtain trimethylsilyl derivatives; and 6) after derivatization and cooling to room temperature, 1.0 μL derivative was added into the GC-MS system. The GC-MS analysis conditions were injecting 1.0 μL samples at 270°C; solvent delay for 5 minutes; setting appropriate temperature programming (set initial temperature, 85°C; continue it for 5 minutes; increase it to 300°C by 10°C/min; continue 300°C for 5 minutes); interface temperature, 280°C; quadrupole temperature, 150°C; ionization voltage, −70 eV; carrier gas, helium (flow rate, 1.0 mL/min); ion source temperature, 230°C; and full scan was conducted at 50–600 m/z. The quantitative information of urinary metabolites was obtained by mainly referring to the previous study.19
Metabolomic data analysis
The normalized peak area percentages of each identified urinary metabolites were imported into the SIMCA-P software (version 14.0; Umetrics, Umeå, Sweden). The orthogonal partial least-squares-discriminant analysis (OPLS-DA) was used to analyze whether the urinary metabolites could separate PPD subjects from PPWD and HCs.20 There were three parameters (R2X, R2Y and Q2Y) to assess the quality (quantify and predictability) of the built OPLS-DA model. Meanwhile, a 299-iteration permutation test was conducted to rule out the overfitting of the built model; the higher values of the R2 and Q2 in the original model than the values from the test could demonstrate that the built model was valid and robust.21 The variable importance plot (VIP >1 equivalent to a P<0.05) was applied to select the key differential metabolites responsible for discriminating PPD subjects from PPWD and HCs.
Statistical analysis
The logistic regression analysis was used to further analyze these key differential metabolites, and the Bayesian information criterion (BIC) was used to select the optimal metabolites combination.22 The receiver-operating characteristic (ROC) curve analysis was conducted to evaluate the diagnostic performance of the identified optimal metabolites combination in diagnosing PPD subjects. Student’s t-test, nonparametric Mann–Whitney U-test and one-way ANOVA were conducted when appropriate. All these statistical analyses were conducted using SPSS 21.0 (IBM, Armonk, NY, USA). In all comparisons, a P<0.05 was considered statistically significant.
Results
The recruited subjects were randomly segregated into two sets (training set and testing set). The training set was used to identify the potential urinary metabolite biomarkers for PPD, and the testing set was used to independently validate the diagnostic performance of the identified urinary metabolite biomarkers. The age ranged from 24 years to 31 years among the PPD subjects (average age, 27.51±2.17 years), 22 years to 32 years among the PPWD (average age, 26.90±3.13 years) and 21 years to 33 years among the HCs (average age, 27.18±3.67 years). The body mass index (BMI) (8 weeks postpartum) was 22.79±1.98, 23.01±1.83 and 22.61±1.88 in PPD, PPWD and HCs groups, respectively. The full gestation length was 39.26±1.38 weeks, 39.11±1.41 weeks and 39.14±1.27 weeks in PPD, PPWD and HCs groups, respectively. The child’s birth weight was 3.63±0.70 kg, 3.65±0.69 kg and 3.53±0.71 kg in PPD, PPWD and HCs groups, respectively. The three groups were demographically matched. All recruited subjects did not have any mental disorders or pregnancy-related disorders (such as gestational diabetes and pre-eclampsia) before pregnancy. Meanwhile, the PPD subjects did not receive any antidepressants after giving birth. The 33 subjects in the PPD group and 36 subjects in the PPWD group delivered a baby with natural birth. The seven subjects in the PPD group and five subjects in the PPWD group delivered a baby with cesarean section after failing to have a complete natural birth. The remaining subjects among PPD and PPWD groups delivered a baby with cesarean section.
OPLS-DA model
First, the training set (45 PPD subjects, 43 PPWD and 40 HCs) was used to build the OPLS-DA model. The score plots of the built model showed that the PPD subjects were distinguishable from the PPWD and HCs with little overlap. The three parameters (R2X cum =0.39, R2Y cum =0.73, Q2=0.60; Figure 1A) indicated that the built model was positive, implying the significant metabolic differences between PPD subjects and the other subjects (PPWD and HCs). Meanwhile, the results of the permutation test also showed that the built model was valid and positive (Figure 1B). Second, the testing set (28 PPD subjects, 30 PPWD and 34 HCs) was used to independently validate the diagnostic performance of the built model. The T-predicted scatter plot showed that the built model could effectively predict the HCs and PPWD (Figure 2A) and PPD subjects (Figure 2B).
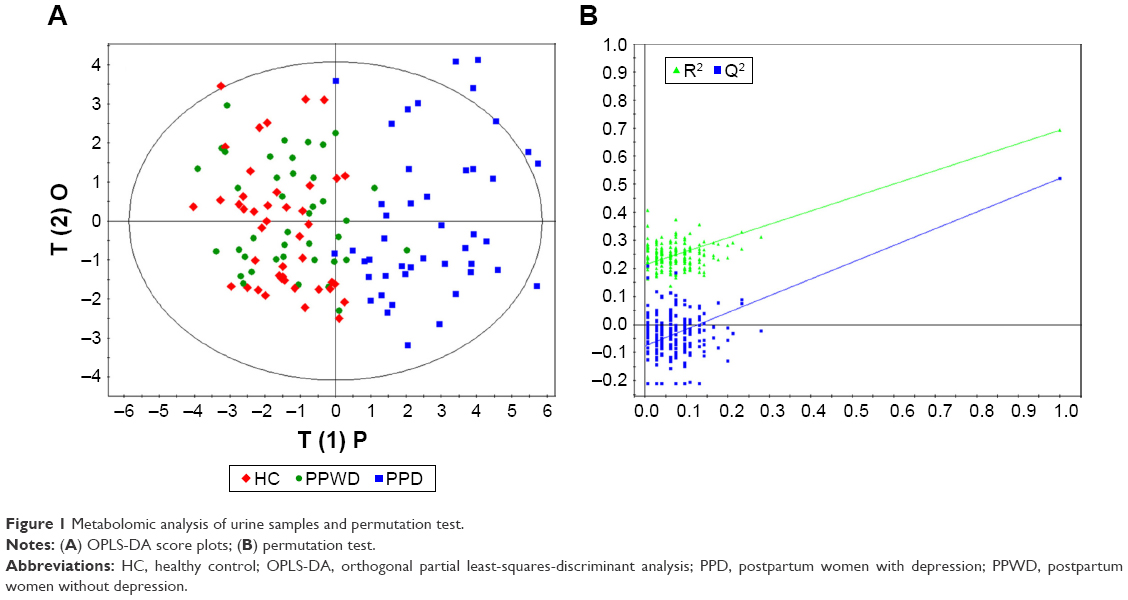 | Figure 1 Metabolomic analysis of urine samples and permutation test. |
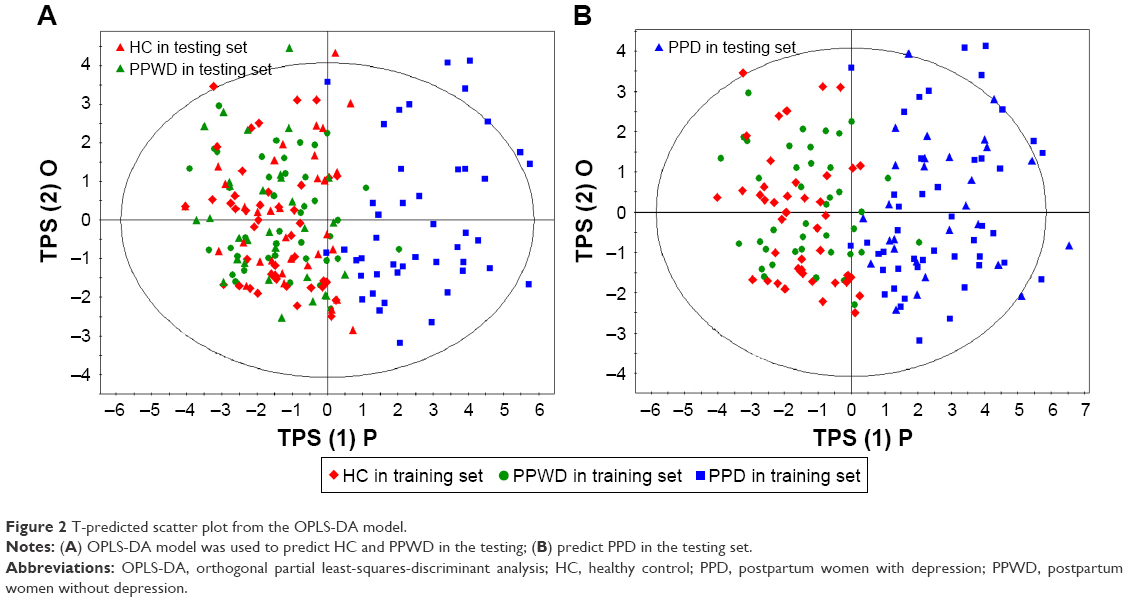 | Figure 2 T-predicted scatter plot from the OPLS-DA model. |
Significant metabolic differences
To identify the metabolites that were responsible (VIP >1.0) for separating PPD subjects from the other subjects, the corresponding OPLS-DA loading plot was analyzed. Totally, there were 68 metabolites used to build the OPLS-DA model, and at last the levels of 22 metabolites were significantly altered in the PPD subjects (Table 1). As compared to the other subjects, the PPD subjects were characterized by the significantly higher levels of formate, succinate, 3-methylhistidine, glutamate, isobutyrate, acetamide, α-ketoglutarate, quinolinic acid, pyroglutamic acid, phenylacetyglycine, hippurate, 1-methylhistidine, valine and m-hydroxyphenylacetate, along with the significantly lower levels of α-hydroxyisobutyrate, N-methylnicotimide, glycolate, acetate, taurine, lactate, α-glucose and dimethylamine. Meanwhile, Mann–Whitney U-test was used to validate the metabolic alteration identified by the OPLS-DA model, and the 17 of 22 metabolites remained significantly changed (Table 1).
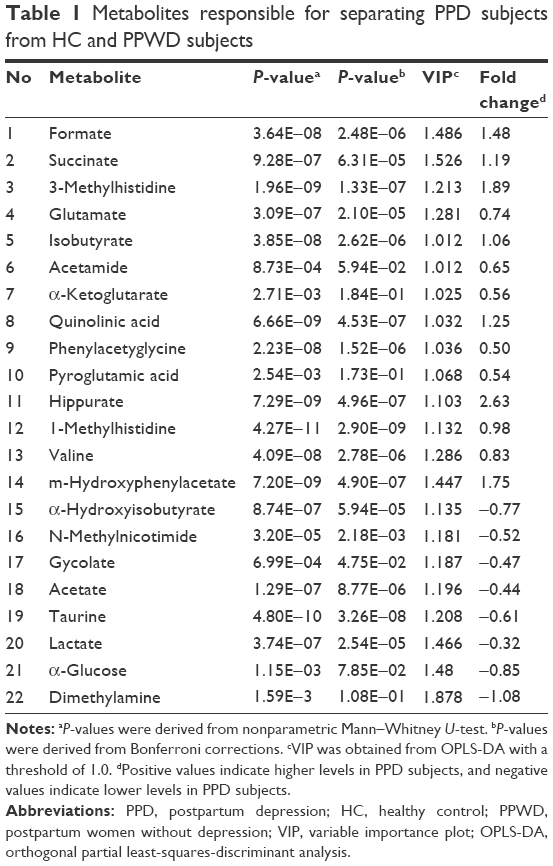 | Table 1 Metabolites responsible for separating PPD subjects from HC and PPWD subjects |
Potential biomarker panel
In clinical practice, it is not economic and convenient to use 22 metabolites to diagnose PPD. Therefore, the logistic regression analysis was performed to further analyze these differential metabolites, and the BIC rule was used to identify the optimal biomarker panel. Finally, the results showed that the most significant deviations between PPD subjects and the other subjects could be described by the following five urinary metabolites: formate, succinate, 1-methylhistidine, α-glucose and dimethylamine (Figure 3). The potential biomarker panel consisting of these five metabolites could yield a sensitivity of 91.1% and a specificity of 90.4% in the training set and a sensitivity of 85.7% and a specificity of 90.5% in the testing set. To assess the diagnostic performance of this panel, the ROC curve analysis was conducted to calculate the area under the curve (AUC) of this panel in both training and testing sets. This analysis showed that the AUC of this panel was 0.948 and 0.944 in the training and testing sets (Figure 4), respectively. These results indicated that the potential biomarker panel consisting of these five metabolites could be viewed as a potential effective classifier of PPD subjects and other subjects (PPWD and HCs).
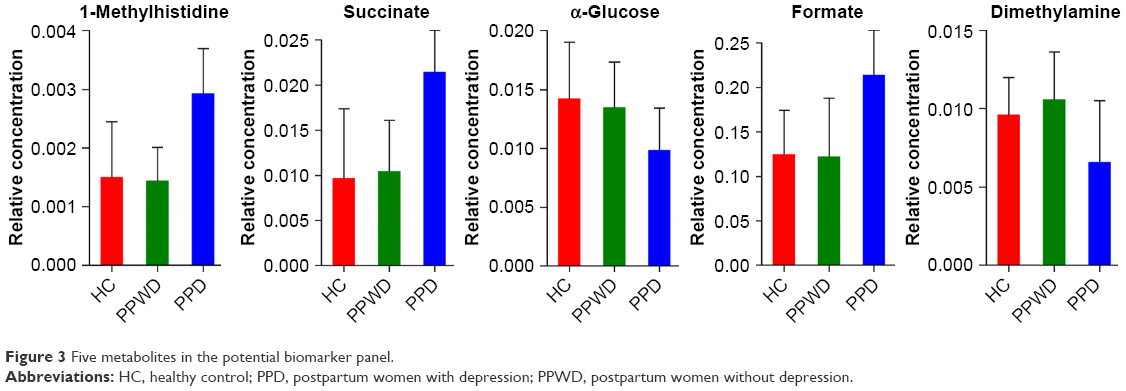 | Figure 3 Five metabolites in the potential biomarker panel. |
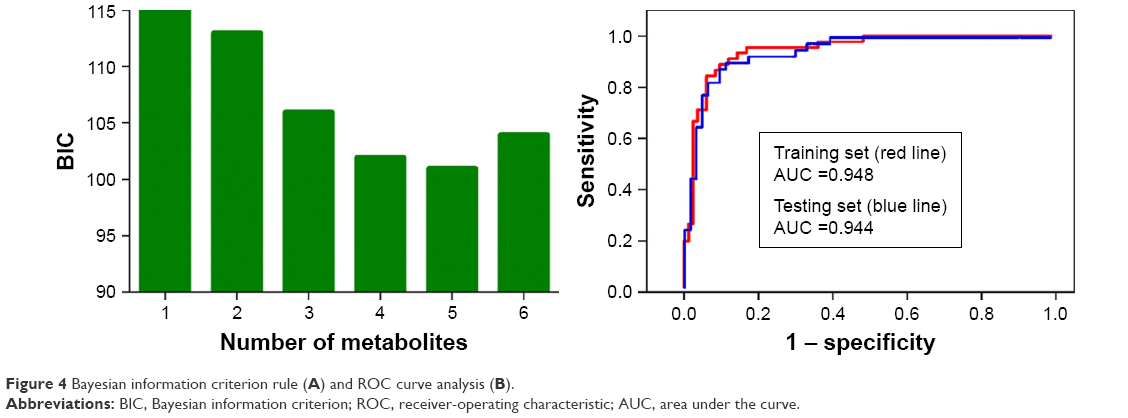 | Figure 4 Bayesian information criterion rule (A) and ROC curve analysis (B). |
Pathway analysis
The online software MetaboAnalyst 3.0 was used to further analyze the biological functions of these differential urinary metabolites.23 The following criteria were applied to select the significantly altered metabolic pathways: P<0.01 and impact >0. Finally, seven metabolic pathways were significantly altered: glyoxylate and dicarboxylate metabolism (P=0.0004; impact =0.1504), D-glutamine and D-glutamate metabolism (P=0.0027; impact =0.3262), phenylalanine metabolism (P=0.0040; impact =0.0315), TAURINE and hypotaurine metabolism (P=0.0093; impact =0.339), pyruvate metabolism (P=0.0015; impact =0.2370), propanoate metabolism (P=0.0019; impact =0.0013) and tricarboxylic acid (TCA) cycle (P=0.0093; impact =0.1002) (Figure 5).
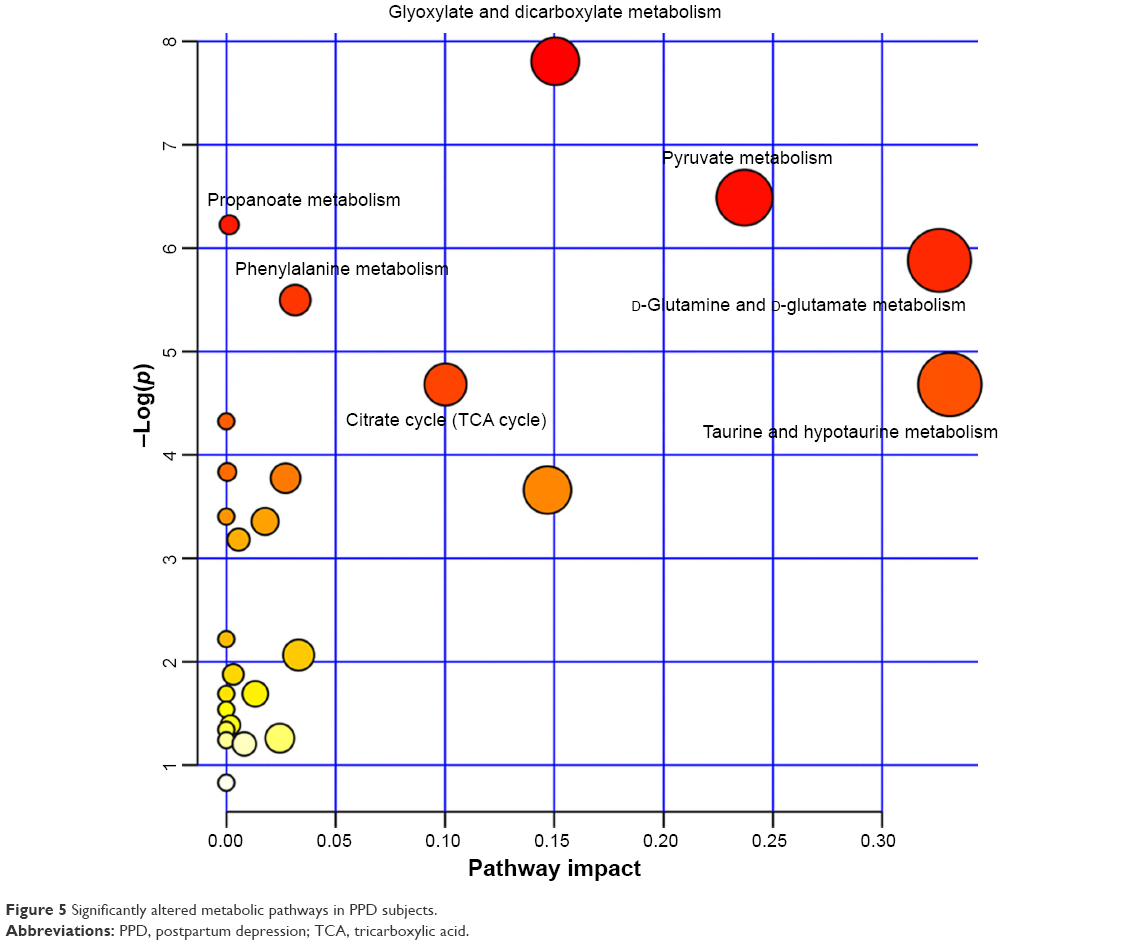 | Figure 5 Significantly altered metabolic pathways in PPD subjects. |
Discussion
Here, the GC-MS-based metabolomic platform was used to study the divergent urinary metabolic phenotypes between PPD subjects and the other subjects (PPWD and HCs). At last, the levels of 22 urinary metabolites in PPD subjects were significantly changed. These differential metabolites could effectively separate the PPD subjects from the PPWD and HCs. Further analysis identified a potential biomarker panel consisting of five potential biomarkers – formate, succinate, 1-methylhistidine, α-glucose and dimethylamine. The diagnostic performance of this panel was similar to the built OPLS-DA model with the 22 differential metabolites. This panel could yield an AUC of 0.948 in the training set and 0.944 in the testing set, which was significantly higher than that of the currently used methods. These results demonstrated that these differential urinary metabolites might be biologically correlated with depression in postpartum women, and the panel could be helpful for future development of an objective diagnostic method for PPD.
The underlying mechanisms of PPD are still unclear. Brummelte and Galea24 reported that the steroid hormones might have a significant role in PPD.24 They thought that the dramatically fluctuated steroid and peptide hormones levels during pregnancy and postpartum might contribute to the etiology of PPD. Glynn et al25 found that the sustained high flattened levels of glucocorticoids was presented in postpartum women. This similar hormonal profile was also observed in depressed patients, which might indicate a possible underlying mechanism of PPD.7 Recently, researchers have paid much attention to the nonapeptide oxytocin for its potential involvement in depression.26 Stuebe et al27 found a lower plasma oxytocin concentration in the last trimester of women at risk of PPD. Besides these findings, an animal study showed that there was disorder and imbalance of metabolites in the brain of rat with PPD.28 In this study, the urinary metabolic disorder in PPD subjects was found, which could provide new insight and original data for investigating the mechanisms of PPD.
Notably, the levels of α-ketoglutarate, pyroglutamic acid, acetamide, α-glucose and dimethylamine were not significantly perturbed in the univariate analysis. However, the built OLPS-DA model still treated these metabolites as key urinary metabolites. Moreover, α-glucose and dimethylamine was identified as potential biomarkers by logistic-regression analysis. This was done because the multivariate analysis showed that the addition of α-glucose and dimethylamine could result in the highest discrimination power. These results demonstrated that the multivariate statistical approach had an advantage than simple univariate analysis in identifying the subtle yet significantly differential metabolites.15,29 Additionally, Zheng et al18 found a potential biomarker panel for diagnosing depression using GC-MS-based metabolomic method. But this panel could only accurately predict 41.1% PPD subjects, which was significantly lower than the prediction accuracy of our panel identified in this study. Two reasons might cause this difference: 1) the panel identified by Zheng et al18 was used to diagnose depression and 2) all included subjects here were women, but the panel identified by Zheng et al18 did not take sex-based differences into consideration, since many studies reported that there were sex differences in depression.30–32
A previous study reported that the levels of some TCA cycle-associated metabolites were significantly perturbed in patients with MDD.33 Here, we found that the TCA cycle was significantly altered in patients with PPD. Hasler et al34 found reduced prefrontal glutamate/glutamine level in depressed patients, which was similar to our findings that the D-glutamine and D-glutamate metabolism was affected in depressed postpartum women. Meanwhile, the other five significantly altered metabolic pathways were associated with psychiatric disorders,16,30,35–37 such as depression and bipolar disorder. Additionally, Dowlati et al38 reported that the dietary supplement of tryptophan and tyrosine in early postpartum could reduce PPD. The abovementioned results showed that the depression could affect the urinary metabolite levels of postpartum women, and these identified metabolic pathways might be potential targets for novel therapeutics for PPD in the future.
Limitations
There were several limitations in this study: 1) the number of recruited subjects here were relatively small; 2) the subjects were recruited from the same place, which might limit the applicability of our conclusions; 3) given that no single analytic method could capture the whole metabolome of a sample,39 future researchers should apply two or more analytic methods to verify and support our results; 4) future studies are needed to find out whether this panel could effectively separate PPD from postpartum women with other neuropsychiatric disorders; 5) the hypothalamic pituitary adrenal axis is intimately linked to the etiology of depression, then cerebrospinal fluid from PPD subjects is needed to ensure that our urinary biomarkers were physiologically relevant to the disease pathogenesis; and 6) the significantly altered metabolic pathways are needed to be further validated.
Conclusion
This study showed that there was a significantly divergent urinary metabolic phenotype in PPD subjects, and the GC-MS-based urinary metabolomics approach had the potential ability to become an objective diagnostic method for diagnosing PPD. Moreover, a potential biomarker panel consisting of formate, succinate, 1-methylhistidine, α-glucose and dimethylamine was identified, which could aid in the future development of an objective diagnostic method for PPD.
Disclosure
The authors report no conflicts of interest in this work.
References
Kessler RC, Berglund P, Demler O, et al; National Comorbidity Survey Replication. The epidemiology of major depressive disorder: results from the National Comorbidity Survey Replication (NCS-R). JAMA. 2003;289(23):3095–3105. | ||
Chen JJ, Zhao LB, Liu YY, Fan SH, Xie P. Comparative efficacy and acceptability of electroconvulsive therapy versus repetitive transcranial magnetic stimulation for major depression: a systematic review and multiple-treatments meta-analysis. Behav Brain Res. 2017;320:30–36. | ||
Eitan R, Lerer B. Nonpharmacological, somatic treatments of depression: electroconvulsive therapy and novel brain stimulation modalities. Dialogues Clin Neurosci. 2006;8(2):241–258. | ||
Leach LS, Christensen H, Mackinnon AJ, Windsor TD, Butterworth P. Gender differences in depression and anxiety across the adult lifespan: the role of psychosocial mediators. Soc Psychiatry Psychiatr Epidemiol. 2008;43(12):983–998. | ||
Solomon MB, Herman JP. Sex differences in psychopathology: of gonads, adrenals and mental illness. Physiol Behav. 2009;97(2):250–258. | ||
Wisner KL, Sit DK, McShea MC, et al. Onset timing, thoughts of self-harm, and diagnoses in postpartum women with screen-positive depression findings. JAMA Psychiatry. 2013;70(5):490–498. | ||
Brummelte S, Galea LA. Postpartum depression: etiology, treatment and consequences for maternal care. Horm Behav. 2016;77:153–166. | ||
Murray L, Cooper P, Fearon P. Parenting difficulties and postnatal depression: implications for primary healthcare assessment and intervention. Community Pract. 2014;87(11):34–38. | ||
Darcy JM, Grzywacz JG, Stephens RL, Leng I, Clinch CR, Arcury TA. Maternal depressive symptomatology: 16-month follow-up of infant and maternal health-related quality of life. J Am Board Fam Med. 2011;24(3):249–257. | ||
O’Hara MW, McCabe JE. Postpartum depression: current status and future directions. Annu Rev Clin Psychol. 2013;9:379–407. | ||
Mitchell AJ, Vaze A, Rao S. Clinical diagnosis of depression in primary care: a meta-analysis. Lancet. 2009;374(9690):609–619. | ||
O’Hara MW. Postpartum depression: what we know. J Clin Psychol. 2009;65(12):1258–1269. | ||
Wang Y, Chen J, Chen L, et al. Urinary peptidomics identifies potential biomarkers for major depressive disorder. Psychiatry Res. 2014;217(1–2):25–33. | ||
Shao WH, Chen JJ, Fan SH, et al. Combined metabolomics and proteomics analysis of major depression in an animal model: perturbed energy metabolism in the chronic mild stressed rat cerebellum. OMICS. 2015;19(7):383–392. | ||
Chen J-J, Zhou C-J, Liu Z, et al. Divergent urinary metabolic phenotypes between major depressive disorder and bipolar disorder identified by a combined GC–MS and NMR spectroscopic metabonomic approach. J Proteome Res. 2015;14(8):3382–3389. | ||
Xu XJ, Zheng P, Ren GP, et al. 2,4-Dihydroxypyrimidine is a potential urinary metabolite biomarker for diagnosing bipolar disorder. Mol Biosyst. 2014;10(4):813–819. | ||
Yang J, Chen T, Sun L, et al. Potential metabolite markers of schizophrenia. Mol Psychiatry. 2013;18(1):67–78. | ||
Zheng P, Chen JJ, Huang T, et al. A novel urinary metabolite signature for diagnosing major depressive disorder. J Proteome Res. 2013;12(12):5904–5911. | ||
Luedemann A, Strassburg K, Erban A, Kopka J. TagFinder for the quantitative analysis of gas chromatography–mass spectrometry (GC-MS)-based metabolite profiling experiments. Bioinformatics. 2008;24(5):732–737. | ||
Slupsky CM, Steed H, Wells TH, et al. Urine metabolite analysis offers potential early diagnosis of ovarian and breast cancers. Clin Cancer Res. 2010;16(23):5835–5841. | ||
Mahadevan S, Shah SL, Marrie TJ, Slupsky CM. Analysis of metabolomic data using support vector machines. Anal Chem. 2008;80(19):7562–7570. | ||
Blangero J, Williams JT, Iturria SJ, Almasy L. Oligogenic model selection using the Bayesian information criterion: linkage analysis of the P300 Cz event-related brain potential. Genet Epidemiol. 1999;17(suppl 1):S67–S72. | ||
Xia J, Mandal R, Sinelnikov IV, Broadhurst D, Wishart DS. MetaboAnalyst 2.0 – a comprehensive server for metabolomic data analysis. Nucleic Acids Res. 2012;40(Web Server issue):W127–W133. | ||
Brummelte S, Galea LA. Depression during pregnancy and postpartum: contribution of stress and ovarian hormones. Prog Neuropsychopharmacol Biol Psychiatry. 2010;34(5):766–776. | ||
Glynn LM, Davis EP, Sandman CA. New insights into the role of perinatal HPA-axis dysregulation in postpartum depression. Neuropeptides. 2013;47(6):363–370. | ||
Kim S, Soeken TA, Cromer SJ, Martinez SR, Hardy LR, Strathearn L. Oxytocin and postpartum depression: delivering on what’s known and what’s not. Brain Res. 2014;1580:219–232. | ||
Stuebe AM, Grewen K, Meltzer-Brody S. Association between maternal mood and oxytocin response to breastfeeding. J Womens Health. 2013;22(4):352–361. | ||
Hou X-J, Tang Q-S, Yang XK, Li XL, Zhang RZ, Wang X. Research of influence of Shenqijieyu prescription on changes of monoamine neurotransmitter and metabolite in rats with postpartum depression. Beijing J Tradit Chin Med. 2013;32(3):182–188. | ||
MacIntyre DA, Jimenez B, Lewintre EJ, et al. Serum metabolome analysis by 1H-NMR reveals differences between chronic lymphocytic leukaemia molecular subgroups. Leukemia. 2010;24(4):788–797. | ||
Zheng P, Chen JJ, Zhou CJ, et al. Identification of sex-specific urinary biomarkers for major depressive disorder by combined application of NMR- and GC-MS-based metabonomics. Transl Psychiatry. 2016;6(11):e955. | ||
Chen JJ, Huang H, Zhao LB, et al. Sex-specific urinary biomarkers for diagnosing bipolar disorder. PLoS One. 2014;9(12):e115221. | ||
Parker G, Fletcher K, Paterson A, Anderson J, Hong M. Gender differences in depression severity and symptoms across depressive sub-types. J Affect Disord. 2014;167:351–357. | ||
Zheng P, Wang Y, Chen L, et al. Identification and validation of urinary metabolite biomarkers for major depressive disorder. Mol Cell Proteomics. 2013;12(1):207–214. | ||
Hasler G, van der Veen JW, Tumonis T, Meyers N, Shen J, Drevets WC. Reduced prefrontal glutamate/glutamine and γ-aminobutyric acid levels in major depression determined using proton magnetic resonance spectroscopy. Arch Gen Psychiatry. 2007;64(2):193–200. | ||
Chen JJ, Liu Z, Fan SH, et al. Combined application of NMR- and GC-MS-based metabonomics yields a superior urinary biomarker panel for bipolar disorder. Sci Rep. 2014;4:5855. | ||
Zheng P, Gao HC, Li Q, et al. Plasma metabonomics as a novel diagnostic approach for major depressive disorder. J Proteome Res. 2012;11(3):1741–1748. | ||
Nasar MA, Subhani TF, Gupta RP, Naseer A, Subhani SS. Uric acid levels in serum in the assessment of some psychiatric disorders in India. J Med Radiol Pathol Surg. 2015;12:1–9. | ||
Dowlati Y, Ravindran AV, Segal ZV, Stewart DE, Steiner M, Meyer JH. Selective dietary supplementation in early postpartum is associated with high resilience against depressed mood. Proc Natl Acad Sci U S A. 2017;114(13):3509–3514. | ||
Williams R, Lenz EM, Wilson AJ, et al. A multi-analytical platform approach to the metabonomic analysis of plasma from normal and Zucker (fa/fa) obese rats. Mol Biosyst. 2006;2(3–4):174–183. |
 © 2017 The Author(s). This work is published and licensed by Dove Medical Press Limited. The full terms of this license are available at https://www.dovepress.com/terms.php and incorporate the Creative Commons Attribution - Non Commercial (unported, v3.0) License.
By accessing the work you hereby accept the Terms. Non-commercial uses of the work are permitted without any further permission from Dove Medical Press Limited, provided the work is properly attributed. For permission for commercial use of this work, please see paragraphs 4.2 and 5 of our Terms.
© 2017 The Author(s). This work is published and licensed by Dove Medical Press Limited. The full terms of this license are available at https://www.dovepress.com/terms.php and incorporate the Creative Commons Attribution - Non Commercial (unported, v3.0) License.
By accessing the work you hereby accept the Terms. Non-commercial uses of the work are permitted without any further permission from Dove Medical Press Limited, provided the work is properly attributed. For permission for commercial use of this work, please see paragraphs 4.2 and 5 of our Terms.