")
Back to Journals » International Journal of Nanomedicine » Volume 11
Novel therapeutic mechanisms determine the effectiveness of lipid-core nanocapsules on melanoma models
Authors Drewes C, Fiel L, Bexiga C, Asbahr AC, Uchiyama M, Cogliati B, Araki K , Guterres S, Pohlmann A , Farsky S
Received 30 November 2015
Accepted for publication 22 January 2016
Published 31 March 2016 Volume 2016:11 Pages 1261—1279
DOI https://doi.org/10.2147/IJN.S101543
Checked for plagiarism Yes
Review by Single anonymous peer review
Peer reviewer comments 4
Editor who approved publication: Dr Thomas Webster
Carine C Drewes,1,* Luana A Fiel,2,* Celina G Bexiga,1 Ana Carolina C Asbahr,3 Mayara K Uchiyama,4 Bruno Cogliati,5 Koiti Araki,4 Sílvia S Guterres,2,3 Adriana R Pohlmann,2,3,6 Sandra P Farsky1
1Department of Clinical and Toxicological Analyses, School of Pharmaceutical Sciences, University of São Paulo, São Paulo, 2Postgraduate Program in Pharmaceutical Sciences, Federal University of Rio Grande do Sul, Porto Alegre, 3Postgraduate Program in Pharmaceutical Nanotechnology, Federal University of Rio Grande do Sul, Porto Alegre, 4Department of Fundamental Chemistry, Institute of Chemistry, 5Department of Pathology, Faculty of Veterinary Medicine, University of São Paulo, São Paulo, 6Department of Organic Chemistry, Institute of Chemistry, Federal University of Rio Grande do Sul, Porto Alegre, Brazil
*These authors contributed equally to this work
Abstract: Melanoma is a severe metastatic skin cancer with poor prognosis and no effective treatment. Therefore, novel therapeutic approaches using nanotechnology have been proposed to improve therapeutic effectiveness. Lipid-core nanocapsules (LNCs), prepared with poly(ε-caprolactone), capric/caprylic triglyceride, and sorbitan monostearate and stabilized by polysorbate 80, are efficient as drug delivery systems. Here, we investigated the effects of acetyleugenol-loaded LNC (AcE-LNC) on human SK-Mel-28 melanoma cells and its therapeutic efficacies on melanoma induced by B16F10 in C57B6 mice. LNC and AcE-LNC had z-average diameters and zeta potential close to 210 nm and -10.0 mV, respectively. CytoViva® microscopy images showed that LNC and AcE-LNC penetrated into SK-Mel-28 cells, and remained in the cytoplasm. AcE-LNC in vitro treatment (18–90×109 particles/mL; 1 hour) induced late apoptosis and necrosis; LNC and AcE-LNC (3–18×109 particles/mL; 48 hours) treatments reduced cell proliferation and delayed the cell cycle. Elevated levels of nitric oxide were found in supernatant of LNC and AcE-LNC, which were not dependent on nitric oxide synthase expressions. Daily intraperitoneal or oral treatment (days 3–10 after tumor injection) with LNC or AcE-LNC (1×10¹² particles/day), but not with AcE (50 mg/kg/day, same dose as AcE-LNC), reduced the volume of the tumor; nevertheless, intraperitoneal treatment caused toxicity. Oral LNC treatment was more efficient than AcE-LNC treatment. Moreover, oral treatment with nonencapsulated capric/caprylic triglyceride did not inhibit tumor development, implying that nanocapsule supramolecular structure is important to the therapeutic effects. Together, data herein presented highlight the relevance of the supramolecular structure of LNCs to toxicity on SK-Mel-28 cells and to the therapeutic efficacy on melanoma development in mice, conferring novel therapeutic mechanisms to LNC further than a drug delivery system.
Keywords: capric/caprylic triglycerides, mice, acetyleugenol, B16F10 cells, SK-Mel-28, nitric oxide, cell proliferation, nanotoxicology
Introduction
Malignant melanoma is a severe skin cancer, and it is responsible for the majority of skin cancer deaths.1,2 A combination of risk factors, including both extrinsic, that is, environmental factors such as exposure to ultraviolet radiation, and intrinsic genetic/phenotypic characteristics as well as immunosuppression, are responsible for melanoma incidence.3 Melanoma growth is complex and highly mediated by chemical substances secreted by the malignant and immune cells surrounding the tumor area and by extracellular matrix components.4–6 Melanoma is the most aggressive form of skin cancer with a high metastatic index, and diseases in advanced stages are resistant to established therapeutic approaches, including surgical excision, chemotherapy, radiotherapy, immunotherapy, and/or adjuvant stem cell-based therapies.1,2 The survival rate for patients diagnosed with locally invasive and metastatic disease is ~6–10 months, and only 20% of patients survive for ~5 years.1,7 Therefore, new approaches are essential for more effective therapies to treat melanoma.
In this context, a promising strategy to malignant melanoma treatment is use of nanotechnology-based drug delivery systems that are able to improve or target the delivery of antitumoral agents into the core of the tumor mass.8,9 Different drug-delivering systems such as liposomes,10–13 dendrimers,14,15 polymersomes,16,17 and carbon-based nanoparticles18,19 have been tested, but until now, only liposomes and albumin nanoparticles containing anticancer drugs have been used clinically.20–22
Polymeric nanocarriers such as multifunctional lipid-coated nanoparticles23 and polymeric nanocapsules24 have encouraging therapeutic applications of nanodrug delivery systems, especially as carriers for anticancer drugs into solid tumors. Those effects are due to excellent endocytosis, passive tumor targeting, high encapsulation efficiency, and high stability of polymeric nanoparticles, allowing for extended time in the circulatory system.24
Our research group developed a hybrid biodegradable nanoparticle called lipid-core nanocapsules (LNCs) that are core–shell structures consisting of a lipid core, composed of sorbitan monostearate (SM) dispersed in capric/caprylic triglyceride (CCT), surrounded by a poly(ε-caprolactone) (PCL) wall, and stabilized by polysorbate 80 micelles at the particle/water interface.25 Several studies have shown the effectiveness of LNC in carrying different drugs to treat cancer and inflammatory diseases.24
Eugenol (4-allyl-2-methoxyphenol), a phenolic phytochemical, is the main component of clove oil, also being present in reasonable amounts in several other spices such as basil, cinnamon, and bay leaves.26,27 It has been used as an antibacterial, analgesic, antiseptic, antiviral, and flavoring agent and antioxidant, and is the main ingredient of cavity-filling cement in dentistry.26–31 Furthermore, eugenol acts as an inductor of apoptosis in mast cells,32 osteosarcoma,33 leukemia,34,35 colon,36 and melanoma cells.26,37 It is noteworthy that eugenol is a lipophilic drug requiring organic solvents, which are cytotoxic agents, for solubilization. Therefore, the nanoencapsulation could improve in vivo drug distribution to the tumor site, enhancing therapeutic effectiveness.
Hence, we performed preformulation studies developing eugenol-loaded LNCs and acetyleugenol (AcE)-loaded LNCs (AcE-LNCs) to select the best formulation to investigate the drug-nanoencapsulation effectiveness in in vivo B16F10 melanoma in mice and the in vitro mechanisms of toxicity using a human melanoma cell of SK-Mel-28 lineage. To our knowledge, our data show, for the first time, the efficacy of encapsulation of AcE and also point out the mechanisms and efficacy of LNC as a therapeutic agent to experimental melanoma.
Materials and methods
Preparation of LNCs
LNCs were prepared using a method as previously reported.38 To prepare LNC, PCL was used as a mixture of 0.09 and 0.01 g of PCL with weight average molar mass (Mw) of 114,000 g/mol (Capa6500™; Perstorp, Toledo, OH, USA) and Mw 14,000 g/mol (Sigma-Aldrich, St Louis, MO, USA), respectively, of SM (0.038 g) (Sigma-Aldrich), CCT (0.120 mL) (Alpha Quimica, Porto Alegre, Brazil), and acetone (27 mL, nuclear, analytical grade). This organic phase was stirred at 40°C until dissolution of all components. The aqueous phase was composed of polysorbate 80 (0.077 g) (Oxiteno SA, São Paulo, Brazil) and water (53 mL, ultrapure grade), and was also stirred at 40°C. Then, the organic phase was injected into the aqueous phase using a funnel with ~3 mm outlet under magnetic stirring. The turbid solution was stirred for 10 minutes at 40°C, the acetone was eliminated, and then the formulation was concentrated to ~9.5 mL in a rotatory evaporator (R-114; Büchi, Flawil, Switzerland). The volume was set to 10 mL using a volumetric flask.
AcE synthesis
AcE was obtained by acetylation of eugenol (4-allyl-2-methoxyphenol) from clove oil (78% eugenol). Clove oil (13.78 g) and acetic anhydride (26 g) were made to react using 4-(N,N-dimethyl)-aminopyridine (0.014 g) as a catalyst. The reaction was conducted for 24 hours at 130°C. After cooling at room temperature, the medium was added of two drops of HCl (concentrated, 37%) to solubilize 4-(N,N-dimethyl)-aminopyridine. At 5°C (ice bath), the medium was added of 0.1 mol L−1 NaOH aqueous solution (40 mL) to dissolve the carboxylates. Then, the product was extracted with dichloromethane (40 mL), and the organic phase extracted with water (3×40 mL). The organic phase was filtered through silica gel, added of magnesium sulfate, filtered through paper filter, and evaporated under reduced pressure. The product (14 g) was obtained as a yellowish clear solution and characterized by Fourier transform infrared spectroscopy (Varian® 640-IR spectrophotometer; Varian, Palo Alto, CA, USA) recorded from 4,000 to 400 cm−1 (100 scans, 2 cm−1 resolution) and hydrogen nuclear magnetic resonance (1H NMR) (Varian VXR-200).
Fourier transform infrared (film, sodium chloride crystals): 3,100–2,800 (CH), 1,700 (C=O, ester), 1,200 (C–O) cm−1 (Figure S1).
1H NMR (δ, ppm; CDCl3): 6.96 and 6.93 (d, 1H, ArH), 6.79 and 6.75 (d, 1H, ArH), 5.95 (m, 1H), 5.29 (s, 1H), 5.10 (m, 2H), 3.82 (s, 3H, −OCH3), 3.36 (d, 2H), 2.31 (s, 3H, −OCOCH3).
Preparation of AcE-LNCs
The AcE-LNC formulation was prepared using the methodology described for LNC by replacing 0.042 g of the mass of CCT by the same amount of AcE.
Physicochemical characterization of the LNCs
Particle size (z-average diameter), polydispersity index (PDI), and zeta potential of the formulations were determined using a Zetasizer® Nano-ZS ZEN 3600 model (Malvern Instruments, Malvern, UK). The samples were diluted (×500) without previous treatment in water (MilliQ®) (particle size and PDI) or in 10 mmol L−1 NaCl aqueous solution (zeta potential). Particle number density (PND) and mean diameter by number of particles were determined by nanoparticle-tracking analysis (NTA; NanoSight LM10; NanoSight Ltd, Salisbury, UK) after diluting the formulations (×10,000) in ultrapure water (MilliQ®). The pH value of the formulations was directly determined without sample treatment using a potentiometer (Micronal B-474; Micronal S.A., São Paulo, Brazil).
The total concentration of AcE in the formulation was determined by reverse phase high-performance liquid chromatography (PerkinElmer S-200, with a S-200 injector, a UV–Vis detector, a C18 guard column, and a Lichrospher 100 RP-18 column). The quantification method was adapted from a method previously reported.39 Analyses were performed using a wavelength of 275 nm, methanol:water (85:15, v/v, pH 5.0) as mobile phase, and a flow of 0.7 mL/min.The method was validated according to specificity, linearity (range: 5–40 μg/mL), repeatability, accuracy, and limits of quantification and detection.40 AcE-LNC suspensions were analyzed according to their drug content (mg/mL), encapsulation efficiency (EE%), and drug loading (%). Drug content was determined after extracting AcE from AcE-LNC (63 μL) with methanol in a volumetric flask (10 mL). The solution was quantified by high-performance liquid chromatography using the validated method described earlier. Ultrafiltration-centrifugation (cutoff 10 kDa) was performed for 10 minutes at 5,000 rpm (Sigma 1-14; Sigma Laborzentrifugen GmbH, Osterode am Harz, Germany). The ultrafiltrate was directly injected for drug quantification without dilution to determine the reminiscent concentration of AcE in the aqueous phase. The EE% and drug loading were calculated using Equations 1 and 2, respectively.
|
|
|
|
where Ce is the concentration of encapsulated drug calculated by the difference between the drug content (Ct) and the reminiscent concentration of AcE in the aqueous phase, and Cm represents the total concentration of the materials of the colloidal phase.
Polymer swelling, size exclusion chromatography, and differential scanning calorimetry analyses
Films were produced by dissolving PCL (PCL114:PCL14, 90:10, w/w) in chloroform, followed by evaporation. Pieces were cut (0.100 g) and immersed into a few milliliters of pure substances (eugenol or AcE) for 15 days. In parallel, PCL pieces (0.100 g) were immersed into a few milliliters of oily mixtures of eugenol/CCT or AcE/CCT (ratios 1:9 or 1:1, w/w) for 60 days. Swelling was determined by observing weight changes as a function of time (0, 3, 7, 15, 30, and 60 days). Each piece was removed from the liquid and put on a filter paper; excess oil was gently removed, and the piece was weighed (Scientech SA 210 analytical balance; Scientech Inc., Boulder, CO, USA). The experiment was performed in triplicate of batches for each liquid (pure substances or oily mixtures).
Size exclusion chromatography (Viscotek® VE 2001; Malvern Instruments) was performed to determine the number average molar mass and Mw of the PCL after extracting the polymer from the formulations AcE-LNC and LNC. For this purpose, 1 mL of formulation was added to 9 mL of ethanol in a falcon tube. The tube was vortexed for 2 minutes, placed in an ultrasound for 10 seconds, and centrifuged (36,000 rpm) for 20 minutes (Baby I; Fanen, Guarulhos, Brazil), and the supernatant was collected. The procedure was repeated three times, and the precipitate pool was dissolved in tetrahydrofuran for analysis. The calibration curve was plotted using polystyrene in tetrahydrofuran.
Differential scanning calorimetry (DSC) analysis was performed for samples of polymer film (PCL114:PCL14 blend) after contact with CCT or AcE. Each piece of polymer film (200 mg) was kept immersed into CCT or AcE for 15 days. After this period, the films were removed from CCT or AcE, and the excess oil was removed with an absorbent paper. Samples of each film and starting materials (PCL, AcE, and CCT) (12 mg) were placed separately into aluminum containers suitable for analysis. DSC analysis was performed using a TA Instruments® DSC Q20, previously calibrated with indium, with a heating ramp from −80°C to 100°C (10°C/min). The beginning of the heating cycle was preceded by a 5-minute isotherm at −80°C. The peaks obtained from the DSC thermograms were integrated with the program of data processing, TA Universal Analysis for Windows 2000/XP.
Cell cultures
Malignant melanoma cell lines SK-Mel-28 and B16F10 were obtained from the American Type Culture Collection (ATCC, Manassas, VA, USA). Cells at 5–15 passages were grown in culture flasks and maintained in Roswell Park Memorial Institute (RPMI) 1640 (Vitrocell, São Paulo, Brazil), supplemented with 10% fetal bovine serum (FBS) (Vitrocell). R10 consists of RPMI 1640 medium plus 10% FBS (control group). Cells were kept at a temperature of 37°C, a minimum relative humidity of 95%, and an atmosphere of 5% CO2 in air. The University of São Paulo does not require ethical approval for human cell lineages.
In vitro cellular uptake
Microscopy studies were carried out to confirm the internalization of LNC or AcE-LNC by SK-Mel-28 cells. The cells (5×10⁵ cells) were plated in a power-free cover present in a 24-well plate. After adherence, cells were incubated with R10 containing LNC (18×109 particles/mL) or AcE-LNC (60 μM of AcE; 18×109 particles/mL) for 1 hour at 37°C under 5% CO2 atmosphere. The control group did not receive any treatment. Immediately after incubation, covers were placed on power-free slides containing 10 μL of phosphate-buffered saline (PBS), and the melanoma cells were imaged using a combination of dark-field reflectance microscopy acquired in a CytoViva® Ultra Resolution Imaging System (CytoViva, Inc., Auburn, AL, USA), mounted on an Olympus BX51 microscope (×1,500 magnification; Olympus, Tokyo, Japan). The same 0.5 numerical aperture objective and a 75 W Xe light source were used throughout. Reflectance images were taken with a Q-imaging Retiga EXi CCD camera (Olympus Microsystems, Tokyo, Japan) with Image Processing Software (Labsphere, North Sutton, NH, USA).
Flow cytometer assays
All experiments were conducted with a FACS Canto Flow Cytometer (Becton Dickinson, Franklin Lakes, NJ, USA) and analyzed using FlowJo software (Version 9.1; TreeStar Inc., Ashland, OR, USA). Data from 10,000 cells were obtained, and only the morphologically viable cells were considered in the analysis.
To identify cell viability, 1×10⁴ SK-Mel-28 cells were seeded on 12-well plates. After a 12-hour attachment period, cells were treated with R10 (control), LNC (18×109, 30×109, or 90×109 particles/mL), AcE (60, 100, or 300 μM), or AcE-LNC (60, 100, or 300 μM of AcE; 18×109, 30×109, or 90×109 particles/mL, respectively). Concentrations of particles were calculated based on the PND determined by NTA described earlier. Following 48 hours of incubation, cells were harvested, and apoptosis and necrosis were measured by adding annexin-V-FITC (2:100, 100 μL; BD Biosciences, San Jose, CA, USA) and propidium iodide (PI; 50 μg/mL, 10 μL; Sigma Chemicals, Perth, Australia), respectively. Fluorescence was monitored in λexc=490 nm and λemi=525 nm channel.
Cell proliferation was measured in SK-Mel-28 cells labeled with carboxyfluorescein diacetate succinimidyl ester, according to the manufacturer’s instructions (Invitrogen, Carlsbad, CA, USA).41 Briefly, cells were washed with PBS and incubated with carboxyfluorescein diacetate succinimidyl ester at a final concentration of 5 μM at 37°C for 10 minutes. Afterward, cells were washed three times with PBS supplemented with 3% FBS (1 mL). Thereafter, 1×10⁵ cells were plated into 24-well plates and then incubated with R10 (control), LNC (3×10⁹, 9×10⁹, or 18×109 particles/mL), AcE (10, 30, or 60 μM), or AcE-LNC (10, 30, or 60 μM of AcE; 3×10⁹, 9×10⁹, or 18×109 particles/mL, respectively) for 48 hours. Fluorescence was monitored in λexc=490 nm and λemi=525 nm channel. The results are expressed as fluorescence intensity, and reductions in this parameter indicate an increment of cell proliferation.
Cell cycle was evaluated in SK-Mel-28 cells (1×10⁴ cells/well) seeded into 24-well plates and incubated with R10 (control), LNC (3×10⁹, 9×10⁹, or 18×109 particles/mL), AcE (10, 30, or 60 μM), or AcE-LNC (10, 30, or 60 μM of AcE; 3×10⁹, 9×10⁹, or 18×109 particles/mL, respectively) for 48 hours. Afterward, cells were washed with PBS, trypsinized, and fixed by adding cold methanol (75%) for 1 hour. DNA was stained with 200 μL of PI (10 μg/mL) and 20 μL of RNAse (15 μg/mL, Sigma Chemicals), and the percentage of cells in each phase of the cell cycle was determined. Fluorescence was monitored in λexc=488 nm and λemi=695 nm channel.
Cell adhesion assay
Confluent SK-Mel-28 cells were incubated with R10 (control), LNC (3×10⁹, 9×10⁹, or 18×109 particles/mL), AcE (10, 30, or 60 μM), or AcE-LNC (10, 30, or 60 μM of AcE; 3×10⁹, 9×10⁹, or 18×109 particles/mL, respectively) for 2 hours at 37°C. Thereafter, cells were removed using cell scraper, and 1×10⁵ cells were added to adhere to the wells coated with Matrigel® (Corning®, New York, NY, USA) in serum-free media, for 30 minutes at 37°C. Non-adhered cells were gently removed by washing with PBS. The number of attached cells was determined using 3-(4,5-dimethylthiazol-2-yl)-2,5-diphenyltetrazolium bromide (MTT) assay (Sigma Chemicals). Briefly, 10 μg of MTT solution (5 mg/mL) were added to each well containing 100 mL of serum-free media and incubated at 37°C for 2 hours. Thereafter, the media were aspirated, and MTT crystals were dissolved in dimethyl sulfoxide (DMSO; Sigma Chemicals). The absorbance was measured using a SpectraMAX 190 plate (Molecular Devices, Sunnyvale, CA, USA) reader at 570 nm. Results were expressed as % of control group.
Cell migration assay
SK-Mel-28 cells (1×10⁵/well) were seeded into 24-well plates. After 24 hours, cells reached semiconfluence, and a vertical center line (wound) was opened with the tip of a pipette. Afterward, cells were gently washed and incubated with R10 (control), DMSO, LNC (18×109 particles/mL), AcE (60 μM), or AcE-LNC (60 μM of AcE; 18×109 particles/mL) for 12 hours. Cell migration was monitored with images obtained before and after the treatments, using a digital camera (Leica, Wetzlar, Germany) coupled to a microscope (magnification ×50; Leica). Results were expressed as the number of cell nuclei that crossed the groove line in three different microscopic fields.
Quantification of NO2−
Levels of nitrite (NO2−), a marker of NO levels, were measured in supernatant of SK-Mel-28 cells (1×10⁴/well) pretreated or not with N-ω-nitro-L-arginine methyl ester hydrochloride (L-NAME; 10−3 M, Sigma Chemicals) for 30 minutes and then treated with LNC (3×10⁹, 9×10⁹, or 18×109 particles/mL), AcE (10, 30, or 60 μM), or AcE-LNC (10, 30, or 60 μM of AcE; 3×10⁹, 9×10⁹, or 18×109 particles/mL, respectively) for 24 hours. The levels of NO2− were quantified by chemiluminescence of the reaction between ozone and NO generated by the reduction of the sample with vanadium chloride, in acidic medium, at 95°C, using an NO analyzer (Model 208A; Sievers Instruments, Inc., Boulder, CO, USA) according to the manufacturer’s protocols.42
iNOS and eNOS protein expression
Inducible nitric oxide synthase (iNOS) and enhanced nitric oxide synthase (eNOS) protein expression in SK-Mel-28 cells treated with PBS (control), LNC (18×109 particles/mL), AcE (60 μM), or AcE-LNC (60 μM of AcE; 18×109 particles/mL, respectively) for 24 hours was quantified by Western blot. Briefly, after the treatment, proteins were extracted in Tris buffer (50 mM, pH 7.4) containing leupeptin (10 μg/mL), soybean trypsin inhibitor (10 μg/mL), aprotinin (2 μg/mL), and phenylmethylsulfonyl fluoride (1 mM). Homogenized proteins were separated by sodium dodecyl sulfate-polyacrylamide gel electrophoresis (15%) and were electrophoretically transferred to a nitrocellulose membrane. After blocking nonspecific sites with 1% casein, membranes were incubated overnight with primary rabbit polyclonal antibodies raised against iNOS (BD) and eNOS (BD) (500 ng/mL). Membranes were washed with Tris-buffered saline containing 0.1% tween-20 and incubated with horseradish peroxidase-conjugated goat anti-rabbit secondary antibody. A chemiluminescent assay (HRP SuperSignal West Pico; Thermo Fisher Scientific, Waltham, MA, USA) was used to detect immunoreactive bands. The intensities of the bands were estimated by densitometry analysis and compared to the intensity of β-actin expression.
Animals
Male C57Bl6 mice (25–30 g) (n=10 per group) were provided by the Central Animal House of School of Pharmaceutical Science and the Chemistry Institute of the University of São Paulo. The mice were housed in polycarbonate cages with covers (Tecniplast, Buguggiate, Italy) (four animals per cage) at room temperature (22°C±0.1°C) and humidity of 50%±10% with a 12-hour light/dark cycle, receiving standard food and water ad libitum. Animals were anesthetized with a combination of ketamine:xylazine solution (20:2 mg/kg, intraperitoneal [ip]; Ceva Santé Animale, Libourne, France) before each experimental procedure. All procedures were approved by the Institutional Animal Care and Use Committee at the School of Pharmaceutical Sciences, University of São Paulo (protocol number: 309). All procedures were performed according to the Brazilian Society of Science of Laboratory Animals guidelines for the proper care and use of experimental animals.
In vivo tumorigenesis assay
A murine B16F10 (H2b) variant of the B16 melanoma cell line originated from C57Bl6 mice was used in the experiments. Cell viability was determined by the Trypan Blue exclusion test, which showed that >95% of the cells were viable. B16F10 cells (8×10⁵/100 μL) were suspended in R10 and injected subcutaneously into flank regions of mice to induce tumor formation. To assess the effects of treatments on early steps of melanoma development, 3 days after injection of cells, the animals were treated with saline, DMSO (AcE vehicle, 2%), LNC (1×10¹² particles/day), AcE (50 mg/kg/day), AcE-LNC (50 mg/kg/day of AcE; 1×10¹² particles/day), or CCT (30 μL plus 220 μL of saline), according to each experimental goal, by intraperitoneal or oral route, and treatments were continued for 7 days. Tumor size was measured daily using a caliper-like instrument and converted to tumor volume by the equation: volume = (the shortest diameter)2 × (the longest diameter) ×0.5, and expressed in cubic millimeters.43,44 Additionally, the weight of animals and food intake were measured daily during all treatments.
Histological analysis
At least five tumor hematoxylin and eosin sections (2–3 μm thick, paraffin embedded) from each animal treated with saline, LNC (1×10¹² particles/day), AcE (50 mg/kg/day), or AcE-LNC (50 mg/kg/day of AcE; 1×10¹² particles/day) by oral route were analyzed.
Blood analysis
At the end of treatments with saline, LNC (1×10¹² particles/day), AcE (50 mg/kg/day), or AcE-LNC (50 mg/kg/day of AcE; 1×10¹² particles/day) by oral route, the blood of the animals was drawn from vena cava, and ethylenediaminetetraacetic acid (Sigma Chemicals) was used as an anticoagulant to perform hemogram. The evaluation of blood profile was performed on ABX Micros ABC Vet equipment (Horiba ABX, Kyoto, Japan). Additionally, serum samples were used to evaluate hepatic and kidney functions by biochemical analysis using a biochemical auto analyzer (Labmax 240; Labtest Diagnóstica SA, Lagoa Santa, Brazil).
Statistics
Data are presented as mean ± standard error of the mean of the three experiments in each condition for in vitro studies or of ten animals for in vivo studies. Statistical analyses were performed with GraphPad Prism5 (GraphPad Software, Inc., La Jolla, CA, USA). One- or two-way analyses of variance followed by Tukey’s post hoc test were used to compare the data. P-values <0.05 were considered significant.
Results and discussion
Synthesis and characterization of PCL LNCs
The LNC formulation was obtained macroscopically as a white opalescent homogeneous liquid. The concentration of ingredients used to prepare the LNC was based on previous preformulation studies, which showed that the exclusive formation of LNC structures dispersed in water (without nanoemulsion or nanosphere contaminants) is reached at the mass proportions of SM:CCT:PCL of 1.0:4.0:2.6.38,45 The process yielded colloidal dispersions without any phase separation after preparation. In this way, no centrifugation or filtration was needed to perform the physicochemical characterization of formulations. The photon correlation spectroscopy analysis of LNC showed unimodal size distribution with z-average diameter of 208±15 nm and PDI of 0.11±0.01.
The preformulation study to obtain eugenol or AcE encapsulated in LNC started calculating the logarithm of distribution (log D) for both to determine the probable mechanisms of encapsulation in LNC. The lipophilicity of drugs is the key feature influencing the encapsulation mechanism, and the correlation of log D to the mechanism of encapsulation was previously established for LNC.46 Eugenol and AcE are lipophilic substances with log D of 2.20 and 2.40 (software ACD/Labs), respectively. In both cases, mechanisms type III and type IV are expected, since methotrexate diethyl ester and indomethacin are respective examples of those mechanisms, both with log D of 2.21.46 The mechanism type III is characterized by a dispersion of the drug in all compartments of the formulation (core, polymer wall, and aqueous phase), while in type IV, the drug is mainly interacting with the PCL wall of LNC.
Considering that eugenol and AcE are essential oils, they could act as solvents for PCL. Moreover, in both mechanisms of encapsulation (types III and IV), the polymer–oil interactions are present and could influence the supramolecular structure of the nanocapsules. To determine the interactions of the essential oils with PCL, we carried out a swelling experiment47 to determine the solubility of PCL in contact with eugenol or AcE. A preliminary study showed the complete dissolution of the PCL film in eugenol, while it remained intact in AcE after 15 days.
To retard the dissolution of PCL by eugenol, mixtures (w/w) of eugenol/CCT (1:1 and 1:9) were assayed, since CCT is a nonsolvent for PCL as previously demonstrated.47 In parallel, similar mixtures of AcE/CCT were prepared for comparison. After 1 day, the PCL films immersed in eugenol/CCT (1:1, w/w) showed an increase in weight (140%), while after 60 days, a reduction of 60% in weight was determined. Nevertheless, PCL films in contact with eugenol/CCT (1:9, w/w) showed similar weight (P>0.05) in the same period of time. No significant change in the polymer film was observed for 60 days, during which PCL was immersed in AcE/CCT mixtures, regardless of the mass ratio of the oily mixture. However, we observed higher standard deviations for the films immersed in eugenol/CCT (1:9, w/w) compared to those immersed in AcE/CCT (1:9, w/w) (Figure S2).
The results initially suggested that the integrity of the polymeric wall of LNC could be preserved when AcE was encapsulated. Conversely, eugenol, even when blended with CCT, could interact better with the polymer wall, dissolving it prematurely and impairing the supramolecular structure of eugenol-LNC, as previously observed for benzyl benzoate nanocapsules.47
Using the previous proportions of materials determined for LNC, we prepared three batches of AcE-LNC with SM:CCT-AcE:PCL at a ratio of 1.0:4.0:2.6 (w/w/w) having a theoretical drug content of 4.2 mg/mL. AcE-LNC had z-average diameter of 194±20 nm and PDI of 0.12±0.02. Low values of distribution width and standard deviation indicated that the formulations have narrow size distributions and the process of preparation is reproducible (Figure 1).
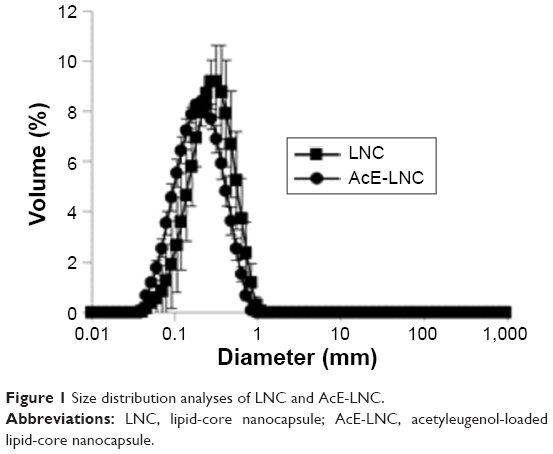 | Figure 1 Size distribution analyses of LNC and AcE-LNC. |
The NTA showed, for LNC and AcE-LNC, mean diameters of 216±15 and 214±20 nm, respectively, and PND of 4.5±0.5×10¹² and 3.6±0.4×10¹² particles/mL, respectively. The z-average diameter, obtained by photon correlation spectroscopy, and mean diameters of nanocapsules, obtained by NTA, were similar (P>0.05, t-test α=0.05), indicating that there was no particle selection during the experiment. The PND values determined by NTA really represent the samples. The pH values close to 6 showed the slight acidity of the formulations. The zeta potential of LNC and AcE-LNC was −10.0±1.6 and −11.5±2.14 mV, respectively. The nanocapsules are formed by a polyester (PCL114), the carboxylic function of which at one end can be ionized by the presence of water. The kinetic stability of the colloids is guaranteed by the polysorbate 80 coating, forming a steric barrier for particles agglomeration.48 The nonionic character of polysorbate 80 is responsible for the low values in modulus of zeta potential. In this way, the mechanism of stabilization in the case of LNC and AcE-LNC is based on the steric hindrance, as previously proposed for polysorbate 80-coated poly(butyl cyanoacrylate).49 The AcE content in AcE-LNC was 3.23±0.03 mg/mL, indicating a recovery of AcE close to 80%. Although values of drug recovery close to 100% are desirable, 80% is acceptable since an essential oil nanoencapsulated is in general partially lost by steam distillation during the process.50 The loading capacity was 8.30%, and the EE% was 100%. The results demonstrated the high loading capacity of LNC to carry AcE.
SEC analysis of PCL extracted from LNC and AcE-LNC formulations showed values of Mw and number average molar mass of 95,400 and 46,400 mg/mL and 84,200 and 43,700 mg/mL, respectively. The slightly lower molar mass of PCL in AcE-LNC compared to LNC suggested an interaction of AcE with PCL, which could lead to a decrease in crystallinity; then, an increased interaction of the polymer wall with water results in an increase in hydrolysis.
Therefore, DSC analysis was performed to determine the PCL crystallinity before and after contact with AcE or CCT. The melting peak of PCL before contact with oil was 62.3°C. The value was maintained after contact with CCT, while it shifted to 54.6°C after immersion in AcE (Figure 2). The melting enthalpy values, ΔHm (J g−1), were similar for PCL and PCL in contact with CCT (72.53 J g−1 (PCL) and 71.05 J g−1 [PCL immersed in CCT]). However, ΔHm decreased (51.28 J g−1) after PCL contact with AcE. The results showed clearly that AcE interacts with PCL, thus enabling a decrease in the crystallinity of the polymer. In parallel, we weighed the film samples before and after the 15 days preceding the DSC analyses, and no change was observed. In this way, we can propose substituting the swelling experiment by DSC analysis to determine more precisely the interactions of the polymer with oil. Furthermore, up to this point, the results suggested that the probable mechanism of AcE encapsulation is type IV (drug interacting with polymer) and that the crystallinity of the polymer wall is affected since the drug interacts with the polymer. We performed in vitro and in vivo biological evaluations to determine the impact of the physicochemical characteristics of the LNC containing AcE or not on the results.
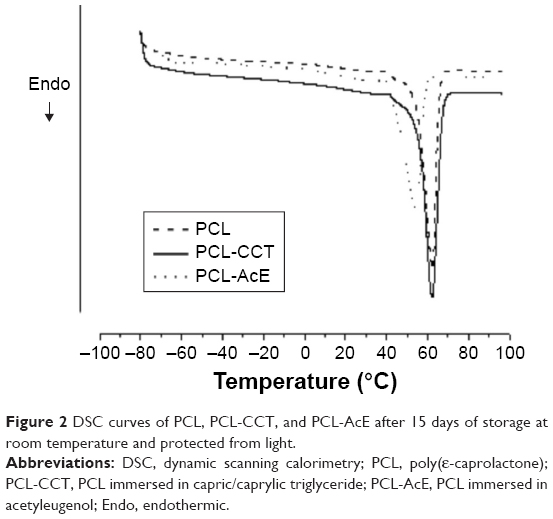 | Figure 2 DSC curves of PCL, PCL-CCT, and PCL-AcE after 15 days of storage at room temperature and protected from light. |
LNC and AcE-LNC were internalized by SK-Mel-28 cells
The efficacy of treatments was investigated in vitro using a human melanoma cell lineage. The uptake of nanocapsules is fundamental to understanding the direct toxic mechanisms in different cells.51 Data obtained by CytoViva® microscopy confirmed the internalization of LNC and AcE-LNC by melanoma cells. Cells incubated with R10 medium for 1 hour did not show dark-field scattering points (Figure 3A); conversely, cells incubated with LNC (18×109 particles/mL) or AcE-LNC (60 μM of AcE, 18×109 particles/mL) clearly presented scattering features in the cytoplasm, very close to the nucleus (Figure 3B and C), suggesting that the nanocapsules crossed the membrane and are located inside the cells. We have previously demonstrated the uptake of LNC formulations, prepared with rhodamine B–castor oil conjugate52 or with rhodamine B–PCL conjugate,53 by macrophage U937 human cell line and lung carcinoma A549 human cell line.54
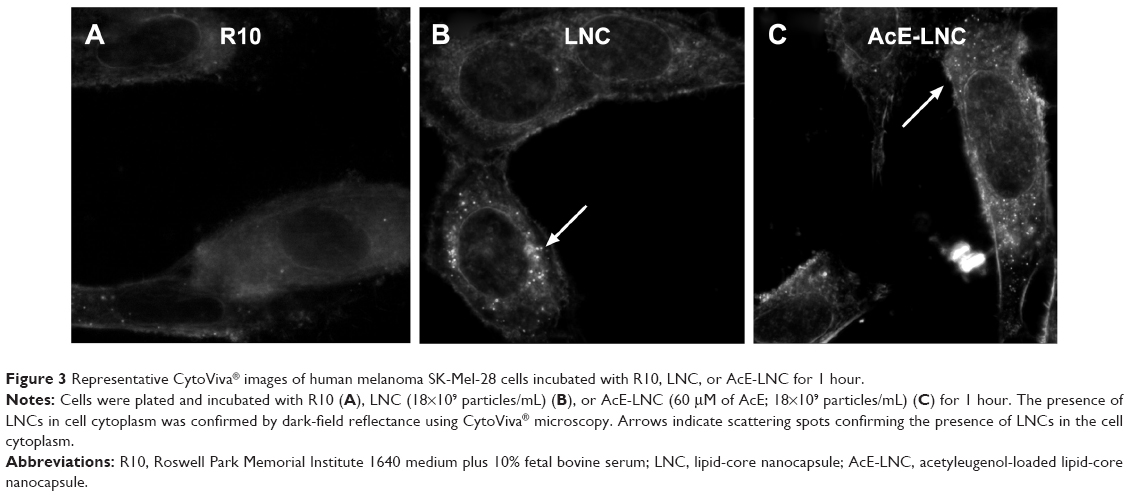 | Figure 3 Representative CytoViva® images of human melanoma SK-Mel-28 cells incubated with R10, LNC, or AcE-LNC for 1 hour. |
Cytotoxicity of LNC and AcE-LNC on melanoma cells
During melanoma growth, the tumor cells have a high cell proliferation rate, and they must survive in tumor microenvironment, adhere, migrate, and invade into extracellular matrix.6,55 Therefore, we first investigated the direct toxic mechanisms of AcE-LNC on viability and proliferation of SK-Mel-28 cells. As a control, we employed cells treated only with culture media AcE or LNC. Data showed that LNC or AcE treatments did not cause cell death (Figure 4A), but AcE-LNC treatment, in higher concentrations, reduced SK-Mel-28 cell viability by inducing late apoptosis and necrosis (Figure 4A–C, respectively). On the other hand, all treatments employed reduced cell proliferation (Figure 4D), and cells were arrested in G2/M phase after treatment with LNC or AcE-LNC and in G0/G1 phase after treatment with AcE (Figure 4E). Therefore, our data show the ability of AcE, LNC, or AcE-LNC to impair cell proliferation and the ability of AcE-LNC to induce cell death, suggesting their cytotoxic roles in the initial phases of tumor progression.
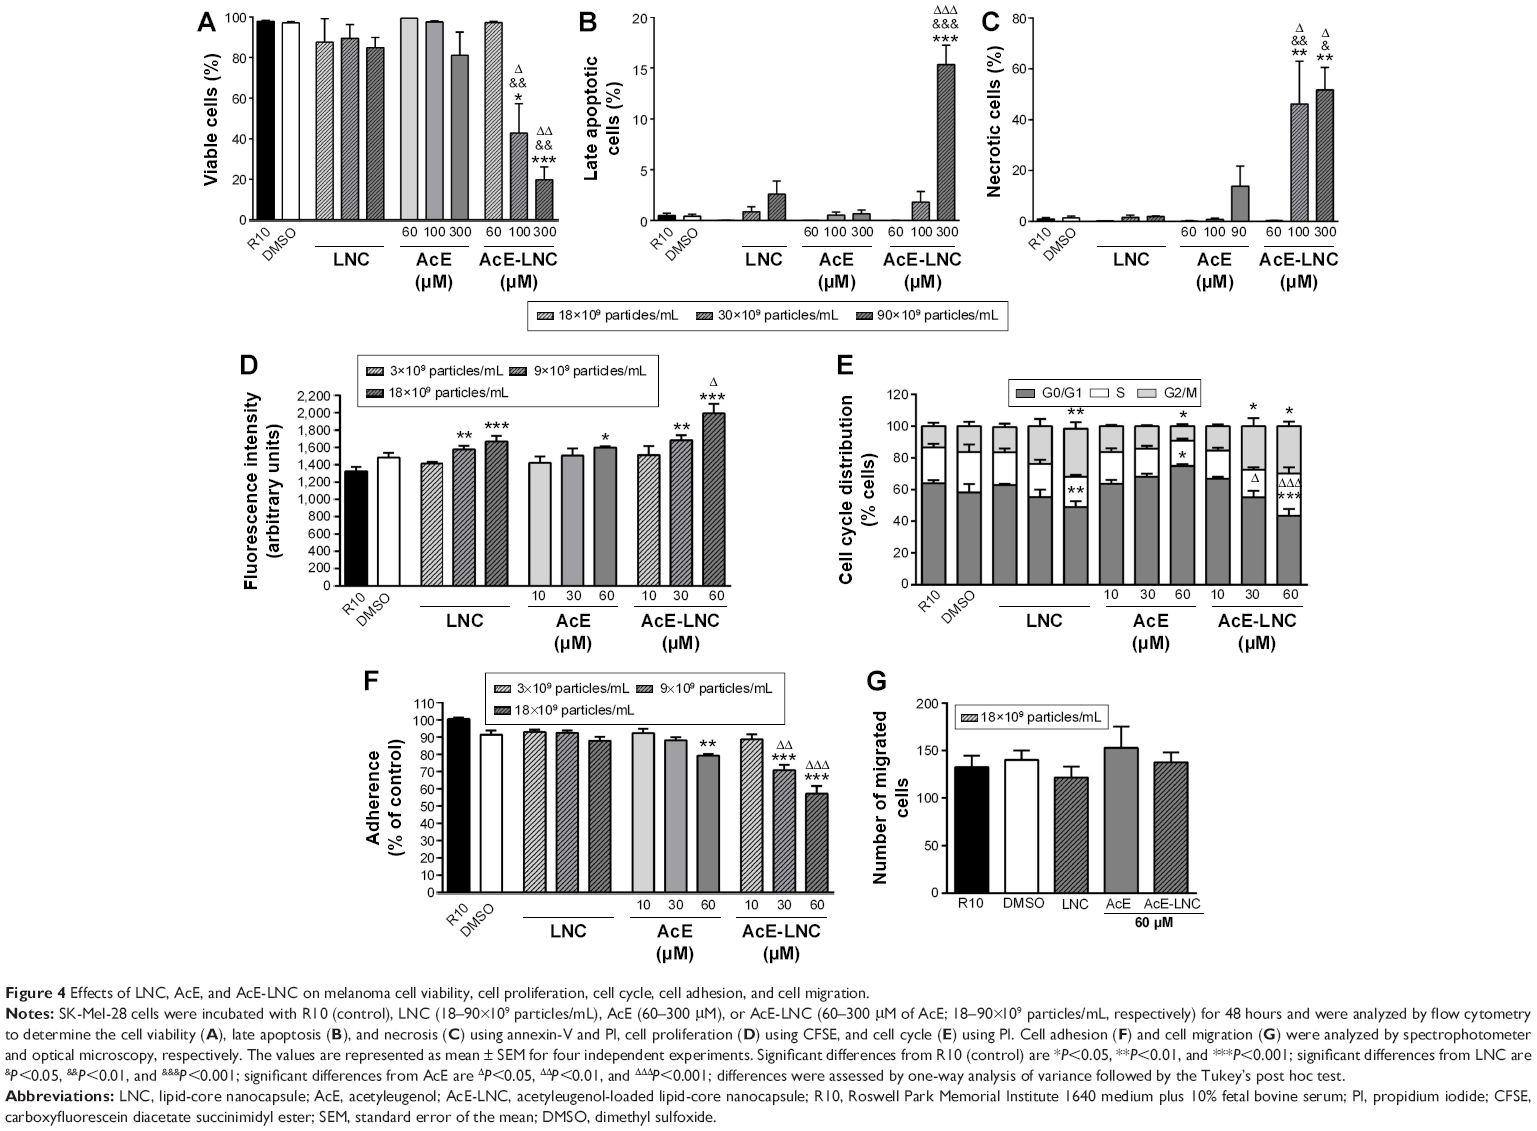 | Figure 4 Effects of LNC, AcE, and AcE-LNC on melanoma cell viability, cell proliferation, cell cycle, cell adhesion, and cell migration. |
Moreover, the efficacy of treatments on adhesion in a mimetic extracellular matrix and cell migration was evaluated, and data showed that AcE and AcE-LNC inhibited the adhesion of SK-Mel-28 (Figure 4F). Conversely, any treatment affected cell migration (Figure 4G). Cell adhesion to extravascular matrix is mainly dependent on integrin-activated focal adhesion kinase (FAK), a cytoplasmic tyrosine kinase. Activated FAK in the cell focal adhesions phosphorylates endogenous substrates to trigger multiple signaling pathways, including those involved in tumorigenesis. Overexpression and activation of FAK have been found in a variety of human cancers; therefore, inhibitors of FAK have been developed and tested in various phases of cancer.56 Hence, further experiments will be carried out to elucidate the interference of AcE-LNC on cascade of integrin-activated FAS.
LNC and AcE-LNC enhance NO in the SK-Mel-28 supernatant
NO is produced by expression and activity of the three isoforms of NO synthases (NOSs), differently expressed in physiological and pathological conditions.57,58 Dichotomous effects of NO have been observed on important processes of cancer biology such as proliferation, apoptosis, migration, invasion, and angiogenesis.59 Nevertheless, it has been shown that NO effects depend on the source and concentration of the gas in the tumor area, affecting the cancer and surrounding cells.58 In cancer models, low levels of NO (<100 nM) generated by eNOS increase proliferation and angiogenesis, and higher levels of NO produced by iNOS (>500 nM) cause DNA damage, oxidative stress, cytotoxicity, and apoptosis of cancer cells.59 Our data showed that LNC or AcE-LNC treatments enhanced the NO concentration in the supernatant of SK-Mel-28, providing ~500 nM for 24 hours (Figure 5A). Nevertheless, the higher amount of the gas was not due to enhanced eNOS or iNOS enzyme expression (Figure 5B). Interestingly, pharmacological treatment with L-NAME, a false and nonspecific substrate for NOS enzymes,60 did not reduce the amount of NO2− in the supernatant of LNC- or AcE-LNC-incubated SK-Mel-28 (Figure 5A), suggesting a complex mechanism of LNC on generation or degradation of reactive nitrogen species (RNS). It is important to note that L-NAME treatment was efficient in reducing the amount of NO in the SK-Mel-28 cells incubated with the culture medium (Figure 5A).
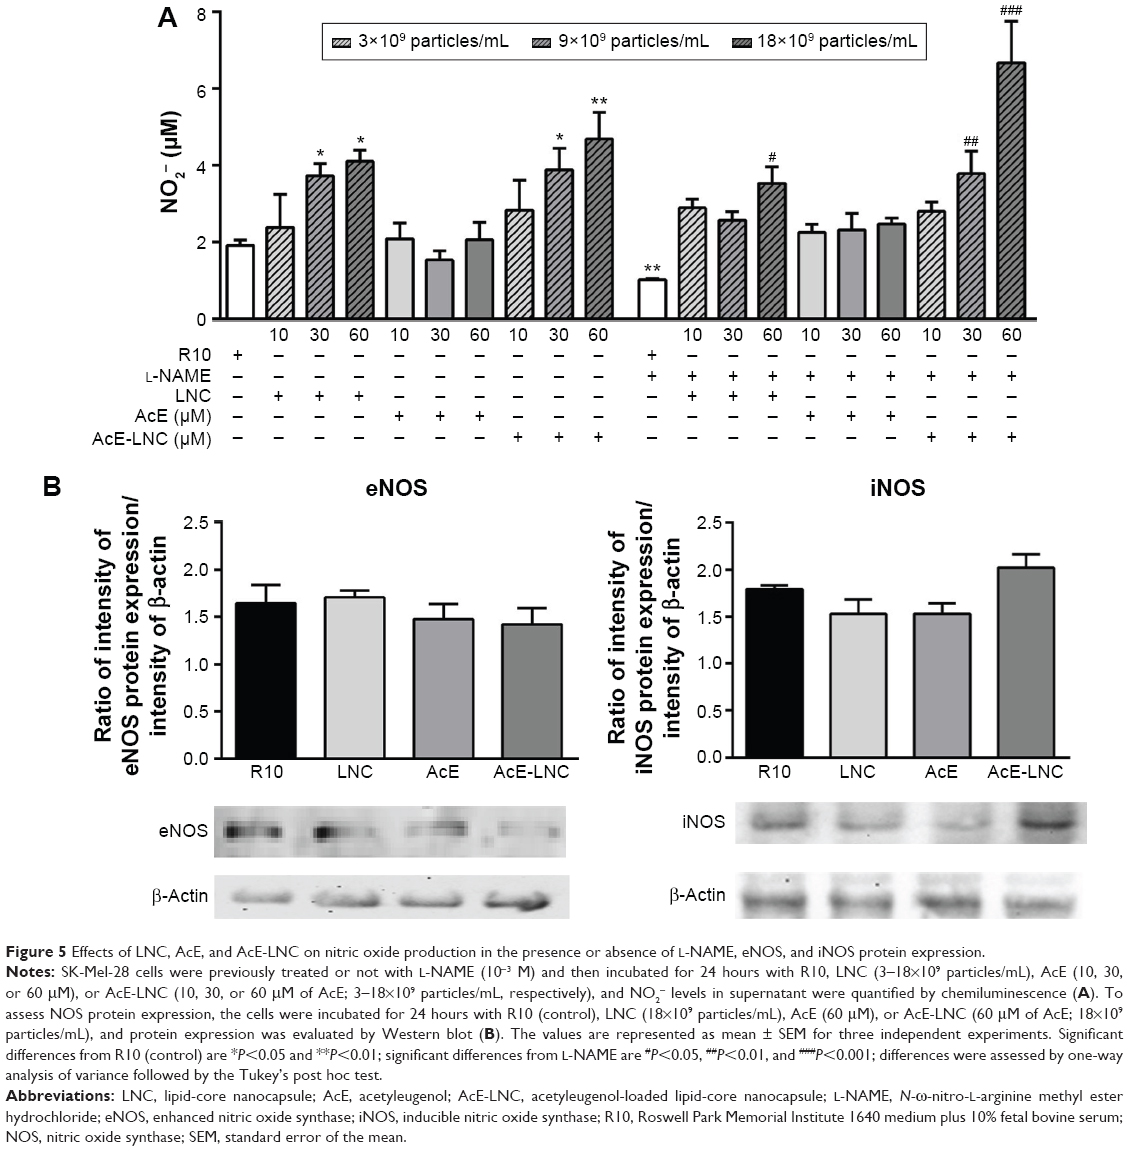 | Figure 5 Effects of LNC, AcE, and AcE-LNC on nitric oxide production in the presence or absence of L-NAME, eNOS, and iNOS protein expression. |
Recent data published by our group show that LNC acts as an antioxidant agent.61–63 It is beyond question that involvement of reactive oxygen species (ROS) and RNS affects melanoma induction and development, but the complexity of actions has generated conflicting data.64–66 Therefore, we will make efforts to characterize the mechanisms of LNC on ROS and RNS systems and to establish the real role of ROS/RNS balance and its involvement in the toxicity of LNC on melanoma cells.
Ip or oral LNC treatment inhibits the melanoma development
Because we have shown the toxicity of LNC or AcE-LNC treatment on melanoma cell lineage, we translate our studies to in vivo system using a mouse melanoma model induced by subcutaneous injection of B16F10 cells into C57Bl6 mice. This model has been fully employed, as the tumor invades the tissue and develops in ~5–10 days.44 In fact, in our laboratory, we detected apparent tumors in the dorsal tissue around the fifth day after B16F10 injection. Therefore, treatments were carried out on third to tenth day of tumor development, since the treatments could affect the initial phases of the process.
Daily ip or oral administrations of LNC (1×10¹² particles/day) or AcE-LNC (50 mg/kg/day; 1×10¹² particles/day), but not of AcE (50 mg/kg/day), inhibited the melanoma development (Figure 6A–D). Moreover, higher number of necrotic cells were detected in the tumor mass of LNC- or AcE-LNC-treated mice (Figure 6E). Nevertheless, animals treated with LNC or AcE-LNC by ip route lost weight (Figure S3A) and ingested less food (Figure S3B) during the period of treatment compared to saline-treated mice. Indeed, necropsy of the animals at the end of treatments showed agglomeration of LNC or AcE-LNC on the tissues of the abdominal cavity (Figure S3B), which may contribute to the systemic toxic effects of ip injection. Indeed, Bulcão et al67 showed similar peritoneal LNC accumulation in rats after local injection of LNC (72.12×10¹² LNC/kg). It may be surmised that the clearance systems in the peritoneal cavity, as lymph node draining and macrophages engulfment, are not sufficient to clear daily injections of LNCs. It is important to emphasize that macrophages engulfs LNCs, as shown by our group.52,53 Conversely, LNC or AcE-LNC oral treatment did not cause toxicity, as demonstrated by normal body weight (Figure S3C), food intake (Figure S3D), and normal hematological and biochemical parameters (Table 1). Only a slight reduction in the number of circulating lymphocytes was evoked by LNC or AcE-LNC treatments (Table 1). Furthermore, LNC or AcE-LNC treatment by oral route did not cause any histological changes in the stomach, liver, kidneys, or duodenum (data not shown).
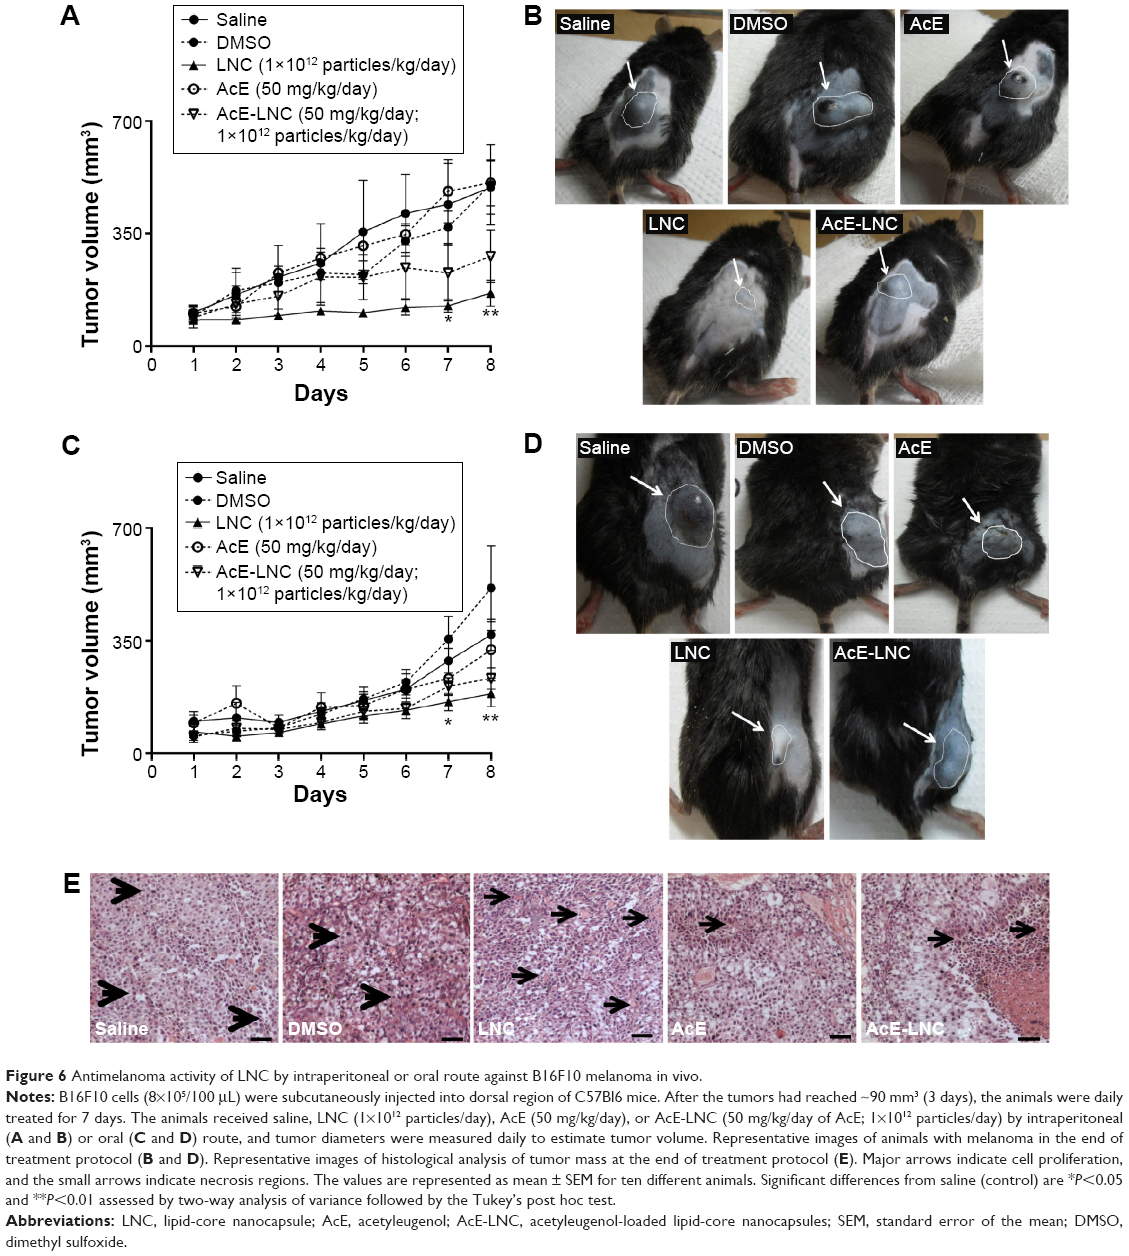 | Figure 6 Antimelanoma activity of LNC by intraperitoneal or oral route against B16F10 melanoma in vivo. |
 | Table 1 Hematological and biochemical parameters after oral administration of LNC for 7 days |
The effectiveness of LNC by oral route had already been shown by our group, using LNC carrying tacrolimus to evaluate the immunosuppressive activity68 and indomethacin ester to treat glioblastoma.69 In the latter study, conanoencapsulation of indomethacin and indomethacin ester (IndOH + IndOEt-LNC) avoided the adverse gastric effect caused by oral treatment with an equivalent amount of commercial indomethacin in aqueous solution (IndOH). Furthermore, IndOH + IndOEt-LNC are absorbed intact by oral route crossing the blood–brain barrier,69 corroborating that LNC may be an effective carrier of different drugs. Here, we confirm that LNC is absorbed by oral route, and it is distributed to target tissues, because melanoma development was reduced by gavage treatment with LNC or AcE-LNC. Moreover, our data highlight that LNC is not only a drug carrier but also displays in vivo biological activities, as already detected in in vitro experiments. Surprisingly, the oral administration of LNC was more efficient to treat the development of melanoma than AcE-LNC. It was supposed that AcE could act as a prodrug releasing eugenol after its hydrolysis as determined for IndOEt-LNC.70 CCT has been widely used to prepare nanocapsule formulations.68,71,72 Lipid emulsions prepared with CCT can reduce oxidative stress, immune response, and even inflammatory processes.73,74 Hence, we supposed that CCT in the LNC could be responsible for the anticarcinogenic activity here observed. To test our hypothesis, we treated mice with equivalent concentrations of CCT than those used in the LNC. Our data excluded the therapeutic effect of nonencapsulated CCT on melanoma growth when administered by oral route, as shown in Figure 7A and B. Additionally, CCT-treated animals did not show change in body weight nor presented lesser food intake (Figure S4A and B). Therefore, we suppose that the supramolecular structure of the LNCs could be responsible for the therapeutic effects. Furthermore, the partial substitution of CCT by AcE in the formulation promoted the interaction of AcE with PCL, affecting the crystallinity of the polymer wall, and as a consequence, the interface properties of the nanocapsules. The different surface characteristics of LNC and AcE-LNC may be responsible for the lower therapeutic efficacy of the AcE-LNC. Indeed, recent studies have shown the biological activity of drug-free nanoparticles. The first reported the antioxidant effects of LNC in a lipid peroxidation model,63 and the other showed the action of drug-free chitosan-coated poly(iso-butyl cyanoacrylate) nanoparticles against Trichomonas vaginalis.75 Hence, results herein highlight that the molecular interactions between the constituents of LNC affect the supramolecular structure as well as its physicochemical characteristics. Moreover, our data show that the supramolecular structure induces melanoma toxicity and impairs development of the tumor in a mouse model.
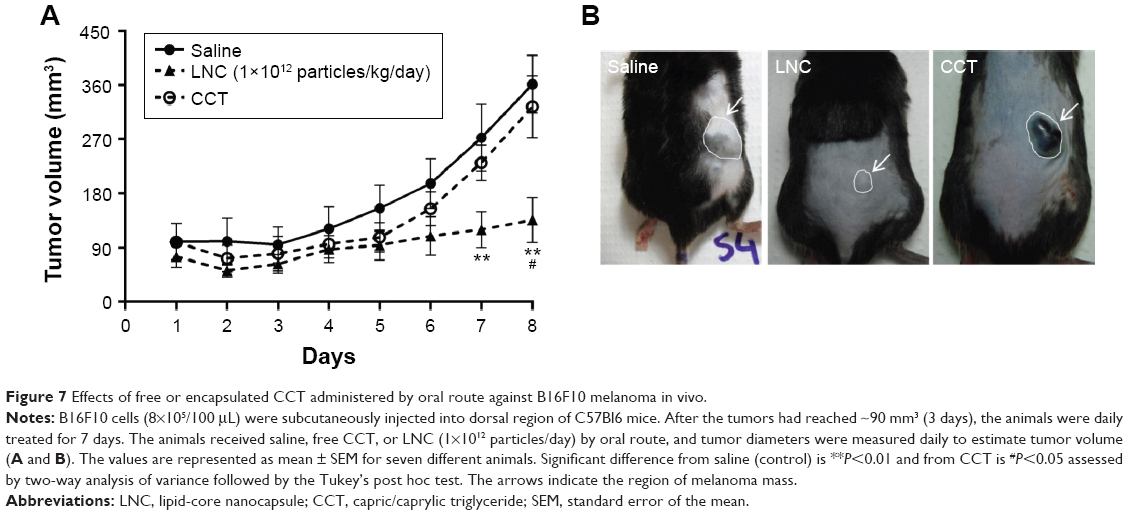 | Figure 7 Effects of free or encapsulated CCT administered by oral route against B16F10 melanoma in vivo. |
Conclusion
We demonstrate in this study that the supramolecular structure of LNC determines melanoma toxicity and the therapeutic effectiveness of LNC oral treatment on tumor development in an experimental model, conferring novel therapeutic mechanisms to LNC than only as a drug delivery system. Furthermore, we indicate the use of DSC analysis instead of classical swelling experiments to investigate the chemical interactions among the molecular and macromolecular components of the nanoparticles to establish a model of the supramolecular structure of the nanocarrier. Therefore, our data open new avenues to the study of LNC as a promising carrier in cancer treatment.
Acknowledgments
This work was supported by grants from São Paulo Research Foundation (FAPESP, São Paulo), National Counsel of Technological and Scientific Development (CNPq, Brasília), and Coordination of Improvement of Higher Education Personnel (CAPES, Brasília). The authors thank Dr Viviane Ferraz de Paula and Dr Francisco Rafael Martins Laurindo for technical assistance with histological and NO analysis, respectively, and Paula Raddatz for technical assistance with LNC and AcE-LNC preparation.
Disclosure
Carine C Drewes, Celina G Bexiga, Mayara K Uchiyama were fellows from FAPESP (projects 2010/19802-1, 12/01257-2, 10/50072-0). Luana A Fiel is a fellow from National Counsel of Technological and Scientific Development (CNPq). Bruno Cogliati, Koiti Araki, Adriana R Pohlmann, Sílvia S Guterres, and Sandra HP Farsky are research fellows from CNPq. The authors report no conflicts of interest. The authors alone are responsible for the content and writing of this paper. The authors have no relevant affiliations or financial involvement with any organization or entity with a financial interest in or financial conflict with the subject matter or materials discussed in the manuscript. This includes employment, consultancies, honoraria, stock ownership or options, expert testimony, grants or patents received or pending, or royalties. No writing assistance was used in producing this manuscript.
References
American Cancer Society [homepage on the internet]. Atlanta: American Cancer Society [updated October 2015; cited October 2015]. Available from: http://www.cancer.org/index. Accessed October 2015. | ||
Cancer Research UK [homepage on the internet]. London: Cancer Research UK [updated June 2015; cited June 2015]. Available from: http://www.cancerresearchuk.org/. Accessed June 2015. | ||
National Cancer Institute [homepage on the internet]. Rockville: National Cancer Institute – NIH [updated April 2015; cited April 2015]. Available from: http://www.cancer.gov/. Accessed April 2015. | ||
Baglole CJ, Ray DM, Bernstein SH, et al. More than structural cells, fibroblasts create and orchestrate the tumor microenvironment. Immunol Invest. 2006;35(3–4):297–325. | ||
Mantovani A, Allavena P, Sica A, Balkwill F. Cancer-related inflammation. Nature. 2008;454(7203):436–444. | ||
Braeuer RR, Watson IR, Wu CJ, et al. Why is melanoma so metastatic? Pigment Cell Melanoma Res. 2014;27(1):19–36. | ||
Ascierto PA, Grimaldi AM, Anderson AC, et al. Future perspectives in melanoma research: meeting report from the “Melanoma Bridge”, Napoli, December 5th–8th 2013. J Transl Med. 2014;12:277. | ||
Bei D, Meng J, Youan BB. Engineering nanomedicines for improved melanoma therapy: progress and promises. Nanomedicine (Lond). 2010;5(9):1385–1399. | ||
Li J, Wang Y, Liang R, et al. Recent advances in targeted nanoparticles drug delivery to melanoma. Nanomedicine. 2015;11(3):769–794. | ||
Hwang TL, Lee WR, Hua SC, Fang JY. Cisplatin encapsulated in phosphatidylethanolamine liposomes enhances the in vitro, cytotoxicity and in vivo, intratumor drug accumulation against melanomas. J Dermatol Sci. 2007;46(1):11–20. | ||
Bedikian AY, Vardeleon A, Smith T, Campbell S, Namdari R. Pharmacokinetics and urinary excretion of vincristine sulfate liposomes injection in metastatic melanoma patients. J Clin Pharmacol. 2006;46(7):727–737. | ||
Banciu M, Metselaar JM, Schiffelers RM, Storm G. Liposomal glucocorticoids as tumor-targeted anti-angiogenic nanomedicine in B16 melanoma-bearing mice. J Steroid Biochem Mol Biol. 2008;111(1–2):101–110. | ||
Mitrus I, Sochanik A, Cichon T, Szala S. Combination of combretastatin A4 phosphate and doxorubicin-containing liposomes affects growth of B16–F10 tumors. Acta Biochim Pol. 2009;56(1):161–165. | ||
Vannucci L, Fiserova A, Sadalapure K, et al. Effects of N-acetyl-glucosamine-coated glycodendrimers as biological modulators in the B16F10 melanoma model in vivo. Int J Oncol. 2003;23(2):285–296. | ||
Schilrreff P, Mundiña-Weilenmann C, Romero EL, Morilla MJ. Selective cytotoxicity of PAMAM G5 core – PAMAM G2.5 shell tecto-dendrimers on melanoma cells. Int J Nanomed. 2012;7:4121–4133. | ||
Liao J, Wang C, Wang Y, Luo F; Qian F. Recent advances in formation, properties, and applications of polymersomes. Curr Pharm Des. 2012; 18(23):3432–3441. | ||
Pegoraro C, Cecchin D, Gracia LS, et al. Enhanced drug delivery to melanoma cells using PMPC-PDPA polymersomes. Cancer Lett. 2013;334(2):328–337. | ||
Chaudhuri P, Soni S, Sengupta S. Single-walled carbon nanotube conjugated chemotherapy exhibits increased therapeutic index in melanoma. Nanotechnology. 2010;21(2):025102. | ||
Chen J, Shao R, Zhang XD, Chen C. Applications of nanotechnology for melanoma treatment, diagnosis, and theranostics. Int J Nanomed. 2013;8:2677–2688. | ||
Fink W, Zimpfer-Rechner C, Thoelke A, et al. Clinical phase II study of pegylated liposomal doxorubicin as second-line treatment in disseminated melanoma. Onkologie. 2004;27(6):540–544. | ||
Hersh EM, O’Day SJ, Ribas A, et al. A phase 2 clinical trial of nabpaclitaxel in previously treated and chemotherapy-naive patients with metastatic melanoma. Cancer. 2010;116(1):155–163. | ||
Montana M, Ducros C, Verhaeghe P, Terme T, Vanelle P, Rathelot P. Albumin-bound paclitaxel: the benefit of this new formulation in the treatment of various cancers. J Chemother. 2011;23(2):59–66. | ||
Ramishetti S, Huang L. Intelligent design of multifunctional lipid-coated nanoparticle platforms for cancer therapy. Ther Deliv. 2012;3(12):1429–1445. | ||
Frank LA, Contri RV, Beck RC, Pohlmann AR, Guterres SS. Improving drug biological effects by encapsulation into polymeric nanocapsules. Wiley Interdiscip Rev Nanomed Nanobiotechnol. 2015;7(5):623–639. | ||
Pohlmann AR, Fonseca FN, Paese K, et al. Poly(ε-caprolactone) microcapsules and nanocapsules in drug delivery. Expert Opin Drug Deliv. 2013;10(5):623–638. | ||
Pisano M, Pagnan G, Loi M, et al. Antiproliferative and pro-apoptotic activity of eugenol-related biphenyls on malignant melanoma cells. Mol Cancer. 2007;6(8):1–12. | ||
Jaganathan SK, Supriyanto E. Antiproliferative and molecular mechanism of eugenol-induced apoptosis in cancer cells. Molecules. 2012;17(6):6290–6304. | ||
Courrèges MC, Benencia F. In vitro antiphagocytic effect of basil oil on mouse macrophages. Fitoterapia. 2002;73(5):369–374. | ||
Kalemba D, Kunicka A. Antibacterial and antifungal properties of essential oils. Curr Med Chem. 2003;10(10):813–829. | ||
Braga PS, Sasso MD, Culici M, Alfieri M. Eugenol and thymol, alone or in combination, induce morphological alterations in the envelope of Candida albicans. Fitoterapia. 2007;78(6):396–400. | ||
Kaur G, Athar M, Alam MS. Eugenol precludes cutaneous chemical carcinogenesis in mouse by preventing oxidative stress and inflammation and by inducing apoptosis. Mol Carcinog. 2010;49(3):290–301. | ||
Park BS, Song YS, Yee SB, et al. Phospho-ser 15-p53 translocates into mitochondria and interacts with Bcl-2 and Bcl-xL in eugenol-induced apoptosis. Apoptosis. 2005;10:193–200. | ||
Shin SH, Park JH, Kim GC, Park BS, Gil YG, Kim CH. The mechanism of apoptosis induced by eugenol in human osteosarcoma cells. J Korean Oral Maxillofac Surg. 2007;33(1):20–27. | ||
Okada N, Hirata A, Murakami Y, Shoji M, Sakagami H, Fujisawa S. Induction of cytotoxicity and apoptosis and inhibition of cyclooxygenase-2 gene expression by eugenol-related compounds. Anticancer Res. 2005;25(5):3263–3269. | ||
Yoo CB, Han KT, Cho KS, et al. Eugenol isolated from the essential oil of Eugenia caryophyllata induces a reactive oxygen species-mediated apoptosis in HL-60 human promyelocytic leukemia cells. Cancer Lett. 2005;225(1):41–52. | ||
Jaganathan SK, Mazumdar A, Mondhe D, Mandal M. Apoptotic effect of eugenol in human colon cancer cell lines. Cell Biol Int. 2011;35(6):607–615. | ||
Ghosh R, Nadiminty N, Fitzpatrick JE, Alworth WL, Slaga TJ, Kumar AP. Eugenol causes melanoma growth suppression through inhibition of E2F1 transcriptional activity. J Biol Chem. 2005;280(7) :5812–5819. | ||
Jager E, Venturini CG, Poletto FS, et al. Sustained release from lipid-core nanocapsules by varying the core viscosity and the particle surface area. J Biomed Nanotechnol. 2009;5(1):130–140. | ||
Li Y-H, Sun Z-H, Zheng P. Determination of vanillin, eugenol and isoeugenol by RP-HPLC. Chromatographia. 2004;60(11/12):709–713. | ||
International Conference on Harmonization of Technical Requirements for Registration of Pharmaceuticals for Human use. ICH Harmonized Tripartite Guideline – Guideline for Good Clinical Practice – E6(R1). Current Step 4 Version. June 10, 1996. | ||
Drewes CC, Dias RY, Branco VG, et al. Post-transcriptional control of Amblyomin-X on secretion of vascular endothelial growth factor and expression of adhesion molecules in endothelial cells. Toxicon. 2015;101:1–10. | ||
Baylis C, Vallance P. Measurement of nitrite and nitrate levels in plasma and urine – what does this measure tell us about the activity of the endogenous nitric oxide system? Curr Opin Nephrol Hypertens. 1998;7(1):59–62. | ||
Degaki TL, Demasi MAA, Sogayar MC. Overexpression of Nrp/b (nuclear restrict protein in brain) suppresses the malignant phenotype in the C6/ST1 glioma cell line. J Steroid Biochem Mol Biol. 2009;117(4–5):107–116. | ||
Overwijk WW, Restifo NP. B16 as a mouse model for human melanoma. Curr Protoc Immunol. 2001;Chapter 20:Unit 20.1. | ||
Venturini CG, Jäger E, Oliveira CP, et al. Formulation of lipid core nanocapsules. Colloids Surf A Physicochem Eng Aspects. 2011;375(1–3): 200–208. | ||
Oliveira C, Venturini CG, Donida B, Poletto SF, Guterres SS, Pohlmann AR. An algorithm to determinate the mechanism of drug distribution in lipid-core nanocapsule formulations. Soft Matter. 2013;9(4):1141–1150. | ||
Guterres SS, Weiss V, de Luca Freiras L, Pohlmann AR. Influence of benzyl benzoate as oil core on the physicochemical properties of spray-dried powders from polymeric nanocapsules containing indomethacin. Drug Deliv. 2000;7(4):195–199. | ||
Fiel LA. Desenvolvimento de nanocápsulas de núcleo lipídico com uso potencial no tratamento de tumores sólidos [Lipid core nanocapsules: The influence of the nanostructure and surface area to the biological response in vitro]. [thesis]. Accra: Federal University of Rio Grande do Sul; 2013. Portuguese. | ||
Kreuter J. Application of nanoparticles for the delivery of drugs to the brain. Int Congr Ser. 2005;1277:85–94. | ||
Jornada DS, Friedrich RB, Ferrarini S, et al. Lipid-core nanocapsules: reducing the aqueous phase volume to increase encapsulation efficiency and to reduce the energy and time consuming of the production process. J Colloid Sci Biotechnol. 2015;4(1):79–85. | ||
Zhao F, Zhao Y, Liu Y, et al. Cellular uptake, intracellular trafficking, and cytotoxicity of nanomaterials. Small. 2011;7(10):1322–1337. | ||
Fiel LA, Contri RV, Bica JF, et al. Labeling the oily core of nanocapsules and lipid-core nanocapsules with a triglyceride conjugated to a fluorescent dye as a strategy to particle tracking in biological studies. Nanoscale Res Lett. 2014;9(1):233. | ||
Poletto FS, Fiel LA, Lopes MV, et al. Fluorescent-labeled poly(ε-caprolactone) lipid-core nanocapsules: synthesis, physicochemical properties and macrophage uptake. J Colloid Sci Biotechnol. 2012;1:89–98. | ||
Charão MF, Baierle M, Gauer B, et al. Protective effects of melatonin-loaded lipid-core nanocapsules on paraquat-induced cytotoxicity and genotoxicity in a pulmonary cell line. Mutat Res Genet Toxicol Environ Mutagen. 2015;784–785:1–9. | ||
Danilov AV, Danilova OV, Huber BT. Cell cycle control and adhesion signaling pathways in the development of metastatic melanoma. Cancer Metastasis Rev. 2008;27(4):707–714. | ||
Sulzmaier FJ, Jean C, Schlaepfer DD. FAK in cancer: mechanistic findings and clinical applications. Nat Rev Cancer. 2014;14(9): 598–610. | ||
Wink DA, Vodovotz Y, Laval J, Laval F, Dewhirst MW, Mitchell JB. The multifaceted roles of nitric oxide in cancer. Carcinogenesis. 1998;19(5):711–721. | ||
Fukumura D, Kashiwagi S, Jain RK. The role of nitric oxide in tumour progression. Nat Rev Cancer. 2006;6(7):521–534. | ||
Burke AJ, Sullivan FJ, Giles FJ, Glynn SA. The yin and yang of nitric oxide in cancer progression. Carcinogenesis. 2013;34(3):503–512. | ||
Pfeiffer S, Leopold E, Schmidt K, Brunner F, Mayer B. Inhibition of nitric oxide synthesis by NG-nitro-L-arginine methyl ester (L-NAME): requirement for bioactivation to the free acid, NG-nitro-L-arginine. Br J Pharmacol. 1996;118(6):1433–1440. | ||
Bueno K, Adorne MD, Jornada DS, da Fonseca FN, Guterres SS, Pohlmann AR. In vivo gastroprotective effect of nanoparticles: influence of chemical composition and volume fraction. Curr Pharm Des. 2013;19(41):7294–7300. | ||
Külkamp IC, Rabelo BD, Berlitz SJ, et al. Nanoencapsulation improves the in vitro antioxidant activity of lipoic acid. J Biomed Nanotechnol. 2011;7(4):598–607. | ||
Bender EA, Cavalcante MF, Adorne MD, et al. New strategy to surface functionalization of polymeric nanoparticles: one-pot synthesis of scFv anti-LDL(-)-functionalized nanocapsules. Pharm Res. 2014;31(11):2975–2987. | ||
Bauer G. Increasing the endogenous NO level causes catalase inactivation and reactivation of intercellular apoptosis signaling specifically in tumor cells. Redox Biol. 2015;6:353–371. | ||
Venza M, Visalli M, Beninati C, De Gaetano GV, Teti D, Venza I. Cellular mechanisms of oxidative stress and action in melanoma. Oxid Med Cell Longev. 2015;2015:481782. | ||
Piskounova E, Agathocleous M, Murphy MM, Hu Z, et al. Oxidative stress inhibits distant metastasis by human melanoma cells. Nature. 2015;527(7577):186–191. | ||
Bulcão RP, Freitas FA, Venturini CG, et al. Acute and subchronic toxicity evaluation of poly(epsilon-caprolactone) lipid-core nanocapsules in rats. Toxicol Sci. 2013;132(1):162–176. | ||
Friedrich RB, Dimer FA, Guterres SS, Beck RC, Pohlmann AR. Nanoencapsulation of tacrolimus in lipid-core nanocapsules showed similar immunosuppressive activity after oral and intraperitoneal administrations. J Biomed Nanotechnol. 2014;10(8):1599–1609. | ||
Rodrigues SF, Fiel LA, Shimada ALB, et al. Lipid-core nanocapsules act as a drug shuttle through the blood brain barrier and reduce glioblastoma after intravenous or oral administrations. J Biomed Nanotechonol. In press 2016. | ||
Cattani VB, Fiel LA, Jager A, et al. Lipid-core nanocapsules restrained the indomethacin ethyl ester hydrolysis in the gastrointestinal lumen and wall acting as mucoadhesive reservoirs. Eur J Pharm Sci. 2010;39(1–3):116–124. | ||
Guterres SS, Fessi H, Barratt G, Puisieux F, Devissaguet JP. Poly(D,L-lactide) nanocapsules containing non-steroidal anti-inflammatory drugs: gastrointestinal tolerance following intravenous and oral administration. Pharm Res. 1995;12(10):1545–1547. | ||
Teixeira M, Alonso MJ, Pinto MM, Barbosa CM. Development and characterization of PLGA nanospheres and nanocapsules containing xanthone and 3-methoxyxanthone. Eur J Pharm Biopharm. 2004;59(3):491–500. | ||
Lima TM, Kanunfre CC, Pompéia C, Verlengia R, Curi R. Ranking the toxicity of fatty acids on Jurkat and Raji cells by flow cytometric analysis. Toxicol In Vitro. 2002;16(6):741–747. | ||
Calder PC, Jensen GL, Koletzko BV, Singer P, Wanten GJ. Lipid emulsions in parenteral nutrition of intensive care patients: current thinking and future directions. Intensive Care Med. 2010;36(5):735–749. | ||
Pradines B, Bories C, Vauthier C, Ponchel G, Loiseau PM, Bouchemal K. Drug-free chitosan coated poly(isobutylcyanoacrylate) nanoparticles are active against trichomonas vaginalis and non-toxic towards pig vaginal mucosa. Pharm Res. 2015;32(4):1229–1236. |
Supplementary materials
Methods
Infrared spectrum
Fourier transform infrared spectroscopy was performed on a Varian® 640-IR spectrophotometer (Varian, Palo Alto, CA, USA) from 4,000 to 400 cm−1 (100 scans, 2 cm−1 resolution), using sodium chloride crystals.
Swelling profiles
Films were produced by dissolving poly(ε-caprolactone) (PCL) (PCL114:PCL14, 90:10, w/w) in chloroform followed by evaporation. Pieces were cut (0.100 g) and immersed into few milliliters of oily mixtures of eugenol and capric/caprylic triglyceride (CCT), or acetyleugenol (AcE) and CCT (ratios 1:9 or 1:1, w/w) for 60 days. Swelling was determined observing weight changes as a function of time (0, 3, 7, 15, 30, and 60 days). Each piece was removed from the liquid and put on a filter paper; the excess oil was gently cleaned, and the piece weighed (Scientech SA 210 analytical balance; Scientech Inc.). The experiment was performed in triplicate of batches for each liquid (pure substances or oily mixtures).
In vivo tumorigenesis assay
A murine B16F10 (H2b) variant of the B16 melanoma cell line originated from C57Bl6 mice was used in the experiments. Cell viability was determined by the Trypan Blue exclusion test, which showed that >95% of the cells were viable. B16F10 cells (8×10⁵/100 μL) were suspended in Roswell Park Memorial Institute 1640 medium plus 10% fetal bovine serum and were injected subcutaneously into flank regions of mice to induce tumor formation. To assess the effects of treatments on early steps of melanoma development, 3 days after injection of cells, the animals were treated with saline, dimethyl sulfoxide (AcE vehicle, 2%), lipid-core nanocapsules (LNC) (1×10¹² particles/day), AcE (50 mg/kg/day), AcE-LNC (50 mg/kg/day of AcE; 1×10¹² particles/day), or CCT (30 μL plus 220 μL of saline), according to each experimental goal, by intraperitoneal or oral route, and treatments were continued for 7 days. The weight of animals and food intake were measured daily, during all treatments.
Results
Results are presented in Figures S1–S4.
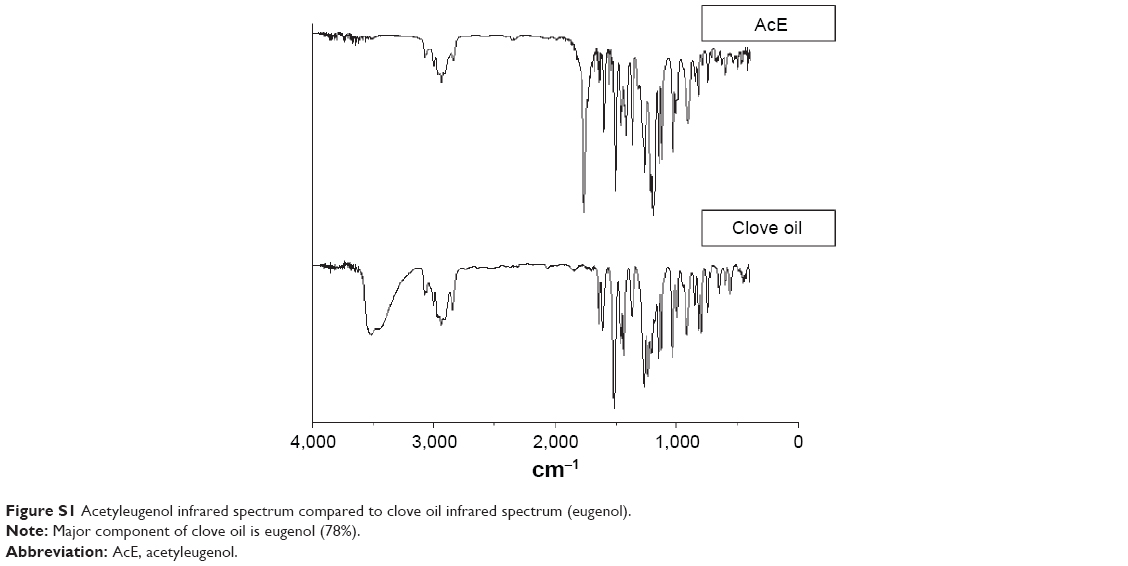 | Figure S1 Acetyleugenol infrared spectrum compared to clove oil infrared spectrum (eugenol). |
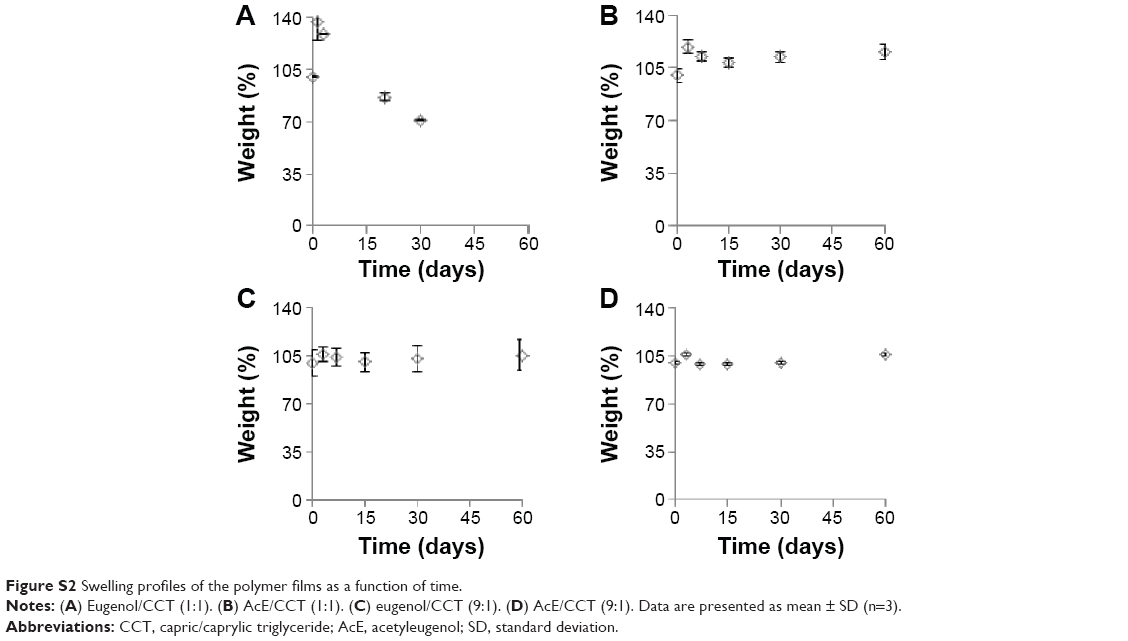 | Figure S2 Swelling profiles of the polymer films as a function of time. |
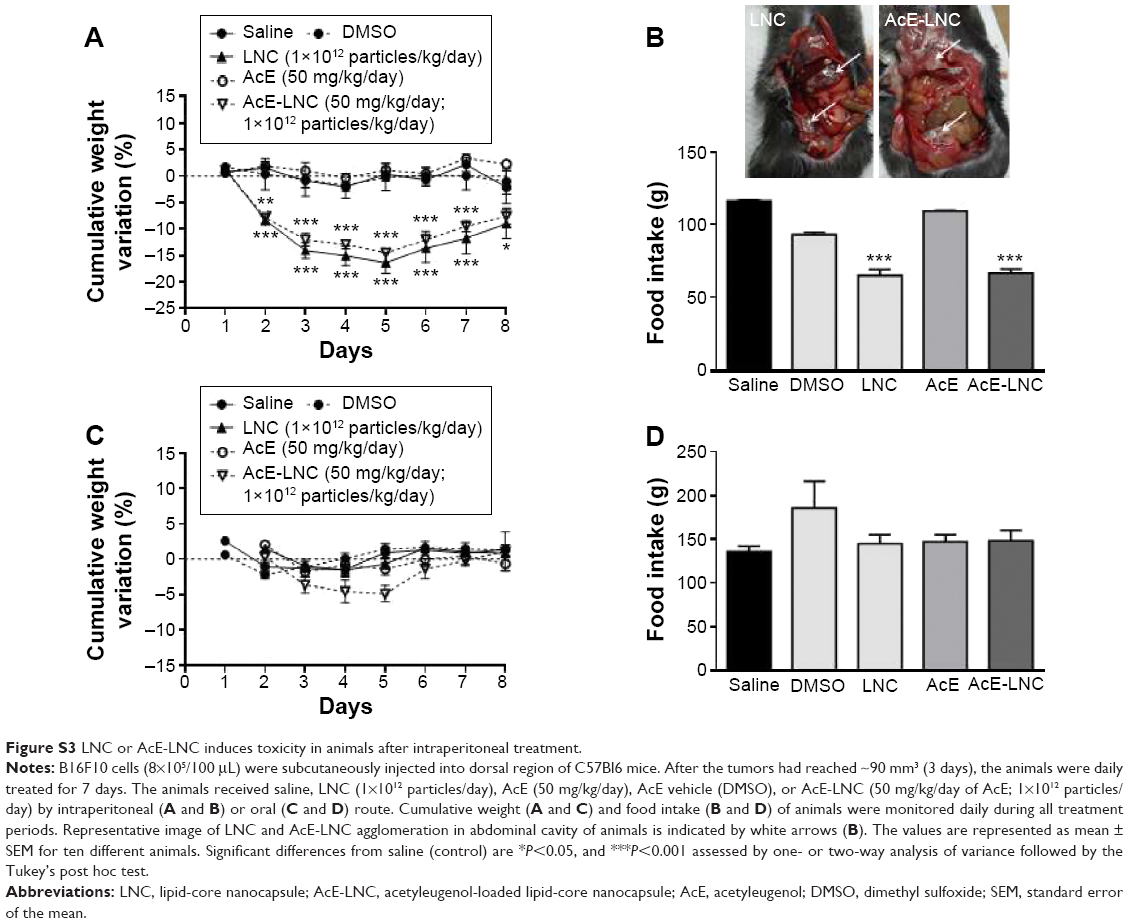 | Figure S3 LNC or AcE-LNC induces toxicity in animals after intraperitoneal treatment. |
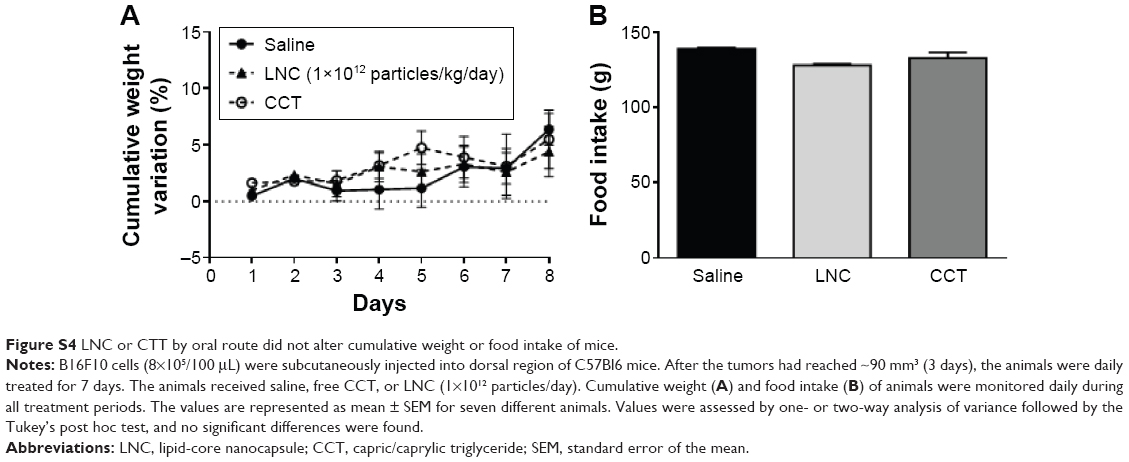 | Figure S4 LNC or CTT by oral route did not alter cumulative weight or food intake of mice. |
 © 2016 The Author(s). This work is published and licensed by Dove Medical Press Limited. The full terms of this license are available at https://www.dovepress.com/terms.php and incorporate the Creative Commons Attribution - Non Commercial (unported, v3.0) License.
By accessing the work you hereby accept the Terms. Non-commercial uses of the work are permitted without any further permission from Dove Medical Press Limited, provided the work is properly attributed. For permission for commercial use of this work, please see paragraphs 4.2 and 5 of our Terms.
© 2016 The Author(s). This work is published and licensed by Dove Medical Press Limited. The full terms of this license are available at https://www.dovepress.com/terms.php and incorporate the Creative Commons Attribution - Non Commercial (unported, v3.0) License.
By accessing the work you hereby accept the Terms. Non-commercial uses of the work are permitted without any further permission from Dove Medical Press Limited, provided the work is properly attributed. For permission for commercial use of this work, please see paragraphs 4.2 and 5 of our Terms.