")
Back to Journals » Medical Devices: Evidence and Research » Volume 12
Novel optical biosensor method to identify human blood types using free space frequency modulated wave of NIR photon technology
Authors Sultan E, Albahrani M, Alostad J , Ebraheem HK, Alnaser M, Alkhateeb N
Received 29 July 2018
Accepted for publication 14 November 2018
Published 27 December 2018 Volume 2019:12 Pages 9—20
DOI https://doi.org/10.2147/MDER.S181796
Checked for plagiarism Yes
Review by Single anonymous peer review
Peer reviewer comments 2
Editor who approved publication: Dr Scott Fraser
Ebraheem Sultan,1 Mariam Albahrani,2 Jasem Alostad,3 Hameed K Ebraheem,1 Mahmud Alnaser,1 Nizar Alkhateeb1
1Department of Electronic Engineering Technology, College of Technological Studies (CTS), The Public Authority of Applied Education and Training (PAAET), State of Kuwait; 2Department of Medical Laboratory Science, College of Allied Medical Science, Kuwait University, State of Kuwait; 3Department of Computing College of Basic Studies, The Public Authority of Applied Education and Training (PAAET), Shuwaikh, State of Kuwait
Background: The free-space broadband frequency-modulated near-infrared (NIR) photon transmission and backscattering mode technique has been used in this paper as an optical biosensor method.
Purpose: The purpose is to measure, identify, and extract the optical properties of different blood types.
Patients and methods: The method depends on the measurements of broadband frequencies ranging from 30 up to 1,000 MHz to predict two important parameters related to the incident-modulated signal. Blind samples collected from 30 patients were examined using the optical NIR transmission mode system, and an additional 40 blood samples from random patients were examined using the optical NIR reflection mode system. The study is divided into two stages: The first stage is dedicated to measuring the insertion loss and insertion phase over 30–1,000 MHz in a transmission mode to characterize the behavior of modulated photons as they interact with the blood samples. The second stage is dedicated to performing noninvasive backscattering measurements using the optical band developed to match the first stage results.
Results: In this paper, we have created an indexed database using optical transmission mode measurements, and then mapped it to a reflection noninvasive measurement to identify the blood types. Then for the purpose of device accuracy, we randomly selected 480 new human subjects to measure the false-negative error percentage. This method is novel in terms of using an optical system to measure and identify blood types without collecting blood samples.
Conclusion: The novel approach shows a highly accurate method in identifying different blood types instantaneously using optical sensing for both in vitro and in vivo procedures, thereby saving time and effort.
Keywords: fNIR spectroscopy, VCSEL – optical transmitter, APD – optical receiver, insertion phase, IP, insertion loss, IL, ABO blood typing
Introduction
The typical way in which blood is typed is invasive, time-consuming, and can offer less than standardized accuracy based on differences in technicians or in the laboratories where the testing occurs. Given these drawbacks, there is a real need for a noninvasive blood typing device to be implemented instead. Manual blood grouping procedures, which have been a traditional aspect of medicine, do not take advantage of the technological advances that have been integrated across the health industry, including through the use of wearable devices to identify and monitor.1 The International Journal of Science and Research presented an article in 2016, which outlined a portable device developed by an international team of researchers, which is placed on the fingertip to count white blood cells (WBCs) without a blood test. This technology combines an optical sensor with algorithms for use on chemotherapy patients, which allows the immune system levels to be known in real time.2 This type of wearable device also has a utility in the detection of serious infections and includes a portable optical system that provides oblique illuminations through LEDs and captures images of surface capillaries under the skin at a cellular resolution. The system uses a small lens to take an image of the capillaries close to the nail bed and, if illuminated at a particular frequency, only hemoglobin in red blood cells (RBCs) can be seen to soak up light.3 Wearable devices are those that are present on the person at all times. If the monitoring of a disease could be paired with wearable devices along with enabling real-time documentation in the patients’ medical records, it would benefit both the caregivers and the patients by saving time, money, effort, and the amount of work put in by both during the health care process, hence aiding in the delivery of quality health care.
Blood cells in general contain three components: RBCs, WBCs, and platelets. All three formalize the blood cells in the human body. Each component of the blood cells has different responsibilities. RBCs carry oxygen around the body and remove carbon dioxide and other waste. WBCs are part of the immune system, which helps fight infections, and platelets are cells that circulate in the blood to prevent bleeding by clotting.4 Blood groups are identified by antigens and antibodies. Antigens are proteins located on the surface of the RBCs, while antibodies are proteins located in the plasma. Blood analysis is used usually for medical diagnosis and helps in identifying different diseases. Antigens on the RBCs determine each individual blood group and categorize them into two main groups called ABO (with blood types A, B, AB, and O) and Rh (with Rh D-positive or Rh D-negative blood types). There are many theories with regard to the functionality of blood group antigens, but their purposes are not very well-known.5 Blood typing is the task of identifying the type of the blood in a human and is a very important and common procedure that is a prerequisite for various hematological transfusions. Nonetheless, various fatalities have been reported due to errors in blood typing.5 The reason behind these fatalities is the lock-and-key mechanism of various proteins present in human blood, namely antigens and antibodies.
A certain blood type is defined based on the presence or absence of various types of these proteins. If a certain type of antigen finds the similar type of antibody, it binds to it. Otherwise, hemolysis occurs, leading to fatalities in the worst cases. Thus, blood transfusion is governed by the matching of specific proteins, as defined by each blood type. Blood typing is based on finding the antigens on the surface of RBCs.5,6 There exist various systems for blood typing; however, ABO blood typing is the most important and common. For ABO blood typing, researchers have introduced various techniques. In clinical settings, an ideal technique is the one requiring a lesser quantity of RBCs (conversely a lower quantity of blood) and giving the blood type in quite a short time (ie, within minutes.) One such technique is the antibody array technique, based on surface plasmon resonance (SPR) imaging.7 SPR is a real-time optical technique that can quantify the adsorption on a material’s surface, that is, the antigens adsorbed on the surface of RBCs. It uses the multichannel flow cell of the SPR imager.7 Five-line detection arrays were constructed using five groups of antibodies. With the difference in proteins, the surface reflectivity results in a change in SPR signal. This helps in determining the blood type in <12 minutes (for sixty 5% RBC samples). Quinn et al. have shown that biospecific interaction analysis – a popular method for studying protein interactions – can also be used for blood typing.8 This specific technique is also based on the SPR principle but the results take longer. Hayden et al. have established a technique using molecularly imprinted polymers for ABO group typing.9 Although the method is low in cost and perhaps easier to implement, it still takes much longer.
Gordon et al have invented an optical bio disc that enables the determination of blood type within 10 minutes utilizing a 10% RBC solution.10 The disc is laser-scanned in an optical drive along with a specialized computer program used for determining the blood type. Another efficient method was proposed by Kim et al. This takes 3 minutes and a 3 μL sample to determine the blood type simply with the naked eye.11 A low-cost microfluidic biochip has been developed for the said technique. The technique claims successful detection of A, B, and AB blood types but lacks any comments about the O blood type.
In this paper, a novel noninvasive method is proposed that determines the blood types within minutes. The method depends on using an optical system that consists of optical transmitters (Txs) and receivers (Rxs) that are strategically located around blood tubes or blood biomedia. This optical system operates in a frequency domain that can be used to measure two vital parameters related to the incident-modulated signal. The change in amplitude and phase of the incident photon wave that is related to the absorption and scattering by the biological media is presented in the frequency domain as insertion loss (IL) and insertion phase (IP), where IL is change in amplitude and IP is change in phase. This measurement of IL and IP requires certain hardware and testing equipment that will perform high-frequency modulation. The overall system would consist of an Automatic Network Analyzer (Anritsu MS4623B) as an RF source and a sensitive radio frequency (RF) receiver and optical transmitter and an optical receiver.12
Whenever photons with uniform optical properties are sinusoidally (frequency domain) modulated, a wave of photon density is developed that will propagate spherically into the biological matter. Next, the photons will scatter randomly in multiple paths, resulting in either absorption or scattering. To instigate this modality of the photon wave modulation, a radio frequency modulation device is required.12 There is a relational phenomenon between the photon migration at certain wavelengths and the biomatter. This can partially be explained through a basic understanding of a human organ’s need for oxygen.13 The near-infrared (NIR)-based optical behavior in biological media has shown the potential in measuring the absorption and scattering sensitivity of water, oxygenated, and deoxygenated hemoglobin at different wavelengths.13 With reference to any impact that will lead to disorder, the normal functionality of the cells or organs can be registered by the disorder in the absorption of oxygenated or deoxygenated hemoglobin, using diffused photon NIR technology.14 The location and percentage of oxygen absorbed in the relevant parts of the human body can be related to different physiological activities and can be detected using NIR optical spectroscopy. Measuring the reduction in deoxygenated hemoglobin or increase in oxygenated hemoglobin can indicate the increase in oxygenated or deoxygenated blood volume. This localizes the information related to different functionalities and could aid in earlier diagnosis of different diseases or abnormal organ or cell activities.13
This paper examines the broadband frequency-modulated wave of photons that are traveling in blood tubes (transmission mode) and in a human lower forearm (reflection mode). Blood groups are identified by antigens and antibodies: antigens are proteins located on the surface of the RBCs, while antibodies are proteins located in the plasma. Protein structure and accumulations in the blood define each blood group and type, and each structure has a unique photon interaction. Photon interaction with proteins has a unique signature when photons traveling through proteins are scattered (proteins structure) and absorbed (proteins accumulation). This is observed through narrowband/broadband measurements. Measurements can be made through single frequency modulation (single point data) and narrow and broadband frequency modulation (multiple point data), where single frequency modulation shows only one point data, which is not enough to identify differences in blood type, while narrow and broadband frequency modulation shows multiple point data, which is sufficient to identify different blood types. The paper also presents a comparison between the experimental results at the wavelength of 850 nm to quantify the understanding of the broadband and narrow photon modulation.13,15 This is done by comparing the results of IL and IP of known blood types. The methodology and mathematical representation of the modulated wave of photons are explained in Methodology of investigation section, and the experimental method along with the hardware development is explained in Experimental and hardware development section. Results: broadband frequency measurements section presents the results for the in vitro (blood tube) measurements and in vivo (lower forearm) measurements, and Discussion and conclusion section covers the conclusion and discussion, where device accuracy is analyzed using false-negative error.
Methodology of investigation
Mathematical representation
The general diffusion equation (DE) is utilized in our analysis for the broadband frequency modulation analysis and inverse problem solving in order to extract the optical parameters in any biological type media.15 The derived diffusion equation states:
| (1) |
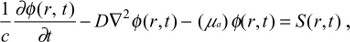
where ϕ(r,t) is the fluence rate (w/mm2) for reflectance (backscattering) or transmittance mode, and c is the speed of light in the media. The photon density wave is expressed for a sinusoidal point source modulated at an angular frequency of ω=2πf in a semi-infinite medium as12,16
| (2) |

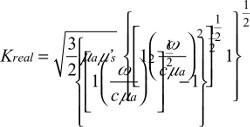
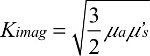
| (3) |
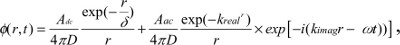
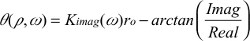
where Adc and Aac are the DC and RF components of the source, respectively, δ is the DC penetration depth, and kreal and kimag are the real and imaginary components of pair-density wave complex wave number. Therefore, the reflectance mode solution is given by12,16
| (4) |
| (5) |
where, the term r0 stands for
| (5.1) |
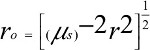
| (5.2) |
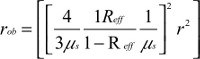
| (5.3) |
| (5.4) |
| (5.5) |

| (5.6) |
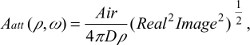
where  is the diffusion coefficient, r is the separation distance between the transmitter and the receiver, and C is the speed of light in the medium. The IP and IL use the magnitude and phase of RF components Aac as
| (6) |
| (7) |

Experimentally, measurements of both IL and IP at different frequencies are essential, and full hardware setup is needed that has a full NIR optical system with the capability to modulate the wave of photons.
Experimental and hardware development
The overall measurement system designed and implemented for this research consists of an Automatic Network Analyzer (ANA – Anritsu MS4623B) as an RF source and a sensitive RF receiver, a broadband optical Tx at various different wavelengths and optical Rx modules, as shown in Figure 1. The ANA acts as a highly sensitive frequency modulator and demodulator instrument, while the optical transmitter and the receiver modules act as the broadband-modulated photon sources and highly sensitive (ie, low-intensity noise) optical detectors. Optical transmitters operating at 850 nm is used in this study to monitor the peak absorption or scattering. The frequency modulation of the photon source is controlled by an SP3T RF switch (Hittite HMC245QS16) to drive three high-power vertical cavity surface emitting lasers (680 nm, 795, and 850 nm). A separate DC biasing control and RF modulating signals are provided for each wavelength through low pass–high pass Bias-T networks. The vertical cavity surface emitting laser is a diode laser (Vixar; Module V3WLM) in which optical sources emit high-power (output power of about 5 mW) Gaussian optical beams with low astigmatism at threshold currents of 8.5 mA for the 680 nm, 9.5 mA for the 795 nm, and 2.8 mA for the 850 nm. A printed circuit board has been designed and fabricated using a commercial substrate (FR4) to accommodate all the surface mount technology components. In the absence of PIN photodiode-based commercial high-gain optical receivers, APD (Hamamatsu APD module C5658) has been used along with a built-in transimpedance amplifier.12
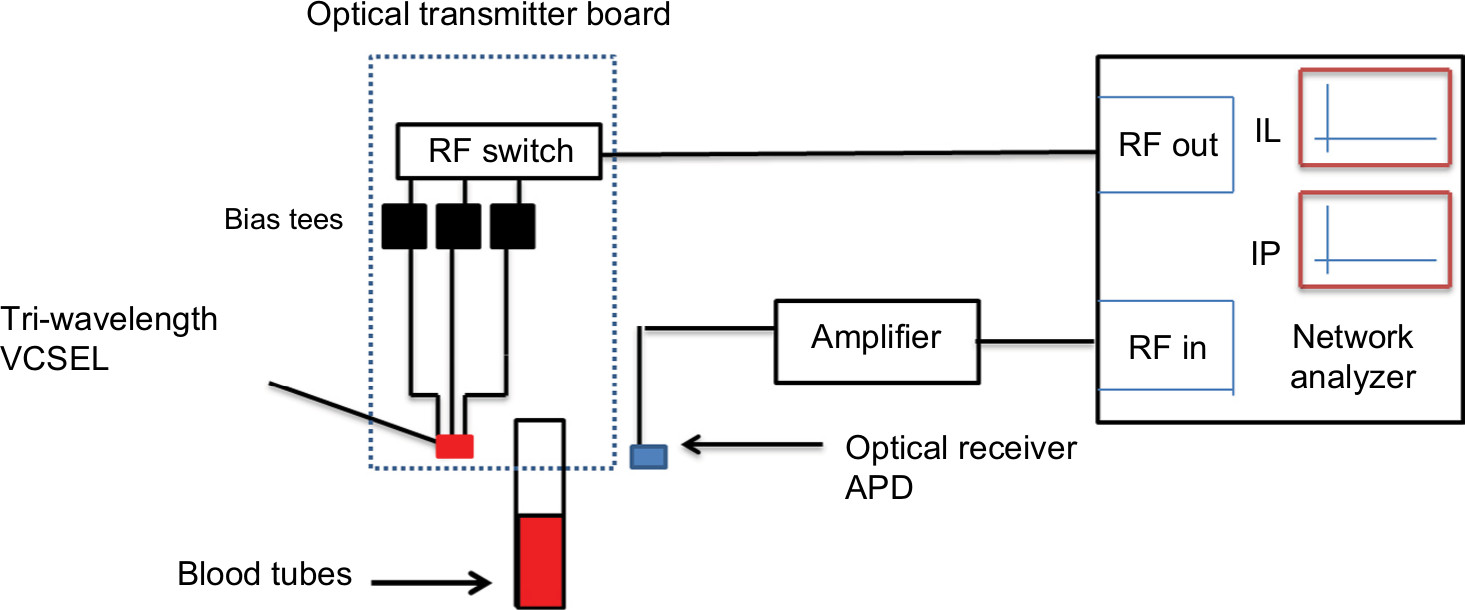 | Figure 1 Conceptual measurement system. Abbreviations: IL, insertion loss; IP, insertion phase; VCSEL, vertical cavity surface emitting laser; RF, radio frequency. |
Results: broadband frequency measurements
Photons travel in different penetration paths and depths in biomedia. Both the depth and path depend on different wave frequency modulations.15 The path of the photons takes the shape of the backscattering movement when the medium is thick enough; otherwise it would take a transmission movement from one end to another when a thin medium is presented.17 The backscattering movements of the photons are more realistic, when the human body is presented as a biomedium. Each frequency modulation of the wave of the photons will result in a different penetration depth of photons in the biomedia, and therefore, different IL and IP are observed, which results in a different extraction procedure and accuracy. It is known that the narrow/broadband modulation of photons in a homogeneous medium will result in high accuracy due to the extracted information of the multilayer penetration.12 The narrow/broadband will result in high data points’ samples from the homogeneous media, leading to high accuracy when inverse problem solving is applied to extract the optical parameters.12,15–17
Stage 1: In vitro transmission mode measurements
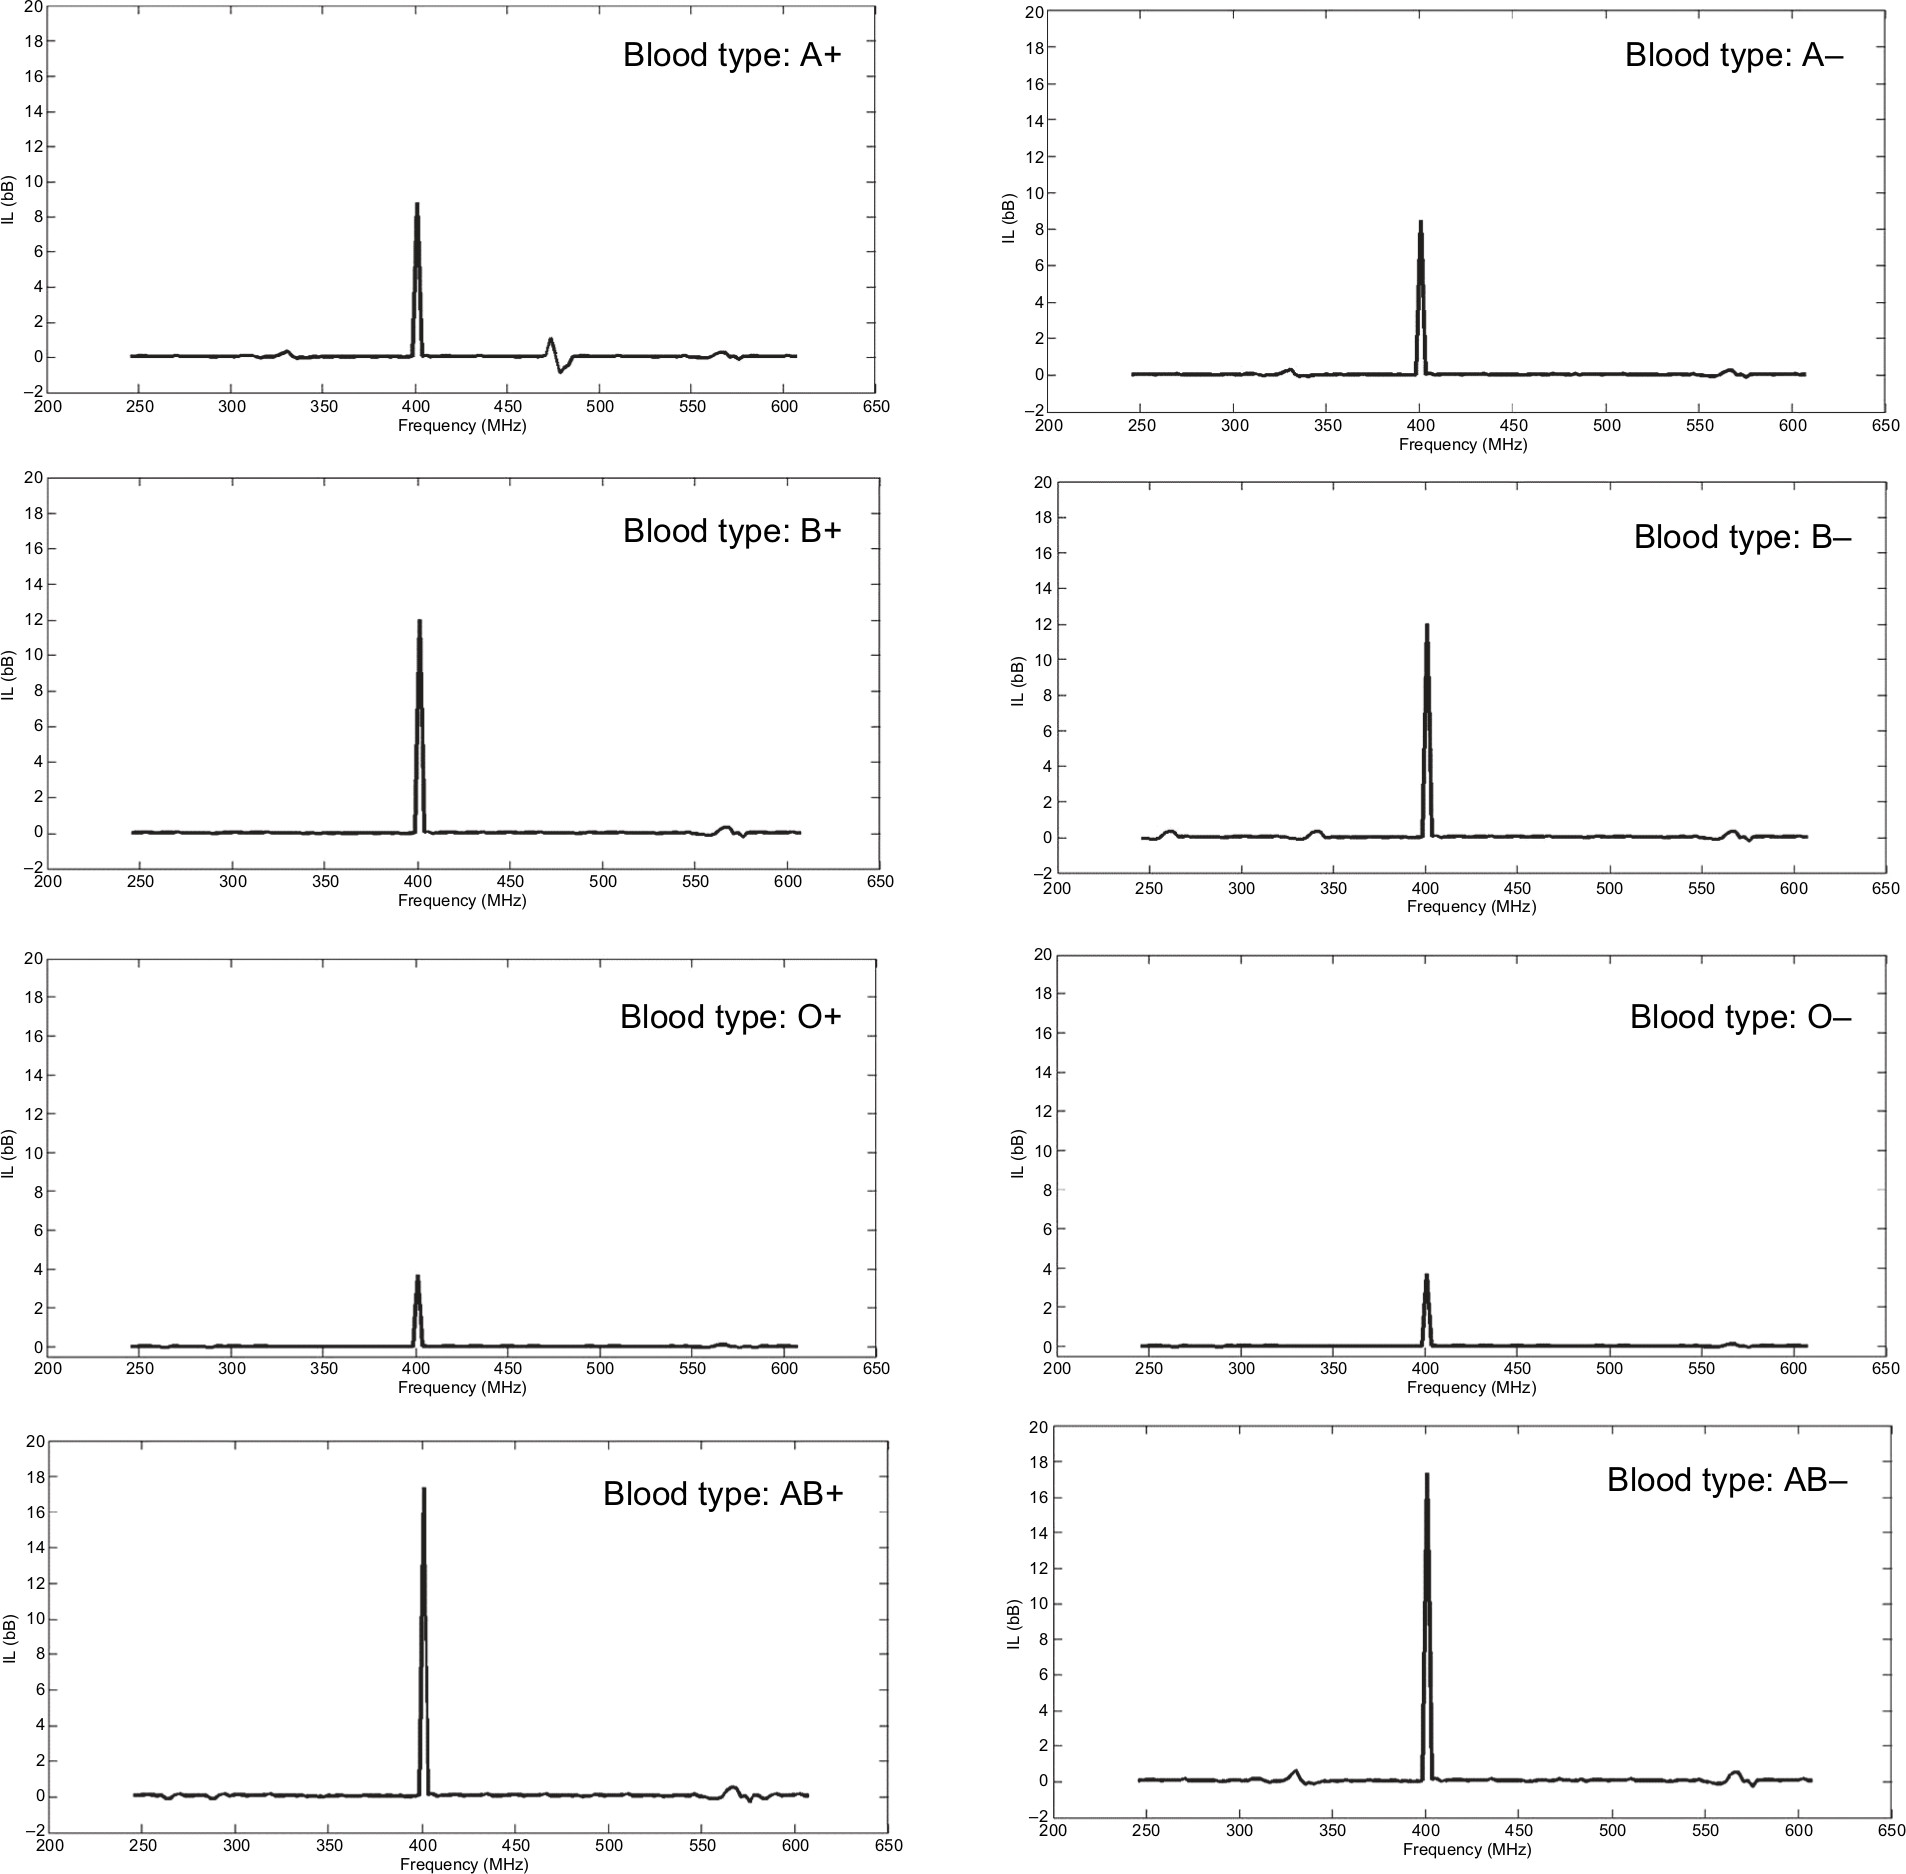
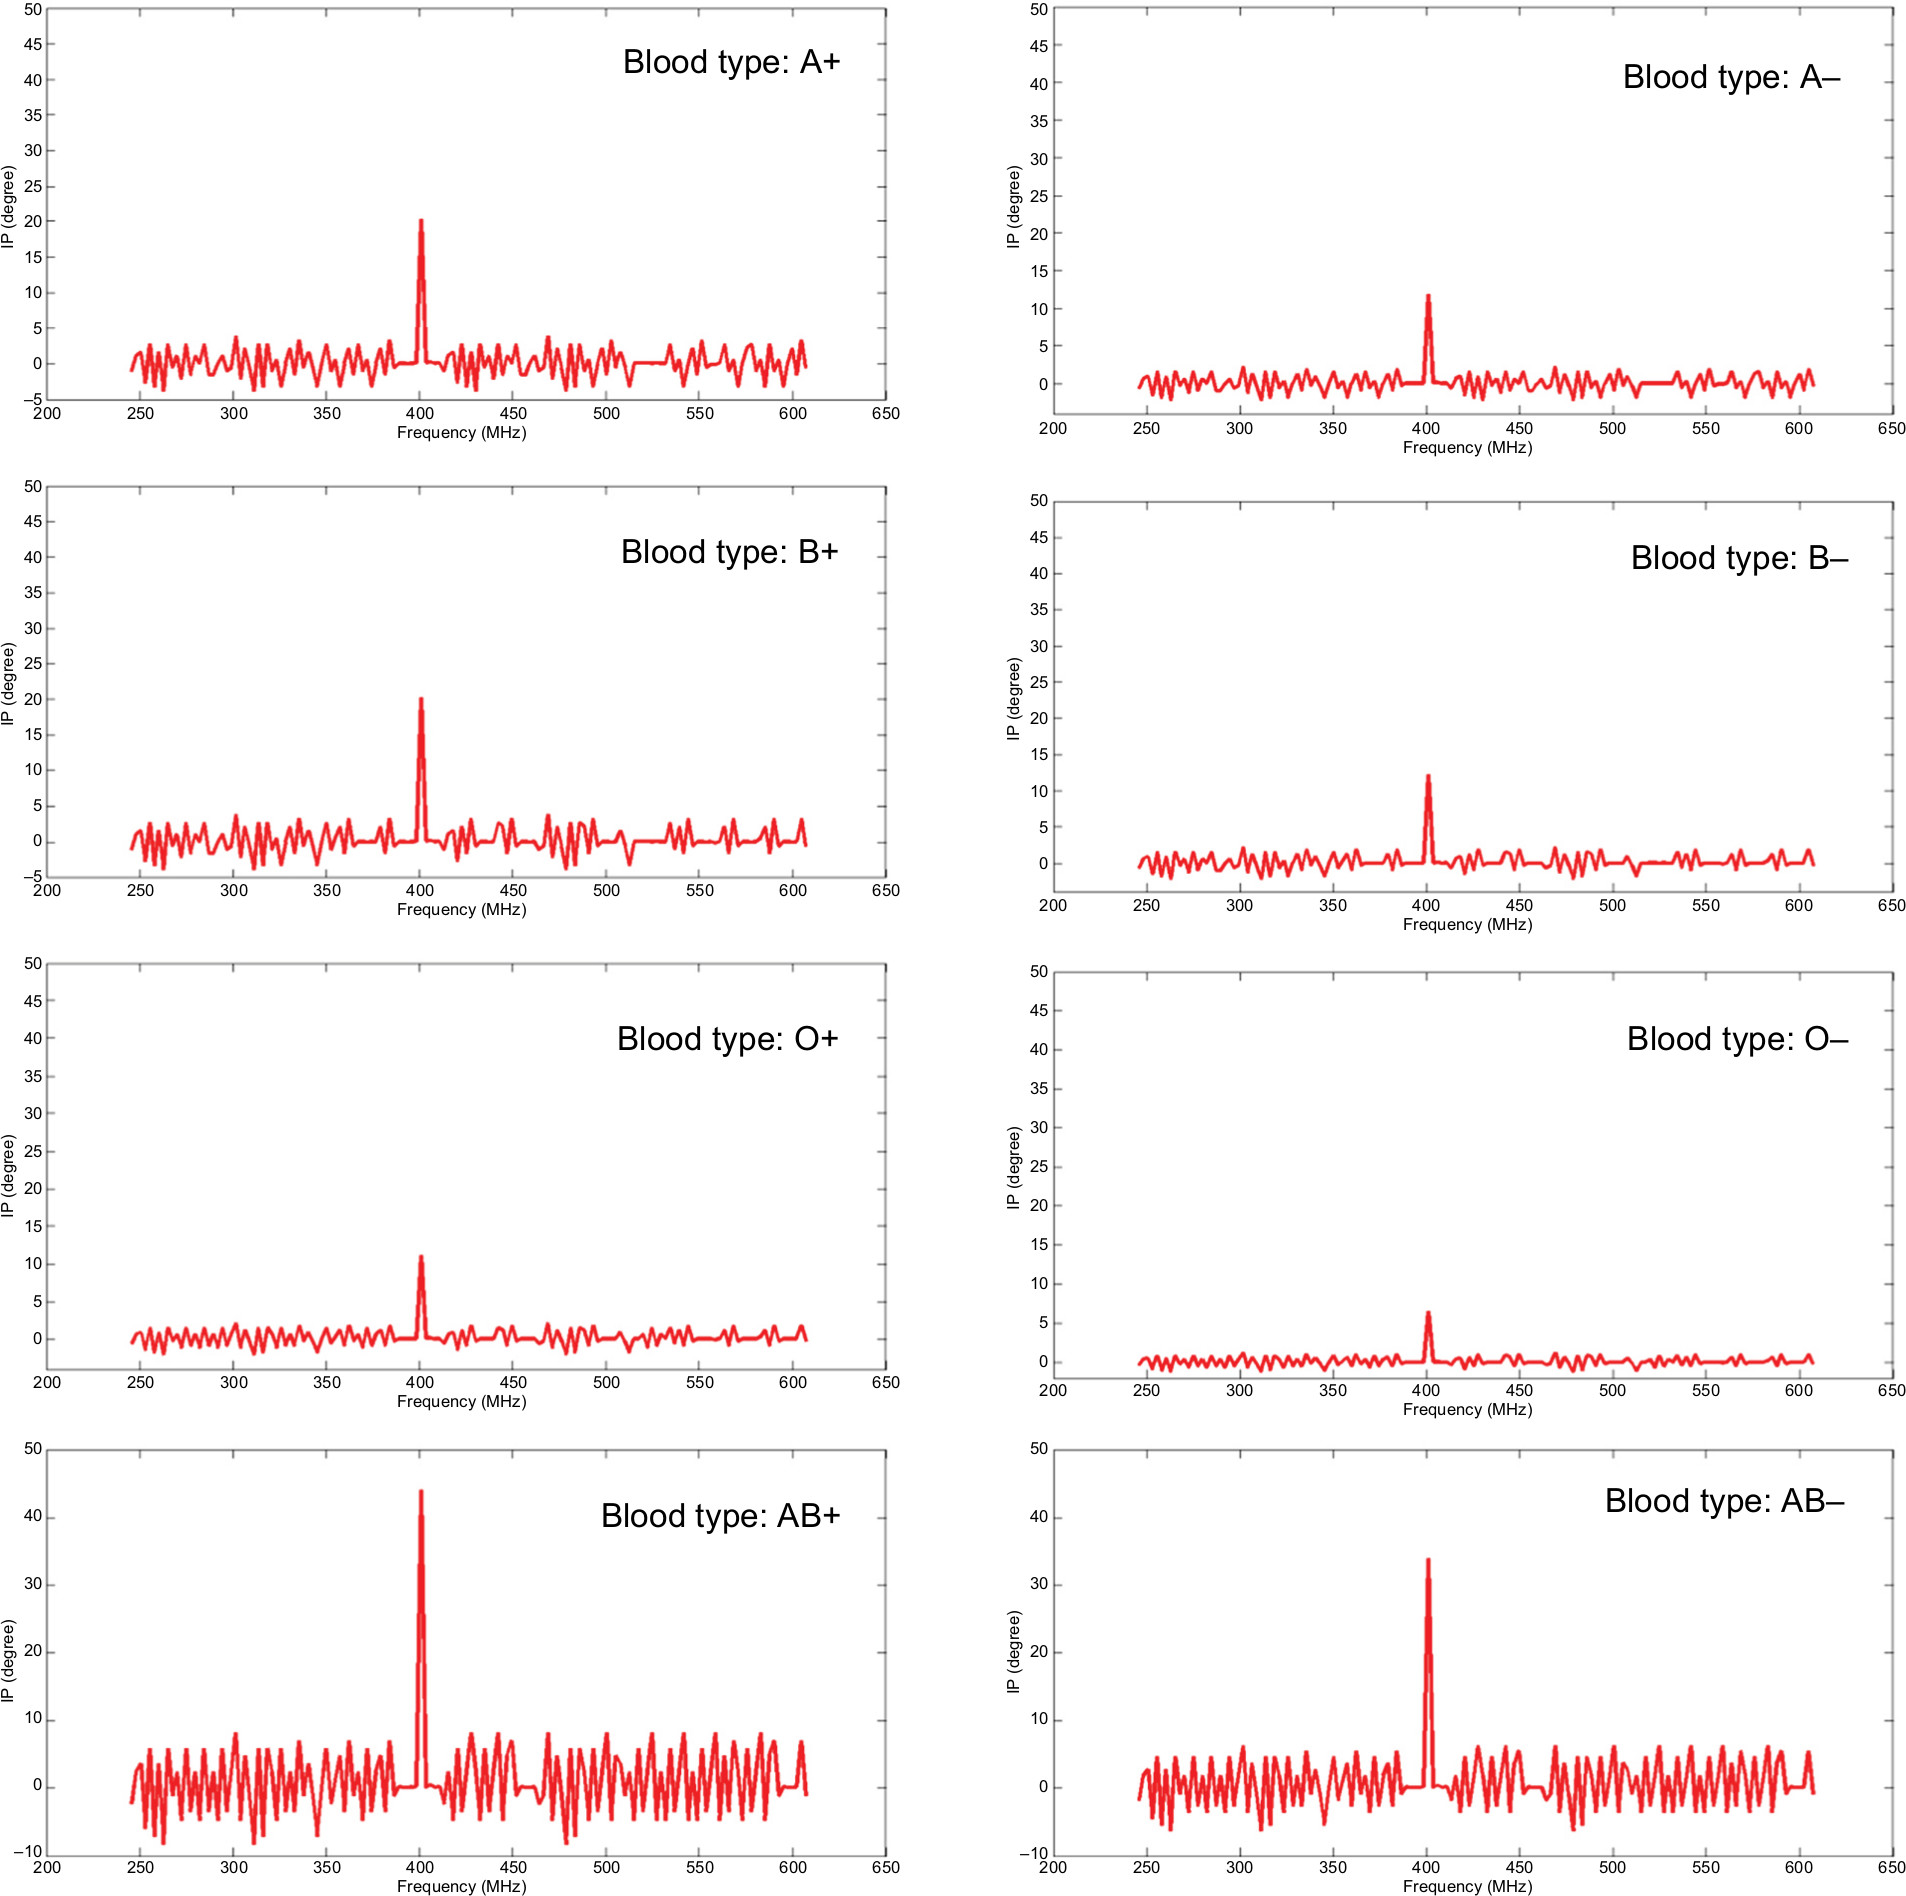
Random unknown blood type samples were collected from 30 patients (total of 240 samples) and tested using the developed transmission mode method shown in Figure 2. Both IL and IP were measured and averaged for each blood sample, as shown in Figures 3 and 4. These results were then compared with the actual blood type confirmed by the common ABO typing, resulting in the tabular map shown in Table 1. Table 1 shows the tabular index result that will be used as reference for Stage 2 measurements.
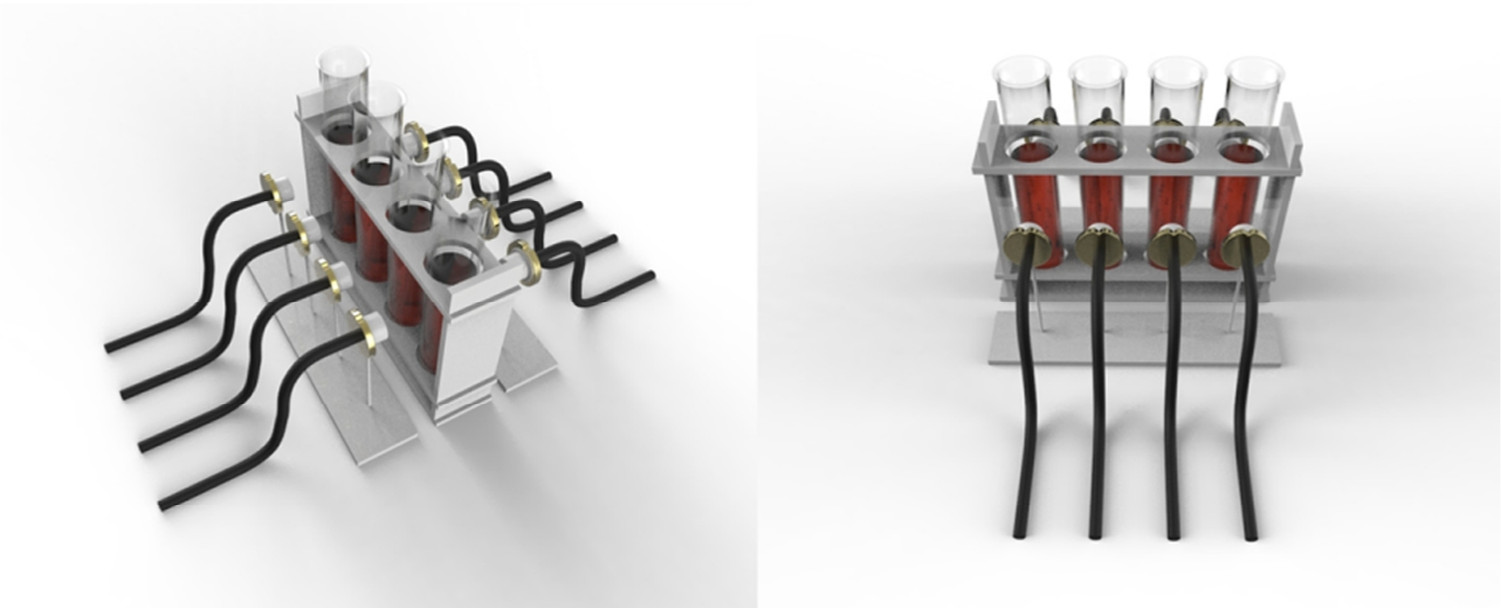 | Figure 2 Transmission mode optical measurements through blood tubes. |
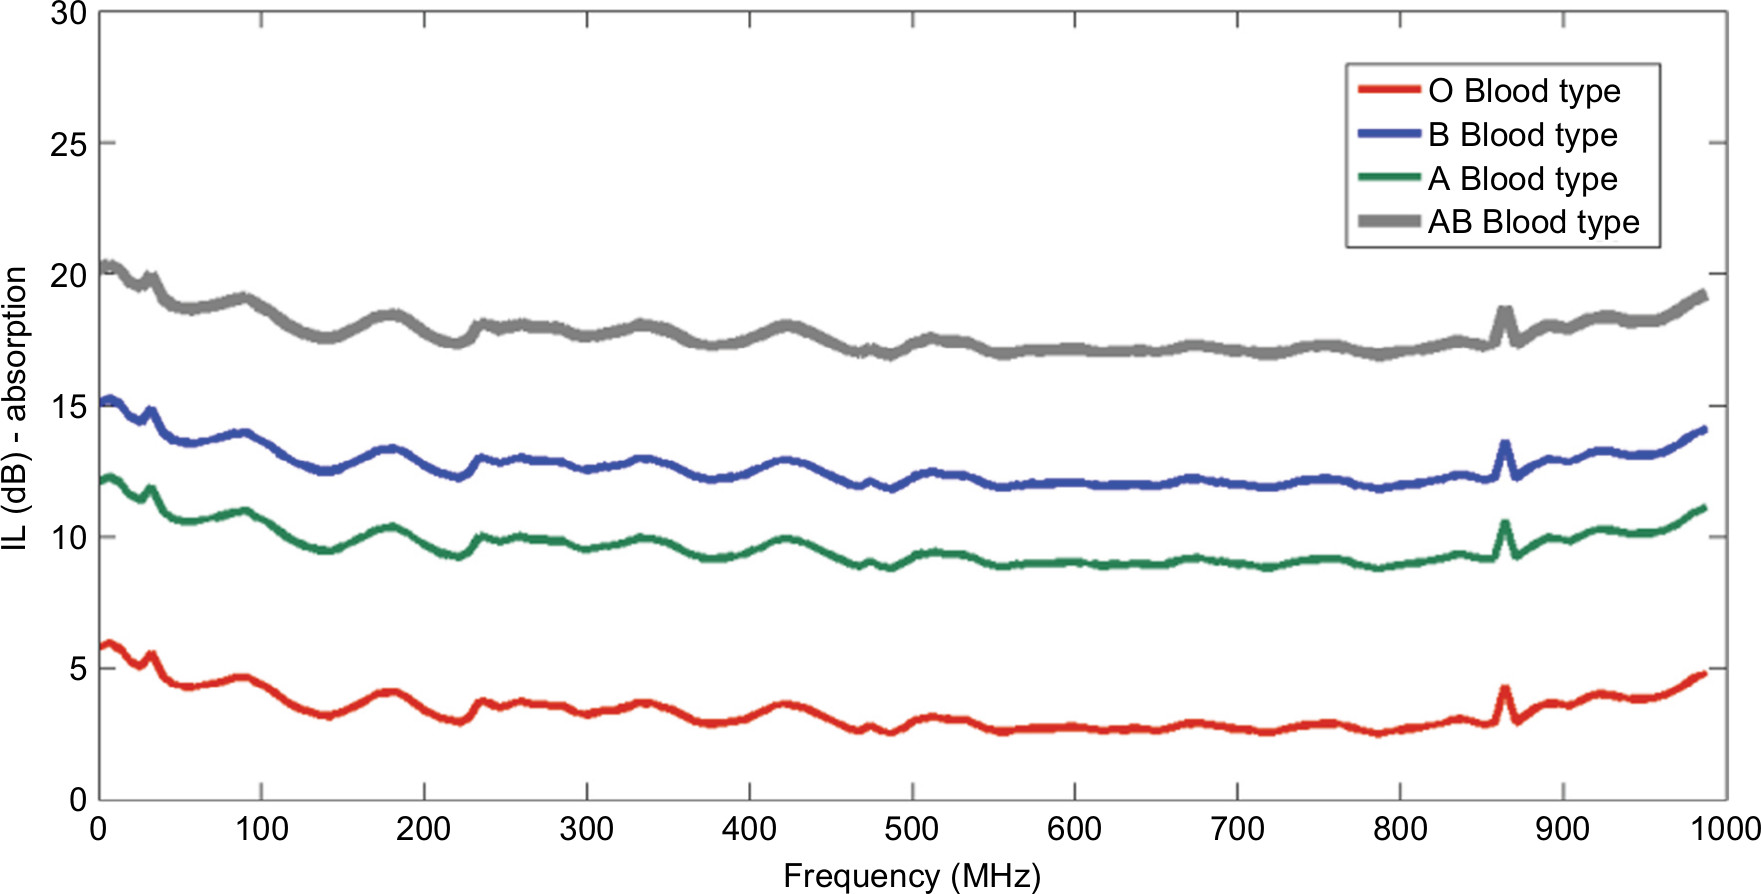 | Figure 3 Broadband transmission mode (through blood tubes) result of insertion loss (IL). |
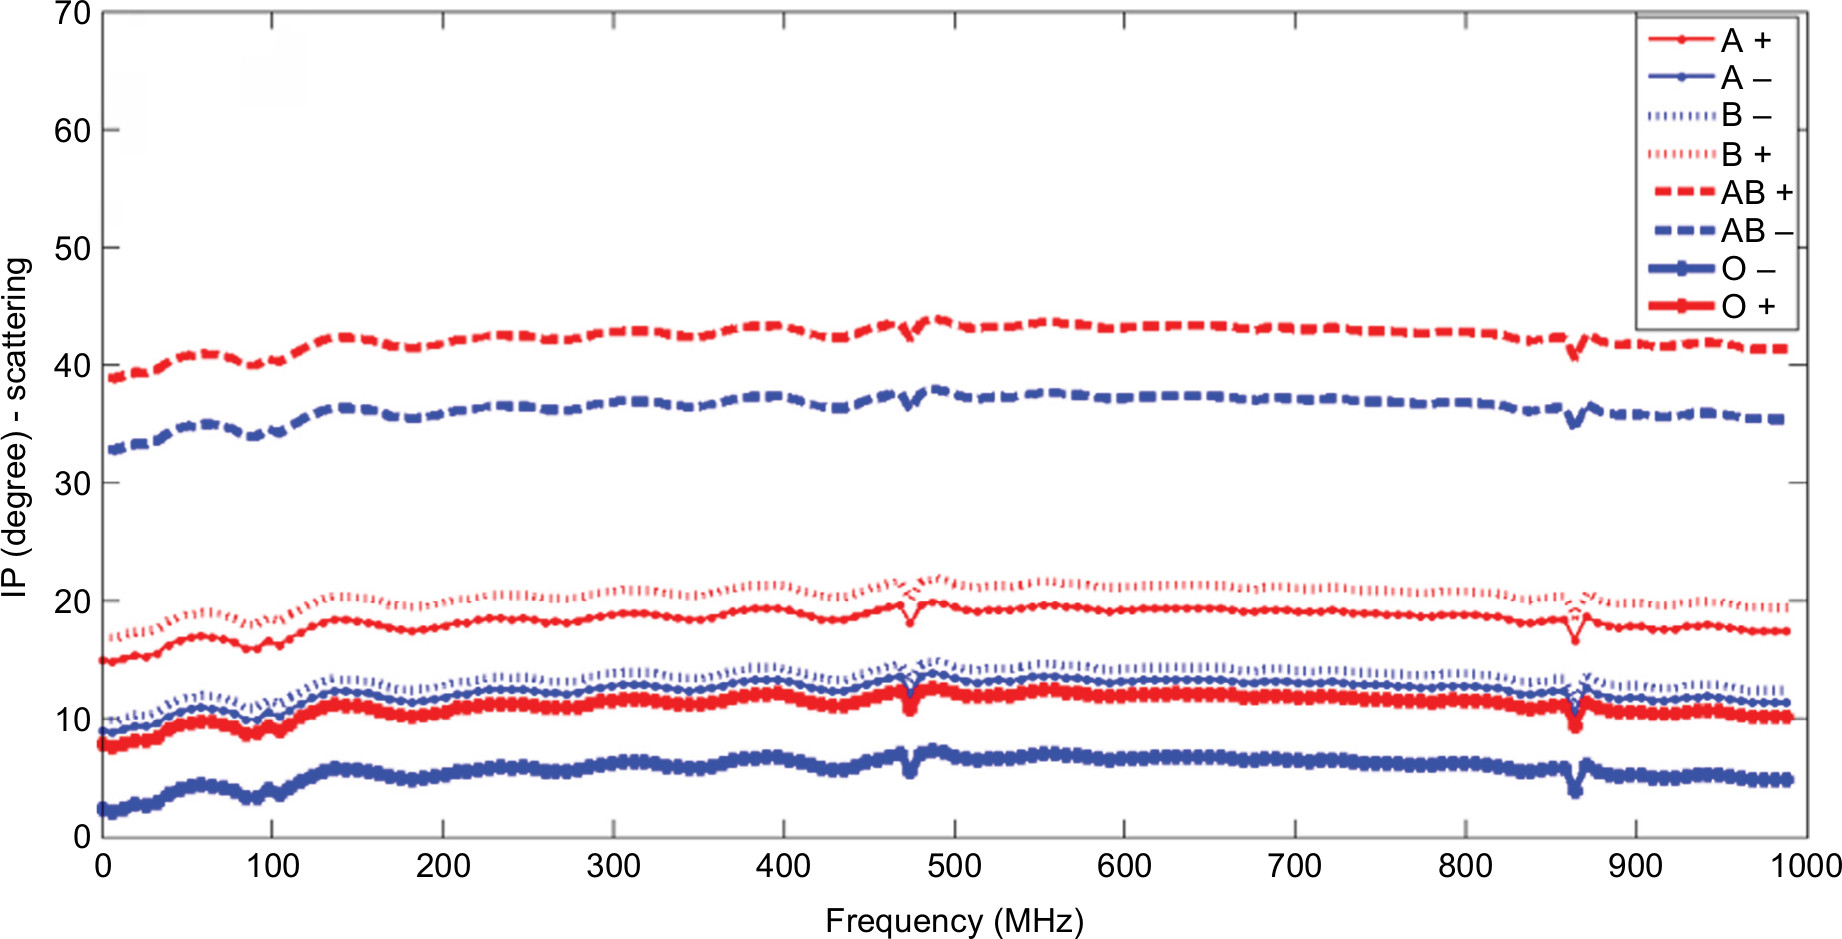 | Figure 4 Broadband transmission mode (through blood tubes) result of insertion phase (IP). |
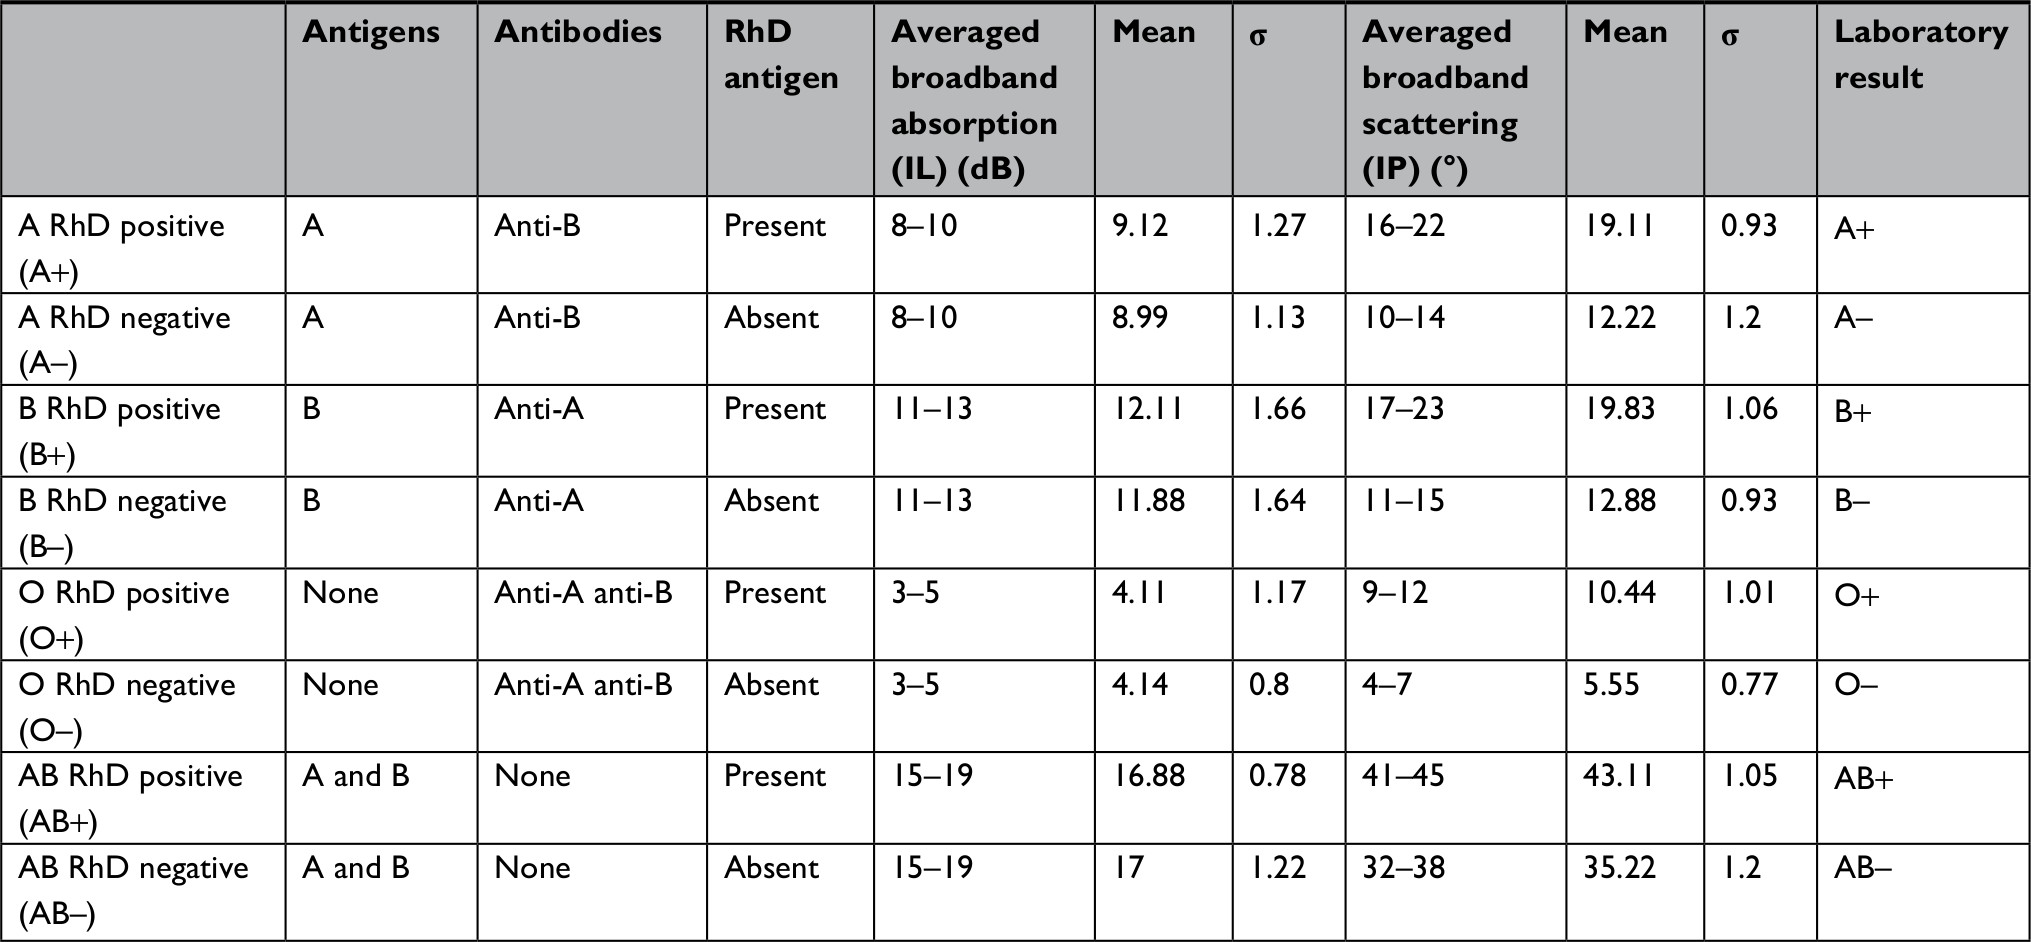 | Table 1 Transmission mode index result of IL and IP mapped to different blood types Abbreviations: IL, insertion loss; IP, insertion phase. |
Table 1 reports important extracted information about the IL and IP of different verified blood types.
In principle, antigens and antibodies have similar extracted values of IL for each blood type, but RhD antigens of these blood types have different IP. The results show a unique biostamp of different IL and IP, which can be used to identify different blood types and can be used as a reference to identify the noninvasive (in vivo) measurements reported in the next section.
Stage 2: In vivo lower forearm measurements
Method of measurements and analysis
The reflection mode measurements are used as a noninvasive method to measure photons traveling in the biomedia. Both the optical transmitter and receiver are placed next to each other in order to measure photons traveling in a backscatter going through the targeted/desired bio-object. Formerly, the lower forearm was studied for the purpose of measuring photon scattering and absorption when traveling at certain depths and locations.12 Knowing the location and depth of the blood artery desired for such measurements, a narrow band of 245–607 MHz is then used to modulate the wave of photons at 850 nm.12 The narrow band chosen will ensure the photons interact with the desired blood artery when traveling through the lower forearm. Either the ulnar or radial artery is targeted for such measurements. As shown in Figure 5, the band of the optical transmitter and receiver is placed in a location to measure photons traveling through the human lower forearm and to target either the ulnar or radial artery. For the purpose of analysis, the result is always compared with a control (buffer) location where there is low photon absorption and scattering. The signal processing method to analyze the data as shown in Figure 6 is based on a previous method/approach that was developed15–18 by subtracting and taking the first or second derivative as follows:
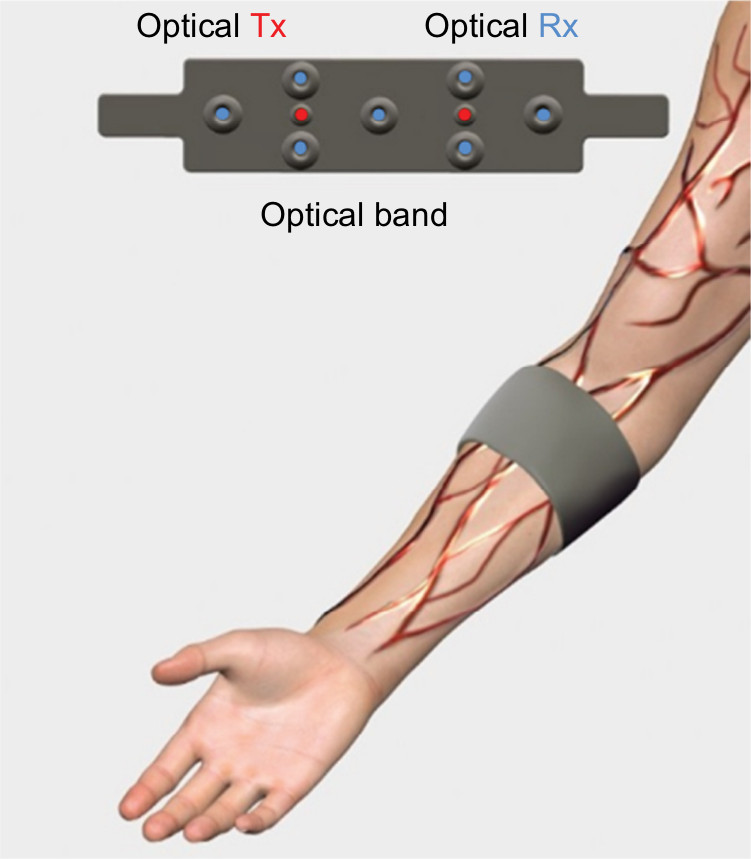 | Figure 5 Reflection mode optical measurements through lower forearm hand. Abbreviations: Rx, receiver; Tx, transmitter. |
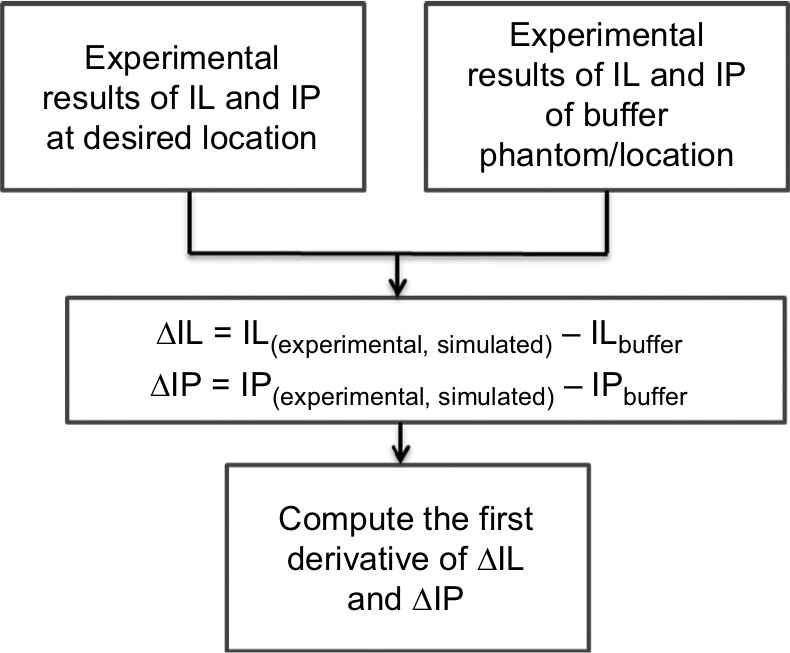 | Figure 6 Signal processing procedure to identify the change in slope and frequency stamp associated with it. Abbreviations: IL, insertion loss; IP, insertion phase. |
Differentiating ∆IL and ∆IP emphasizes the slope change and therefore locates the point of interaction between photons and targeted biomedia (blood artery).
As an indication of photon wave frequency-modulated interaction with the different biomedia, it is observed that a change in slope of the resultant IL and IP occurs when compared with the control (buffer) IL and IP. The change in slope in IL/IP between that of the control (buffer) and the realistic measurements of the inhomogeneous media gives an indication that can be correlated to the index values of different blood types indicated in Table 1.
Measurements and data processing
Forty random patients from each blood type (total 320 samples) were tested through the measurement technique proposed in this paper and are shown in Figure 5. The initial backscattering measurements suffered from high photon loss and poor data collection. This was due to the photons traveling in a very high scattering media. Therefore, a controlled Hittite/Analog Device RF amplifier (HMC453ST89) was placed after the optical receiver to have a gain of 10 dB. The measurements then gave a better resolution with enough data points to be analyzed. Both Figures 7 and 8 show the result of derivatives of ∆IL and ∆IP, and peaks around 401 MHz are observed. All the peaks reported in Table 2 are to be mapped to the index transmission mode measurements in Stage 1: In vitro transmission mode measurements section and Table 1.
 | Figure 7 Averaged insertion loss (IL) measurements for reflection mode lower forearm. |
 | Figure 8 Averaged insertion phase (IP) measurements for reflection mode lower forearm. |
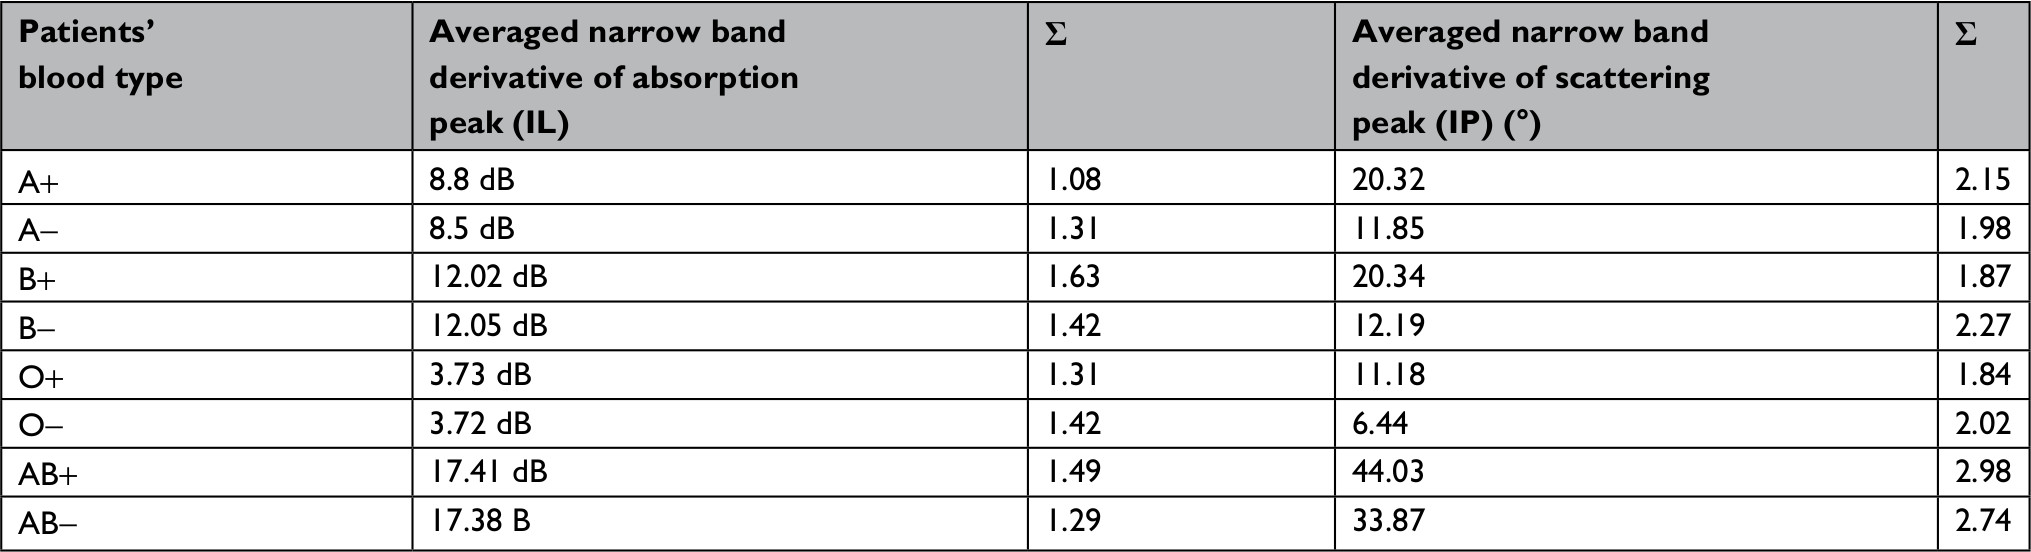 | Table 2 Peaked averaged result of ∆IL and ∆IP for reflection mode lower forearm Abbreviations: IL, insertion loss; IP, insertion phase. |
The results reported in Table 2 were extracted from the noninvasive experimental measurements of the wave of photons traveling in the human lower forearm. These results have been averaged and compared with the unique biostamp reported in Table 1. A correlation measurement between Tables 1 and 2 was conducted and is explained in the following section along with a discussion of the importance of such biosensor results.
Discussion and conclusion
A blind noninvasive method of optical measurements has been used in this study as a biosensor method to identify human blood types through either in vitro or in vivo blood measurements. This method shows high accuracy and can be used as a future tool to noninvasively identify human blood types without collecting blood samples from humans. This method depends on the wave of photons traveling through human biomedia and measurements of the absorption (IL) and scattering (IP) of photons that is mapped to different blood types (Table 1). The first step to verify the accuracy of the method used here is to create an index that can be a unique signature for each blood type. The index is based on two readings of both IL and IP, which basically is the measurement of the amount of photos that have been absorbed and scattered. This task was reported in Stage 1: In vitro transmission mode measurements section, where different blood samples from 30 patients were used. The second step is to noninvasively measure the absorption (IL) and scattering (IP) of these waves of photons traveling through the human lower forearm, and this was done of 40 different patients and the results are reported in Stage 2: In vivo lower forearm measurements section. The results of Stage 2: In vivo lower forearm measurements section and Stage 1: In vitro transmission mode measurements section have been analyzed to provide the correlation between the index values (Stage 1: In vitro transmission mode measurements section) and random noninvasive measurements of 40 patients reported in Stage 2: In vivo lower forearm measurements section. The correlation values >0.95 are shown in Figure 9 for both IL and IP. This gives high confidence in the measurement method used for noninvasive blood type identification using the optical method described in this paper.
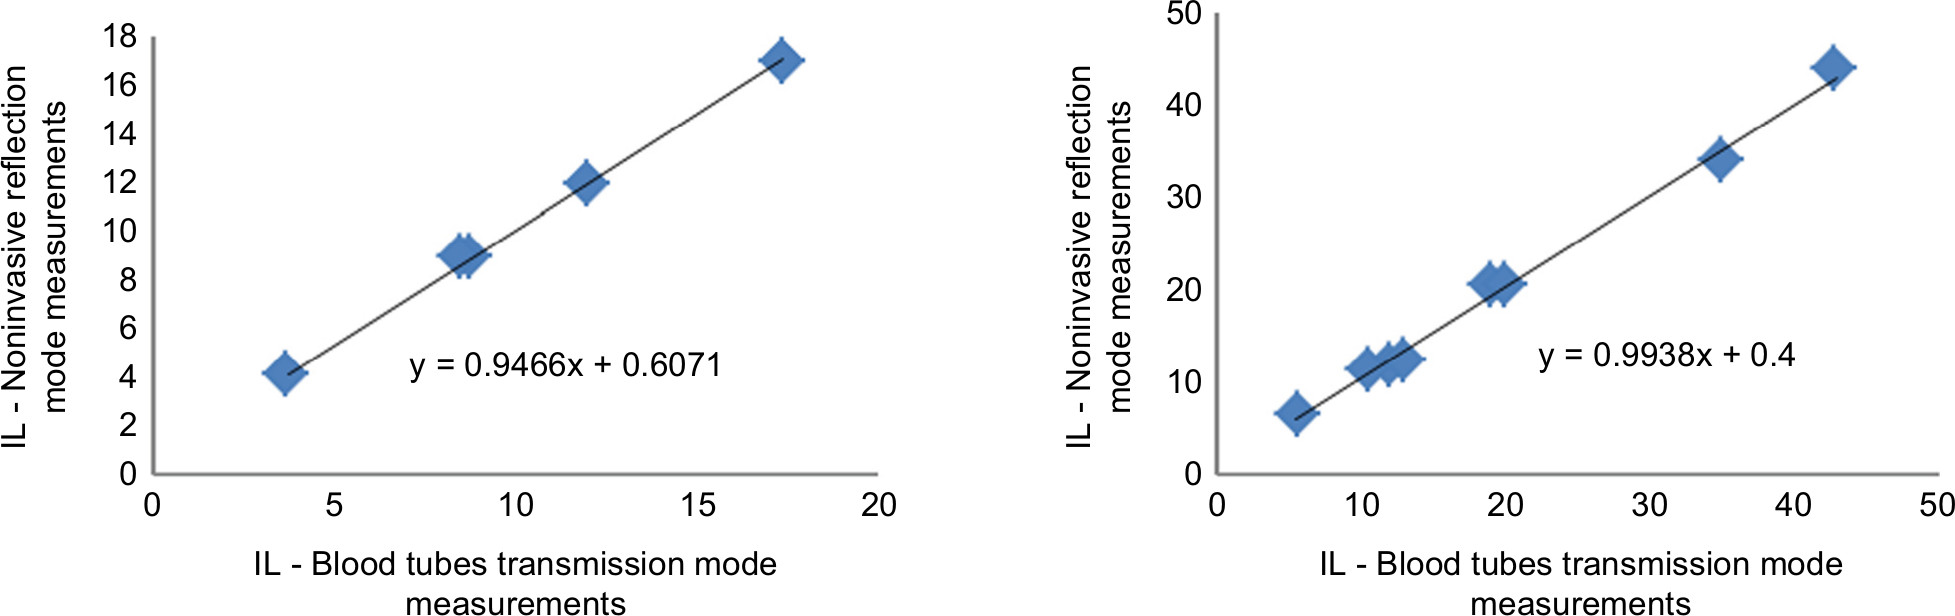 | Figure 9 Correlation analysis between stage 1 and stage 2 (index result for the noninvasive lower forearm measurements). Abbreviation: IL, insertion loss. |
It was detected that obese subjects will cause misalignments of the optical transmitter and receiver and therefore cause error in predicting the blood types. Therefore, for the purpose of accurate measurements, further testing using device false-negative reading is analyzed by performing 480 new human subjects’ blood prediction measurements. This was done by randomly selecting 60 subject from each blood type (A+, A−, B+, B–, AB+, AB−, O+, and O−). More testing with 0.5 cm misalignment increments was performed, as shown in Table 3. For each test, we took three extra measurements when the transmitter and receiver were misaligned with 0.5 increments. The misalignment would be a realistic result when dealing with obese human subjects. Measurements and the prediction of blood type using the method developed in this paper were performed on each of the 480 human subjects and then compared with the known laboratory result blood type. False negatives were measured by dividing the number of wrong predictions by the total number of subjects for each blood type measurements.
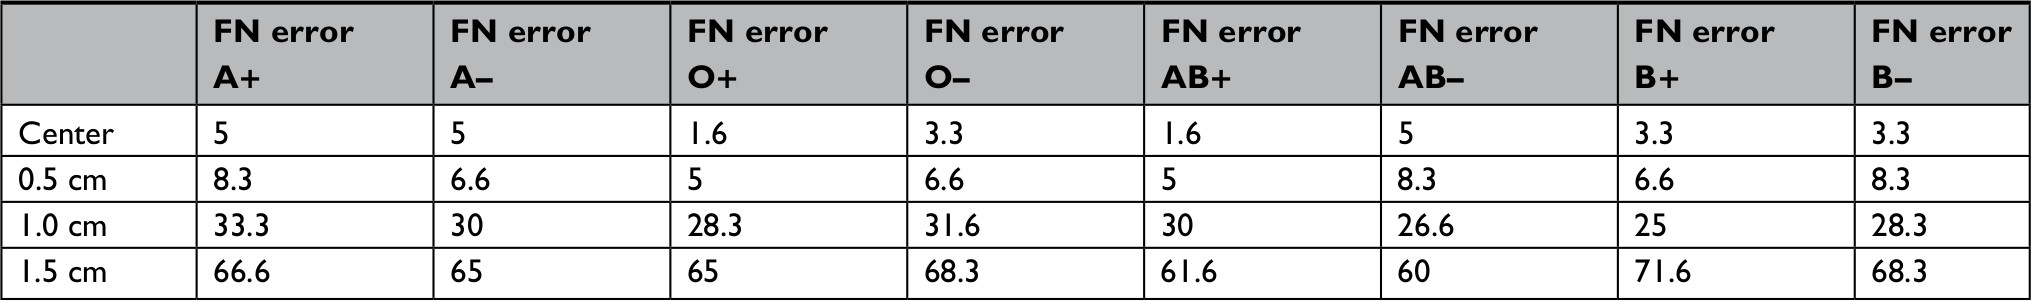 | Table 3 False-negative (FN) percentage error performed on 480 patients (60 patients from each blood type) |
The result shows that when the device is centered around the artery and an average human weight is presented then the error of detecting false negatives is <5%, but when obese subjects are presented then the error increases as shown in Figure 10. This is justified because of the optical band location around the targeted artery or loss of photons due to high scattering media. The new measurement system we are working on needs to be calibrated with high accuracy with imbedded RF amplification. For future work, we are working on increasing sample points by noninvasively measuring more random patients.
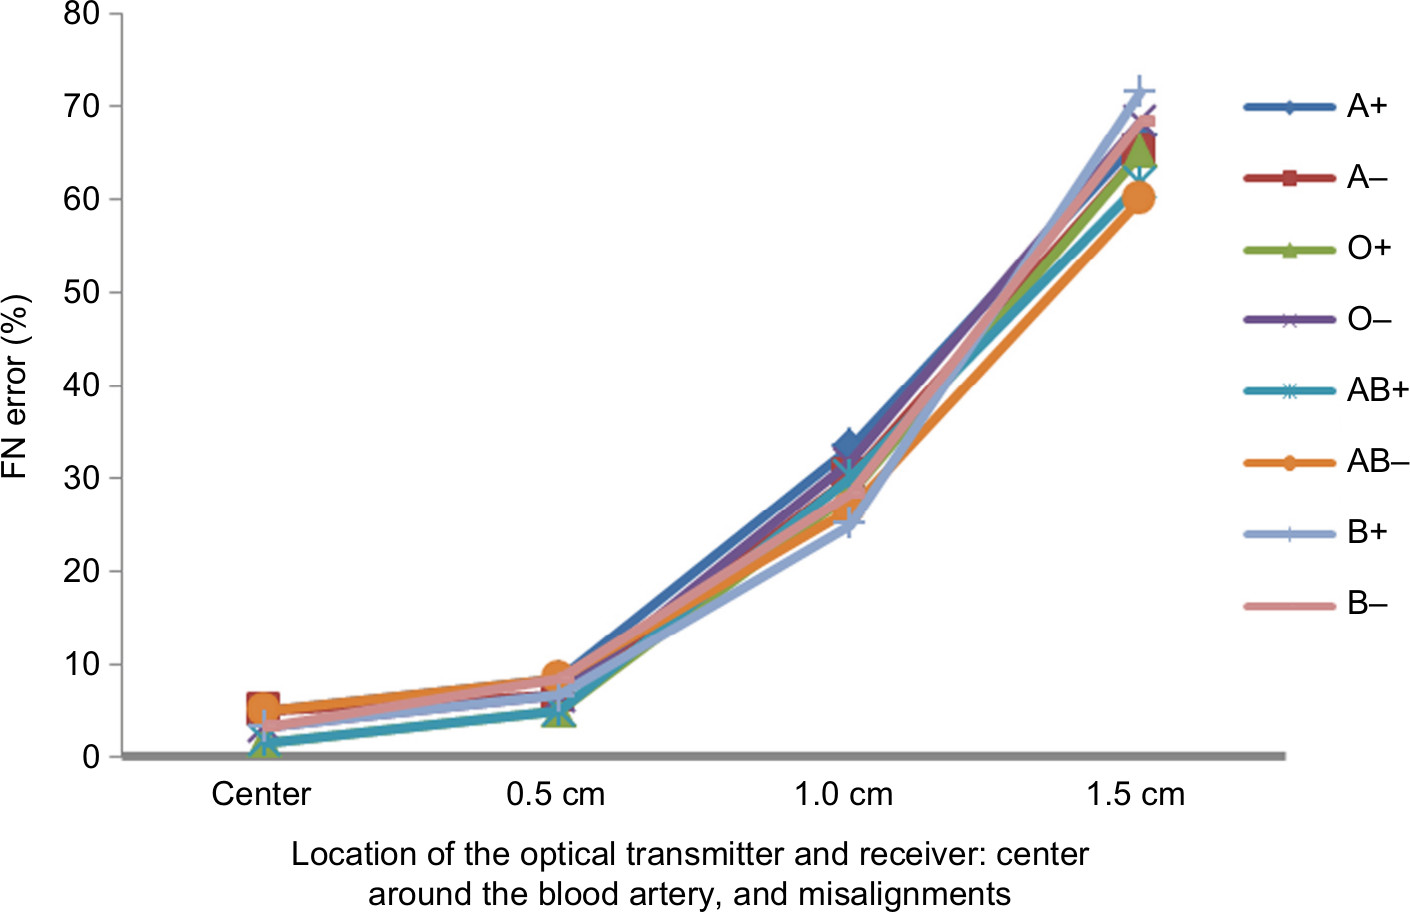 | Figure 10 False negatives (FNs) for 480 human subjects tested to predict human blood type using noninvasive optical device. |
Even though the system developed in this paper gives enough sensitivity for blood measurements, a new system needs to be developed to address the sensitivity of optical transmitters, receivers, and RF components. New developments need to have higher detection sensitivity and more mobility features. Poor sensitivity has been observed when the reflection mode is applied to obese human subjects.
In this paper, we have created an indexed database using optical transmission mode measurements, and then mapped it to a reflection noninvasive measurement to identify the blood types. Then for the purpose of device accuracy, we randomly selected 480 new human subjects to measure the false-negative error percentage. This method is novel in terms of using an optical system to measure and identify blood types without collecting blood samples.
The ability to integrate noninvasive devices for blood typing will allow the patient and doctor to have immediate answers with no pain in contrast to traditional invasive methods as shown in Figure 11. This can be applied to different aspects of health, which link to blood monitoring, from finding out the type, monitoring diabetes, or determining cancer detection. The integration of using wearable smart devices will bring hematology in line with other areas of medicine, which have benefitted from adopting new technology.
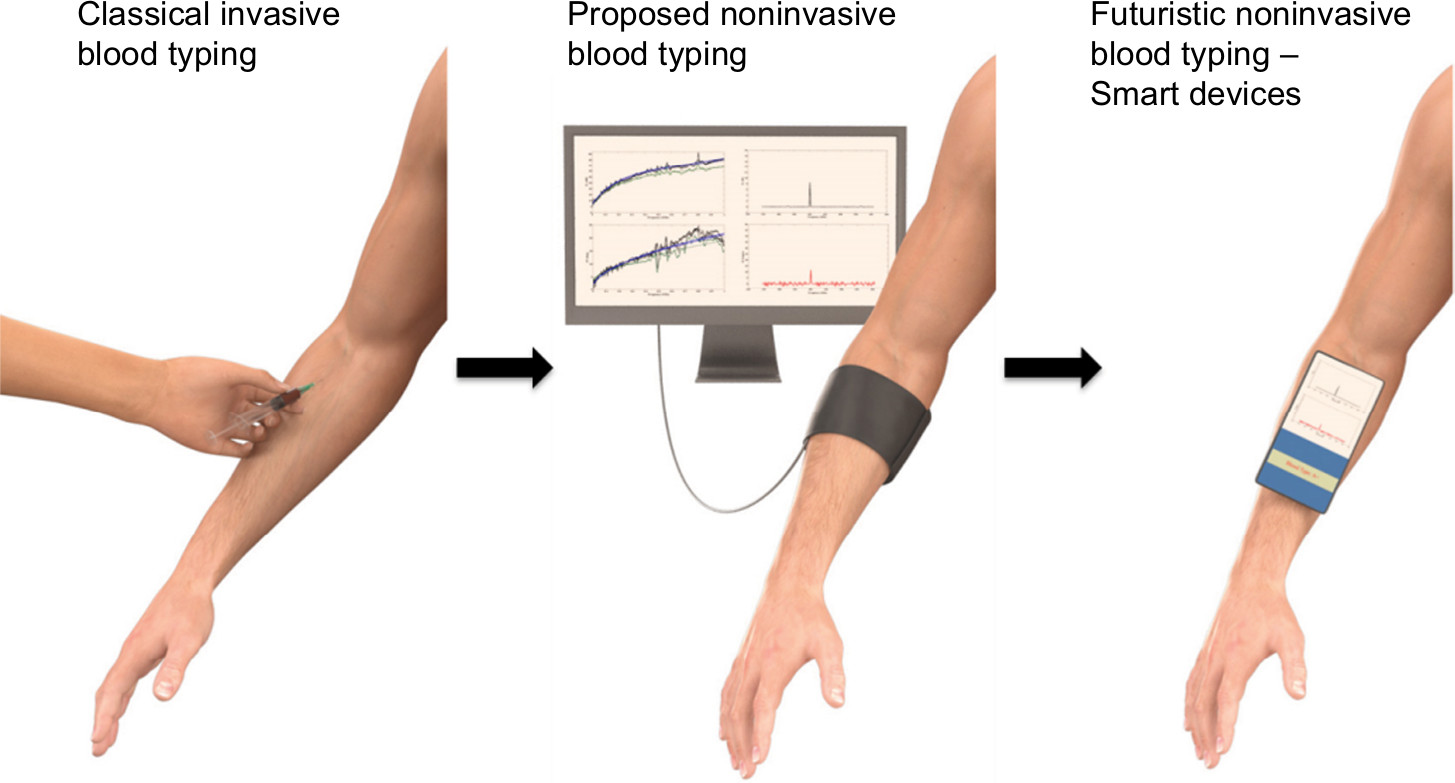 | Figure 11 Optical biosensor past, present, and futuristic development for noninvasive blood typing. |
Patient consent
The authors confirm that all patients involved in this study had provided a signed written informed consent.
Data and code availability
The data and codes that support the findings of this study are available from the corresponding author upon reasonable request.
Acknowledgments
This work was supported by the PAAET research grant (number TS14-09). The authors would like to thank Dr Yaqoub Borjaib of the Kuwait Military Hospital and the Public Authority for Applied Education and Training for their support.
Disclosure
The authors confirm compliance with the latest version of the Declaration of Helsinki and declare that they have no competing interests nor there is any conflict of interest. The authors also give consent that the study has been reviewed and approved by the research committee in the biomedical engineering sector in the College of Technological Studies at the Department of Electronics Engineering, Shuwaikh, Kuwait. The research committee have reviewed and approved this study assuring high satisfactory work of significant value and ethics is conducted.
References
Todd C, Salvetti P, Naylor K, Albatat M. Towards non-invasive extraction and determination of blood glucose levels. Bioengineering. 2017;4:82. | ||
Kanada V. Bio-optics: blood type determination based on image processing techniques by utilizing an optical sensor device. Int J Sci Res. 2016;5(7):214–217. | ||
Determining Human Blood Type by Non-Invasive Methods. Available from: http://www.ableweb.org/biologylabs/wp-content/uploads/volumes/vol-29/012.pdf. | ||
Goto S. Vascular engineering of blood coagulation. In: Tanishita K, Yamamoto K, editors. Vascular Engineering. Tokyo: Springer; 2016:211–220. | ||
Harmening DM. Modern Blood Banking and Transfusion Practices. Philadelphia, PA: F. A. Davis; 2012. | ||
Stussi G, Huggel K, Lutz HU, Schanz U, Rieben R, Seebach JD. Isotype-specific detection of ABO blood group antibodies using a novel flow cytometric method. Br J Haematol. 2005;130(6):954–963. | ||
Houngkamhang N, Vongsakulyanon A, Peungthum P, et al. ABO blood-typing using an antibody array technique based on surface plasmon resonance imaging. Sensors. 2013;13(9):11913–11922. | ||
Quinn JG, O’Kennedy R, Smyth M, Moulds J, Frame T. Detection of blood group antigens utilising immobilised antibodies and surface plasmon resonance. J Immunol Methods. 1997;206(1–2):87–96. | ||
Hayden O, Mann K-J, Krassnig S, Dickert FL. Biomimetic ABO blood-group typing. Angewandte Chemie International Edition. 2006;45:2626–2629. | ||
Gordon JF, Hurts SN, Cohen DS. Methods and apparatus for blood typing with optical bio-disc. United States patent US 7087203. August 8, 2006. | ||
Kim DS, Lee SH, Ahn CH, Lee JY, Kwon TH. Disposable integrated microfluidic biochip for blood typing by plastic microinjection moulding. Lab Chip. 2006;6(6):794–802. | ||
Sultan E, Manseta K, Khwaja A et al. Modeling and tissue parameter extraction challenges for free space broadband fNIR brain imaging systems. Proc SPIE. 2011;7902:790223. | ||
Mansouri C, Kashou NH. New Window on Optical Brain Imaging: Medical Development, Simulations and Applications. In: Yasin M, Harun SW, Arof H editors. Selected topics on optical fiber technology. Rijeka, Croatia: InTech; 2012:271–288. 2012. | ||
Wu J-S, Yu L-P, Chou C. Measurement of the surface effect of a small scattering object in a highly scattering medium by use of diffuse photon-pairs density wave. J Biomed Opt. 2016;21(6):060504. | ||
Sultan E, Alkhateeb N. Characterization of frequency modulated wave of NIR Photons transport in human lower forearm phantom. Int J Biomedical Engineering and Technology. In press. | ||
Sultan E, Najafizadeh L, Gandjbakhche AH, Pourrezaei K, Daryoush A. Accurate optical parameter extraction procedure for broadband near-infrared spectroscopy of brain matter. J Biomed Opt. 2013;18(1):017008. | ||
Sultan E, Pourrezaei K, Ghandjbakhche A, Daryoush AS. 3D Numerical modeling and its experimental verifications for an inhomogeneous head phantom using broadband fNIR system. Int J Numer Method Biomed Eng. 2014;30(3):353–364. | ||
Sultan E, Ahmad N, Daryoush AS. Diagnosis of hand tumors using fNIR optical system. Int J Biosci Biotech. 2017;9(2):49–58. |
 © 2018 The Author(s). This work is published and licensed by Dove Medical Press Limited. The full terms of this license are available at https://www.dovepress.com/terms.php and incorporate the Creative Commons Attribution - Non Commercial (unported, v3.0) License.
By accessing the work you hereby accept the Terms. Non-commercial uses of the work are permitted without any further permission from Dove Medical Press Limited, provided the work is properly attributed. For permission for commercial use of this work, please see paragraphs 4.2 and 5 of our Terms.
© 2018 The Author(s). This work is published and licensed by Dove Medical Press Limited. The full terms of this license are available at https://www.dovepress.com/terms.php and incorporate the Creative Commons Attribution - Non Commercial (unported, v3.0) License.
By accessing the work you hereby accept the Terms. Non-commercial uses of the work are permitted without any further permission from Dove Medical Press Limited, provided the work is properly attributed. For permission for commercial use of this work, please see paragraphs 4.2 and 5 of our Terms.