")
Back to Journals » Cancer Management and Research » Volume 11
Novel nomograms individually predict the survival of patients with soft tissue sarcomas after surgery
Authors Zhang SL, Wang ZM, Wang WR, Wang X, Zhou YH
Received 4 December 2018
Accepted for publication 10 March 2019
Published 15 April 2019 Volume 2019:11 Pages 3215—3225
DOI https://doi.org/10.2147/CMAR.S195123
Checked for plagiarism Yes
Review by Single anonymous peer review
Peer reviewer comments 3
Editor who approved publication: Dr Alexandra R. Fernandes
Shi-Long Zhang,1,* Zhi-Ming Wang,2,3,* Wen-Rong Wang,4 Xin Wang,5 Yu-Hong Zhou2
1Institute of Fudan-Minhang Academic Health System, Minhang Branch, Zhongshan Hospital, Fudan University, Shanghai, 201199, People’s Republic of China; 2Department of Medical Oncology, Zhongshan Hospital, Fudan University, Shanghai, 200032, People’s Republic of China; 3Department of Medical Oncology, Xiamen Branch, Zhongshan Hospital, Fudan University, Xiamen, 361000, People’s Republic of China; 4Faculty of Physical Education, Shandong Normal University, Jinan, 250014, People’s Republic of China; 5Department of Acupuncture and Moxibustion, Central Hospital of Shanghai, Xuhui District, Shanghai, 200031, People’s Republic of China
*These authors contributed equally to this work
Background: The aim of the study was to build and validate practical nomograms to better predict the overall survival (OS) and cancer-specific survival (CSS) of the patients with soft tissue sarcomas (STS) who underwent surgery.
Methods: Patient data were extracted from the Surveillance, Epidemiology, and End Results (SEER) database. We identified 8804 patients who underwent surgery with STS between 2007 and 2015, and randomly divided them into the training (n=6164) and validation (n=2640) cohorts. The Cox regression analysis and cumulative incidence function were performed to identify the independent prognostic factors associated with OS and CSS, respectively. The performance of the nomograms was evaluated using Harrell’s concordance index (C-index) and the calibration curves. Decision curve analysis (DCA) was introduced to compare the clinical practicality between the nomograms and the AJCC staging system.
Results: Eight independent prognostic factors for OS and seven for CSS were determined and then used to build the nomograms for 3- and 5-year OS and CSS, respectively. The C-indexes of the nomograms for predicting OS were 0.788 in the internal validation and 0.823 in external validation, significantly higher than C-index of the AJCC staging system (P<0.001). The similar results were obtained in the validation cohort. Internal and external calibration curves for the predicting 3- and 5-year OS and CSS showed excellent agreement between the prediction and the actual survival outcomes. In addition, DCA demonstrated that our nomograms were superior over the AJCC staging system with obtaining more clinical net benefits.
Conclusions: We established and validated the nomograms that could accurately predict the 3- and 5-year OS and CSS for STS patients who underwent surgery. The nomograms showed more robust and applicable performance than the AJCC staging system for predicting OS and CSS.
Keywords: SEER, soft tissue sarcomas, prognosis, nomogram, decision curve analysis
Introduction
Soft tissue sarcomas (STS) are a group of rare solid tumors and accounts for around 1% of all malignancies.1 In 2018, an estimated 13,040 new cases will be diagnosed in the United States, with nearly 5,150 mortalities.2 It constitutes highly heterogeneous tumors of mesodermal origin with distinct clinicopathological features. And thus STS patients’ prognosis varies extremely. Surgical resection combined with radiotherapy is the current management for STS patients. Despite the great advances in diagnostic techniques and therapies, the overall prognosis of STS remains poor.3
The American Joint Commission on Cancer (AJCC) tumor-node-metastasis (TNM) staging systems, representing the gold standard classification system for STS,4 only takes into consideration the tumor size, nodal involvement, and distant metastases. However, studies have demonstrated that it does not provide sufficient details to encompass the diversity of STS and should be improved.5,6 Additionally, several other important factors such as age, race, tumor size, tumor differentiation, and socioeconomic status have also significant influences on the survival of STS patients. Ignoring these significantly survival-associated parameters would be unfavorable to survival prediction. Therefore, there is an urgent need to develop a comprehensive prognostic evaluation model considering both tumor characteristics and patient status in clinical practice.
Nomogram, as simple mathematical models for prediction, has widely used to predict cancer prognosis. Compared with the AJCC TNM staging system, nomograms can more accurately estimate survival for individual patients by integrating important prognostic variables.7–9 Since STS is very rare and histological heterogeneous, most analyses of prognostic factors are mainly from retrospective, single-center with small sample.10–13 To our knowledge, no nomogram has been built based on STS patients treated with surgery on the basis of population-based data. Therefore, we aimed to build and validate the first two nomograms for predicting OS and CSS for STS patients who underwent surgery based on population-based data in the Surveillance, Epidemiology, and End Results (SEER) database.
Materials and methods
Patients
Data about STS patients with surgical treatment were extracted from the SEER database (2007–2015), using the SEER*Stat software version 8.3.21,4. The inclusion criteria for the eligible patients were as follows: 1) STS was histologically diagnosed as the first and only primary tumor; 2) Patients older than 18 years old; 3) Demographic and clinicopathologic information were complete and detailed, and the follow-up was complete with known survival outcome. Patients were excluded if their diagnostic information was obtained only from a death certificate or autopsy report, as well as their survival time was less than 1 month. To construct and validate the nomogram, all STS patients were randomly divided into a training cohort (n=6164, 70%) and validation cohort (n=2640, 30%). Institutional review board approval was not demanded in our study for SEER database is publicly available and we get access to it via accession number: 10165-Nov 2017.
Study variables
The demographic and clinicopathologic data for each patient were extracted from the SEER database, including age, sex, race, marital status, median household income, and insurance status, tumor size, histologic subtype, grade, SEER stage, survival months, vital status and causes of death. The continuous variables including age and tumor size were converted to categorical variable according to optimal cutoffs, which were determined by X-tile program. (Age, ≤60 years, 60–75 years, >75 years; tumor size, ≤5 cm, 5–10 cm, >10 cm). The race consisted of white, black and others (American Indian/AK Native, Asian/Pacific Islander). Marital status was described as married, unmarried (single, divorced or widowed); insurance status, as insured and uninsured. Histologic subtypes were grouped as follows: liposarcoma, leiomyosarcoma, fibromyxosarcoma, malignant fibrous histiocytoma, hemangiosarcoma, malignant peripheral nerve sheath tumor, synovial sarcoma, rhabdomyosarcoma, undifferentiated sarcoma, and other sarcomas.
Statistical analysis
Construction of the nomograms
The training cohort was used to build the nomograms. One of the primary endpoints in our study was OS, which was calculated as the time from diagnosis to death due to any cause or censoring. The Kaplan–Meier method and log-rank test were applied in the univariate analysis. Variables significantly related with survival (P<0.05) in univariate analysis were subsequently subjected to the multivariable Cox regression analysis. Next, the independent prognostic factors determined in the multivariate Cox analysis were integrated to build the nomograms for OS.
The other primary endpoint was CSS, which was calculated as the time from diagnosis to death from STS. When building the competing risks nomograms for CSS, death from other causes was counted as a competing event. The cumulative incidence function was used to predict the probability of death from STS and other causes, respectively. Variables with P-values <0.001 in the Gray’s test were significant independent prognostic factors for CSS. By combining these factors, we built the competing risks nomograms for 3- and 5-year CSS in STS patients.15
Validation of the nomograms
The validations were performed both internally (in the training cohort) and externally (in the validation cohort), using C-index and calibration curve. A total of 1000 bootstrap resamples were used in both validations. The marginal estimate versus model average predictive probability was applied to plot calibration curves, representing the calibration between the prediction by nomogram and the actual survival outcome. In an excellently calibrated nomogram, the prediction would fall on a 45-degree diagonal. The C-index refers to the probability of concordance between the predictions and the actual survival outcome, with value fluctuating between 0.5 (no discrimination) and 1.0 (excellent discrimination).16
Decision curve analysis
Decision curve analysis (DCA) is a novel method for determining whether alternative diagnostic and prognostic systems have more net clinical benefits compared with other commonly used strategies. In this study, we conducted DCA to compare the clinical practicality and benefits between nomograms and the AJCC staging system in both the training and the validation cohort.
All statistics analyses were performed by R software (version 3.3.0). the R packages used in our study included survminer, rms, cmprsk, and rcorrcens. All statistical tests were two-sided, and P-value less than 0.05 was statistically significant.
Results
Demographic and clinicopathological characteristics of STS patients
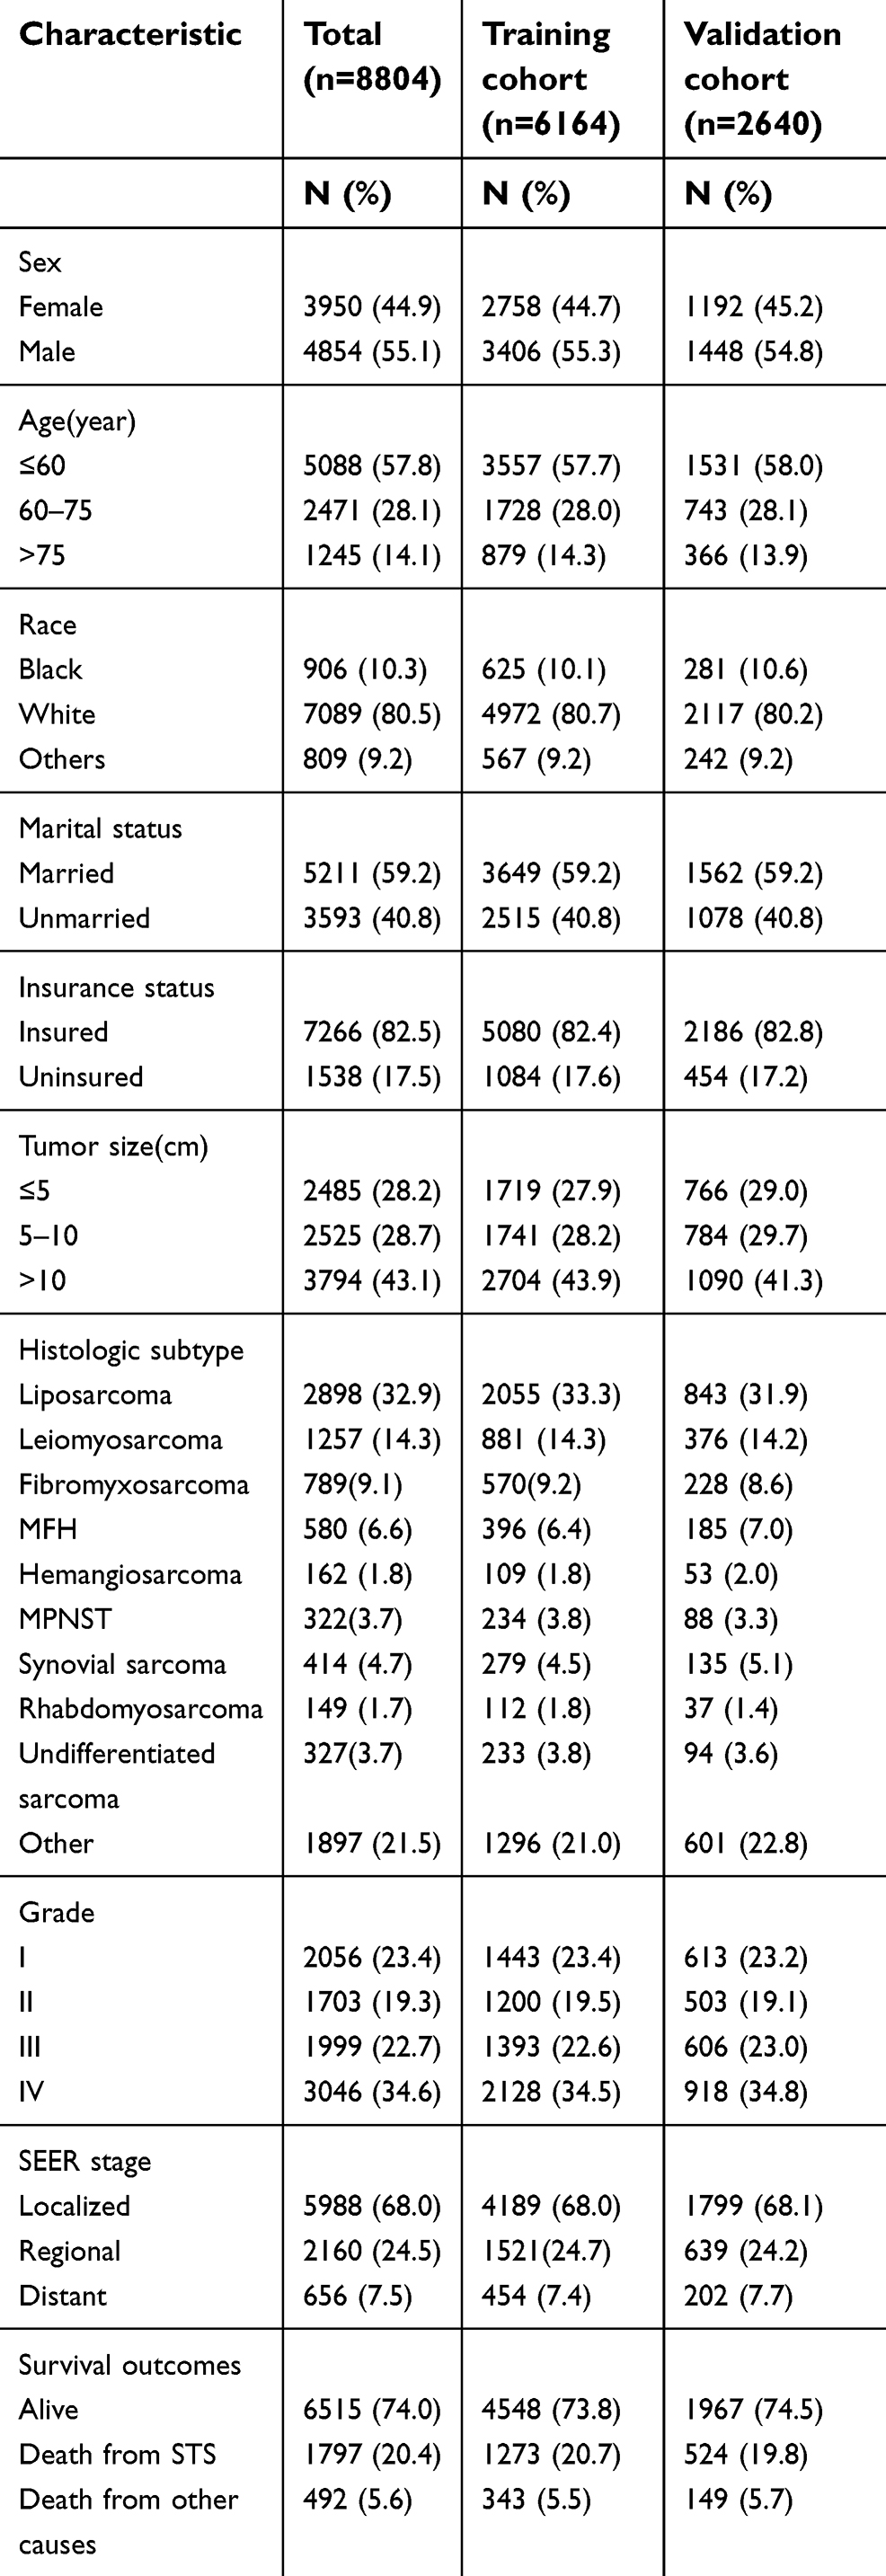
A total of 8,804 eligible STS patients who underwent surgery diagnosed between 2007 and 2015 in the SEER database were included. Of those patients, 6,164 patients were randomly assigned to the training cohort and 2,640 were to the validation cohort. In the whole cohort, the median age was 57.0 years (range:18–94 years) with a male-to-female ratio of approximately 1:1. The majority of STS patients were younger (57.8%), white (80.5%), insured (82.5%), and have localized SEER stage (68.0%). The median follow-up time was 31 months (range:13–107 months). At the end of follow up, 2,289 (36.0%) patients had died, with 1,797 (20.4%) deaths from STS and 492 (5.6%) deaths from other causes. The descriptive analysis of patient characteristics is shown in Table 1.
 | Table 1 Patient demographics and clinicopathological characteristics |
Nomograms predicting 3- and 5-year survival
In the training cohort, eight factors were identified as the independent prognostic factors according to the univariate and multivariate analyses (Table 2). These variables were age, sex, marital status, insurance status, tumor size, histologic subtype, histologic grade, and SEER stage. A nomogram based on the above variables was developed to estimate 3- and 5-year OS for STS patients with surgical treatment (Figure 1A). Estimates of cumulative incidences of death from CSS by clinicopathological variables are listed in Table 3. The main variables significantly associated with CSS were age, sex, insurance status, tumor size, histologic subtype, histologic grade, and SEER stage (P<0.001). A second nomogram predicting CSS was established using these variables (Figure 1B).
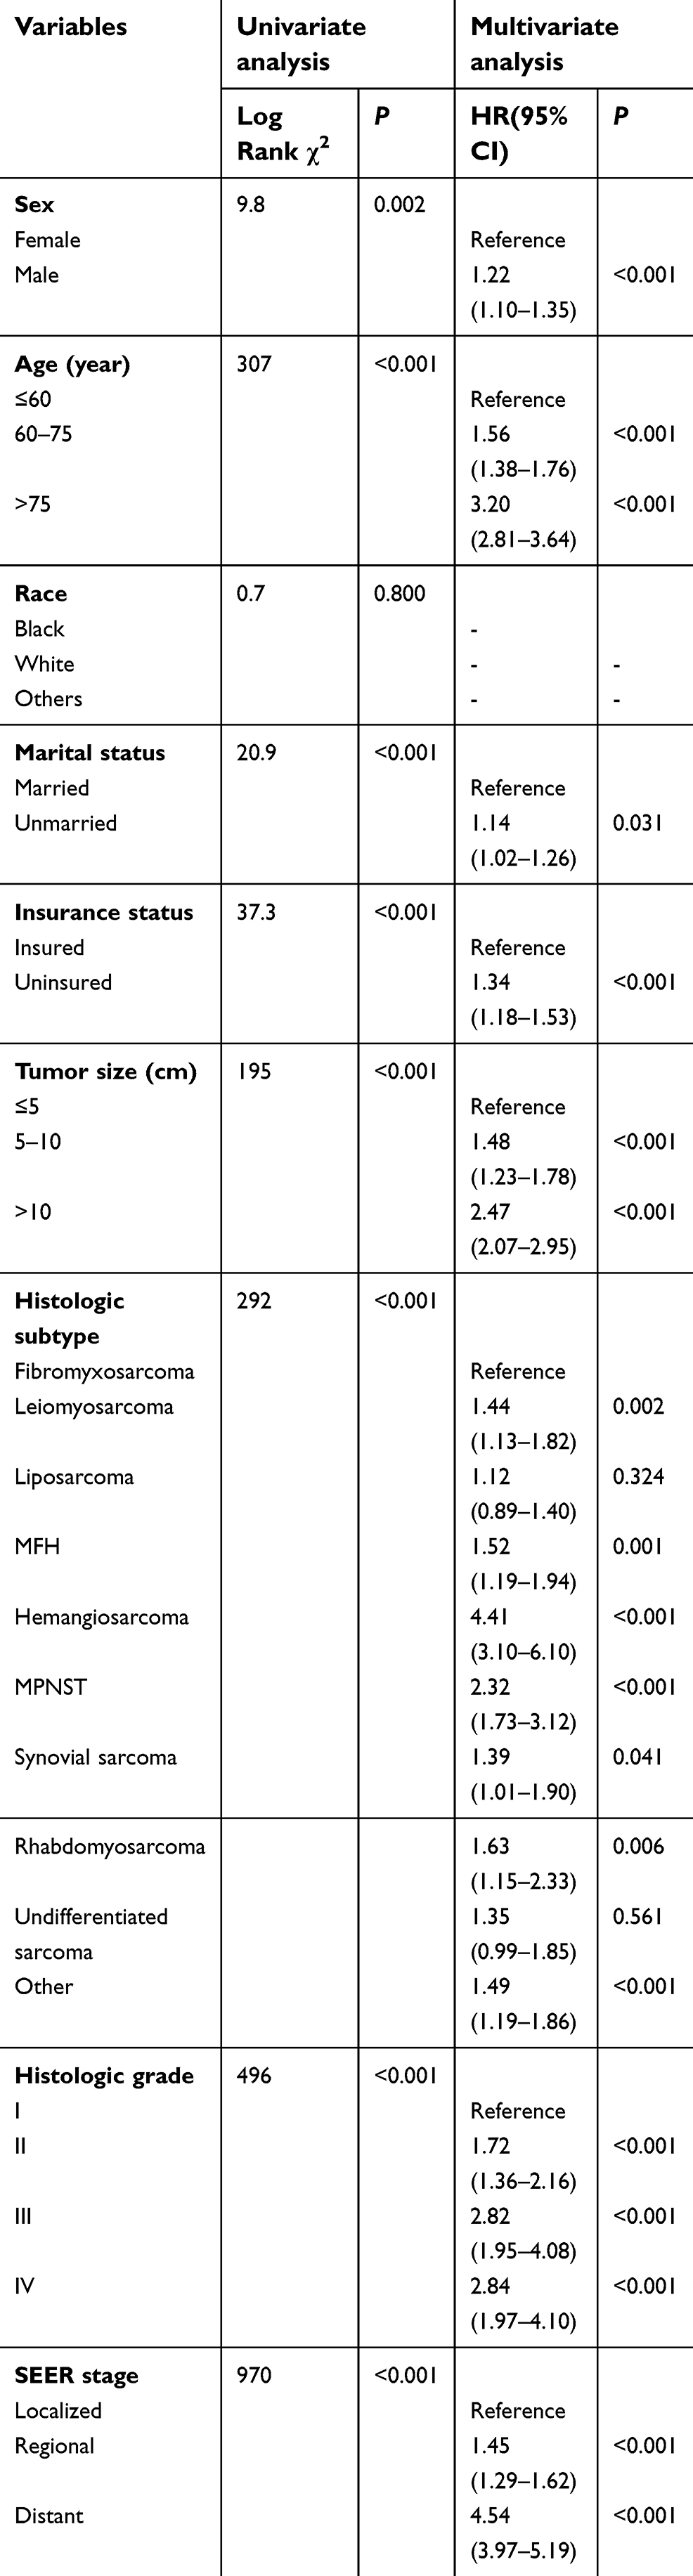 | Table 2 Univariate and multivariate analysis of OS in the training cohort |
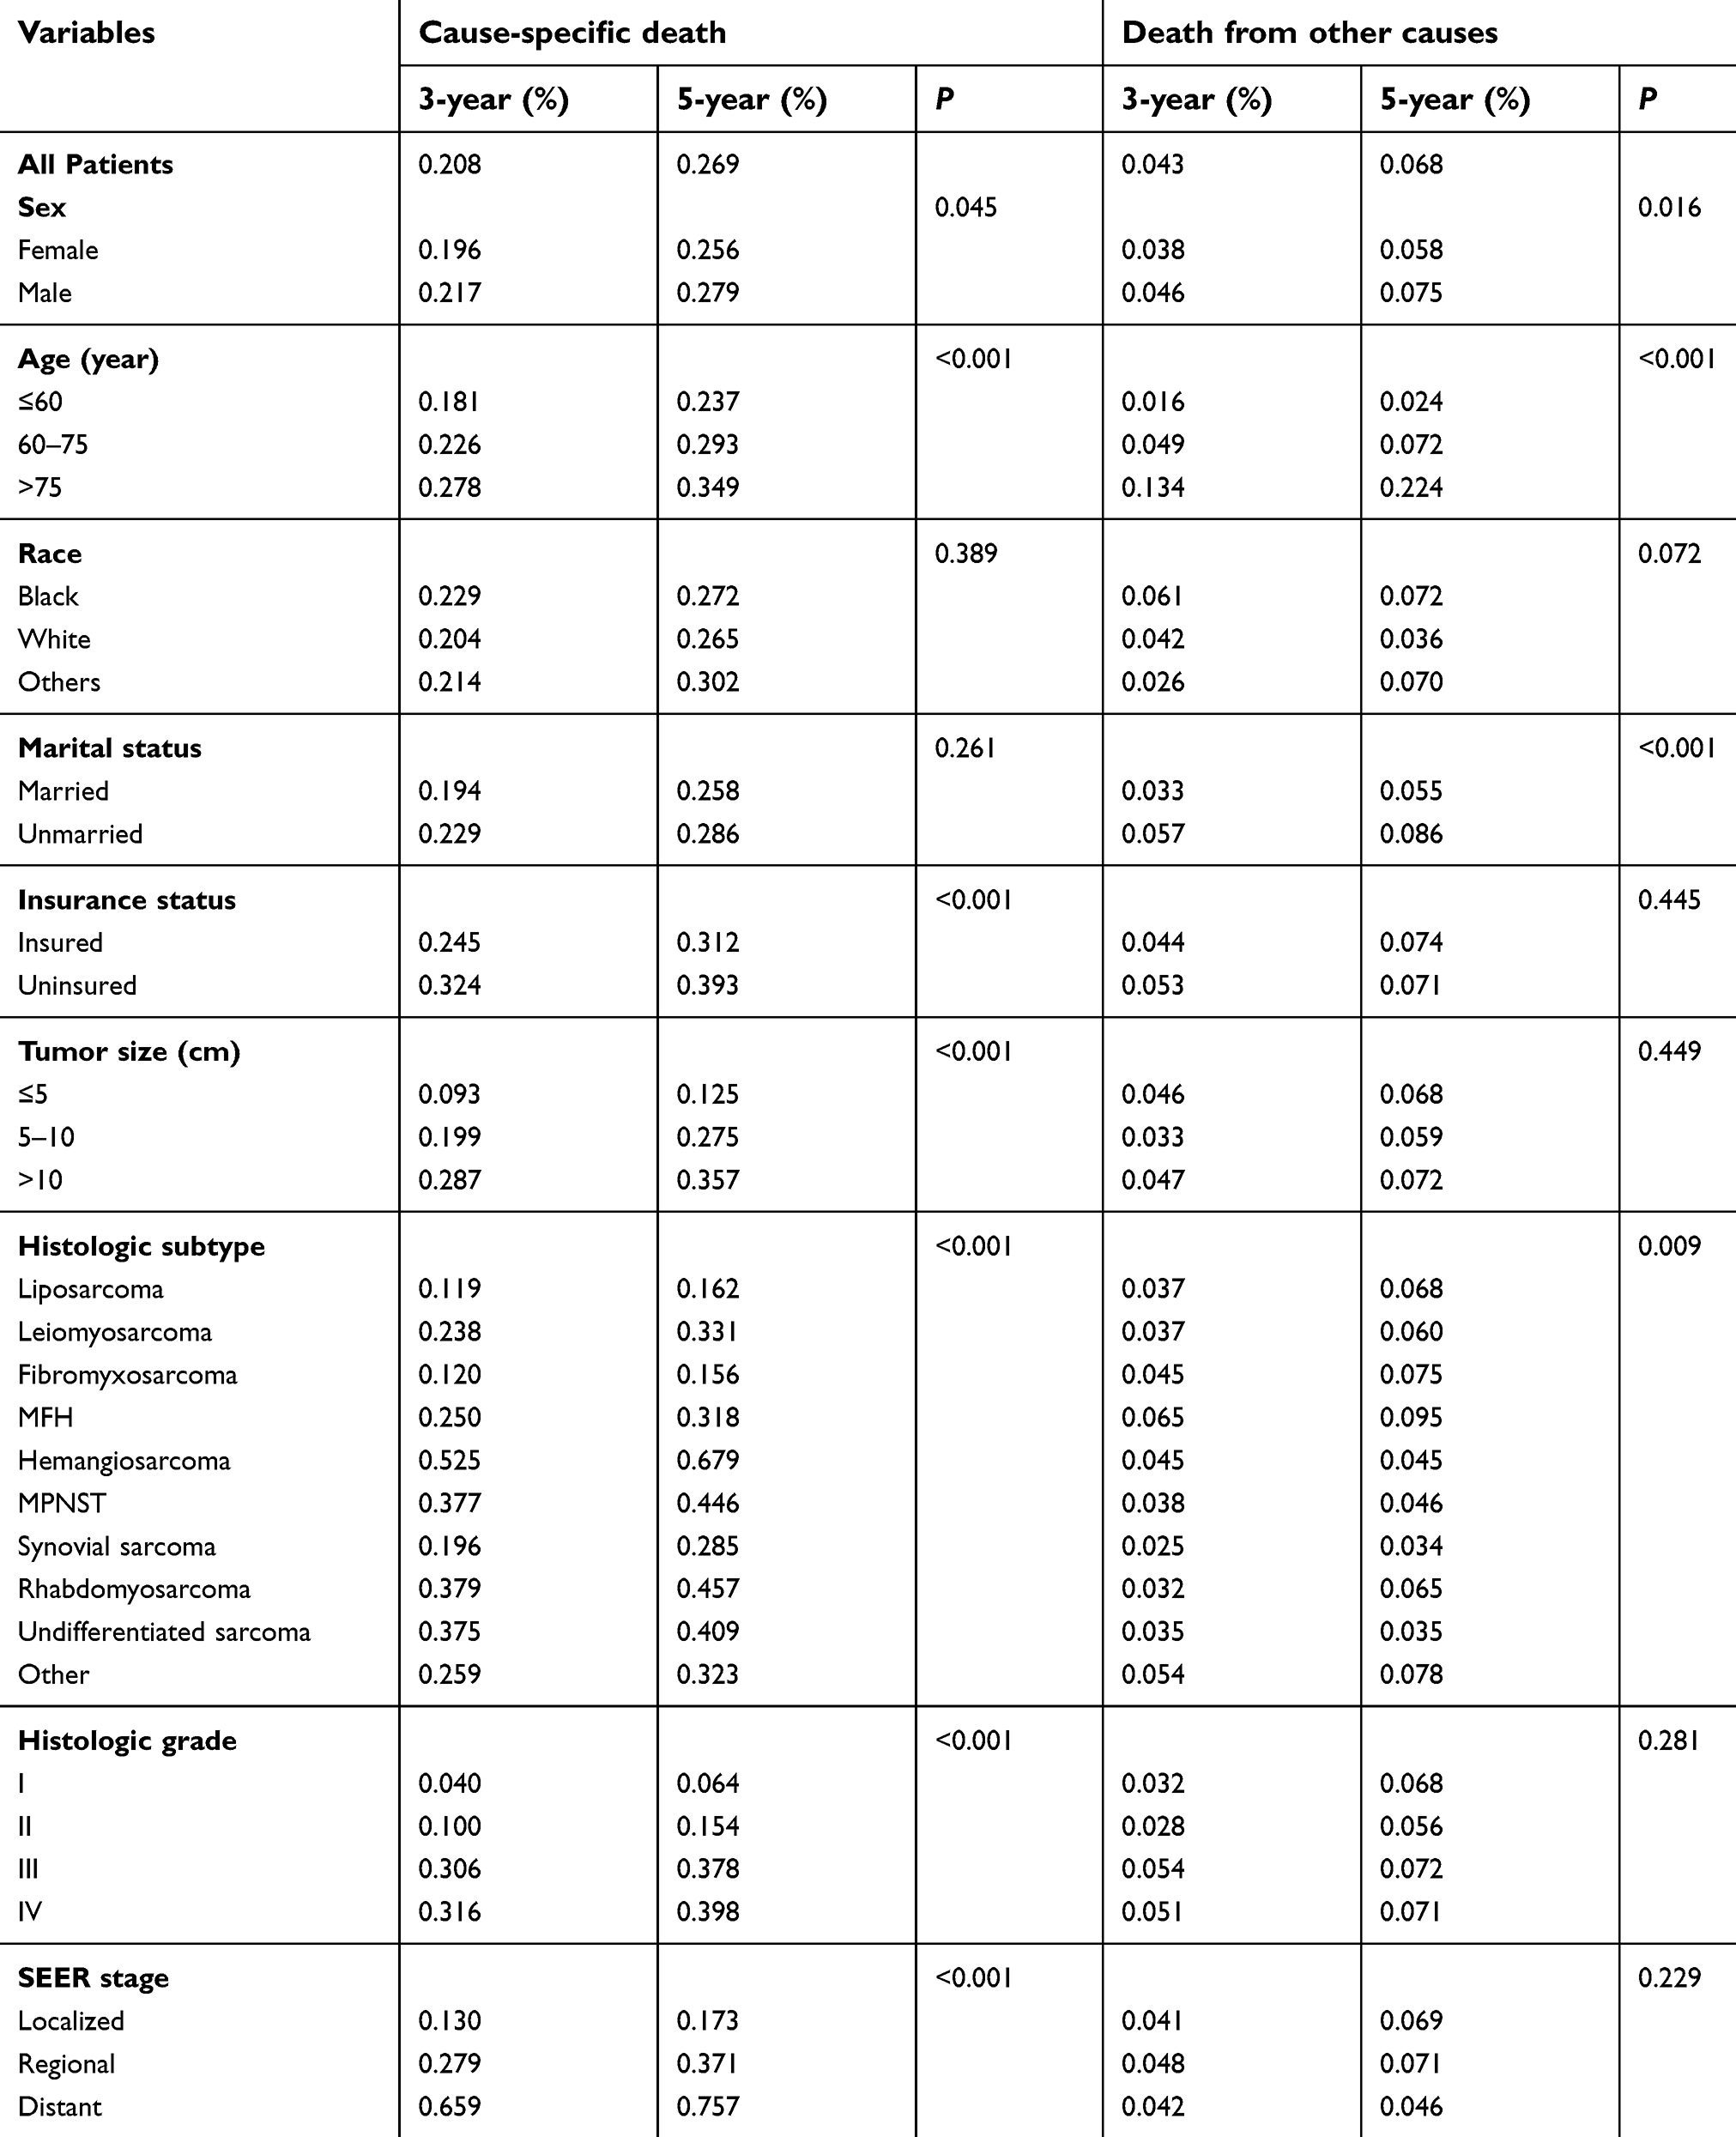 | Table 3 The 3- and 5-year cumulative incidences of death resulting from CSS among STS patients treated with surgery in the training cohort |
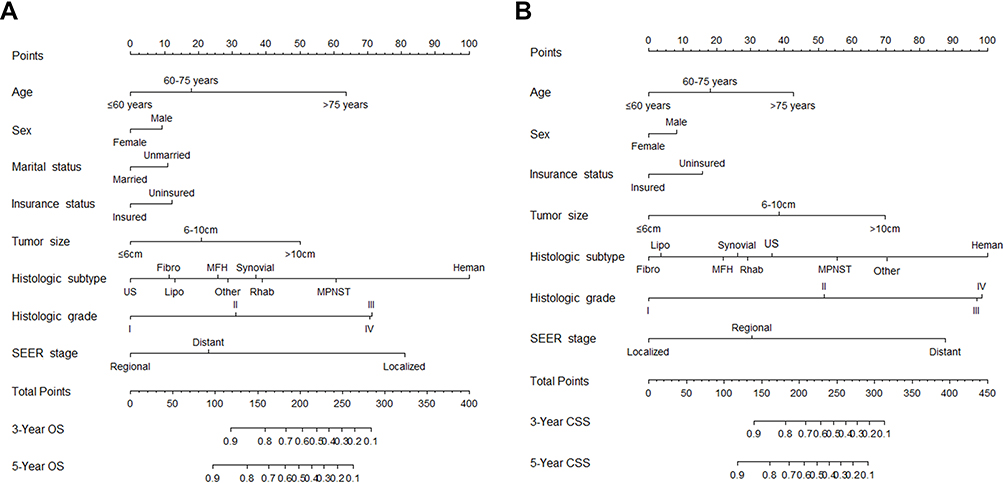 | Figure 1 Nomograms for predicting 3- and 5-year (A) OS and (B) CSS for STS patients treated with surgery.Abbreviations: Fibro, fibromyxosarcoma; Heman, hemangiosarcoma; Leio, leiomyosarcoma; Lipo, liposarcoma; MFH, malignant fibrous histiocytoma; MPNST, malignant peripheral nerve sheath tumor; Rhab, rhabdomyosarcoma; Synovial, synovial sarcoma; US, undifferentiated sarcoma. |
Using a nomogram to predict survival is simple. First, to include the relevant prognostic factor, a vertical line should be drawn from every factor to the “Points” line of nomogram. Then, the total scores are obtained and project them to the “Total Points” to get the patient’s probabilities of survival. To clarify, we took two STS patients, for example, a 65-year-old married man was diagnosed with liposarcoma (grade III, tumor size of 6.0 cm); he had insurance. By adding the points, he would score 118 points, which indicated that he has 86% probability of OS at the three year. However, for a 76-year-old unmarried female patient with hemangiosarcoma (grade IV, tumor size of 11.0 cm), who had no insurance, the total score would be 320 points; thus, her probability of OS at the three year would be well below 10%.
Nomogram validation
Internal validation through the training cohort showed that the C-indexes for the nomograms in predicting OS and CSS was 0.788 and 0.827, respectively. Similarly, in the external validation, the C-indexes for prediction of OS and CSS were 0.823 and 0.833, respectively. The internal and external calibration curves were shown in Figures 2 and 3, respectively, indicating excellent agreement between the nomograms prediction and actual survival outcomes.
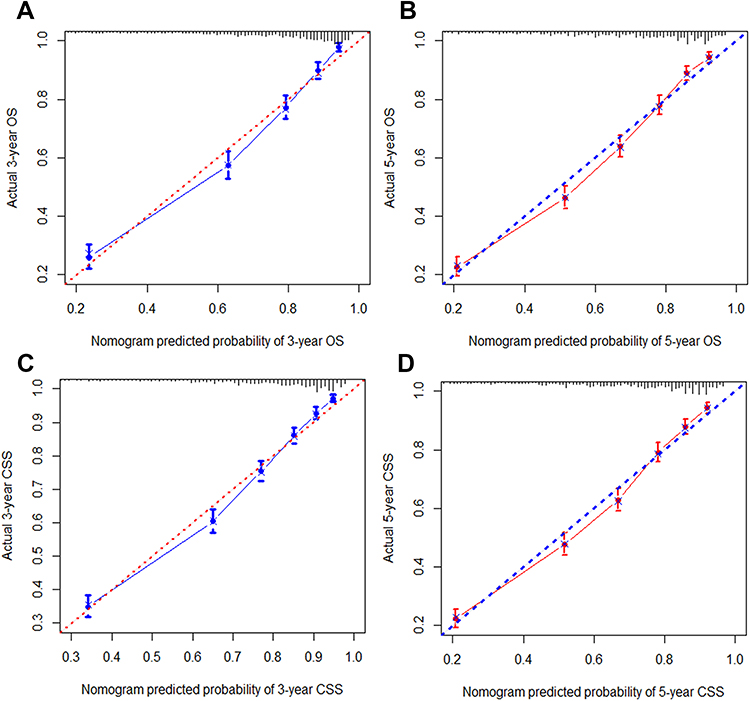 | Figure 2 Internal calibration curves. (A) 3-year and (B) 5-year OS nomogram calibration curves; (C) 3-year and (D) 5-year STS CSS nomogram calibration curves. The 45-degree line represents a perfect match between the nomogram-predicted survival (X-axis) and actual survival (Y-axis). The perpendicular line represents 95% confidence intervals of actual survival. |
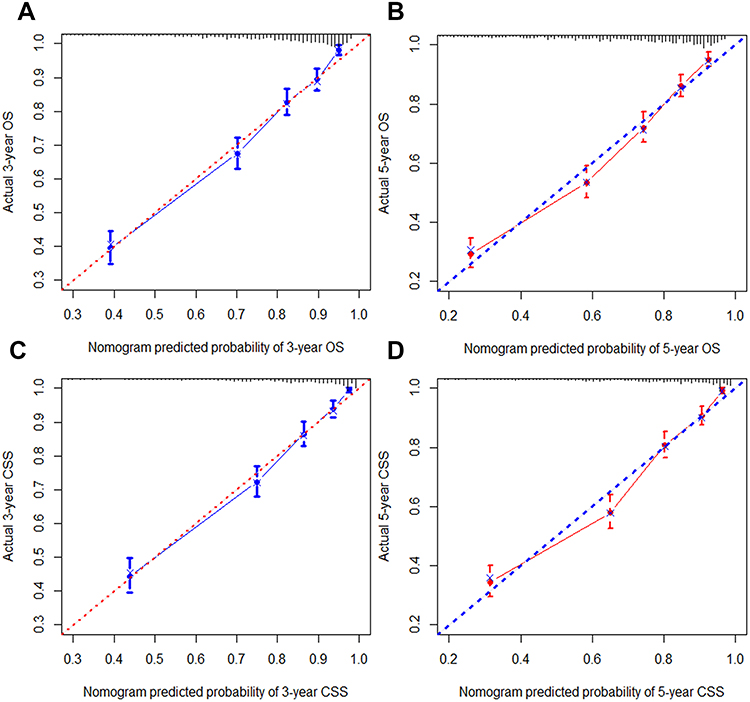 | Figure 3 External calibration curves. (A) 3-year and (B) 5-year OS nomogram calibration curves; (C) 3-year and (D) 5-year STS CSS nomogram calibration curves. The 45-degree line represents a perfect match between the nomogram-predicted survival (X-axis) and actual survival (Y-axis). The perpendicular line represents 95% confidence intervals of actual survival. |
Additionally, a comparison between our nomograms and the AJCC staging system in predicting OS/CSS was performed. In the training cohort, the C-indexes of the nomograms we established for predicting OS and CSS were obviously higher than that of the AJCC staging system (C-index for OS, 0.788 vs 0.722, P<0.001, C-index for CSS, 0.827 vs 0.755, P<0.001). Moreover, our nomograms also displayed more powerful efficiency of discrimination in the validation cohort compared with the AJCC staging system (C-index for OS, 0.823 vs 0.731, P<0.001, C-index for CSS, 0.833 vs 0.770, P<0.001)
Decision curve analysis
In the training cohort, our nomograms obtained more net benefits than the AJCC system within wide threshold probabilities, which indicated that the nomograms had good clinical applicability. For example, compared with the AJCC system, with a threshold probability of 0.4, our nomogram in predicting OS and CSS could obtain an increased net clinical benefit of 0.036, 0.015, respectively, (Figure 4A and B). Furthermore, when performing DCA in the validation cohort, similar results were obtained in assessment of OS and CSS (Figure 4C and D).
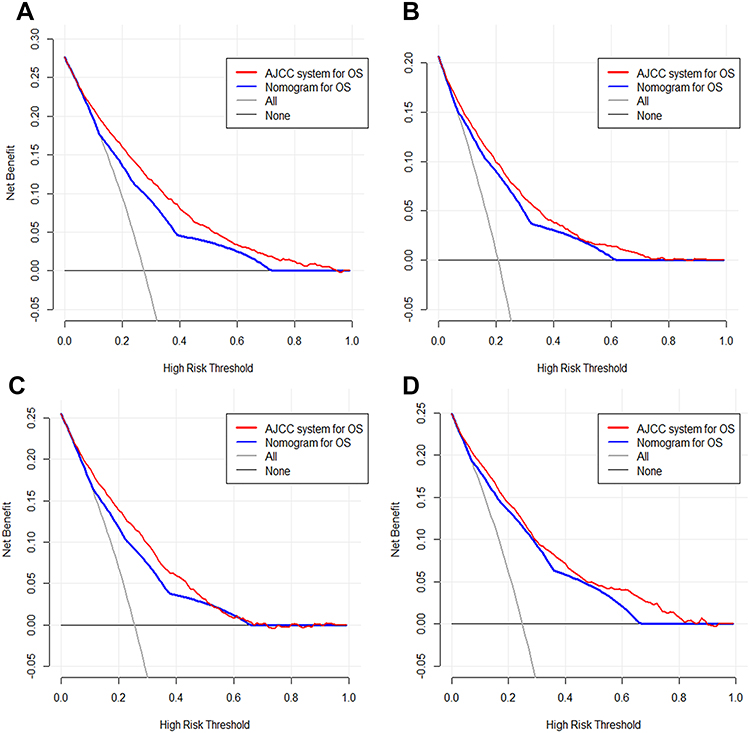 | Figure 4 Decision curve analysis of the nomograms and AJCC staging system in terms of OS (A) and CSS (B) in the training cohort and OS (C) and CSS (D) in the validation cohort. The nomograms obtain more net benefits than the AJCC staging system with a wider range of threshold probabilities. |
Discussion
In view of the rarity and heterogeneity of STS, evaluating prognosis has been challenging. To date, a brief nomogram that can estimate the OS and CSS accurately is still lacking. Herein, using the SEER database, we established and validated the first two prognostic nomograms for predicting the 3- and 5-year OS and CSS of the STS patients who underwent surgery. The nomograms showed excellent predictive performance in both internal and external validation. Furthermore, DCA showed that our nomograms outperformed the AJCC staging system with better clinical applicability. With our easily used nomograms, we can identify patients with different prognosis, thus facilitating individualized treatment and follow-up schedule.
At present, the area under curve (AUC) of the receiver operating characteristic (ROC) curve is often used to assess the prognostic model. However, the AUC merely represents the sum of accuracy and specificity of a model without considering the follow-up clinical influences of the predictive parameters: For example, the model with higher AUC score usually has high sensitivity, but strictly limited specificity.16 Decision curve analysis (DCA) is a simple and understandable mathematical model, and can evaluate the clinical applicability of a model. To our knowledge, no nomogram has introduced DCA to evaluate the clinical applicability and benefits. Hence, to avoid defects in the previous nomograms, we used DCA in our analysis, and the results showed that our nomograms had better clinical applicability with more net benefits than the current AJCC stages.
In particular, we assessed CSS using cumulative incidence function, which is robust method for analyzing CSS when competing events exist.17 And we furthermore built the competing risk nomograms to predict the probability of CSS. In clinical oncology, competing risks arise when death from other causes precludes the occurrence of CSS.18 In our study, among the 3,003 deaths in the training cohort, 2,434 (24.9%) deaths resulted from STS, while 569 (5.8%) died secondary to other causes. The 3- and 5-year cumulative incidences of death from STS were 0.258 and 0.325, respectively. Importantly, we observed increasing age had a negative effect on both deaths from STS and other causes. One possible reason for this phenomenon is that older patients more tend to suffer age-related comorbidities or postoperative complications and this would increase with age. These disadvantage conditions were to some extent disqualify them to undergo the same standard of therapy that offered for their younger counterparts. Thus, it is important to consider non-cancer-specific death when estimating survival for STS patients treated with surgery, especially for patients of older ages.
Several clinicopathologic characteristics were identified to be independent prognostic factors for OS in STS patients who underwent surgery, including age, sex, tumor grade, and TNM classifications, which was in line with the previous studies.19–21 In the training cohort, the HR of OS increased with age, patients older than 75 years had the worst survival among the STS patients. Sex is an important variable associated with different prognosis in cancers patients.20 In our analysis, the male STS patients experienced a worse survival compared to female patients. In addition, histological grade was imbedded to our nomogram for its high predictive value in our analysis. Histological differentiation could reflect the biological behaviors of malignant tumor, which had been used to predict survival in several models regarding STS.22,23
In recent years, researchers have paid more and more attention on the impact of socioeconomic status on cancer.24,25 Hence, the socioeconomic status was investigated in our analysis, which was not mentioned in all the previous nomograms for STS patients. It is the first time shown that insurance was an independent prognostic factor and was incorporated to newly prognostic nomogram for STS patients with surgery. Uninsured status would lead to decreased diagnosis rates and increased conservative treatment for cancers,26 thus undermine patients’ prognosis. Nowadays, the treatment for STS has become multidisciplinary and expensive. Conceivably, uninsured patients have fragile financial networks, which ultimately may hinder access to adequate management at superior hospitals, and the timely treatment of recurrent cancer. As a potential marker of socioeconomic status,27 married status was an independent prognostic factor for both OS and CSS, which accorded with our previous study.28 The married patients tend to enjoy better mental status and strong social support networks, including psychological support and financial resources,29 so that they could easily get access to the superior quality of the medical treatment and nursing service, which might contribute to their survival advantages. Therefore, we suggested the incorporation of socioeconomic status into prognosis evaluation systems for STS patients.
Nomograms display a wide application prospect in modern medical decision-making. They provide graphical depiction of statistical model that combines multiple parameters to calculate the probability of certain event.30–33 Accumulating evidence has documented that the nomogram shows higher prediction accuracy than the current AJCC staging system in multiple cancers, and thus it has been accepted as an alternative or even a novel staging system.34–36 For example, two T3N0M0 STS patients: case A) a 55-year-old married female patient, with grade IV fibromyxosarcoma, who had insurance, and case B) a 65-year-old unmarried man patient diagnosed with grade III hemangiosarcoma, who had no insurance. The survival outcomes of these patients were identical if we used the AJCC staging system. In contrast, according to our nomograms, the 5-year predicted OS for the case A and B were 92% and 58%, respectively. Moreover, the 5-year predicted CSS of the case A and B were 90% and 41%, respectively. These results well elucidated the flaws of the AJCC staging system in forecasting individual prognosis.
Inevitably, several potential limitations in our study should be mentioned. First, as a retrospective study, it has several inherent biases, such as selection bias and missing data, which might lead to inaccurate conclusions. Therefore, to further confirm the results, large prospective cohort or clinical trials may be required. Second, several prognostic factors, such as comorbidity,37 vascular invasion,38 surgical margin status,39,40 chemotherapy or other types of therapy, were not accessible in the SEER database, so we did not incorporate factors into our nomograms. For the same reason, we could not develop the nomogram for predicting disease-free survival and loco-regional control. Third, marital or insurance status might change after registering to the database or during the therapeutic process. Fourth, the SEER database only captures population data from certain states or regions and may, therefore, have some additional limitations in this respect compared with other national datasets. Nevertheless, this population was racially diverse and included patients from almost thousands of hospitals, our nomograms remained suitable for universal application. Finally, we used the same retrospective dataset to construct and validate the nomograms. To further improve the accuracy of our nomograms, prospective validation is warranted, or at least, external validation with independent study cohort.
Conclusion
In conclusion, we developed and validated the nomograms that estimated 3- and 5-year OS and CSS for STS patients based on a large population-based study cohort. These nomograms demonstrated more accurate and practical performance than the AJCC staging system. Our nomograms could contribute to more individualized and precise management strategies for STS patient.
Disclosure
The authors report no conflicts of interest in this work.
References
1. Lachenmayer A, Yang Q, Eisenberger CF, et al. Superficial soft tissue sarcomas of the extremities and trunk. World J Surg. 2009;33(8):1641–1649.
2. von Mehren M, Randall RL, Benjamin RS, et al. Soft tissue sarcoma, version 2.2018, NCCN clinical practice guidelines in oncology. J Natl Compr Canc Netw. 2018;16(5):536–563.
3. Casali PG, Abecassis N, Bauer S, et al. Soft tissue and visceral sarcomas: ESMO-EURACAN clinical practice guidelines for diagnosis, treatment and follow-up. Annals oncol. 2018;29(Supplement_4):iv51–iv67.
4. Cates JMM. The AJCC 8th edition staging system for soft tissue sarcoma of the extremities or trunk: a cohort study of the SEER database. J Natl Compr Canc Netw. 2018;16(2):144–152.
5. Fisher SB, Chiang YJ, Feig BW, et al. Comparative performance of the 7th and 8th editions of the american joint committee on cancer staging systems for soft tissue sarcoma of the trunk and extremities. Ann Surg Oncol. 2018;25(5):1126–1132.
6. Johnson AC, Ethun CG, Liu Y, et al. A novel, simplified, externally validated staging system for truncal/extremity soft tissue sarcomas: an analysis of the US sarcoma collaborative database. J Surg Oncol. 2018;118:1135–1141.
7. Valentini V, van Stiphout RG, Lammering G, et al. Nomograms for predicting local recurrence, distant metastases, and overall survival for patients with locally advanced rectal cancer on the basis of European randomized clinical trials. J Clin Oncol. 2011;29(23):3163–3172.
8. Nieder C, Mehta MP, Geinitz H, Grosu AL. Prognostic and predictive factors in patients with brain metastases from solid tumors: a review of published nomograms. Crit Rev Oncol Hematol. 2018;126:13–18.
9. Zheng Y, Fu S, He T, Yan Q, Di W, Wang J. Predicting prognosis in resected esophageal squamous cell carcinoma using a clinical nomogram and recursive partitioning analysis. Eur J Sur Oncol. 2018;44(8):1199–1204.
10. Look Hong NJ, Hornicek FJ, Raskin KA, et al. Prognostic factors and outcomes of patients with myxofibrosarcoma. Ann Surg Oncol. 2013;20(1):80–86.
11. Pakos EE, Gogou PV, Apostolikas N, Batistatou A, Tsekeris PG. Factors associated with outcome in liposarcomas of the extremities and trunk. J BUON. 2010;15(3):518–523.
12. Gustafson P. Soft tissue sarcoma. Epidemiology and prognosis in 508 patients. Acta Orthopaedica Scand Supplementum. 1994;259:1–31.
13. Zagars GK, Ballo MT, Pisters PW, et al. Prognostic factors for patients with localized soft-tissue sarcoma treated with conservation surgery and radiation therapy: an analysis of 1225 patients. Cancer. 2003;97(10):2530–2543.
14. Cronin KA, Ries LA, Edwards BK. The Surveillance, epidemiology, and end results (SEER) program of the national cancer institute. Cancer. 2014;120(Suppl 23):3755–3757.
15. Fine JP, Gray RJ. A proportional hazards model for the subdistribution of a competing risk. J Am Stat Assoc. 1999;94(446):496–509.
16. Wolbers M, Koller MT, Witteman JC, Steyerberg EW. Prognostic models with competing risks: methods and application to coronary risk prediction. Epidemiol. 2009;20(4):555–561.
17. Yang L, Takimoto T, Fujimoto J. Prognostic model for predicting overall survival in children and adolescents with rhabdomyosarcoma. BMC Cancer. 2014;14:654.
18. Callegaro D, Miceli R, Bonvalot S, et al. Development and external validation of two nomograms to predict overall survival and occurrence of distant metastases in adults after surgical resection of localised soft-tissue sarcomas of the extremities: a retrospective analysis. Lancet Oncol. 2016;17(5):671–680.
19. Iasonos A, Keung EZ, Zivanovic O, et al. External validation of a prognostic nomogram for overall survival in women with uterine leiomyosarcoma. Cancer. 2013;119(10):1816–1822.
20. Southern DA, Faris PD, Brant R, et al. Kaplan-Meier methods yielded misleading results in competing risk scenarios. J Clin Epidemiol. 2006;59(10):1110–1114.
21. Yang L, Shen W, Sakamoto N. Population-based study evaluating and predicting the probability of death resulting from thyroid cancer and other causes among patients with thyroid cancer. J Clin Oncol. 2013;31(4):468–474.
22. Jakobsen L, Niemann T, Thorsgaard N, et al. Dimensions of socioeconomic status and clinical outcome after primary percutaneous coronary intervention. Circ Cardiovasc Interv. 2012;5(5):641–648.
23. Shapiro M, Chen Q, Huang Q, et al. Associations of socioeconomic variables with resection, stage, and survival in patients with early-stage pancreatic cancer. JAMA Surg. 2016;151(4):338–345.
24. Deb S, Pendharkar AV, Schoen MK, Altekruse S, Ratliff J, Desai A. The effect of socioeconomic status on gross total resection, radiation therapy and overall survival in patients with gliomas. J Neurooncol. 2017;132(3):447–453.
25. Aizer AA, Chen MH, McCarthy EP, et al. Marital status and survival in patients with cancer. J Clin Oncol. 2013;31(31):3869–3876.
26. Xie JC, Yang S, Liu XY, Zhao YX. Effect of marital status on survival in glioblastoma multiforme by demographics, education, economic factors, and insurance status. Cancer Med. 2018;7(8):3722–3742.
27. Shi RL, Qu N, Lu ZW, Liao T, Gao Y, Ji QH. The impact of marital status at diagnosis on cancer survival in patients with differentiated thyroid cancer. Cancer Med. 2016;5(8):2145–2154.
28. Costa LJ, Brill IK, Brown EE. Impact of marital status, insurance status, income, and race/ethnicity on the survival of younger patients diagnosed with multiple myeloma in the United States. Cancer. 2016;122(20):3183–3190.
29. Chin B, Murphy MLM, Janicki-Deverts D, Cohen S. Marital status as a predictor of diurnal salivary cortisol levels and slopes in a community sample of healthy adults. Psychoneuroendocrinology. 2017;78:68–75.
30. Xie D, Allen MS, Marks R, et al. Nomogram prediction of overall survival for patients with non-small-cell lung cancer incorporating pretreatment peripheral blood markers. Eur J Cardio-Thoracic Surg. 2018;53(6):1214–1222.
31. Li K, Wang R, Huang S, et al. Prognostic nomogram for overall survival in extranodal natural Killer/T-cell lymphoma patients. Clin Lymphoma Myeloma Leuk. 2018;18:e537–e543.
32. Hang J, Wu L, Zhu L, et al. Prediction of overall survival for metastatic pancreatic cancer: development and validation of a prognostic nomogram with data from open clinical trial and real-world study. Cancer Med. 2018;7:2974–2984.
33. Wang W, Sun Z, Deng JY, et al. A novel nomogram individually predicting disease-specific survival after D2 gastrectomy for advanced gastric cancer. Cancer Commun. 2018;38(1):23.
34. Chen J, Fang A, Chen M, et al. A novel inflammation-based nomogram system to predict survival of patients with hepatocellular carcinoma. Cancer Med. 2018;7:5027–5035.
35. Kong X, Li J, Cai Y, et al. A modified TNM staging system for non-metastatic colorectal cancer based on nomogram analysis of SEER database. BMC Cancer. 2018;18(1):50.
36. Pan JJ, Ng WT, Zong JF, et al. Prognostic nomogram for refining the prognostication of the proposed 8th edition of the AJCC/UICC staging system for nasopharyngeal cancer in the era of intensity-modulated radiotherapy. Cancer. 2016;122(21):3307–3315.
37. Okamoto M, Kito M, Yoshimura Y, et al. The status quo of treatment and clinical outcomes for patients over 80 years of age with high-grade soft tissue sarcoma: report from the soft tissue tumor registry in Japan. Jpn J Clin Oncol. 2018;48(10):900–905.
38. Grunwald V, Litiere S, Young R, et al. Absence of progression, not extent of tumour shrinkage, defines prognosis in soft-tissue sarcoma - an analysis of the EORTC 62012 study of the EORTC STBSG. Eur J Cancer. 2016;64:44–51.
39. Stevenson JD, Laitinen MK, Parry MC, Sumathi V, Grimer RJ, Jeys LM. The role of surgical margins in chondrosarcoma. Eur J Sur Oncol. 2018;44(9):1412–1418.
40. Zagars GK, Ballo MT, Pisters PW, Pollock RE, Patel SR, Benjamin RS. Surgical margins and reresection in the management of patients with soft tissue sarcoma using conservative surgery and radiation therapy. Cancer. 2003;97(10):2544–2553.
 © 2019 The Author(s). This work is published and licensed by Dove Medical Press Limited. The full terms of this license are available at https://www.dovepress.com/terms.php and incorporate the Creative Commons Attribution - Non Commercial (unported, v3.0) License.
By accessing the work you hereby accept the Terms. Non-commercial uses of the work are permitted without any further permission from Dove Medical Press Limited, provided the work is properly attributed. For permission for commercial use of this work, please see paragraphs 4.2 and 5 of our Terms.
© 2019 The Author(s). This work is published and licensed by Dove Medical Press Limited. The full terms of this license are available at https://www.dovepress.com/terms.php and incorporate the Creative Commons Attribution - Non Commercial (unported, v3.0) License.
By accessing the work you hereby accept the Terms. Non-commercial uses of the work are permitted without any further permission from Dove Medical Press Limited, provided the work is properly attributed. For permission for commercial use of this work, please see paragraphs 4.2 and 5 of our Terms.