")
Back to Journals » Neuropsychiatric Disease and Treatment » Volume 14
Novel ensemble method for the prediction of response to fluvoxamine treatment of obsessive–compulsive disorder
Authors Hasanpour H, Ghavamizadeh Meibodi R, Navi K , Asadi S
Received 7 May 2018
Accepted for publication 24 May 2018
Published 10 August 2018 Volume 2018:14 Pages 2027—2038
DOI https://doi.org/10.2147/NDT.S173388
Checked for plagiarism Yes
Review by Single anonymous peer review
Peer reviewer comments 2
Editor who approved publication: Dr Roger Pinder
Hesam Hasanpour,1 Ramak Ghavamizadeh Meibodi,1 Keivan Navi,1 Sareh Asadi2
1Department of Computer Science and Engineering, Shahid Beheshti University, Tehran, Iran; 2Neuroscience Research Center, Shahid Beheshti University of Medical Sciences, Tehran, Iran
Objective: About 30% of obsessive–compulsive disorder (OCD) patients exhibit an inadequate response to pharmacotherapy. The detection of clinical variables associated with treatment response may result in achievement of remission in shorter period, preventing illness development and reducing socioeconomic costs.
Methods: In total, 330 subjects with OCD diagnosis underwent 12-week pharmacotherapy with fluvoxamine (150–300 mg). Treatment response was ≥25% reduction in Yale-Brown Obsessive–Compulsive Scale (Y-BOCS) score. In total, 36 clinical attributes of 151 subjects who had completed their treatment course were analyzed. Data mining algorithms included missing value handling, feature selection, and new analytical method based on ensemble classification. The results were compared with those of other traditional classification algorithms such as decision tree, support vector machines, k-nearest neighbor, and random forest.
Results: Sexual and contamination obsessions are high-ranked predictors of resistance to fluvoxamine pharmacotherapy as well as high Y-BOCS obsessive score. Our results showed that the proposed analysis strategy has good ability to distinguish responder and nonresponder patients according to their clinical features with 86% accuracy, 79% sensitivity, and 89% specificity.
Conclusion: This study proposed an analytical approach which is an accurate and a sensitive method for the analysis of high-dimensional medical data sets containing more number of missing values. The treatment of OCD could be improved by better understanding of the predictors of pharmacotherapy, which may lead to more effective treatment of patients with OCD.
Keywords: obsessive–compulsive disorder, ensemble classification, treatment predictors, attribute bagging, fluvoxamine, contamination, sexual obsession
Introduction
Obsessive–compulsive disorder (OCD) is a neuropsychiatric disorder and affects 1%–3% of the population worldwide1 and 1.8% (0.7% and 2.8% in men and women, respectively) in Iran.2
Pharmacotherapy and cognitive–behavioral therapy are considered effective for the treatment of this disorder.3 First-line drugs for OCD pharmacotherapy are serotonin reuptake inhibitors (SRIs),4 but 40%–60% of patients do not respond adequately to a trial of these drugs.5,6 The Yale-Brown Obsessive–Compulsive Scale (Y-BOCS) is frequently used to quantify the severity of obsessive–compulsive (OC) symptoms. Responders are clinically defined as patients who show >25% or 35% decline in Y-BOCS rating, although they may experience significant impairment from their residual OCD symptoms.4,7 Approximately one third of nonresponders to initial SRI monotherapy respond to a second, different SRI, but others are refractory patients who do not respond adequately to SRI pharmacotherapy.5
To find the most effective SRI, each medication has to be tried sequentially for at least 12 weeks.8 Using appropriate response predictors may result in the achievement of remission in shorter period, preventing illness development and reducing socioeconomic costs. There have been several attempts to detect predictors of treatment response with SRIs using demographic and clinical characteristics of OCD patients, their genotype, and the results of neuroimaging assessments.6,9–11
Studies investigated the possible association of OCD clinical characteristics, including symptom dimensions and SRI treatment, reported different predictors for treatment response. Factors that have been associated with poor response to OCD treatment include hoarding dimension,12–17 somatic obsessions,6 contamination and cleaning,15,18,19 repeating rituals and counting compulsions,13 obsessions of symmetry,15,17,20 poor insight,6,21,22 sexual/religious obsessions,23,24 severity of compulsions,19,25 early onset and chronic course of OC symptoms,6,19,26–30 psychiatric comorbidity,31–38 lack of sensory phenomena and greater symptom severity,35,39 SRI treatment at intake,37 absence of family history,6 family involvement in the OC symptoms,40,41 being male,30 being older at intake,30 and longer duration of illness.36,42
While greater OCD severity at intake was reported as the predictor of poor response to treatment,10,11,30,36,38,40,43,44 three studies found a better response in those with higher baseline severity of illness.45–47 Moreover, forbidden thoughts (sexual/religious/harm-related obsessions) with checking compulsions were associated with better acute medication response,15,20 but poor long-term outcome and treatment refractoriness were also reported.20,23,48 The other predictors of good response to SRI treatment were having a partner35,37,40 and washing and obsessive thoughts.49
The presence of numerous different kinds of variables that affect response to OCD treatment makes it difficult to detect appropriate predictors for treatment responder and nonresponder discrimination. Data mining provides an opportunity for the assessment of all potential predictors simultaneously. Machine learning methods not only consider the effect of each variable on the outcome of interest separately but also identify patterns of information that are useful to predict outcomes at the individual patient level.50
Machine learning is commonly used in the social and applied sciences, but limited attempts use this method in clinical research, especially psychiatry studies. However, some machine learning methods such as support vector machine (SVM), support vector regression, and random forest (RF) were used in OCD clinical research. Hoexter et al used machine learning methods to discriminate patients from healthy controls through brain structural magnetic resonance imaging and to predict OCD severity in patients.51 In another study, machine learning methods were used to predict remission in OCD.25 To our knowledge, feature selection and ensemble classification have not yet been applied to predict treatment response in OCD.
In this study, we aimed at developing a classification algorithm based on an ensemble of classifiers to be used for the prediction of treatment response in order to help individualize clinical assignment of treatment. We assessed demographic and clinical variables of Iranian OCD patients to find the most important attributes and applied the proposed machine learning approach to predict OCD treatment response in fluvoxamine pharmacotherapy.
Methods
Subjects and treatment procedure
In total, 330 outpatients with Iranian origin meeting the text revision of the Diagnostic and Statistical Manual of Mental Disorders, 4th edition (DSM-IV-TR) criteria for OCD were recruited from Imam Hossain Hospital (Tehran, Iran) between 2014 and 2017. The diagnosis was established for the subjects by the administration of the structured clinical interview for DSM-IV-TR by psychiatrists, and the patients were checked for disease symptoms and severity using the Persian version of Y-BOCS checklist and severity scale.52
Inclusion criteria were the following: 1) meeting DSM-IV-TR criteria for OCD; 2) aged between 18 and 65 years; 3) having OCD symptoms for >1 year; and 4) a drug-free period of at least 3 weeks.
Exclusion criteria were the following: 1) with a history of mental retardation; 2) having psychotic disorders; 3) having severe neurological pathology; 4) having other DSM-lV-TR Axis I disorders except depression, anxiety, or tic disorder; 5) with a history of substance use; 6) with a total Y-BOCS severity <9; 7) being under the selective serotonin reuptake inhibitor (SSRI) or antidepressant pharmacotherapy; 8) having prominent suicidal ideation; 9) pregnancy or lactation; and 10) refusal to participate or take treatment procedure.
All the subjects completed a semi-structured interview that recorded clinical and sociodemographic data, such as age at assessment, gender, marital status, educational level, occupation, chief complaint, age of onset, and the familial history of any psychiatric disorders, specifically OCD.
Pharmacotherapy was defined as 12-week treatment with fluvoxamine (150–300 mg). No concomitant therapy was allowed during the whole treatment period, either pharmacological or nonpharmacological. Fluvoxamine daily dose was initiated from 25 mg/day, increased to 50 mg/day after a week, and up to 100 mg/day for the third week. Its daily dose was increased up to 150 mg/day for the next 3 weeks, and after the sixth week, the patients were visited by the psychiatrist, and the fluvoxamine dose was adjusted based on the severity of patients’ symptoms.
As ~60% of patients experience SRI pharmacotherapy that provided at least a 25%–35% decrease in OC severities on Y-BOCS,7 one of these cut points has typically been considered as the criterion for responsiveness. In an adequate trial of an SRI, a <25% decrease in the Y-BOCS score in patients with at least moderate symptom severity is usually considered nonresponse.4 We also chose 25% improvement cut point for fluvoxamine responsiveness.
The severity of OCD symptoms at the first visit before treatment initialization and after 12-week treatment was scored using the Y-BOCS, by an experienced psychologist. According to the reduction in patients’ Y-BOCS scores at the beginning of the treatment compared with the scores after 12 weeks of treatment with fluvoxamine, they were divided into two groups: Group A (responders) was comprised of patients who exhibited >25% reduction in Y-BOCS scores after treatment with fluvoxamine, and group B (nonresponder) was comprised of patients who exhibited <25% reduction in Y-BOCS scores.5,53 We included another group (refractory patients) comprised of patients experienced various SSRI trials during their illness period, but the severity of their symptoms did not change or even became worse.4
Upon OCD diagnosis and meeting the inclusion criteria, 368 patients were invited to participate in the study, but some of them (19 patients) refused to participate, and 19 patients were excluded from the study due to total Y-BOCS severity score <9 (N=6), the history of substance use (N=3), the presence of psychotic disorders or severe neurological disorders (N=4), and other reasons (N=6). Of 330 patients who had participated in the study, 151 had completed it and were eligible for the analysis of response predictors. The remainders were excluded due to denial to come for follow-up (N=110), refusal to take medication (N=38), and other reasons (N=31). The CONSORT diagram in Figure 1 summarizes the flow of participants through different stages of the trial.
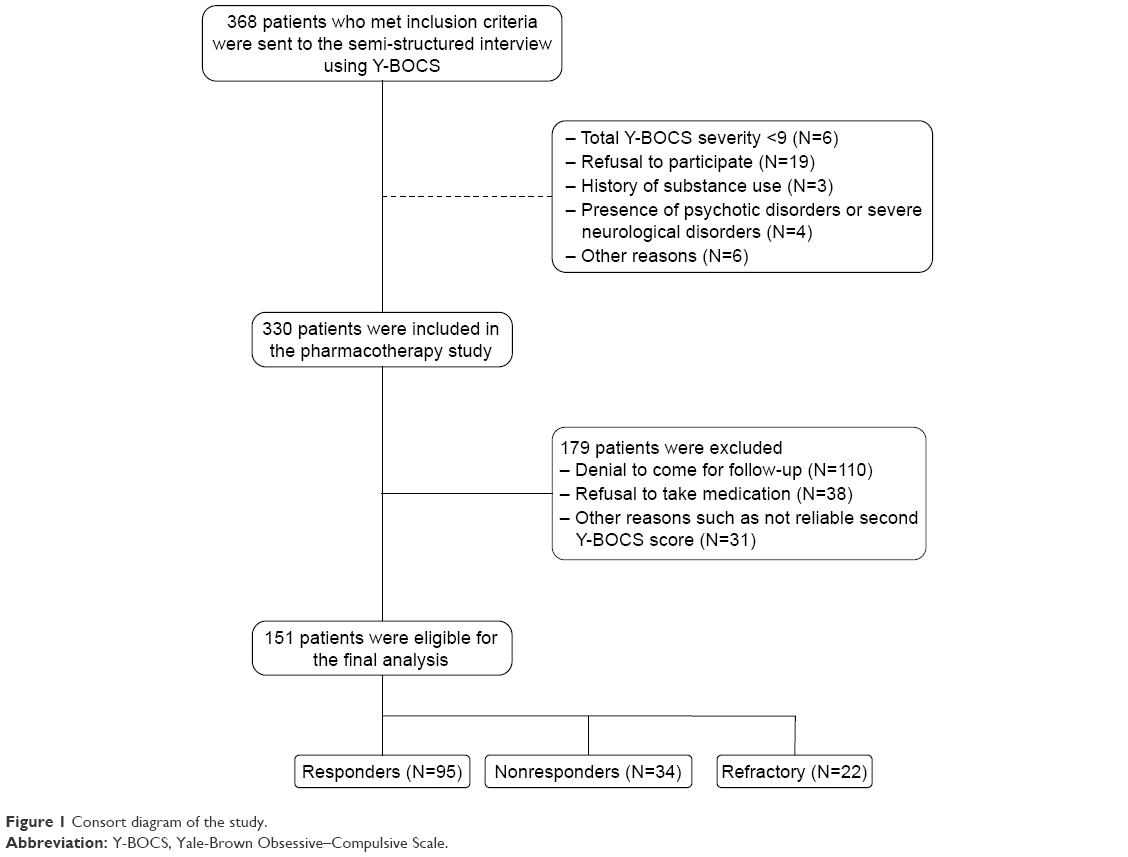 | Figure 1 Consort diagram of the study. |
Written informed consent was obtained from all subjects after a full description of the study. This study was performed in accordance with the World Medical Association’s Declaration of Helsinki and approved by the Neuroscience Research Center Ethical Committee (Project No IR.SBMU.PHNS.REC.1396.2).
Data processing
All data processing and analyses were conducted using MATLAB Version 2014a (The MathWorks Inc., Natick, MA, USA).
Variables
Response to treatment (responder, nonresponder, and refractory) was considered as a dependent variable, and sociodemographic and clinical variables were considered as independent variables (predictors). Thirty-six variables were studied as predictors such as gender, marital status, employment, educational level, family history, initial Y-BOCS obsession score, initial Y-BOCS compulsion score, Y-BOCS obsession subtypes, Y-BOCS compulsion subtypes, insight, avoidance, depression score, age of onset, and illness duration. Moreover, exploratory factor analysis was applied to the 13 Y-BOCS obsession and compulsion categories.54 Underlying factors were detected as factor 1: aggression, contamination, sexual, and religious obsessions as well as somatic, checking, and repeating compulsions; factor 2: symmetry obsession and cleaning, counting, and ordering compulsions; factor 3: contamination obsession and cleaning compulsion; and factor 4: hoarding obsession and compulsion. These factors were also considered as variables in our analysis.
Missing values
One of the important challenges in the analysis of medical data sets is the presence of missing values. Several methods have been proposed to treat missing data such as case deletion or replacing the missing attribute by the mean of known values of that attribute. Acuna and Rodriguez55 compared four different methods for treating missing values (case deletion, mean imputation, median imputation, and k-nearest neighbor [KNN] imputation) to evaluate the misclassification error rate of these methods. Their results showed that KNN imputation procedure performs better in dealing with missing values.55 In KNN imputation method, the missing values of an instance are imputed, considering a given number of instances that are most similar to the instance of interest. In the present study, we used KNN imputation procedure described in Box 1. Briefly, at first, we divided the samples into two groups, the samples with missing values and the samples without missing values. At the next step, for each instance of interest with missing values, we found the KNNs from the samples with complete data that have the same class of treatment response (responder, nonresponder, and refractory) and calculated the means of continuous variables or found the modes of nominal or ordinal features of these samples. Finally, we imputed these values to the missing values of the instance of interest. Thirty-one patients (21%) had attributes with missing values, and other patients’ data (79%) were complete. The proportion of missing data to all was 4%. The mechanism of missing data was missing at random which means that propensity for a data point to be missing is related to some of the observed data.
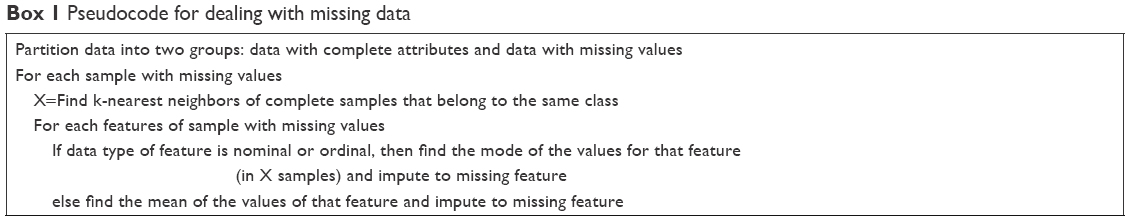 | Box 1 Pseudocode for dealing with missing data |
Feature selection
The presence of a lot of features affecting treatment response in psychiatric disorders and the small sample size emerge as common problems for the detection of treatment response predictors. Feature selection may improve accuracy and efficiency of classifier methods by finding the most appropriate features. Feature selection techniques can be classified into three groups: filter methods, wrapper methods, and embedded methods.56–58
In filter methods, features are selected based on the relevance of their intrinsic characteristics to the target classes using statistical tests such as Independent samples t-test or F-test.59 In wrapper methods, feature selection is “wrapped” around a learning method, and its importance is directly judged by the estimated accuracy of the learning method. Wrapper methods typically require extensive computation to search the best features, but the characteristics of the selected features match well with the learning method.60 Feature selection in embedded methods performs through the process of training and is usually specific to given learning machines. This kind of methods have the advantage of including the interaction with the classification model in feature selection procedure, while at the same time being far less computationally intensive than wrapper methods.58 According to different challenges in feature selection, there is not a specific algorithm that works best under all conditions.58
In the present study, we used maximum relevance minimum redundancy (MRMR, Equation 1) algorithm for feature selection, which is a classifier-independent method and needs less computational time.61,62 MRMR criteria have a good overall trade-off for accuracy/stability compared with other criteria.63 One of the advantages of MRMR criteria is detecting correlated features (which cannot be ruled out in simple filter methods) to exclude redundant ones from further analysis.
|
|
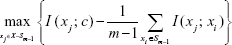
The first part of the MRMR formula is maximum relevance, and the second part is called minimum redundancy. Equation 1 is an incremental method of MRMR implementation. According to this equation, we calculated mutual information of each feature (xj) with the class label (c). The feature with maximum value was selected as the first feature. Next, the mean value of mutual information between each feature and selected features (Sm-1) was subtracted from the mutual information of each feature and class label. After finding the maximum, the second appropriate feature was found. This step was repeated several times until all the features were selected (in Equation 1, X denotes all features).
In the present study, we used MRMR algorithm as a way for weighting variables and excluding redundant features. If the result of Equation 1 was <0, we excluded that feature from further analysis. In other words, if mutual information of a feature with the class label is less than the mean value of mutual information between feature and selected features, then that feature was removed. The weight of each feature has been calculated using the result of Equation 1 divided by total MRMR values of all features. To assess the relevance of features, we conducted chi-squared test for nominal attributes and independent sample t-test for continuous ones, and then, 1-(p value) was used as a merit of a feature.
Data analysis
Proposed algorithm
We used ensemble learning for the classification of our data set. In ensemble methods, multiple learning algorithms are used to achieve better predictive performance compared with each learning algorithm alone. The results showed that ensemble of classifiers can enhance class prediction even though individual classifiers might be rather weak and error-prone in making decisions.64,65 Successful applications of ensemble methods can be found in bioinformatics66 and medicine.67,68
Bagging,69 Boosting,70 and RF71 are famous ensemble-based algorithms. In ensemble classification, a number of base classifiers are trained. At the test time, test samples are given to all the base classifiers, and the class label of samples is determined, typically through majority vote, based on the output of all base classifiers.72 It is obvious that we should create diversity in the output of base classifiers; otherwise, the accuracy of the ensemble method does not change. For example, multilayer perceptron (MLP) with different structures or different initialization weights can be used as a base classifier.
It is usually assumed that increasing diversity may decrease ensemble error.73 Theoretical and empirical results suggested that one of the most effective methods of achieving independence classifiers is attribute bagging (training the members of an ensemble on qualitatively different feature (sub)sets).74,75 It has been shown that the best voting accuracy is achieved for attribute subset sizes between one third and half of the total number of attributes.74
The proposed method has two phases: 1) sorting the features using MRMR algorithms and 2) weight assignment to each feature based on the importance of that feature. After sorting the features based on their weights, we removed attributes that have a weight less than a predefined threshold. Next, we generated several base classifiers (decision tree in our case) using a subset of features that were selected by roulette wheel sampling.76 With the roulette wheel algorithm, we selected attributes randomly according to their weights. At the time of base classifiers construction, we pruned base classifiers that have accuracy less than a predefined threshold (75% in our study). We split the data set into training and testing parts. The first part is used for training the model, and the second part is used for the validation of the model. At the test time, we used majority vote for determining the class label of samples. If base classifiers could not determine the class label accurately (eg, 45% of base classifiers agreed on class 1 and 55% agreed on class 2), we determined the class label of test sample based on the base classifier that has the best training accuracy. Box 2 describes the pseudocode for our proposed method.
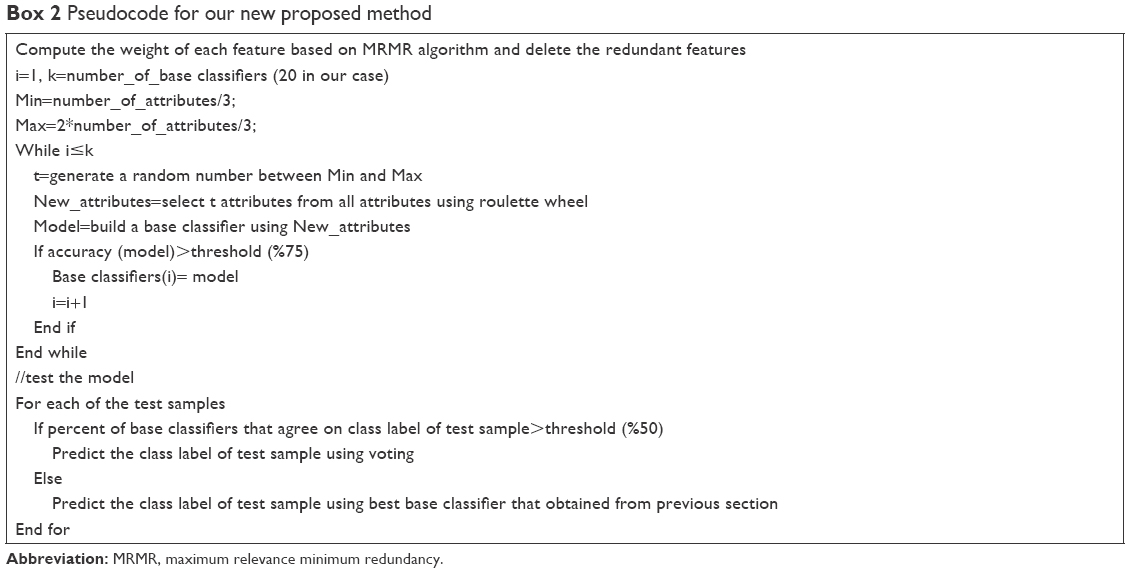 | Box 2 Pseudocode for our new proposed method |
Traditional classification algorithms and performance measures
We compared the results of our proposed method with several well-known learning models that are commonly used for classification including MLP, KNN, SVM, decision tree, and RF.
MLP is a popular artificial neural network architecture with backpropagation (a supervised learning algorithm). It has been shown that given the right size and the structure, MLP is capable of learning arbitrarily complex nonlinear functions to arbitrary accuracy levels.77
KNN is based on the principle that the cases within a data set will generally exist in close proximity to other cases that have similar properties.78 The KNN algorithm locates the k-nearest instances to the query instance and determines its class by identifying the single most frequent class label.
SVM is a maximum margin classification algorithm, which exploits information about the inner products in some feature space.79,80 Studies showed that these algorithms have a good ability for classification in medical data sets.81,82
Decision trees are powerful classification algorithms such as Quinlan’s ID3, C4.5, and C5 that are becoming increasingly more popular with the growth of data mining in the field of medicine.83
RF is an ensemble learner, a method that generates many classifiers and aggregates their results.71 RF shows high predictive accuracy and is applicable in high-dimensional data sets with highly correlated features, such as medical data sets.84,85
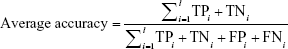
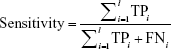
For evaluating the proposed analytical model, we used three performance measures: accuracy (Equation 2), sensitivity (Equation 3), and specificity (Equation 4), which are usually defined for binary classification. As we dealt with a multiclass application, we calculated these measures based on the following formulas:86
|
|
l is the number of class
|
|
|
|
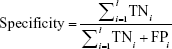
where TPi, TNi, FPi, and FNi denote true positives, true negatives, false positives, and false negatives for class i, respectively.
True positive (TP) is the number of positive samples that are correctly identified as positive. False positive (FP) is the number of negative samples that are incorrectly identified as positive. False negative (FN) denotes the number of positive samples that are incorrectly identified as negative. True negative (TN) is the number of negative samples that are correctly identified as negative.
Results
Sociodemographic data of the studied sample
Table 1 summarizes sociodemographic and clinical variables of 151 patients who had completed pharmacotherapy. Responder, nonresponder, and refractory groups consisted of 68%, 50%, and 68% women; 68%, 64%, and 63% married patients; and 64%, 41%, and 59% unemployed patients (Table 1); 15% of patients in the responder group reported no history of mental illness in their family, but others (85%) were from the families with the history of psychiatric disorders. Percentages of positive family history in nonresponder and refractory groups were reported as 85% and 77%, respectively (Table 1).
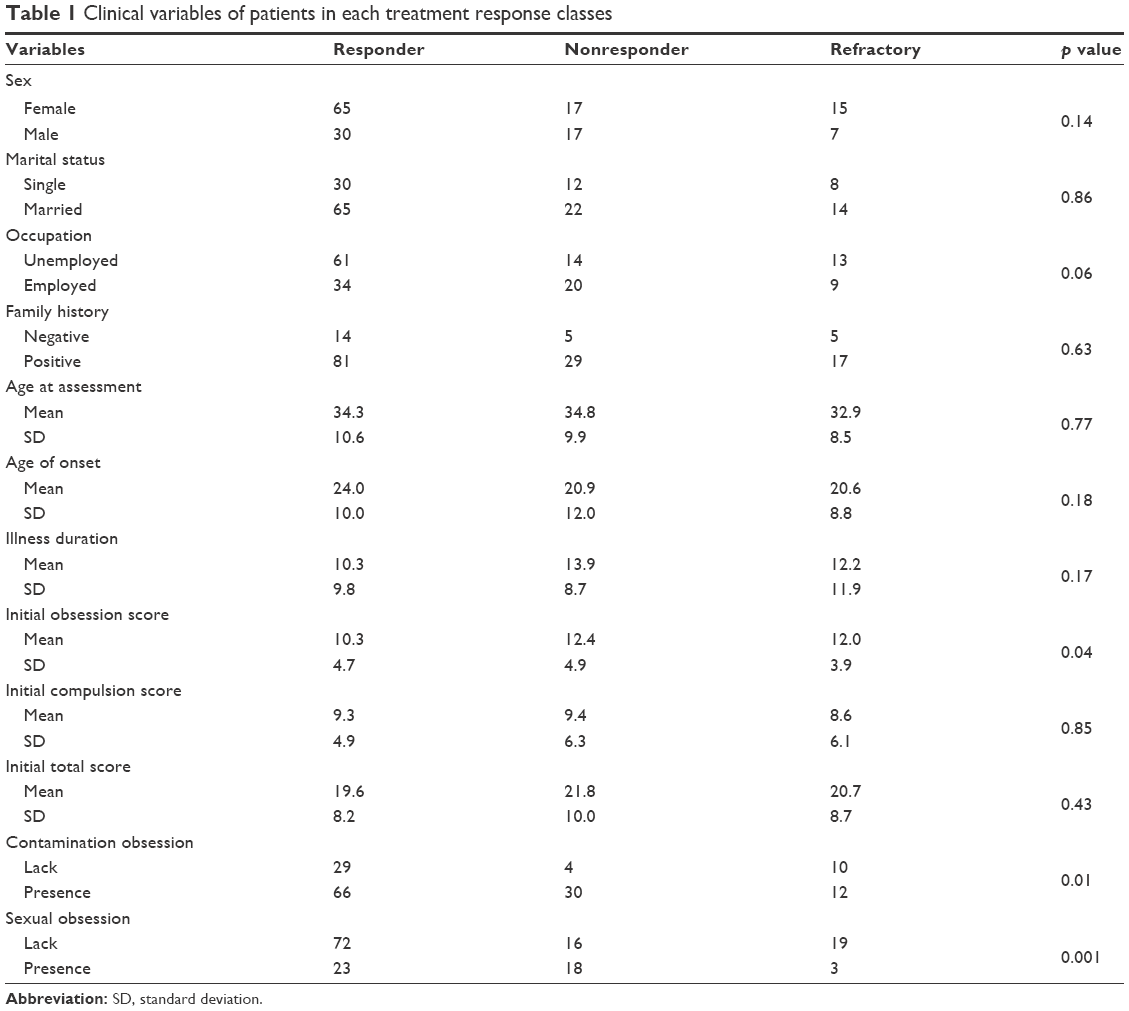 | Table 1 Clinical variables of patients in each treatment response classes |
Patients’ ages of onset (mean±SD) were 24.0±10.0 in responder group, 20.9±12.0 in the nonresponder group, and 20.6±8.8 in the refractory group. The mean values of initial Y-BOCS scores for obsession (mean±SD) were 10.3±4.7 for responders, 12.4±4.9 for nonresponders, and 12.0±3.9 for refractory patients. One-way analysis of variance with Tukey’s post hoc test showed that obsession scores were significantly different between these three groups, and responders reported less severe obsessions compared with nonresponder and refractory patients. However, compulsion and total Y-BOCS scores were not significantly different between these three groups (Table 1).
Analyses revealed that contamination and sexual obsessions were the most important predictors for fluvoxamine pharmacotherapy. Sixty-nine percent of responder patients reported contamination symptoms, whereas 88% of nonresponder patients had contamination obsessions. Sexual obsessions were also observed in 24% of responder patients, but in 52% of nonresponder patients (Table 1).
Treatment predictors
Of the 36 initial features, 19 were selected for further analysis as the result of feature selection and others were removed. Attributes such as sexual and contamination obsessions, obsession severity, and illness duration were selected to predict treatment response of patients, and attributes such as marital status, hoarding, and religious obsessions were removed from further analysis.
Model evaluation
Table 2 summarizes the average performance of different classification algorithms for the treatment response data set based on the results of 20 replications of 10-fold cross-validation. We used 10-fold stratified cross-validation for evaluating predictive models that is the best estimation technique, especially in data sets with small sample size.87,88 It must be noted that our data set contains 151 samples that belong to three classes; 95 patients responded adequately to treatment (responder class), 34 patients exhibited inadequate response to fluvoxamine (nonresponder class), and 22 patients belonged to refractory class. The values in the parentheses are the confidence interval of that measure at a 95% confidence level. The results showed that MLP is not a good algorithm for this data set, and decision tree is relatively better than other classification models. The results also showed that the new method which is proposed in this study is the best classifier for dealing with this data set. The accuracy, sensitivity, and specificity of the proposed method were 86%, 79%, and 89%, respectively.
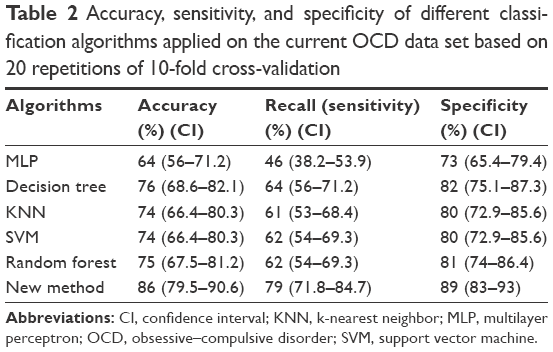 | Table 2 Accuracy, sensitivity, and specificity of different classification algorithms applied on the current OCD data set based on 20 repetitions of 10-fold cross-validation |
Table 3 shows the values of TP, FP, FN, and TN for each treatment response class, which were resulted from applying conventional methods and new analysis method on our data set. The proposed analytical algorithm correctly assigned 83 subjects to responder class, 23 subjects to nonresponder class, and 13 subjects to refractory class. These tables show that some algorithms such as RF are very good at the prediction of responder class, but very poor on two other classes.
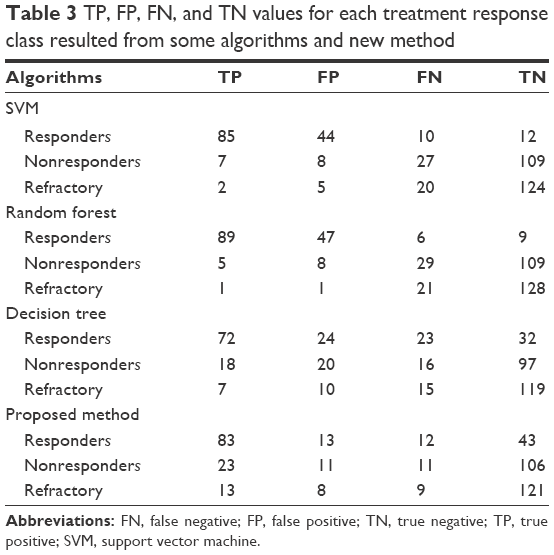 | Table 3 TP, FP, FN, and TN values for each treatment response class resulted from some algorithms and new method |
Table 4 summarizes the accuracy, sensitivity, and specificity of the new method for each treatment response class. The accuracy values of the proposed method for prediction of classes 1–3 were 83%, 85%, and 89%, respectively. The sensitivity values were 87%, 68%, and 59%, respectively, for classes 1–3. Specificity measures were obtained as 77%, 90%, and 94%, respectively, for classes 1–3.
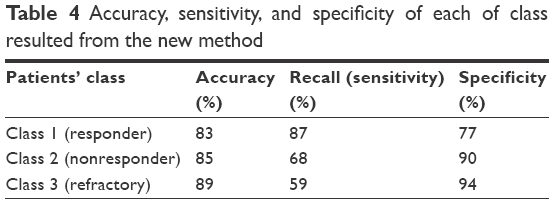 | Table 4 Accuracy, sensitivity, and specificity of each of class resulted from the new method |
Discussion
In the current study, we aimed at proposing a model suitable to predict the final outcome of OCD pharmacotherapy using fluvoxamine. From the results of our analysis, it appears that sexual and contamination obsessions and higher Y-BOCS obsessive scores are high-ranked predictors of resistance to fluvoxamine pharmacotherapy. Moreover, our proposed strategies for data analysis including missing value handling, feature selection using MRMR algorithm, and new analytical method based on ensemble classification are best suited for dealing with the OCD treatment response data set and prediction of fluvoxamine pharmacotherapy result.
Data mining approaches can be used to process high-dimensional data sets such as medical data sets for the prediction of treatment response in order to help individualize clinical assignment of treatment. In the current study, we proposed a new ensemble classification that showed good accuracy, sensitivity, and specificity over some commonly used classification methods. This method appears to have a good potential for medical decision-making in the assignment of patients to treatment based on clinical characteristics.
Medical data sets including those related to treatment response compromise numerous demographic, clinical, and genetic variables over a relatively small number of patients, which present challenges for analysis and data extraction. There are limited studies investigating the prediction of treatment response in OCD patients, and almost all of them dealt with these challenges. In this study, we used several strategies to reduce the number of variables and increase the ratio of samples to variables. First, we used MRMR algorithm for weighting the attributes. Second, we eliminated features with low association with treatment response classes. Finally, we applied attribute bagging for improving the accuracy and stability of classifier ensembles using random subsets of features.
The results of the current study showed that predominance of contamination and sexual symptoms, as well as high scores in Y-BOCS obsessive subscores, are predictive of poor response to fluvoxamine. These findings are consistent with the previous reports that contamination and cleaning may represent markers of poor prognosis.15,18,19,25,38
Previous investigations revealed that different brain networks might be involved in OC symptoms such as checking, washing, symmetry, and hoarding.89–94 These findings suggest that poor treatment response of OCD patients with predominant contamination and sexual symptoms and higher obsession scores may be related to relatively distinct neural circuits correlated with these symptoms.
The current investigation has a number of important strengths as well as some key limitations. This study is the first try to investigate predictors of OCD treatment response in an Iranian sample. Moreover, we proposed a new method of ensemble classification for treatment response prediction, which enables more comprehensive examination of potential predictors of remission. Missing value handling and feature selection improved analysis approach and make it possible to perform more accurate prediction. The other advantage of the current study was the administration of just one drug, fluvoxamine, which might reduce confounding factors.
There are several shortcomings inherent in this study. Treatment response was evaluated after 12-week pharmacotherapy, while the assessment of treatment response outcome in more extended period may detect stronger predictors of remission. Besides, some patients who reported drug side effects were excluded from the study or did not complete their medication. Altogether, a large number of patients were eliminated in different stages of the study, resulted in the small sample size of the study. Moreover, sampling was performed from a single medical center at Tehran leaded to the lack of diversity in our sample. Therefore, it may prevent our findings from being generalized to members of different cultural groups or other populations. Replication of the proposed method with independent and larger samples is suggested.
Conclusion
This study proposed an analytical approach that is an accurate and a sensitive method for the analysis of high-dimensional medical data sets containing more number of missing values. The treatment of OCD could be improved by better understanding of the predictors of pharmacotherapy, which may lead to more effective treatment of patients with OCD and more accurate prognostic information to them. Moreover, it helps to estimate how many patients will need access to alternative treatments, which is important from the public health perspective.
Acknowledgments
This research was supported by grants from Neuroscience Research Center, Shahid Beheshti University of Medical Sciences, Iran. We are also grateful to Imam Hossain Hospital staff for their cooperation with our research team.
Disclosure
The authors report no conflicts of interest in this work.
References
Hasler G, LaSalle-Ricci VH, Ronquillo JG, et al. Obsessive–compulsive disorder symptom dimensions show specific relationships to psychiatric comorbidity. Psychiatry Res. 2005;135(2):121–132. | ||
Mohammadi MR, Ghanizadeh A, Rahgozar M, et al. Prevalence of obsessive-compulsive disorder in Iran. BMC Psychiatry. 2004;4:2. | ||
Dougherty DD, Rauch SL, Jenike MA. Pharmacotherapy for obsessive-compulsive disorder. J Clin Psychol. 2004;60(11):1195–1202. | ||
Pallanti S, Quercioli L. Treatment-refractory obsessive-compulsive disorder: methodological issues, operational definitions and therapeutic lines. Prog Neuropsychopharmacol Biol Psychiatry. 2006;30(3):400–412. | ||
Bloch M, Landeros-Weisenberger A, Kelmendi B, Coric V, Bracken MB, Leckman JF. A systematic review: antipsychotic augmentation with treatment refractory obsessive-compulsive disorder. Molecular Psychiatry. 2006;11(7):622–632. | ||
Erzegovesi S, Cavallini MC, Cavedini P, Diaferia G, Locatelli M, Bellodi L. Clinical predictors of drug response in obsessive-compulsive disorder. J Clin Psychopharmacol. 2001;21(5):488–492. | ||
Goodman WK. Pharmacotherapy of obsessive-compulsive disorder. In: Hand I, Goodman WK, Evers U, editors. Zwangsstörungen/Obsessive-Compulsive Disorders. Berlin, Heidelberg: Springer; 1992:141–151. | ||
Fineberg NA, Reghunandanan S, Simpson HB, et al. Obsessive–compulsive disorder (OCD): practical strategies for pharmacological and somatic treatment in adults. Psychiatry Res. 2015;227(1):114–125. | ||
Hazari N, Narayanaswamy JC, Arumugham SS. Predictors of response to serotonin reuptake inhibitors in obsessive-compulsive disorder. Expert Rev Neurother. 2016;16(10):1175–1191. | ||
Storch EA, Larson MJ, Shapira NA, et al. Clinical predictors of early fluoxetine treatment response in obsessive–compulsive disorder. Depression Anxiety. 2006;23(7):429–433. | ||
Stein DJ, Montgomery SA, Kasper S, Tanghoj P. Predictors of response to pharmacotherapy with citalopram in obsessive-compulsive disorder. Int Clin Psychopharmacol. 2001;16(6):357–361. | ||
Mataix-Cols D, Rauch SL, Manzo PA, Jenike MA, Baer L. Use of factor-analyzed symptom dimensions to predict outcome with serotonin reuptake inhibitors and placebo in the treatment of obsessive-compulsive disorder. Am J Psychiatry. 1999;156(9):1409–1416. | ||
Salomoni G, Grassi M, Mosini P, Riva P, Cavedini P, Bellodi L. Artificial neural network model for the prediction of obsessive-compulsive disorder treatment response. J Clin Psychopharmacol. 2009;29(4):343–349. | ||
Saxena S, Maidment KM. Treatment of compulsive hoarding. J Clin Psychology. 2004;60(11):1143–1154. | ||
Stein DJ, Andersen EW, Overo KF. Response of symptom dimensions in obsessive-compulsive disorder to treatment with citalopram or placebo. Rev Bras Psiquiatr. 2007;29(4):303–307. | ||
Samuels J, Bienvenu OJ 3rd, Riddle MA, et al. Hoarding in obsessive compulsive disorder: results from a case-control study. Behav Res Ther. 2002;40(5):517–528. | ||
Stein DJ, Carey PD, Lochner C, Seedat S, Fineberg N, Andersen EW. Escitalopram in obsessive-compulsive disorder: response of symptom dimensions to pharmacotherapy. CNS Spectr. 2008;13(06):492–498. | ||
Alarcon RD, Libb JW, Spitler D. A predictive study of obsessive-compulsive disorder response to clomipramine. J Clin Psychopharmacol. 1993;13(3):210–213. | ||
Ravizza L, Barzega G, Bellino S, Bogetto F, Maina G. Predictors of drug treatment response in obsessive-compulsive disorder. J Clin Psychiatry. 1995;56(8):368–373. | ||
Landeros-Weisenberger A, Bloch MH, Kelmendi B, et al. Dimensional predictors of response to SRI pharmacotherapy in obsessive–compulsive disorder. J Affect Disord. 2010;121(1–2):175–179. | ||
Neziroglu F, Pinto A, Yaryura-Tobias JA, McKay D. Overvalued ideation as a predictor of fluvoxamine response in patients with obsessive–compulsive disorder. Psychiatry Res. 2004;125(1):53–60. | ||
Ravi Kishore V, Samar R, Janardhan Reddy Y, Chandrasekhar CR, Thennarasu K. Clinical characteristics and treatment response in poor and good insight obsessive–compulsive disorder. Eur Psychiatry. 2004;19(4):202–208. | ||
Alonso P, Menchon JM, Pifarre J, et al. Long-term follow-up and predictors of clinical outcome in obsessive-compulsive patients treated with serotonin reuptake inhibitors and behavioral therapy. J Clin Psychiatry. 2001;62(7):535–540. | ||
Mataix-Cols D, Marks IM, Greist JH, Kobak KA, Baer L. Obsessive-compulsive symptom dimensions as predictors of compliance with and response to behaviour therapy: results from a controlled trial. Psychother Psychosom. 2002;71(5):255–262. | ||
Askland KD, Garnaat S, Sibrava NJ, et al. Prediction of remission in obsessive compulsive disorder using a novel machine learning strategy. Int J Methods Psychiatr Res. 2015;24(2):156–169. | ||
Ackerman DL, Greenland S, Bystritsky A, Morgenstern H, Katz RJ. Predictors of treatment response in obsessive-compulsive disorder: multivariate analyses from a multicenter trial of clomipramine. J Clin Psychopharmacol. 1994;14(4):247–254. | ||
Skoog G, Skoog I. A 40-year follow-up of patients with obsessive-compulsive disorder. Arch Gen Psychiatry. 1999;56(2):121–127. | ||
Rosario-Campos MC, Leckman JF, Mercadante MT, et al. Adults with early-onset obsessive-compulsive disorder. Am J Psychiatry. 2001;158(11):1899–1903. | ||
Fontenelle LF, Mendlowicz MV, Marques C, Versiani M. Early- and late-onset obsessive–compulsive disorder in adult patients: an exploratory clinical and therapeutic study. J Psychiatr Res. 2003;37(2):127–133. | ||
Eisen JL, Pinto A, Mancebo MC, Dyck IR, Orlando ME, Rasmussen SA. A 2-year prospective follow-up study of the course of obsessive-compulsive disorder. J Clin Psychiatry. 2010;71(8):1033–1039. | ||
Minichiello WE, Baer L, Jenike MA. Schizotypal personality disorder: a poor prognostic indicator for behavior therapy in the treatment of obsessive-compulsive disorder. J Anxiety Disord. 1987;1(3):273–276. | ||
McDougle CJ, Goodman WK, Price LH, et al. Neuroleptic addition in fluvoxamine-refractory obsessive-compulsive disorder. Am J Psychiatry. 1990;147(5):652–654. | ||
Baer L. Factor analysis of symptom subtypes of obsessive compulsive disorder and their relation to personality and tic disorders. J Clin Psychiatry. 1994;55(Suppl):18–23. | ||
Mundo E, Erzegovesi S, Bellodi L. Follow-up of obsessive-compulsive patients treated with proserotonergic agents. J Clin Psychopharmacol. 1995;15(4):288–289. | ||
Shavitt RG, Belotto C, Curi M, et al. Clinical features associated with treatment response in obsessive-compulsive disorder. Compr Psychiatry. 2006;47(4):276–281. | ||
Fineberg NA, Hengartner MP, Bergbaum C, Gale T, Rössler W, Angst J. Remission of obsessive-compulsive disorders and syndromes; evidence from a prospective community cohort study over 30 years. Int J Psychiatry Clin Pract. 2013;17(3):179–187. | ||
Marcks BA, Weisberg RB, Dyck I, Keller MB. Longitudinal course of obsessive-compulsive disorder in patients with anxiety disorders: a 15-year prospective follow-up study. Compr Psychiatry. 2011;52(6):670–677. | ||
Catapano F, Perris F, Masella M, et al. Obsessive–compulsive disorder: a 3-year prospective follow-up study of patients treated with serotonin reuptake inhibitors: OCD follow-up study. J Psychiatr Res. 2006;40(6):502–510. | ||
Hollander E, Bienstock CA, Koran LM, et al. Refractory obsessive-compulsive disorder: state-of-the-art treatment. J Clin Psychiatry. 2001;63(Suppl 6):20–29. | ||
Steketee G, Eisen J, Dyck I, Warshaw M, Rasmussen S. Predictors of course in obsessive compulsive disorder. Psychiatry Res. 1999;89(3):229–238. | ||
Steketee G, Van Noppen B. Family approaches to treatment for obsessive compulsive disorder. Rev Bras Psiquiatr. 2003;25(1):43–50. | ||
Eisen JL, Sibrava NJ, Boisseau CL, et al. Five-year course of obsessive-compulsive disorder: predictors of remission and relapse. J Clin Psychiatry. 2013;74(3):233–239. | ||
Denys D, Burger H, van Megen H, de Geus F, Westenberg H. A score for predicting response to pharmacotherapy in obsessive–compulsive disorder. Int Clin Psychopharmacol. 2003;18(6):315–322. | ||
Tükel R, Bozkurt O, Polat A, Genç A, Atli H. Clinical predictors of response to pharmacotherapy with selective serotonin reuptake inhibitors in obsessive–compulsive disorder. Psychiatry Clin Neurosci. 2006;60(4):404–409. | ||
Nakatani E, Nakagawa A, Nakao T, et al. A randomized controlled trial of Japanese patients with obsessive-compulsive disorder–effectiveness of behavior therapy and fluvoxamine. Psychother Psychosom. 2005;74(5):269–276. | ||
Ackerman DL, Greenland S, Bystritsky A. Clinical characteristics of response to fluoxetine treatment of obsessive-compulsive disorder. J Clin Psychopharmacol. 1998;18(3):185–192. | ||
D’alcante CC, Diniz JB, Fossaluza V, et al. Neuropsychological predictors of response to randomized treatment in obsessive–compulsive disorder. Prog Neuropsychopharmacol Biol Psychiatry. 2012;39(2):310–317. | ||
Ferrão YA, Shavitt RG, Bedin NR, et al. Clinical features associated to refractory obsessive–compulsive disorder. J Affect Disord. 2006;94(1–3):199–209. | ||
Farnam A, Goreishizadeh MA, Farhang S. Effectiveness of fluoxetine on various subtypes of obsessive-compulsive disorder. Arch Iran Med. 2008;11(5):522–525. | ||
Cleophas TJ, Zwinderman AH, Cleophas-Allers HI. Machine Learning in Medicine. Berlin, Heidelberg: Springer; 2013. | ||
Hoexter MQ, Miguel EC, Diniz JB, Shavitt RG, Busatto GF, Sato JR. Predicting obsessive–compulsive disorder severity combining neuroimaging and machine learning methods. J Affect Disord. 2013;150(3):1213–1216. | ||
Rajezi Esfahani S, Motaghipour Y, Kamkari K, Zahiredin A, Janbozorgi M. Reliability and validity of the Persian version of the Yale-Brown Obsessive-Compulsive Scale (Y-BOCS). Iran J Psychiatry Clin Psychol. 2012;17(4):297–303. | ||
Corregiari FM, Bernik M, Cordeiro Q, Vallada H. Endophenotypes and serotonergic polymorphisms associated with treatment response in obsessive-compulsive disorder. Clinics (Sao Paulo). 2012;67(4):335–340. | ||
Hasanpour H, Asadi S, Ghavamizadeh Meibodi R, et al. A critical appraisal of heterogeneity in obsessive-compulsive disorder using symptom-based clustering analysis. Asian J Psychiatr. 2017;28:89–96. | ||
Acuna E, Rodriguez C. The treatment of missing values and its effect on classifier accuracy. In: Banks D, McMorris FR, Arabie P, Gaul W, editors. Classification, Clustering, and Data Mining Applications. Berlin, Heidelberg: Springer; 2004:639–647. | ||
Kohavi R, John GH. Wrappers for feature subset selection. Artif Intell. 1997;97(1–2):273–324. | ||
Bolón-Canedo V, Sánchez-Maroño N, Alonso-Betanzos A. A review of feature selection methods on synthetic data. Knowl Inf Syst. 2013;34(3):483–519. | ||
Saeys Y, Inza I, Larrañaga P. A review of feature selection techniques in bioinformatics. Bioinformatics. 2007;23(19):2507–2517. | ||
Model F, Adorjan P, Olek A, Piepenbrock C. Feature selection for DNA methylation based cancer classification. Bioinformatics. 2001;17(Suppl 1):157–164. | ||
Xiong M, Fang X, Zhao J. Biomarker identification by feature wrappers. Genome Research. 2001;11(11):1878–1887. | ||
Peng H, Long F, Ding C. Feature selection based on mutual information criteria of max-dependency, max-relevance, and min-redundancy. IEEE Trans Pattern Anal Mach Intel. 2005;27(8):1226–1238. | ||
Ding C, Peng H. Minimum redundancy feature selection from microarray gene expression data. J Bioinform Comput Biol. 2005;3(2):185–205. | ||
Brown G, Pocock A, Zhao MJ, Luján M. Conditional likelihood maximisation: a unifying framework for information theoretic feature selection. J Mach Learn Res. 2012;13(1):27–66. | ||
Ahn H, Moon H, Fazzari MJ, Lim N, Chen JJ, Kodell RL. Classification by ensembles from random partitions of high-dimensional data. J Comput Stat Data Anal. 2007;51(12):6166–6179. | ||
Rokach L. Pattern Classification Using Ensemble Methods. Vol 75. World Scientific; 2010. Singapore: World Scientific Publishing Company. | ||
Tan AC, Gilbert D, Deville Y. Multi-class protein fold classification using a new ensemble machine learning approach. Genome Inform. 2003;14:206–217. | ||
Mangiameli P, West D, Rampal R. Model selection for medical diagnosis decision support systems. Decis Support Syst. 2004;36(3):247–259. | ||
Özçift A. Random forests ensemble classifier trained with data resampling strategy to improve cardiac arrhythmia diagnosis. Comput Biol Med. 2011;41(5):265–271. | ||
Breiman L. Bagging predictors. Mach Learn. 1996;24(2):123–140. | ||
Schapire RE. The strength of weak learnability. Mach Learn. 1990;5(2):197–227. | ||
Breiman L. Random forests. Mach Learn. 2001;45(1):5–32. | ||
Lam L, Suen S. Application of majority voting to pattern recognition: an analysis of its behavior and performance. IEEE Trans Syst Man Cybern A Syst Hum. 1997;27(5):553–568. | ||
Zenobi G, Cunningham P. Using diversity in preparing ensembles of classifiers based on different feature subsets to minimize generalization error. In European Conference on Machine Learning. 2001 Sep 5. Berlin, Heidelberg: Springer;576–587. | ||
Bryll R, Gutierrez-Osuna R, Quek F. Attribute bagging: improving accuracy of classifier ensembles by using random feature subsets. Pattern Recogn. 2003;36(6):1291–1302. | ||
Turner K, Oza NC. Decimated input ensembles for improved generalization. In Neural Networks, 1999. IJCNN’99. International Joint Conference on 1999;5:3069–3074. | ||
De Jong D. An Analysis of the Behavior of a Class of Genetic Adaptive Systems. Ph.D. Thesis. Ann Arbor: Department of Computer and Communication Sciences, University of Michigan: 1975 | ||
Hornik K, Stinchcombe M, White H. Universal approximation of an unknown mapping and its derivatives using multilayer feedforward networks. Neural Net. 1990;3(5):551–560. | ||
Cover T, Hart P. Nearest neighbor pattern classification. IEEE Trans Inf Theory. 1967;13(1):21–27. | ||
Vapnik V. The Nature of Statistical Learning Theory. Berlin, Heidelberg: Springer Science & Business Media; 2013. | ||
Vapnik VN, Vapnik V. Statistical Learning Theory. Vol 1. New York: Wiley; 1998. | ||
Xing Y, Wang J, Zhao Z. Combination data mining methods with new medical data to predicting outcome of coronary heart disease. In Convergence Information Technology, 2007. International Conference on 2007 Nov 21: 868–872. | ||
Sartakhti JS, Zangooei MH, Mozafari K. Hepatitis disease diagnosis using a novel hybrid method based on support vector machine and simulated annealing (SVM-SA). Comput Methods Programs Biomed. 2012;108(2):570–579. | ||
Quinlan JR. C4.5: Programs for Machine Learning. San Mateo: Morgan Kaufmann; 1993. | ||
Khalilia M, Chakraborty S, Popescu M. Predicting disease risks from highly imbalanced data using random forest. BMC Med Inform Decis Mak. 2011;11(1):51. | ||
Yang F, Wang HZ, Mi H, Lin CD, Cai WW. Using random forest for reliable classification and cost-sensitive learning for medical diagnosis. BMC Bioinformatics. 2009;10(Suppl 1):S22. | ||
Sokolova M, Lapalme G. A systematic analysis of performance measures for classification tasks. Inform Proces Manage. 2009;45(4):427–437. | ||
Kohavi R. A study of cross-validation and bootstrap for accuracy estimation and model selection. In Ijcai. 1995;14(2):1137–1145. | ||
Seni G, Elder JF. Ensemble methods in data mining: improving accuracy through combining predictions. Synth Lect Data Mining Knowl Discov. 2010;2(1):1–126. | ||
Mataix-Cols D, Wooderson S, Lawrence N, Brammer MJ, Speckens A, Phillips ML. Distinct neural correlates of washing, checking, and hoarding symptom dimensions in obsessive-compulsive disorder. Arch Gen Psychiatry. 2004;61(6):564–576. | ||
Gilbert AR, Mataix-Cols D, Almeida JR, et al. Brain structure and symptom dimension relationships in obsessive–compulsive disorder: a voxel-based morphometry study. J Affect Disord. 2008;109(1):117–126. | ||
Alvarenga PG, do Rosário MC, Batistuzzo MC, et al. Obsessive-compulsive symptom dimensions correlate to specific gray matter volumes in treatment-naïve patients. J Psychiatr Res. 2012;46(12):1635–1642. | ||
Shapira NA, Liu Y, He AG, et al. Brain activation by disgust-inducing pictures in obsessive-compulsive disorder. Biol Psychiatry. 2003;54(7):751–756. | ||
van den Heuvel OA, Remijnse PL, Mataix-Cols D, et al. The major symptom dimensions of obsessive-compulsive disorder are mediated by partially distinct neural systems. Brain. 2008;132(Pt 4):853–868. | ||
Murayama K, Nakao T, Sanematsu H, et al. Differential neural network of checking versus washing symptoms in obsessive-compulsive disorder. Prog Neuropsychopharmacol Biol Psychiatry. 2013;40:160–166. |
 © 2018 The Author(s). This work is published and licensed by Dove Medical Press Limited. The full terms of this license are available at https://www.dovepress.com/terms.php and incorporate the Creative Commons Attribution - Non Commercial (unported, v3.0) License.
By accessing the work you hereby accept the Terms. Non-commercial uses of the work are permitted without any further permission from Dove Medical Press Limited, provided the work is properly attributed. For permission for commercial use of this work, please see paragraphs 4.2 and 5 of our Terms.
© 2018 The Author(s). This work is published and licensed by Dove Medical Press Limited. The full terms of this license are available at https://www.dovepress.com/terms.php and incorporate the Creative Commons Attribution - Non Commercial (unported, v3.0) License.
By accessing the work you hereby accept the Terms. Non-commercial uses of the work are permitted without any further permission from Dove Medical Press Limited, provided the work is properly attributed. For permission for commercial use of this work, please see paragraphs 4.2 and 5 of our Terms.