")
Back to Journals » International Journal of Nanomedicine » Volume 10 » Issue 1
Nonspecifically enhanced therapeutic effects of vincristine on multidrug-resistant cancers when coencapsulated with quinine in liposomes
Received 13 March 2015
Accepted for publication 5 May 2015
Published 29 June 2015 Volume 2015:10(1) Pages 4225—4237
DOI https://doi.org/10.2147/IJN.S84555
Checked for plagiarism Yes
Review by Single anonymous peer review
Peer reviewer comments 3
Editor who approved publication: Professor Lei Yang
Yuzhen Xu,1 Liyan Qiu2
1College of Pharmaceutical Sciences, 2Ministry of Education Key Laboratory of Synthesis and Functionalization, Department of Polymer Science and Engineering, Zhejiang University, Hangzhou, People’s Republic of China
Abstract: The use of vincristine (VCR) to treat cancer has been limited by its dose-dependent toxicity and development of drug resistance after repeated administrations. In this study, we investigated the mechanism by which quinine hydrochloride (QN) acts as a sensitizer for VCR. Our experiments used three kinds of multidrug-resistant cancer cells and demonstrated that QN worked by inducing intracellular depletion of adenosine triphosphate, increasing adenosine triphosphatase activity, and decreasing P-glycoprotein expression. Based on these results, we designed and prepared a VCR and QN codelivery liposome (VQL) and investigated the effect of coencapsulated QN on the in vitro cytotoxicity of VCR in cells and three-dimensional multicellular tumor spheroids. The antitumor effects of the formulation were also evaluated in multidrug-resistant tumor-bearing mice. The results of this in vivo study indicated that VQL could reverse VCR resistance. In addition, it reduced tumor volume 5.4-fold when compared with other test groups. The data suggest that VQL could be a promising nanoscaled therapeutic agent to overcome multidrug resistance, and may have important clinical implications for the treatment of cancer.
Keywords: vincristine, quinine, combination therapy, liposome, multidrug resistance reversal, P-glycoprotein
Introduction
Vincristine (VCR) is an alkaloid derived from the Madagascan periwinkle; it can arrest dividing cells at the metaphase by binding to tubulin in mitotic spindles and thus prevent polymerization into microtubules.1 Since 1963, VCR has been used as a chemotherapeutic to treat various types of cancer, including leukemia, lymphoma, breast cancer, and lung cancer.2 However, VCR also binds to neuronal tubulin, disrupts axonal microtubules, and causes severe neurotoxicity,3 therefore limiting the maximum clinical dose of VCR to 2.0 mg regardless of body surface area. Encapsulation of VCR into sphingomyelin and cholesterol liposomes reduces toxicity and allows larger doses to be delivered with greater specificity to target tissues.4 Accordingly, VCR sulfate liposome injections have been approved by the US Food and Drug Administration for the treatment of relapsed and clinically advanced Philadelphia chromosome-negative acute lymphoblastic leukemia.4
Furthermore, resistance to VCR has been developed by a number of tumors, and this has become one of the most significant impediments to successful chemotherapy of cancer.5 It has been confirmed that cellular resistance to VCR is predominantly related to overexpression of P-glycoprotein (P-gp) on cancer cell membranes.6 We have developed a VCR and quinine hydrochloride (QN) codelivery liposome called VQL in order to increase the chemotherapeutic efficacy of VCR by restoring drug sensitivity and decreasing the systemic side effects.
Quinine occurs naturally in the bark of the cinchona tree and was the first effective Western treatment for malaria. Recently, it has been reported that quinine is a good candidate for reversing multidrug resistance (MDR) in cancer.7 Research by Solary et al demonstrated that quinine could circumvent the doxorubicin resistance of MDR human leukemic K562/DXR cells by increasing the cytotoxicity and intracellular accumulation of doxorubicin; the reversal was significant when the concentration of quinine in culture medium reached 5 μg/mL. Solary et al reported a Phase I and II clinical study involving quinine administration before mitoxantrone, and concluded that quinine could safely reverse MDR in resistant acute leukemia.8 It was also reported that quinine may be useful to circumvent anthracycline resistance in clinical practice. At serum concentrations of 4.4–10.1 μg/mL, quinine could be safely used as an anthracycline resistance modifier in clinical practice. However, the mechanism by which quinine modulates drug resistance remains hypothetical and unclear.
Liposomes have been shown to increase drug exposure in tumors due to prolonged circulation times9 and the enhanced permeability and retention effect.10 Liposomes can also be used to maintain desirable synergistic drug ratios and coordinate the release of coencapsulated drug combinations to achieve improved antitumor activity in vivo; therefore, an increasing amount of attention is being paid to cancer combination therapy using liposomes as dual drug carriers. The majority of liposomal combination regimens involve pairs of small-molecule chemotherapeutics, such as gemcitabine and paclitaxel,11 gemcitabine and tamoxifen,12 irinotecan and floxuridine,13 irinotecan and cisplatin,14 and so on. Furthermore, when cationic lipids are used in liposome formulations, codelivery of antitumor drug and small interfering RNA or microRNA can be accomplished. For example, Saad et al developed an effective multifunctional cationic liposomal delivery system to codeliver doxorubicin and small interfering RNA targeted to MRP1 and BCL2 mRNA.15 In this study, we first investigated the mechanism by which QN reverses VCR resistance in several VCR-resistant cancer cells. Subsequently, we constructed VCR and QN dual-loaded liposomes and investigated their antitumor efficacy using in vitro two-dimensional and three-dimensional cell culture models and a tumor xenograft mouse model.
Materials and methods
Materials, cell lines, and animals
Vincristine sulfate (VCR·H2SO4) was obtained from Zhejiang Hisun Pharmaceutical Co Ltd (Zhejiang, People’s Republic of China). QN was purchased from Aladdin Industrial Inc (Shanghai, People’s Republic of China). Cholesterol was purchased from Tokyo Chemical Industry Co Ltd (Tokyo, Japan). Soybean phosphatidylcholine was purchased from Lipoid GmbH (Ludwigshafen, Germany). Methanol for high-performance liquid chromatography (HPLC) analysis was obtained from Merck (Darmstadt, Germany). MTT [3-(4,5-dimethyl-2-thiazolyl)-2,5-diphenyl-tetrazolium bromide] and dimethyl sulfoxide were purchased from Sigma-Aldrich (St Louis, MO, USA). Ethanediamine was purchased from Aladdin Industrial Inc. The CellTiter-Glo® luminescent cell viability kit and the Pgp-Glo™ assay system for P-gp were purchased from Promega Corporation (Promega Corporation, Fitchburg, WI, USA); 0.2 μm polyvinylidene fluoride membrane was sourced from Millipore Corporation (EMD Millipore, Billerica, MA, USA). Mouse monoclonal P-gp antibody (JSB-1) was purchased from Abcam (Cambridge, UK). β-actin antibody was purchased from MultiSciences Biotech (Hangzhou, People’s Republic of China). Alexa Fluor® 488 goat anti-rabbit second antibodies were also obtained from MultiSciences Biotech. Goat anti-mouse IRDye-680CW secondary antibodies were obtained from LI-COR Biosciences (Lincoln, NE, USA). All other chemicals were of commercial grade.
A human breast cancer (MCF-7) cell line, a doxorubicin-resistant human breast cancer (MCF-7/A) cell line, a human colorectal cancer (HCT-8) cell line, a VCR-resistant human colorectal cancer (HCT-8/V) cell line, a human lung carcinoma (A549) cell line, and a paclitaxel-resistant human lung carcinoma (A549/T) cell line were cultured in Roswell Park Memorial Institute 1640 medium containing 10% fetal bovine serum, 100 U/mL penicillin, and 100 U/mL streptomycin (Genom Co Ltd., Hangzhou, People’s Republic of China), and maintained at 37°C in a humidified 5% CO2 incubator. A human liver (HL7702) cell line and a human proximal renal tubular epithelial (HK2) cell line were cultured in Dulbecco’s Modified Eagle’s Medium containing 10% fetal bovine serum, 100 U/mL penicillin, and 100 U/mL streptomycin (Genom Co Ltd., Hangzhou, People’s Republic of China), and maintained at 37°C in a humidified 5% CO2 incubator.
Female BALB/C nude mice aged 4–6 weeks and weighing around 20 g were purchased from Shanghai SLAC Laboratory Animal Co Ltd and bred in a specific pathogen-free facility. All animal procedures were performed following the protocol approved by the Institutional Animal Care and Use Committee of Zhejiang University.
Mechanisms of action of QN
ATPase activity
The adenosine triphosphatase (ATPase) activity of P-gp in response to QN was measured using the Pgp-Glo assay system according to the manufacturer’s instructions. Briefly, verapamil (control) or various concentrations of QN were added to recombinant human P-gp membranes, and sodium orthovanadate (Na3VO4; 100 μM) was used as a selective inhibitor of P-gp.16 The assay relies on the adenosine triphosphate (ATP) dependence of the light-generating reaction of firefly luciferase, which is detected using a luminometer. After preincubation at 37°C for 5 minutes, MgATP was added to initiate the reaction. This was followed by incubation at 37°C for 4 hours. Subsequently, the samples were removed from the heating source and mixed with ATP detection reagent on a plate shaker. After incubation at room temperature for 20 minutes to allow the luminescent signal to develop, the untreated white opaque 96-well plate was read on a luminometer. The change in relative light units was determined by comparing QN-treated samples with Na3VO4-treated samples. Hence, the amount of ATP consumed was calculated. The experiments were carried out in triplicate for each data point. Basal P-gp activity and relative P-gp activity were calculated according to the manufacturer’s protocol.
Cellular ATP content
To examine the effects of QN on intracellular ATP levels, cells (A549/T, MCF-7/A, and HCT-8/V) were first seeded in 96-well plates at a density of 1×10⁵/well and incubated overnight. The cells were then exposed to free QN in increasing concentrations. After 4 hours, an equal volume of the CellTiter-Glo reagent provided by the kit was added to each well, and the contents were then mixed for 2 minutes on a shaker to induce cell lysis. The plate was incubated at room temperature for 20 minutes to stabilize the luminescent signal and detected by luminometer (SpectraMax M5, Molecular Devices, Sunnyvale, CA, USA).
Western blot analysis of P-gp expression
Western blotting was used to measure the effect of QN on the MDR-related protein P-gp. Briefly, cells (A549/T, MCF-7/A, and HCT-8/V) were treated with various formulations for 24 hours and then harvested with lysis buffer containing a protease inhibitor cocktail. The total protein concentration was quantified using a bicinchoninic acid protein assay kit. Protein samples were separated using 8% sodium dodecyl sulfate-polyacrylamide gel electrophoresis and transferred to 0.2 μm polyvinylidene fluoride membrane. The membrane was blocked with 5% skim milk for 1 hour and then immunoblotted with P-gp and β-actin antibodies at 4°C overnight. IRDye-680RD goat anti-mouse and IRDye 800CW goat anti-rabbit secondary antibodies (1:10,000) was incubated at room temperature for 1 hour and the membranes were visualized using an Odyssey® scanner (LI-COR Biosciences).
Liposome preparation
Desalted VCR was obtained by stirring VCR·H2SO4 with an equimolar amount of triethylamine in ethanol overnight. The VQL were prepared using the thin film hydration method. Briefly, soybean phosphatidylcholine (500 mg) and cholesterol (100 mg) plus VCR (10 or 20 mg), QN (10 or 20 mg), or the combination of VCR (10 mg) and QN (2.5, 5, 10, 20, or 30 mg) were fully dissolved in ethanol (6 mL) and dried under reduced pressure at 50°C.17 About 20 minutes later, a dried thin lipid layer was formed, which was then hydrated with phosphate-buffered saline (PBS; pH 7.4) in a vortex mixer for 5 minutes. The liposome dispersion was then sonicated with a probe sonicator (JY92-2D, Scientz, Ningbo, People’s Republic of China) to obtain small homogeneous vesicles. The resulting solution was filtered through a 0.22 μm polycarbonate filter (Millipore) to regulate the particle size and remove free VCR. Free QN was removed by dialysis. By adjusting the weight ratio of VCR to QN, we obtained VCR liposomes, QN liposomes, and the combination liposomes VQL1:0.25, VQL1:0.5, VQL1:1, and VQL1:3.
After the samples were destroyed using methanol, the loading of VCR into various liposomal formulations was analyzed using HPLC (SPD-20A, Shimadzu, Kyoto, Japan) with ultraviolet detection at a wavelength of 298 nm. QN was quantified using ultraviolet spectrophotometry (TU-1800PC, Beijing Persee Co Ltd, Beijing, People’s Republic of China) at 330 nm. The HPLC system was equipped with a 5 μm ODS C18 column (250×4.6 mm). The mobile phase consisted of methanol and deionized water containing 5 mL of diethylamine (adjusted to pH 7.0±0.1 with phosphoric acid) at a 30:70 v/v ratio with a flow rate of 1.0 mL per minute. The retention time of VCR was 12 minutes. The drug-loading content was defined as the weight ratio of loaded drug to the drug-loaded liposomes. The drug encapsulation efficiency (EE) was calculated from the weight ratio between the drug incorporated in liposomes and the total amount added to the formulation. The mean particle diameter, polydispersity index, and zeta potential of the liposomes were determined using dynamic light scattering (NanoS90, Malvern Instruments, Malvern, UK). Morphology was examined by transmission electron microscopy (JEM-1230, JEOL Ltd, Tokyo, Japan) without negative staining. Briefly, droplets (15–30 μL) of liposome suspension were placed on a Formvar-coated copper grid (230 mesh, hexagonal fields). The grids were then dried at room temperature and the morphology of the liposomes was observed using transmission electron microscopy.
In vitro drug release
The VCR and QN release of various liposomes in vitro was studied using a dialysis bag (cutoff molecular weight 8,000–14,000 kDa). The drug-loaded liposome solution (0.5 mL) was put into the dialysis bag, which was immersed in 20 mL of PBS (pH 7.4 or 5.5) to maintain a sink condition (37°C; 100 rpm). At designated time intervals, 2 mL of release medium was removed and replaced with 2 mL of fresh medium.18,19 The VCR and QN content was then quantified according to the methods described earlier. All release tests were run in triplicate.
Cell viability assay
In vitro cytotoxicity was determined by MTT assay. MCF-7, MCF-7/A, HCT-8, HCT-8/V, A549, and A549/T cells were seeded at 1–5×10³ cells/well in 96-well plates and incubated for 24 hours to allow adherence, followed with drug exposure for 48 hours. Subsequently, 32 μL of MTT (5 mg/mL) was added to each well and the plate was incubated at 37°C for 4 hours. The medium was then removed and the cells were lysed with 200 μL of dimethyl sulfoxide. The absorbance values of the formazan crystals were read on a microplate reader (SpectraMax, Molecular Devices) at 570 nm. Cell viability was assessed by calculating the absorbance readings as a percentage of the control. All assays were performed in triplicate. The cytotoxicity of the formulations was expressed as the IC50, which was designated as the concentration of the drugs that caused a 50% growth reduction of treated cells relative to untreated (control) cells. The tested groups included free VCR (FVCR), free QN (FQN), free VCR + free QN =1:1 (F1:1), free VCR + free QN =1:2 (F1:2), VCR liposomes, QN liposomes, VCR liposomes + QN liposomes =1:1 (L1:1), VCR liposomes + QN liposomes =1:2 (L1:2), VQL1:1, and VQL1:2. The cytotoxicity of VQL1:2 was also tested on normal HL7702 and HK2 cells.
Cellular uptake
The cellular uptake of VCR was determined by HPLC. A549/T, HCT-8/V, and MCF-7/A cells were cultivated in 24-well plates overnight at a density of 0.5–1×10⁶ cells per well and incubated for 24 hours to allow adherence, followed by drug exposure (VCR concentration 50 μg/mL) for 1, 2, 4, and 8 hours. After incubation, the cells were washed three times in PBS (pH 7.4) to ensure that no drug remained, detached with trypsin-ethylenediaminetetra-acetic acid, and resuspended in an appropriate volume of PBS. After centrifugation at 13,000 rpm for 5 minutes and removing the supernatant carefully, the cell pellet was destroyed by 0.1 mL of 10% sodium dodecyl sulfate. An equal volume of acetonitrile was added to the cell solution to precipitate the protein, and 20 μL of supernatant was used for HPLC detection after centrifugation at 13,000 rpm for 10 minutes.20
Multicellular tumor spheroids
A three-dimensional multicellular tumor spheroid (MTS) assay was developed to simulate the damage to the tumor in vivo caused by VCR preparation. Firstly, MTS were constructed with A549/T-cells and MCF-7/A cells. Briefly, the cells were grown in 24-well plates, which were coated with 4% (w/v) agarose to prevent cell adhesion, at a density of 1×10⁴ cells per well. The cells were cultured for about a week to form spheroids (37°C, 5% CO2). The newly formed spheroids were then treated with various preparations of VCR at 150 μg/mL for 7 days, and the changes in these MTS were observed by inverted microscope every day.
In vivo antitumor efficacy and histological analysis
A549/T-cells (1×10⁷) in a volume of 0.1 mL were implanted subcutaneously in the right flank of nude mice. When the tumors reached a volume of about 60–90 mm3, the mice were randomly divided into eight groups (five per group). The eight formulations described above were injected through the tail vein. The mice were treated once every 3 days and received a total of four treatments. Tumor volume and body weight were measured every 3 days. Tumor volume (V) was determined using the formula: V = (length × width2)/2. The animals were sacrificed on day 21, and the tumors were excised, weighed, and photographed.
Tumor tissue samples were isolated, fixed in 10% formalin, dehydrated using graded ethanol, transparentized with xylene, was embedded in paraffin, and cut at 4–5 microns thick. The sections were then stained with hematoxylin and eosin for evaluation using a standard light microscope.
Results and discussion
Mechanism of action of QN
Prior research indicates that the mechanism by which P-gp modulators reverse P-gp-mediated MDR is principally related to alteration of P-gp ATPase activity, intracellular depletion of ATP, and a decrease in P-gp expression.21–23 Therefore, our study focused on providing an insight into the mechanisms by which QN reverses MDR in MDR cancer cells, ie, A549/T, HCT-8/V, and MCF-7/A.
ATPase activity
P-gp has an ATP-binding region that is essential for substrate transport, and hydrolysis of ATP by P-gp ATPase is critical for restoring the transporter to its active conformational state. Therefore, ATPase activity plays an important role in reflecting the interaction between compounds and the drug efflux transporter. A variety of P-gp substrates can stimulate ATPase activity, and one such example is verapamil.24,25 The Pgp-Glo assay system uses luminescence to evaluate P-gp activity. P-gp-dependent decreases in luminescence reflect ATP consumption by P-gp; thus, the greater the decrease in signal, the higher the P-gp activity. To identify whether the effect of QN on P-gp was connected to inhibition of P-gp ATPase activity, P-gp-mediated ATP hydrolysis at various concentrations of QN was measured.
Membrane vesicles were incubated with increasing concentrations of QN and verapamil (a known P-gp substrate). ATPase activity was analyzed and the results are shown in Figure 1. Verapamil can dose-dependently stimulate the ATPase activity of P-gp and was used as a positive control. We found that QN increased ATPase activity at all concentrations between 5 and 100 μM, which indicates that QN is also a substrate of P-gp. In order to quantitatively evaluate the interaction of VCR and QN with P-gp, we calculated the maximal reaction rates (Vmax) and apparent Michaelis constants (Km) using double reciprocal plots of the ATPase activity assay data.26 The Km value for verapamil was 4.38 μM, while quinine treatment resulted in a 2.42–2.86-fold increase in ATPase activity with a Km of 1.19 μM, indicating that QN has a higher affinity for P-gp than verapamil. Since the Km value of VCR is reportedly 5.9±2.5 μM,27,28 QN can effectively compete for the transporter binding sites normally occupied by the substrate VCR.
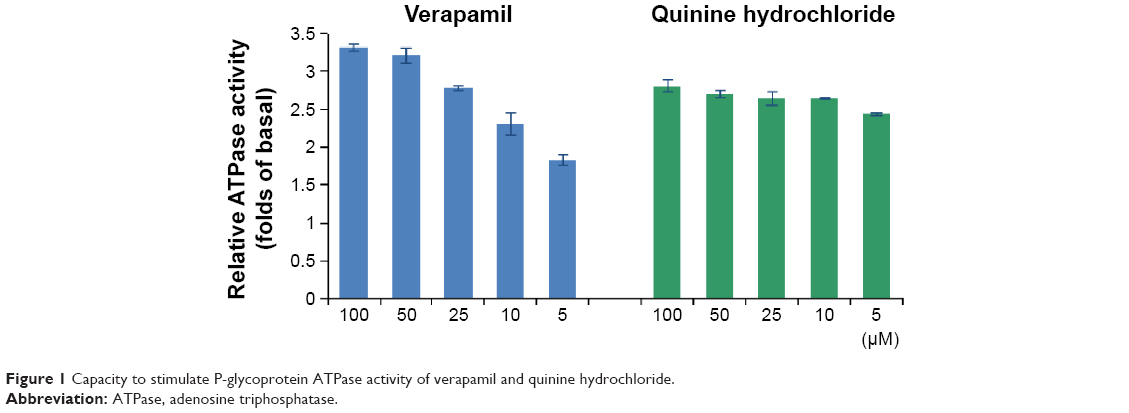 | Figure 1 Capacity to stimulate P-glycoprotein ATPase activity of verapamil and quinine hydrochloride. |
Cellular ATP content
As drug efflux is an energy-dependent process, cellular energy depletion could be responsible for QN-mediated P-gp inhibition. Therefore, the intracellular ATP content of cells was measured using a CellTiter-Glo luminescent cell viability assay kit after exposure to various concentrations of QN for 4 hours.
As shown in Figure 2, the level of ATP was significantly and dose-dependently decreased as QN concentration increased. As discussed above, QN has a strong affinity for P-gp. A strong depletion of cellular energy would be associated with active efflux of QN in drug-resistant cancer cells, which would further inhibit the efflux of other drugs such as VCR. Therefore, it is reasonable to assume that the competition between QN and VCR to bind with P-gp leads to reversal of drug resistance to VCR.
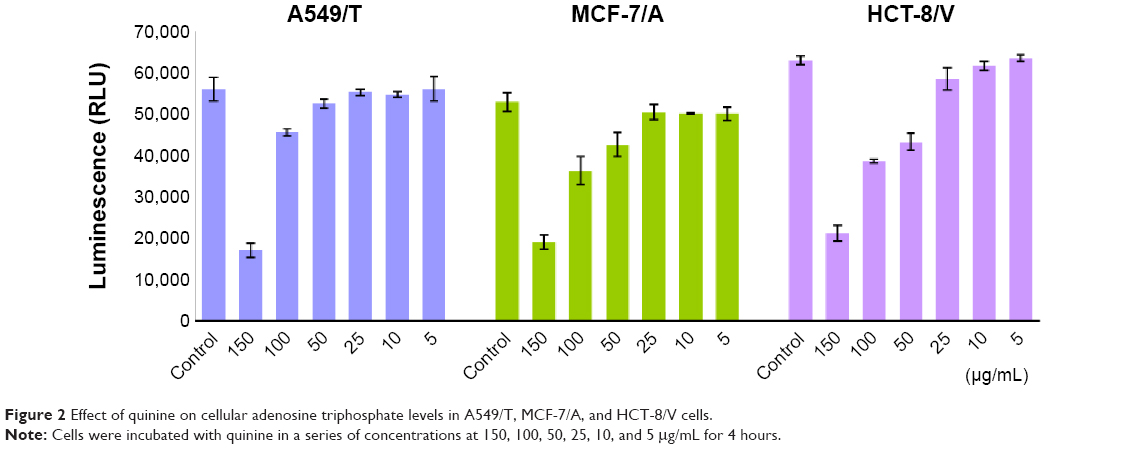 | Figure 2 Effect of quinine on cellular adenosine triphosphate levels in A549/T, MCF-7/A, and HCT-8/V cells. |
Western blot analysis of P-gp expression
The expression levels of P-gp in A549/T, MCF-7/A, and HCT-8/V cells were analyzed using Western blotting in order to confirm whether QN could downregulate P-gp expression. As shown in Figure 3, P-gp expression was greatly inhibited by QN treatment in a concentration-dependent manner in all three cell lines. The results demonstrated that QN could downregulate P-gp expression. This is another reason why QN can sensitize drug-resistant cancer cells to VCR.
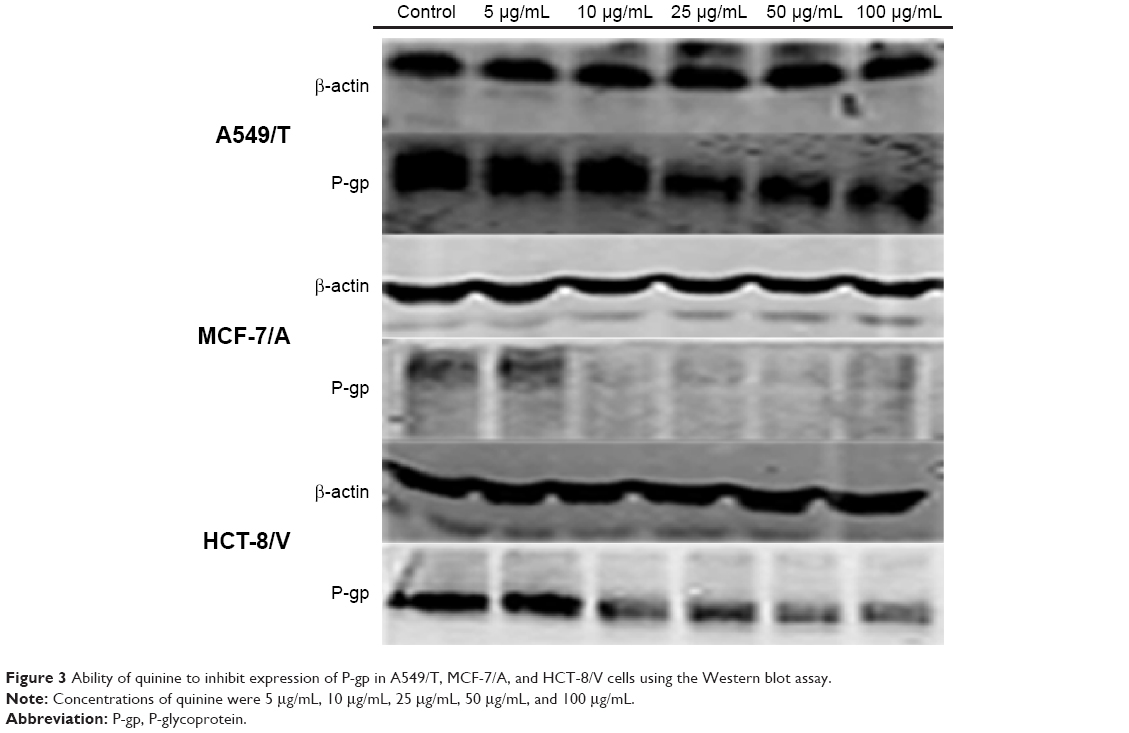 | Figure 3 Ability of quinine to inhibit expression of P-gp in A549/T, MCF-7/A, and HCT-8/V cells using the Western blot assay. |
Liposome preparation
The above results provided the necessary foundations for preparation of liposomes containing the anticancer drug VCR and the chemosensitizer QN for cancer therapy. Herein, we tried to coencapsulate VCR and QN into the same liposome by a thin film hydration method using ethanol as the solvent. Water-soluble VCR·H2SO4 could be directly entrapped in the aqueous compartments of liposomes if dissolved in the PBS that was used to hydrate the QN-containing lipid layer. However, the resultant liposomes had a low VCR EE (47.8%), and it was not possible to control the ratio of VCR and QN. To achieve satisfactory EE and to control the loading ratio of VCR and QN, water-soluble VCR·H2SO4 was firstly desalted to form VCR which could be efficiently distributed in the hydrophobic membrane of liposomes.
We evaluated the influence of the VCR to QN weight ratio on the EE and morphology of the liposomes. As shown in Table 1, the EE of the VCR liposomes and QN liposomes was 98.25% and 99.20%, respectively, which gave a drug loading content of 1.64%. Increasing the amount of VCR added resulted in a corresponding decrease in EE. Therefore, the feed content of VCR was fixed at about 1.6% to prepare dual drug-loaded liposomes. For VQL, the EE of VCR and QN was simultaneously reduced when the VCR to QN ratio changed from 1:0.25 to 1:3. Since the EE of both VCR and QN was low, the VQL1:3 group was unsuitable for in vitro experiments. We selected VQL1:1 and VQL1:2 for the in vitro experiments because of their relatively high EE and QN content. The mean particle diameter, polydispersity index, and zeta potential of blank liposomes and drug-containing liposomes are shown in Table 2. The morphology of VQL1:1 and VQL1:2 were similar on transmission electron microscopy and had a spherical outline and uniform size.
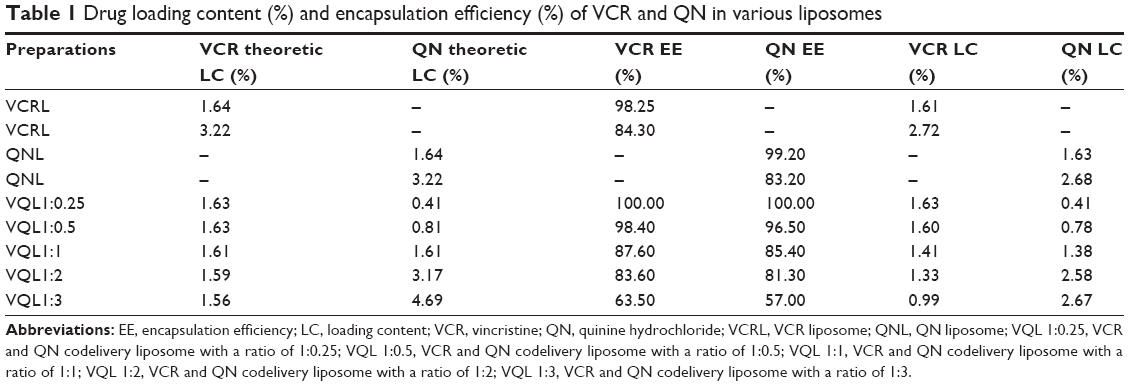 | Table 1 Drug loading content (%) and encapsulation efficiency (%) of VCR and QN in various liposomes |
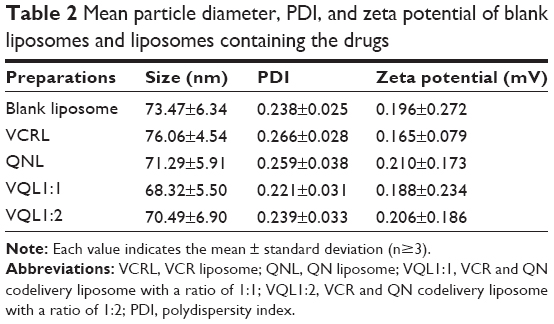 | Table 2 Mean particle diameter, PDI, and zeta potential of blank liposomes and liposomes containing the drugs |
In vitro drug release
An ideal liposome delivery system should be stable under physiological circulations but release the drug at the action site. The pH of blood is 7.4, and that of the intracellular microenvironment of tumor tissues is approximately 5.5.29 Therefore, the release of VCR and QN from FVCR, FQN, VCR liposomes, QN liposomes, L1:1, L1:2, VQL1:1, and VQL1:2 was examined in PBS of pH 7.4 and pH 5.5 at 37°C. As shown in Figure 4A and B, VCR liposomes and QN liposomes had a slower release rate than free VCR and free QN at pH 7.4, indicating that the liposome is capable of sustained drug release. When the pH of the release medium was decreased from 7.4 to 5.5, the release rate was more rapid for both drugs (Figure 4C and D). The cumulative drug release reached 70%–90% within the first 4 hours, suggesting that rapid drug release would occur as soon as the liposomes were endocytosed into the acidic endosomes of cancer cells. Furthermore, it was observed that QN was released a little faster than VCR at both pH values, which indicates that QN may reach the target site before VCR when they are coencapsulated in the same liposome.
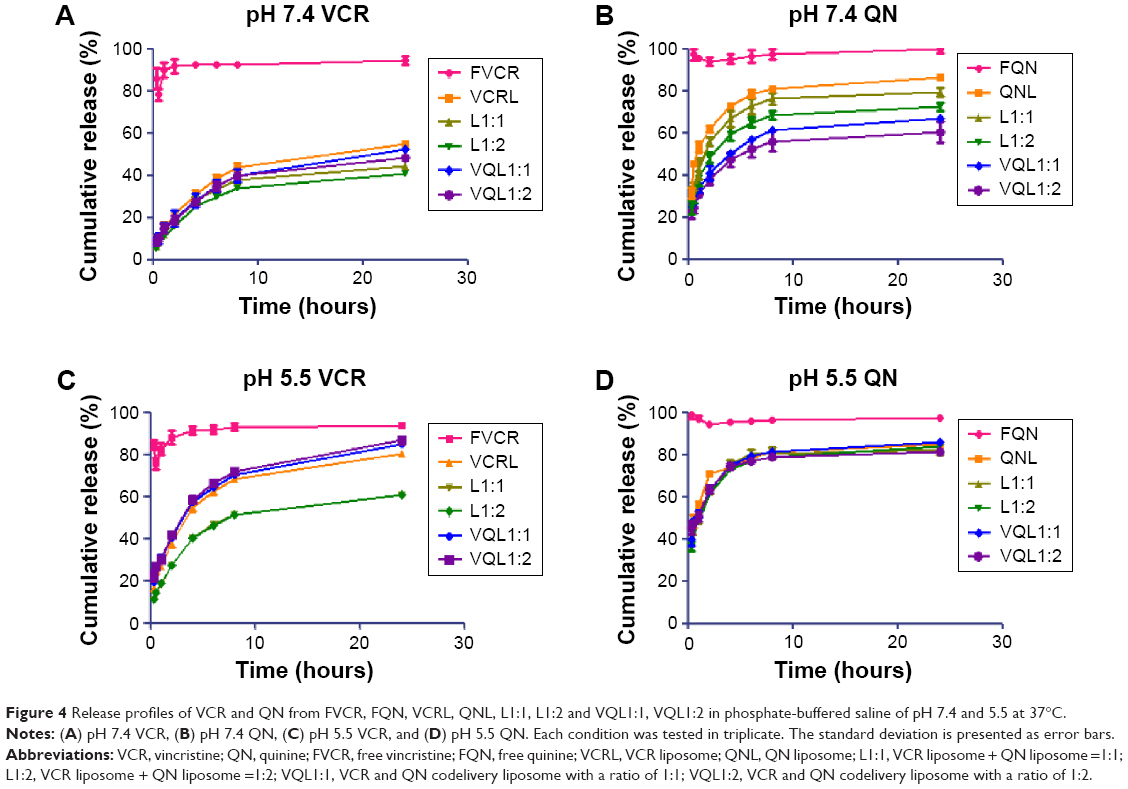 | Figure 4 Release profiles of VCR and QN from FVCR, FQN, VCRL, QNL, L1:1, L1:2 and VQL1:1, VQL1:2 in phosphate-buffered saline of pH 7.4 and 5.5 at 37°C. |
Cell viability assay
In vitro cytotoxicity studies were first conducted with empty liposomes to determine the vehicle cytotoxicity. The concentration of lipid tested matched the amount of lipid used in the drug-loaded formulations. Cell viability ranged from 97.0% to 01.2% of untreated control, indicating that the liposome itself was not toxic towards these cancer cells.
The 50% inhibitory concentrations (IC50) of the various formulations on MCF-7, MCF-7/A, HCT-8, HCT-8/V, A549, and A549/T cell lines were measured using the MTT assay. As shown in Table 3, there was a significant difference in sensitivity of MCF-7 and MCF-7/A, HCT-8 and HCT-8/V, and A549 and A549/T cells towards VCR (IC50: HCT-8 0.97±0.18 μg/mL; MCF-7 14.30±2.08 ng/mL; A549 0.015±0.011 μg/mL). Therefore, MCF-7/A, HCT-8/V, and A549/T were found to be 28.86, 2,573.43, and 2,132.67 times as resistant to VCR as the non-resistant cell lines. FQN was far less cytotoxic than FVCR.
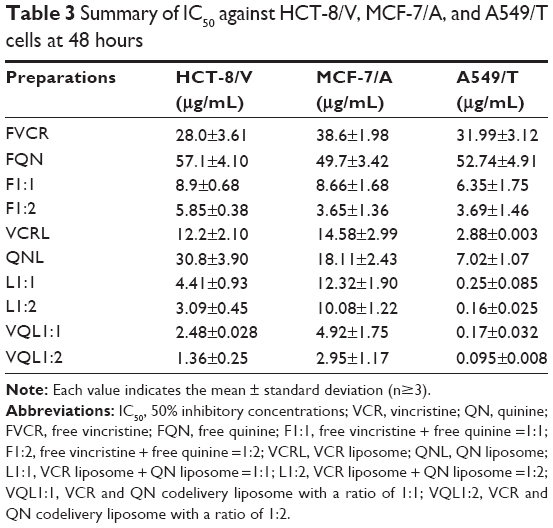 | Table 3 Summary of IC50 against HCT-8/V, MCF-7/A, and A549/T cells at 48 hours |
When FVCR was mixed with FQN, the cytotoxicity to the three cell lines was enhanced; this enhancement was more significant when the ratio of FQN was increased, thus indicating that QN exerts a positive, dose-dependent effect on VCR resistance in these cancer cells. Similarly, based on the difference between the IC50 of L1:1 or L1:2 and the IC50 of VCR liposomes, enhanced cytotoxicity due to the addition of QN liposomes was observed. Additionally, the contribution of liposomal carriers to cytotoxicity enhancement was not negligible, since the IC50 of each liposome (VCR liposomes, QN liposomes, L1:1, L1:2) was higher than that of the corresponding free drug formulation (free VCR, free QN, F1:1, F1:2) in all cells except for MCF-7/A cells (Table 3).
The most significant enhancement of VCR cytotoxicity was observed in the VQL groups, and increasing the content of QN resulted in a further decrease of IC50. This indicated the importance of coencapsulation of chemosensitizers and anticancer agents in liposomes. Moreover, the cytotoxicity was found to be stronger in A549/T cells than in MCF-7/A and HCT-8/V cells. The IC50 of VQL1:2-delivered VCR in A549/T cells was 0.095±0.008 μg/mL, which was 13.3 and 30.1 times lower than in HCT-8/V and MCF-7/A cells, respectively.
Cellular uptake
The accumulation of VCR in MCF-7/A, HCT-8/V, and A549/T cells was determined quantitatively by HPLC. As shown in Figure 5, the uptake of free VCR in MCF-7/A cells and HCT-8/V cells began to decline after 4 hours of incubation, indicating that the MDR proteins overexpressed in these cells may pump the drugs out of the cells. When FQN was coadministered, uptake of VCR increased over the entire experimental period. More notably, the intracellular concentration of VCR in the VQL group gradually improved with extended incubation time. The intracellular concentration was also apparently higher than in the other groups, especially in MCF-7/A cells and HCT-8/V cells expressing high levels of P-gp. These results demonstrated that the efflux of VCR in resistant cancer cells was inhibited to some extent by liposome-encapsulated QN. These results are consistent with the cytotoxicity assessment.
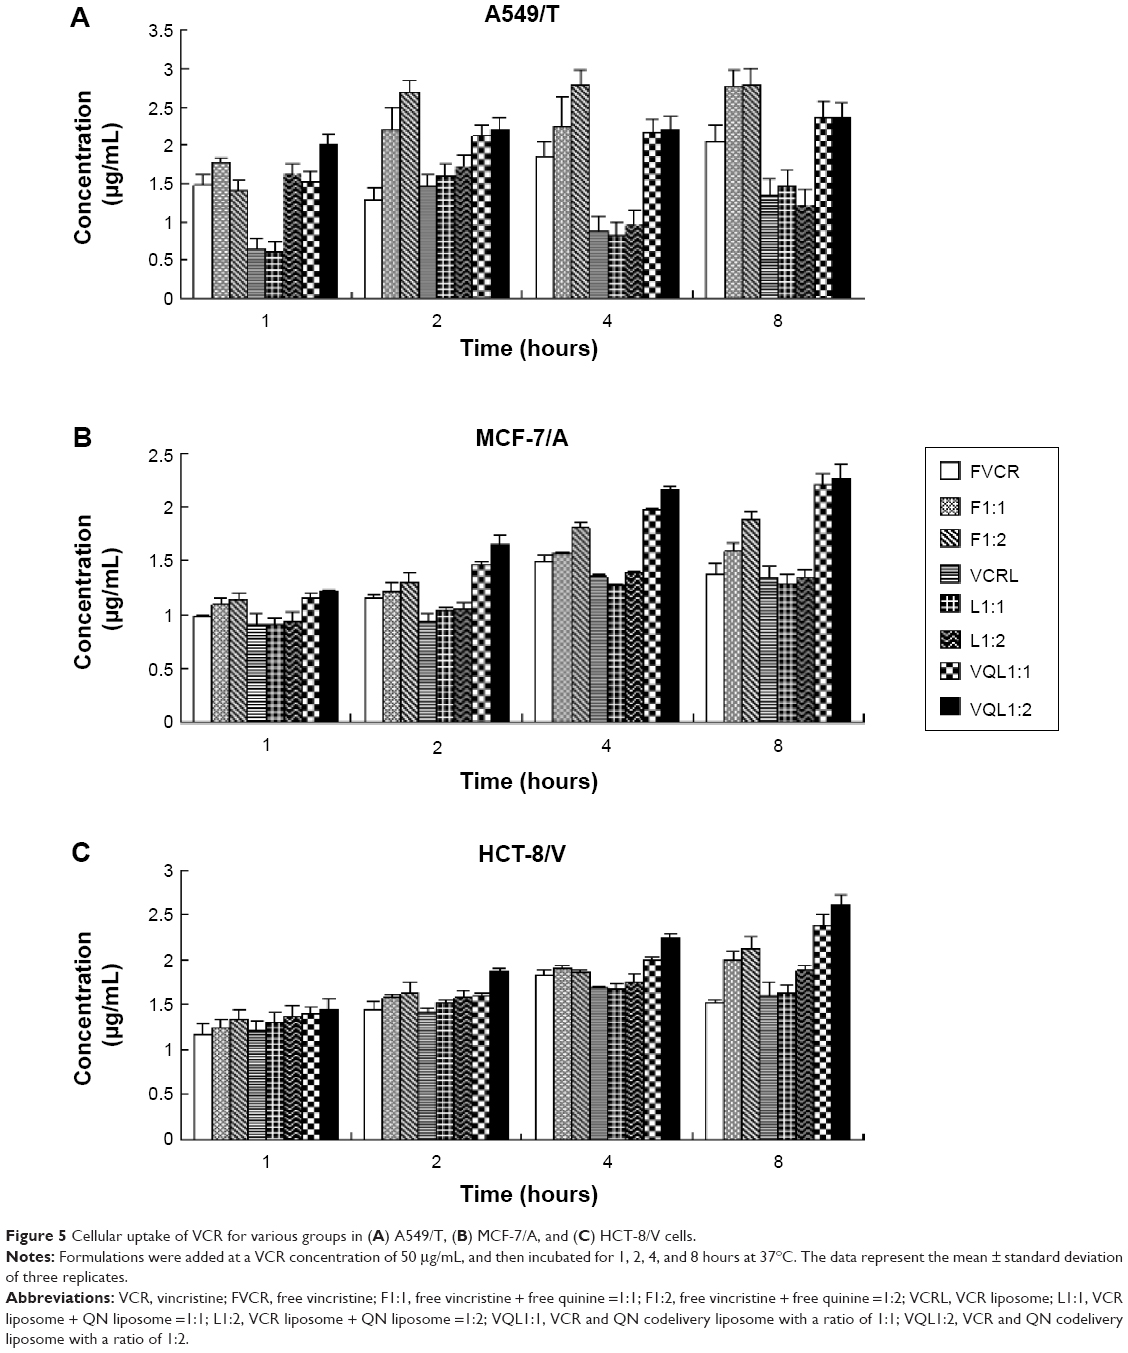 | Figure 5 Cellular uptake of VCR for various groups in (A) A549/T, (B) MCF-7/A, and (C) HCT-8/V cells. |
Multicellular tumor spheroids
In this study, we used inverted microscopy to investigate the effect of VCR and QN combination therapy on MTS (Figure 6). After 7 days of treatment, the MTS of A549/T cells and MCF-7/A cells in the control group had barely changed. No significant difference in the growth of MTS was observed relative to the untreated control group after treatment with FVCR, FQN, VCR liposomes, or QN liposomes. In the case of MCF-7/A MTS, L1:2 treatment did not reduce the volume of MTS, while VQL1:2 did. The growth of MCF-7/A and A549/T MTS was completely impeded following incubation with VQL1:2 at a VCR concentration of 150 μg/mL. These morphological characteristics indicated that VCR and QN coloaded liposome therapy has a strong anticancer effect.
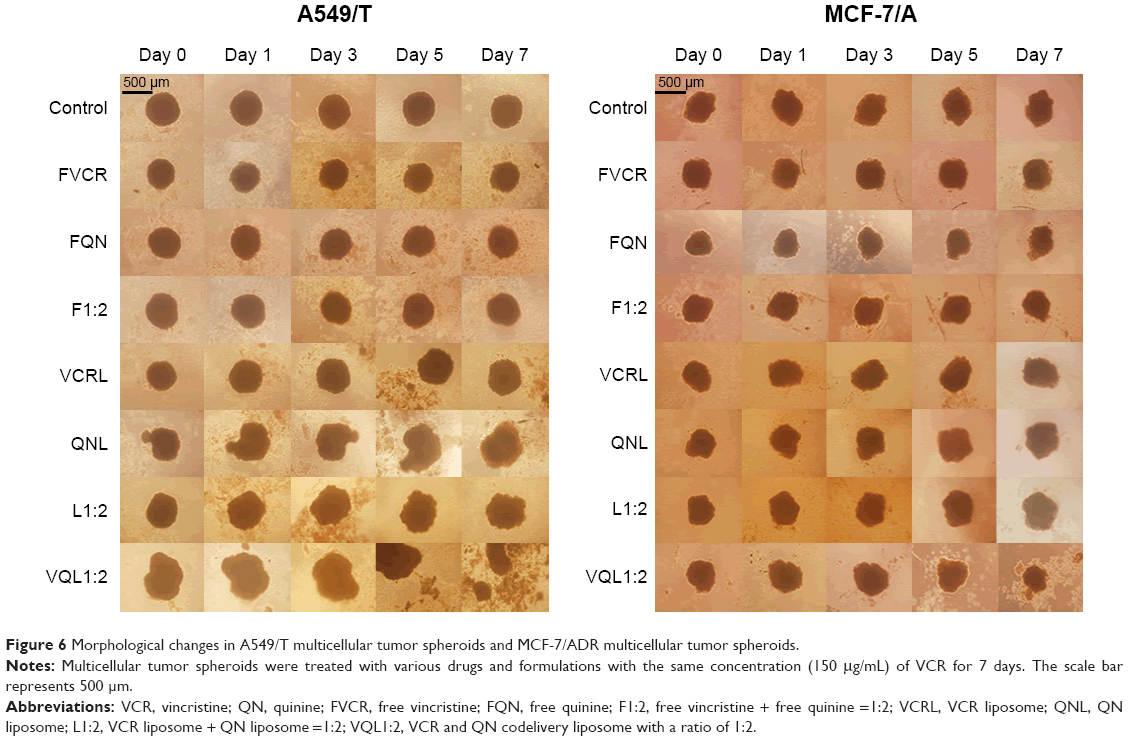 | Figure 6 Morphological changes in A549/T multicellular tumor spheroids and MCF-7/ADR multicellular tumor spheroids. |
In vivo antitumor efficacy
In vivo antitumor tests were performed using A549/T tumor-bearing nude mice. Considering the severe neurotoxicity of VCR, we set the dose of VCR at 1.0 mg/kg. The antitumor efficacy of the treatments was assessed by measuring tumor volume and tumor weight after intravenous injection. Figure 7A shows the changes of A549/T tumor volume after the various treatments. In the control group, the tumors grew rapidly, and the tumor volume was over 3,000 mm3 after 20 days. Both FQN and QN liposomes barely inhibited tumor progression, confirming that QN was ineffective against A549/T tumors. Only weak inhibition of tumor growth was observed in the FVCR group and in the VCR liposome group, due to drug resistance. It should be noted that tumor growth was significantly inhibited by all formulations that contained both VCR and QN (F1:2, L1:2, VQL1:2). The tumor growth inhibition in the F1:2, L1:2, and VQL1:2 groups was 2.42-fold, 2.91-fold, and 5.38-fold greater, respectively, than in the control group. VQL1:2 treatment had the highest antitumor activity, and this is in agreement with the in vitro cytotoxicity data. At the end of the experiment, all tumors were removed and weighed. A summary of the significance levels of tumor weight in the various groups is shown in Figure 7B and D. The VQL1:2 group had the smallest tumor size.
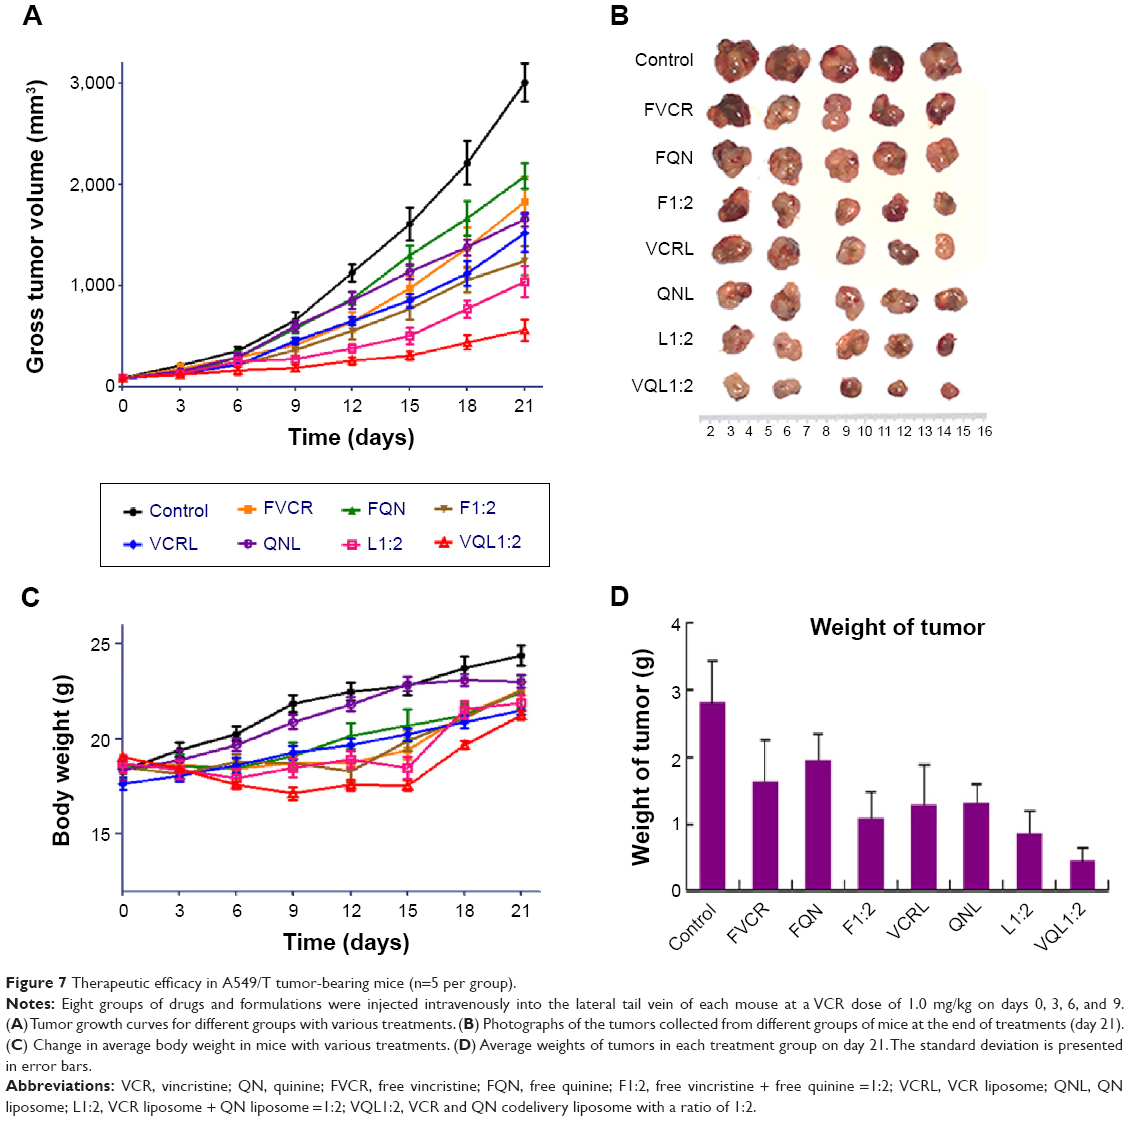 | Figure 7 Therapeutic efficacy in A549/T tumor-bearing mice (n=5 per group). |
To further assess the damage induced by the treatments, we conducted hematoxylin and eosin staining of tumor sections from each treatment group (Figure 8). The nuclei are stained with hematoxylin (blue) while the other parts of the cell are stained with eosin (red and pink). In control tumor tissue sections, the tumor cell nuclei were large with prominent nucleoli, and only a few cells showed reduced nuclear size with deeply stained nuclei and condensed cytoplasm. In contrast, in the combination treatment groups, a greater number of cells had hyperchromatic nuclei and a reduced nuclear size, especially in the VQL1:2 group.
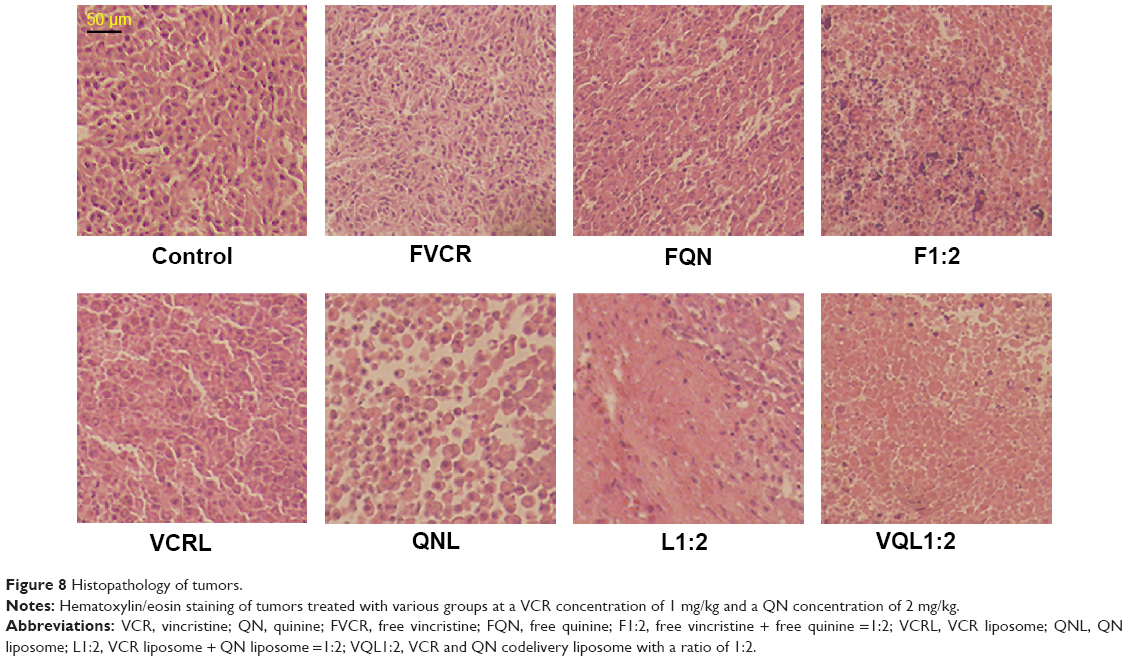 | Figure 8 Histopathology of tumors. |
Based on these results, it was confirmed that coadministration of QN could increase the antitumor efficacy of VCR, and the enhancement was much more pronounced when QN was coencapsulated with VCR in the same vehicle.
In this treatment process, only slight weight loss of mice was observed in F1:2, L1:2, and VQL1:2 groups; however, the body weight gradually recovered to normal after drug administration (Figure 7C). It has been confirmed that liposomes with small particle sizes, if they do not reach the tumor, tend to distribute to the liver and kidney after intravenous injection.30–32 Therefore, we also investigated the cytotoxicity of VQL1:2 in normal liver and kidney tissue cells. The IC50 of VQL1:2 was 3.54±0.3 μg/mL and 125.6±4.0 μg/mL for HL7702 and HK2 cells, respectively, which was much higher than the IC50 for A549/T-cells (0.095±0.008 μg/mL). This result indicates that VQL has specific cytotoxicity for A549/T cancer cells, which would be helpful to reduce overall side effects in vivo.
Conclusion
In our study, the mechanism of QN-modulated resistance to VCR was validated in MDR A549/T, MCF-7/A, and HCT-8/V cells. It was shown that the following phenomena were involved: a decrease of P-gp expression, induction of intracellular ATP depletion, and an increase of P-gp ATPase activity as a substrate. As a result, the dual-drug-loaded liposome VQL exhibited the best antitumor efficacy in vitro and in vivo, suggesting that QN is a nonspecific sensitizer to VCR, and coencapsulation of VCR and QN in the same liposome has potential as a novel therapeutic approach to overcome chemoresistant cancer.
Acknowledgments
This study was financially supported by the National Natural Science Funds for Excellent Young Scholar (81222047), the Zhejiang Natural Science Funds (Y2110478), the Ministry of Education Program for New Century Excellent Talents (NCET-11-0454), and the Fundamental Research Funds for the Central Universities (2014XZZX003-20).
Disclosure
The authors report no conflicts of interest in this work.
References
Johnson IS, Armstrong JG, Gorman M, Burnett JP. The vinca alkaloids: a new class of oncolytic agents. Cancer Res. 1963;23(8 Part 1):1390–1427. | ||
Liang GW, Lu WL, Wu JW, et al. Enhanced therapeutic effects on the multi-drug resistant human leukemia cells in vitro and xenograft in mice using the stealthy liposomal vincristine plus quinacrine. Fundam Clin Pharmacol. 2008;22(4):429–437. | ||
Legha SS. Vincristine neurotoxicity. Med Toxicol. 1986;1(6):421–427. | ||
Davis T, Farag SS. Treating relapsed or refractory Philadelphia chromosome-negative acute lymphoblastic leukemia: liposome-encapsulated vincristine. Int J Nanomedicine. 2013;8:3479–3488. | ||
Koo JS, Choi WC, Rhee YH, et al. Quinoline derivative KB3-1 potentiates paclitaxel induced cytotoxicity and cycle arrest via multidrug resistance reversal in MES-SA/DX5 cancer cells. Life Sci. 2008;83(21):700–708. | ||
Ueda K, Cardarelli C, Gottesman MM, Pastan I. Expression of a full-length cDNA for the human “MDR1” gene confers resistance to colchicine, doxorubicin, and vinblastine. Proc Natl Acad Sci U S A.1987;84(9):3004–3008. | ||
Solary E, Drenou B, Campos L, et al. Quinine as a multidrug resistance inhibitor: a phase 3 multicentric randomized study in adult de novo acute myelogenous leukemia. Blood. 2003;102(4):1202–1210. | ||
Solary E, Caillot D, Chauffert B, et al. Feasibility of using quinine, a potential multidrug resistance-reversing agent, in combination with mitoxantrone and cytarabine for the treatment of acute leukemia. J Clin Oncol. 1992;10(11):1730–1736. | ||
Allen T, Stuart D. Liposomal pharmacokinetics. Classical, sterically-stabilized, cationic liposomes and immunoliposomes. In: Janoff AS. Liposomes: Rational Design. New York, NY, USA: Marcel Dekker Inc; 2005. | ||
Maeda H. The enhanced permeability and retention (EPR) effect in tumor vasculature: the key role of tumor-selective macromolecular drug targeting. Adv Enzyme Regul.2001;41:189–207. | ||
Cosco D, Paolino D, Maiuolo J, Russo D, Fresta M. Liposomes as multicompartmental carriers for multidrug delivery in anticancer chemotherapy. Drug Deliv Transl Res.2011;1(1):66–75. | ||
Cosco D, Paolino D, Cilurzo F, Casale F, Fresta M. Gemcitabine and tamoxifen-loaded liposomes as multidrug carriers for the treatment of breast cancer diseases. Int J Pharm. 2012;422(1):229–237. | ||
Tardi PG, Gallagher RC, Johnstone S, et al. Coencapsulation of irinotecan and floxuridine into low cholesterol-containing liposomes that coordinate drug release in vivo. Biochim Biophys Acta.2007;1768(3):678–687. | ||
Tardi PG, Dos Santos N, Harasym TO, et al. Drug ratio-dependent antitumor activity of irinotecan and cisplatin combinations in vitro and in vivo. Mol Cancer Ther. 2009;8(8):2266–2275. | ||
Saad M, Garbuzenko OB, Minko T. Co-delivery of siRNA and an anticancer drug for treatment of multidrug-resistant cancer. Nanomedicine (Lond). 2008;3(6):761–776. | ||
Ambudkar SV, Dey S, Hrycyna CA, Ramachandra M, Pastan I, Gottesman MM. Biochemical, cellular, and pharmacological aspects of the multidrug transporter. Annu Rev Pharmacol. 1999;39:361–398. | ||
Wong MY, Chiu GN. Liposome formulation of coencapsulated vincristine and quercetin enhanced antitumor activity in a trastuzumab-insensitive breast tumor xenograft model. Nanomed Nanotechnol. 2011;7(6):834–840. | ||
Lee AL, Wang Y, Cheng HY, Pervaiz S, Yang YY. The co-delivery of paclitaxel and Herceptin using cationic micellar nanoparticles. Biomaterials. 2009;30(5):919–927. | ||
Wong MY, Chiu GN. Simultaneous liposomal delivery of quercetin and vincristine for enhanced estrogen-receptor-negative breast cancer treatment. Anticancer Drugs. 2010;21(4):401–410. | ||
Yang T, Choi M-K, Cui F-D, et al. Preparation and evaluation of paclitaxel-loaded PEGylated immunoliposome. J Control Release. 2007;120(3):169–177. | ||
Kabanov A. Polymer genomics: an insight into pharmacology and toxicology of nanomedicines. Adv Drug Deliv Rev. 2006;58(15):1597–1621. | ||
Wesołowska O. Interaction of phenothiazines, stilbenes and flavonoids with multidrug resistance-associated transporters, P-glycoprotein and MRP1. Acta Biochim Pol. 2011;58:433–448. | ||
Brigger I, Dubernet C, Couvreur P. Nanoparticles in cancer therapy and diagnosis. Adv Drug Deliv Rev. 2012;64:24–36. | ||
Ji X, Gao Y, Chen L, Zhang Z, Deng Y, Li Y. Nanohybrid systems of non-ionic surfactant inserting liposomes loading paclitaxel for reversal of multidrug resistance. Int J Pharm. 2012;422(1–2):390–397. | ||
Garrigues A, Nugier J, Orlowski S, Ezan E. A high-throughput screening microplate test for the interaction of drugs with P-glycoprotein. Anal Biochem. 2002;305(1):106–114. | ||
Lineweaver H, Burk D. The determination of enzyme dissociation constants. J Am Chem Soc. 1934;56(3):658–666. | ||
He L, Liu G-Q. Interaction of multidrug resistance reversal agents with P-glycoprotein ATPase activity on blood–brain barrier. Acta Pharmacol Sin. 2002;23(5):423–429. | ||
Shirasaka Y, Onishi Y, Sakurai A, Nakagawa H, Ishikawa T, Yamashita S. Evaluation of human P-glycoprotein (MDR1/ABCB1) ATPase activity assay method by comparing with in vitro transport measurements: Michaelis-Menten kinetic analysis to estimate the affinity of P-glycoprotein to drugs. Biol Pharm Bull. 2006;29(12):2465–2471. | ||
Fritze A, Hens F, Kimpfler A, Schubert R, Peschka-Suss R. Remote loading of doxorubicin into liposomes driven by a transmembrane phosphate gradient. Biochim Biophys Acta. 2006;1758(10):1633–1640. | ||
Phan G, Herbet A, Cholet S, Benech H, Deverre JR, Fattal E. Pharmacokinetics of DTPA entrapped in conventional and long-circulating liposomes of different size for plutonium decorporation. J Control Release. 2005;110(1):177–188. | ||
Harashima H, Kiwada H. Liposomal targeting and drug delivery: kinetic consideration. Adv Drug Deliv Rev. 1996;19(1):425–444. | ||
Litzinqer DC, Buiting AM, van Rooijen N, Huang L. Effect of liposome size on the circulation time and intraorgan distribution of amphipathic poly(ethylene glycol)-containing liposomes. Biochim Biophys Acta. 1994;1190(1):99–107. |
 © 2015 The Author(s). This work is published and licensed by Dove Medical Press Limited. The full terms of this license are available at https://www.dovepress.com/terms.php and incorporate the Creative Commons Attribution - Non Commercial (unported, v3.0) License.
By accessing the work you hereby accept the Terms. Non-commercial uses of the work are permitted without any further permission from Dove Medical Press Limited, provided the work is properly attributed. For permission for commercial use of this work, please see paragraphs 4.2 and 5 of our Terms.
© 2015 The Author(s). This work is published and licensed by Dove Medical Press Limited. The full terms of this license are available at https://www.dovepress.com/terms.php and incorporate the Creative Commons Attribution - Non Commercial (unported, v3.0) License.
By accessing the work you hereby accept the Terms. Non-commercial uses of the work are permitted without any further permission from Dove Medical Press Limited, provided the work is properly attributed. For permission for commercial use of this work, please see paragraphs 4.2 and 5 of our Terms.