")
Back to Journals » OncoTargets and Therapy » Volume 9
Non-small-cell lung cancer cells combat epidermal growth factor receptor tyrosine kinase inhibition through immediate adhesion-related responses
Authors Wang H, Hsu M, Wang K, Tseng C, Chen F, Hsu JT
Received 14 September 2015
Accepted for publication 9 January 2016
Published 19 May 2016 Volume 2016:9 Pages 2961—2973
DOI https://doi.org/10.2147/OTT.S96341
Checked for plagiarism Yes
Review by Single anonymous peer review
Peer reviewer comments 4
Editor who approved publication: Dr Faris Farassati
Hsian-Yu Wang,1,2 Min-Kung Hsu,3,4 Kai-Hsuan Wang,1 Ching-Ping Tseng,2,4 Feng-Chi Chen,3,4 John T-A Hsu1,4
1Institute of Biotechnology and Pharmaceutical Research, National Health Research Institutes (NHRI), Zhunan, Miaoli County, 2Institute of Molecular Medicine and Bioengineering, National Chiao Tung University (NCTU), Hsinchu, 3Division of Biostatistics and Bioinformatics, Institute of Population Health Sciences, National Health Research Institutes (NHRI), Zhunan, Miaoli County, 4Department of Biological Science and Technology, National Chiao Tung University (NCTU), Hsinchu, Taiwan, Republic of China
Background: Epidermal growth factor receptor (EGFR) tyrosine kinase inhibitors (TKIs), such as gefitinib, erlotinib, and afatinib, have greatly improved treatment efficacy in non-small cell lung cancer (NSCLC) patients with drug-sensitive EGFR mutations. However, in some TKI responders, the benefits of such targeted therapies are limited by the rapid development of resistance, and strategies to overcome this resistance are urgently needed. Studies of drug resistance in cancer cells typically involve long term in vitro induction to obtain stably acquired drug-resistant cells followed by elucidation of resistance mechanisms, but the immediate responses of cancer cells upon drug treatment have been ignored. The aim of this study was to investigate the immediate responses of NSCLC cells upon treatment with EGFR TKIs.
Results: Both NSCLC cells, ie, PC9 and H1975, showed immediate enhanced adhesion-related responses as an apoptosis-countering mechanism upon first-time TKI treatment. By gene expression and pathway analysis, adhesion-related pathways were enriched in gefitinib-treated PC9 cells. Pathway inhibition by small-hairpin RNAs or small-molecule drugs revealed that within hours of EGFR TKI treatment, NSCLC cells used adhesion-related responses to combat the drugs. Importantly, we show here that the Src family inhibitor, dasatinib, dramatically inhibits cell adhesion-related response and greatly enhances the cell-killing effects of EGFR TKI (gefitinib for the PC9 cells; afatinib for the H1975 cells) in NSCLC cells, which would otherwise escape the TKI-induced apoptosis.
Conclusion: Results from this study indicate that NSCLC cells can employ the adhesion response as a survival pathway to survive under EGFR-targeted therapy. Simultaneous targeting of EGFR signaling and adhesion pathways would further boost the efficacy of EGFR-targeted therapy in NSCLC.
Keywords: adhesion response, drug resistance, gene set enrichment analysis, cell stress response
Introduction
Currently, there are two major types of therapeutic drugs for lung cancer, which is the leading cause of cancer deaths worldwide: chemotherapeutics and targeted therapeutics. Targeted therapeutics, such as the tyrosine kinase inhibitors (TKIs) gefitinib, erlotinib, and afatinib, have become the first-line treatment for non-small-cell lung cancer (NSCLC) patients with specific epidermal growth factor receptor (EGFR) mutations, such as exon 19 deletion or an exon 21 substitution (L858R).1 Despite the successful use of EGFR TKIs in the treatment of patients harboring specific EGFR mutations, all responding patients eventually develop resistance to EGFR TKIs after a period of treatment.2,3 In previous studies, >20 different nodes in distinct signaling pathways were reported as mechanisms for combating resistance to EGFR-targeted therapies.4 Approximately 10%–15% of patients who develop EGFR TKI resistance show MET amplification, and ~50% have a second EGFR mutation, T790M.5,6
Various in vitro cell culture methods have been used to study drug resistance mechanisms. These methods typically involve the induction of EGFR TKI drug resistance in cells through a gradual increase in drug concentration followed by selection of drug-resistant stable cell clones and comparison of the resistant cells with the parental cells to reveal the acquired resistance mechanisms. This approach has been used to elucidate several prolonged and stable drug-resistant nodes and networks, which are consistent with resistance mechanisms observed clinically, such as the T790M second mutation,7 MET amplification,6 and the insulin-like growth factor 1 receptor pathway.8 However, in vitro induction methods usually take a few months to produce stable drug-resistant cell clones. Although such methods can select the populations that survive prolonged drug treatment, they reveal nothing about transient or moving targets, that is, the emergency defense mechanisms initially employed by cancer cells, at the very beginning of treatment.
The emergency response of cancer cells to the first-time EGFR TKI treatment has yet to be investigated; therefore, in this study we examined changes in the behavior and signaling of EGFR TKI-sensitive NSCLC cells upon first exposure to the EGFR-targeting drug gefitinib or afatinib. After the emergency response of the PC9 cells was identified, with the help of gene set enrichment analysis (GSEA), we interrupted that response by inhibiting the relevant pathways through treatments with small-hairpin RNA (shRNA) or small-molecule inhibitors. Interruption of the cells’ emergency defense response could maximize the cytotoxic efficacy of the EGFR-targeted drug, leaving EGFR TKI-sensitive NSCLC cells more vulnerable.
Methods
Cell lines and reagents
The gefitinib-sensitive human adenocarcinoma NSCLC cell line PC9 (EGFR exon19del E746-A750) was kindly provided by Dr Pan-Chyr Yang, and gefitinib-resistant NSCLC H1975 cells (EGFR L858R/T790M; IC50 >10 μM) were obtained from the American Type Culture Collection (ATCC) (Manassas, VA, USA). All cells were maintained in RPMI 1640 growth medium (Thermo Fisher Scientific, Waltham, MA, USA) containing 10% fetal bovine serum (Thermo Fisher Scientific), penicillin, and streptomycin (Thermo Fisher Scientific) in humidified 5% CO2 at 37°C. EGFR TKIs gefitinib (Ryss Lab, Inc., Union City, CA, USA), afatinib (LC Laboratories, Woburn, MA, USA), Src TKI dasatinib (LC Laboratories), and integrin inhibitor cilengitide (ci) (AdooQ Bioscience, Irvine, CA, USA) were obtained from commercial sources. The integrin inhibitor c8 was kindly provided by Dr William F DeGrado.9 Stock solutions (10 mM) of all chemicals were prepared in dimethyl sulfoxide (DMSO). Both cell lines used in the current study can be obtained commercially and they were classified as the most low risk by the institutional review board of National Health Research Institute. The ethics approval was not required for the use of these cell lines.
Phase-contrast live-cell imaging
Phase-contrast live-cell images were obtained with a fluorescence microscope (AF6000-LX; Leica Microsystems, Wetzlar, Germany) enclosed inside a chamber at 37°C and 5% CO2 with a charge-coupled device camera (Leica Microsystems). The microscope and image acquisition were controlled by means of the Leica AF6000 software. Images were captured with a 10× objective in 10-minute intervals for the desired duration.
Gene expression analysis (pathway analysis)
The PC9 cells were seeded 1 day before treatment with gefitinib (200 nM). After incubation with gefitinib for 72 hours, the cells were harvested with RNAprotect Cell reagent (Qiagen NV, Venlo, the Netherlands). Total cellular RNA was isolated with an RNeasy Mini Kit (Qiagen NV), according to the procedure suggested by the manufacturer. Microarray analysis was performed with Human OneArray v6 (Phalanx Biotech Group, Hsinchu, Taiwan), which contains 31,741 content probes and 938 control probes. All samples were analyzed twice, and the intensities were normalized for each microarray.
To evaluate differential gene expression between gefitinib-treated cells and parental cells, the intensities of both treated and parental cells were normalized by the median intensity. The probes that could not be matched to any gene were excluded. The expression values of probes corresponding to the same gene were summed up. A total of 19,646 genes were measured as expression fold change. According to the detection limit of the microarray analysis, a cut-off normalized value of 50 was used to determine whether a gene was expressed or not, and values <50 were adjusted to 50.10 Alteration of expression is reported as a fold change (fi) between expression in treated cells and expression in parental cells: fi = log2(Ei/Ei0), where Ei is expression of the ith gene in treated cells, and Ei0 is expression of the ith gene in vehicle (DMSO) control cells.
The upregulated and downregulated genes were defined by the outlier of differential expression distribution in a box-and-whisker diagram. The GSEA software11 was used to elucidate the enrichment pathways and the differences in the contributions of genes between parental and treated cells. The 186 pathways in the Kyoto Encyclopedia of Genes and Genomes (KEGG)12 were used as gene sets in this analysis.
Real-time PCR
The PC9 and H1975 cells were treated by gefitinib or afatinib for the indicated time, and the total RNA was isolated using the RNeasy Mini Kit (Qiagen NV) according to the instructions of the manufacturer. Reverse transcription was carried out with 1 μg RNA using 1 μL of Moloney murine leukemia virus reverse transcriptase (200 U/μL) and 1 μL random primers (85.7 nmol). Real-time PCR was carried out using the SYBR Green PCR FAST qPCR Kit (KAPA Biosystems, Boston, MA, USA). Primers were at a final concentration of 0.5 μmol/L and 1 μL cDNA. Glyceraldehyde-3-phosphate dehydrogenase (GAPDH) RNA was amplified in each sample as the endogenous control. The primer sequences used were as follows: GAPDH forward (5′-gaaggtgaaggtcggagtc-3′), GAPDH reverse (5′-gaagatggtgatgggatttc-3′); FN1 forward (5′-ctggccgaaaatacattgtaaa-3′), FN1 reverse (5′-ccacagtcgggtcaggag-3′); ITGAV forward (5′-aagctgagctcatcgtttcc-3′), ITGAV reverse (5′-gcacaggaaagtcttgctaagg-3′); ITGB1 forward (5′-cgatgccatcatgcaagt-3′), ITGB1 reverse (5′-acaccagcagccgtgtaac-3′); FAK forward (5′-gtctgccttcgcttcacg-3′), FAK reverse (5′-gaatttgtaactggaagatgcaag-3′); and Src forward (5′-gcaacttgcccagctatgag-3′), Src reverse (5′-gcctcagcgtcctcatct-3′). The following thermal cycling conditions were used for each primer set: initial denaturation at 50°C for 2 minutes, 95°C for 10 minutes, 40 cycles of 95°C for 15 seconds, 60°C for 1 minute, 95°C for 15 seconds, 60°C for 15 seconds, and 95°C for 15 seconds. Triplicate samples were analyzed for both target genes and GAPDH. The relative expression changes in target mRNA levels were normalized to GAPDH and followed by fold-change calculation.
RNA interference
PC9 cells were transfected with a control and various shRNA interference plasmids using Lipofectamine 2000 reagent (Thermo Fisher Scientific), according to the manufacturer’s instructions. The shRNA interference plasmids (Src, TRCN0000038150; ITGAV, TRCN0000003240; ITGB1, TRCN0000029645; FN1, TRCN0000293790; and control shRNA, pLAS.Void) were purchased from the National RNAi Core Facility (Institute of Molecular Biology, Academia Sinica, Taipei, Taiwan). Twenty-four hours after transfection, the culture medium was refreshed with the growth medium, and the cells were incubated for 48 hours and then harvested for Western blotting or treated with gefitinib.
Western blotting
After EGFR TKI or RNA interference treatments, PC9 or H1975 cells were lysed in the lysis buffer (150 mM NaCl, 1% Triton X-100, 50 mM Tris, pH 8.0). The cell lysates were analyzed by means of a BCA protein assay (Pierce, Rockford, IL, USA), resolved by SDS-PAGE, and transferred onto a polyvinylidene difluoride membrane (PerkinElmer Inc., Waltham, MA, USA). The membrane was blocked in a blocking buffer (3% bovine serum albumin in Tris-buffered saline with 0.1% Tween-20 [TBST]) for 1 hour at room temperature. Primary antibodies against β-actin (EMD Millipore, Billerica, MA, USA), tubulin (Sigma-Aldrich, St Louis, MO, USA), p-Src, Src, ITGAV, and ITGB1 (all from Cell Signaling, Danvers, MA), fibronectin (FN1), and p-FAK and FAK (all from GeneTex, Irvine, CA, USA) were diluted in blocking buffer and added to the membrane, which was gently shaken overnight at 4°C. After washing three times with TBST, the membrane was immersed in horseradish peroxidase-conjugated secondary antibody diluted in blocking buffer for 1 hour at room temperature and then washed with TBST. Washed membranes were visualized with a chemiluminescence kit (PerkinElmer Inc.).
Cell survival assay
Cell survival ratios were determined by means of the 3-(4,5-dimethylthiazol-2-yl)-5-(3-carboxymethoxyphenyl)-2-(4-sulfophenyl)-2H-tetrazolium, inner salt (MTS) assay after a specified incubation time, as follows: a mixture of RPMI 1640, MTS (Promega Corporation, Fitchburg, WI, USA), and phenazine methosulfate (PMS) (Sigma-Aldrich Co., St Louis, MO, USA) in the ratio 8:2:0.1 was added to each well of drug-treated cells, and the cells were incubated for 60 minutes at 37°C. Absorbance at 490 nm was measured with a PowerWaveX microplate scanning spectrophotometer (Bio-Tek Instruments, Winooski, VT, USA), and cell survival ratios were calculated by dividing the absorbance of the treatment group by that of the appropriate control group.
Cell adhesion assayed by iCELLigence
The iCELLigence cell-based assay system (ACEA Biosciences, Inc., San Diego, CA, USA) uses impedance to monitor cellular processes. Both cell adhesion and duplication are measurable, and recorded cell activities are converted to a cell index (CI) by the system calculation.13,14 PC9 and H1975 cells were loaded into an E-Plate L8 (ACEA Biosciences, Inc.) at 1.2×10⁴ and 7.5×10³ cells/well, respectively, since the H1975 cells were larger and flatter than PC9 cells. After preculture for 24 hours, the cells were treated with DMSO (control), dasatinib, afatinib (H1975 cells) or gefitinib (PC9 cells), and a dasatinib/afatinib or dasatinib/gefitinib combination, and CI was recorded for 72 hours at 5-minute intervals for the first 24 hours and then at 30-minute intervals till the end of the measurement period. At the same time, with the assay of iCELLigence, replica plates of cells were seeded at the same cell density into 96-well plates, and cells were treated by the drug combination as that in E-Plate L8. At 24 hours, 48 hours, and 72 hours after drug treatment, cell viability in 96-well plates was determined by MTS assay. The cell adhesion index was calculated as CI divided by the cell density in the replica plate.
Flow cytometry apoptosis assay
PC9 cells were seeded in six-well plates and cultured overnight. The treatment drugs were diluted in the culture medium at the desired concentration and added to the wells of the plates. After incubation, the cells were trypsinized, washed with PBS, and resuspended in the binding buffer (0.01 M HEPES at pH 7.4, 0.14 M NaCl, and 2.5 mM CaCl2) on ice. Annexin V-FITC (BD Pharmingen, San Diego, CA, USA) and propidium iodide (Sigma-Aldrich Co.) were used as stains. The cell samples were analyzed with a FACSCalibur cell analyzer (BD Biosciences, San Jose, CA, USA), and apoptosis ratios were determined with the CellQuest Pro software (BD Biosciences).
Results
Adhesion response was rapidly enhanced in gefitinib-treated drug-sensitive NSCLC cells (PC9 cells)
To observe the immediate responses of EGFR TKI-sensitive NSCLC cells upon encountering an EGFR TKI, we used time-lapse microscopy to record the morphology of PC9 cells upon gefitinib treatment (Video S1). As can be seen in the video, in the absence of gefitinib the cells displayed both rounded-up and epithelial-like cell morphologies. However, within 12 hours of the addition of gefitinib to the culture medium, the cells stopped their scanning motion, spread onto the culture surface, and extended their front edges (Figure 1, 12 hours). After exposure to gefitinib for 72 hours, the cells showed clear signs of cell death and diminished cell density (Figure 1, 72 hours). To elucidate the signal transduction pathways involved in this morphology change, we analyzed the gene expression profile of gefitinib-treated PC9 cells by means of microarray and pathway analyses.
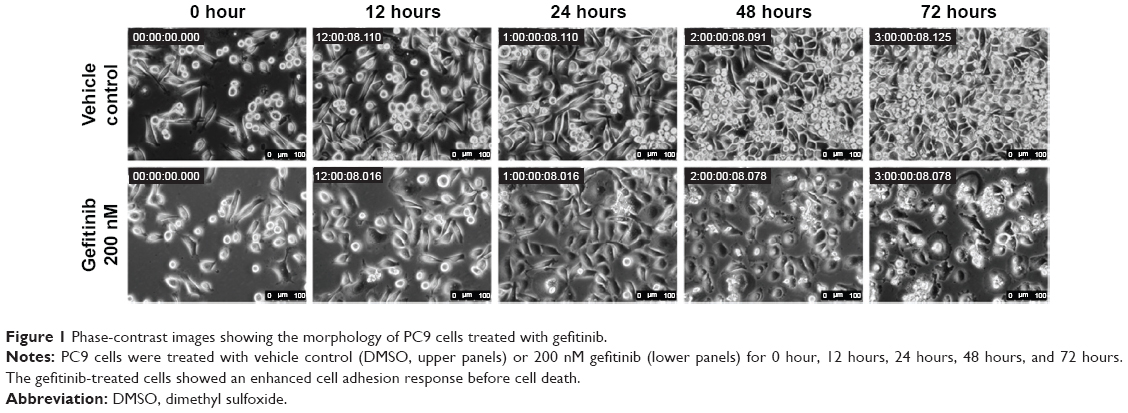 | Figure 1 Phase-contrast images showing the morphology of PC9 cells treated with gefitinib. |
Adhesion-related pathways predominated in the GSEA results
We drew a box-and-whisker diagram (Figure S1) to identify the outliers by gene expression fold change. Approximately 25.4% (4,989/19,646) of the genes were differentially expressed between gefitinib-treated and parental PC9 cells (2,543 upregulated genes; and 2,446 downregulated genes). The upregulated and downregulated genes are listed in Table S1. To elucidate the signaling pathways that might be associated with the change to a more adherent morphology, we harvested the total mRNA from gefitinib-treated PC9 cells, analyzed the mRNA by means of a human gene expression microarray, and then conducted GSEA using the KEGG canonical pathways as the gene set database. The results showed that 38 KEGG canonical pathways were significantly enhanced (false discovery rate <0.25, indicating that the result is likely to be valid three out of four times) (Table S2). Out of the 38 KEGG pathways, five were related to the enhanced adhesion morphology change including the top-ranked cell adhesion molecules. Thus, we considered the five pathways related to cell adhesion (Table 1) for further analysis. In a previous study, proteins relevant to cell adhesion were demonstrated to support cell survival in cancer drug therapy,15,16 and consistent with this, our results, for the first time, showed that the focal adhesion pathway was significantly upregulated by treatment with gefitinib (normalized enrichment score, 1.45; P=0.004; false discovery rate, 0.11; Table 1 and Figure 2). According to the GSEA algorithm, the highest scoring genes in the core enrichment set contribute to the enrichment score and dominate the pathway. The KEGG canonical focal adhesion pathway is shown in Figure 2, and the 56 core enrichment genes are shown in Table S3, along with their enrichment scores. An uninterrupted path from the extracellular matrix (ECM) to integrin to Src (ECM → integrin → Src) was observed at the very beginning of the focal adhesion pathway; so we speculated that this path initiated the cells’ quick adhesion response to EGFR TKI treatment. On the basis of this speculation, we considered the proteins FN1, ITGAV, ITGB1, and Src to be the keys to the emergency adhesion response to temporarily combat EGFR TKI-induced stress.
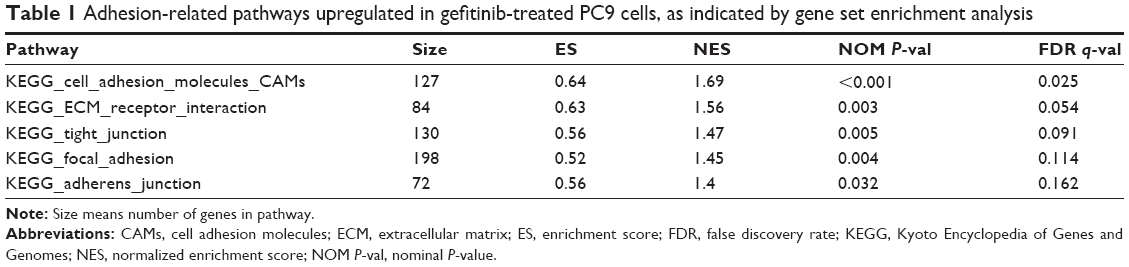 | Table 1 Adhesion-related pathways upregulated in gefitinib-treated PC9 cells, as indicated by gene set enrichment analysis |
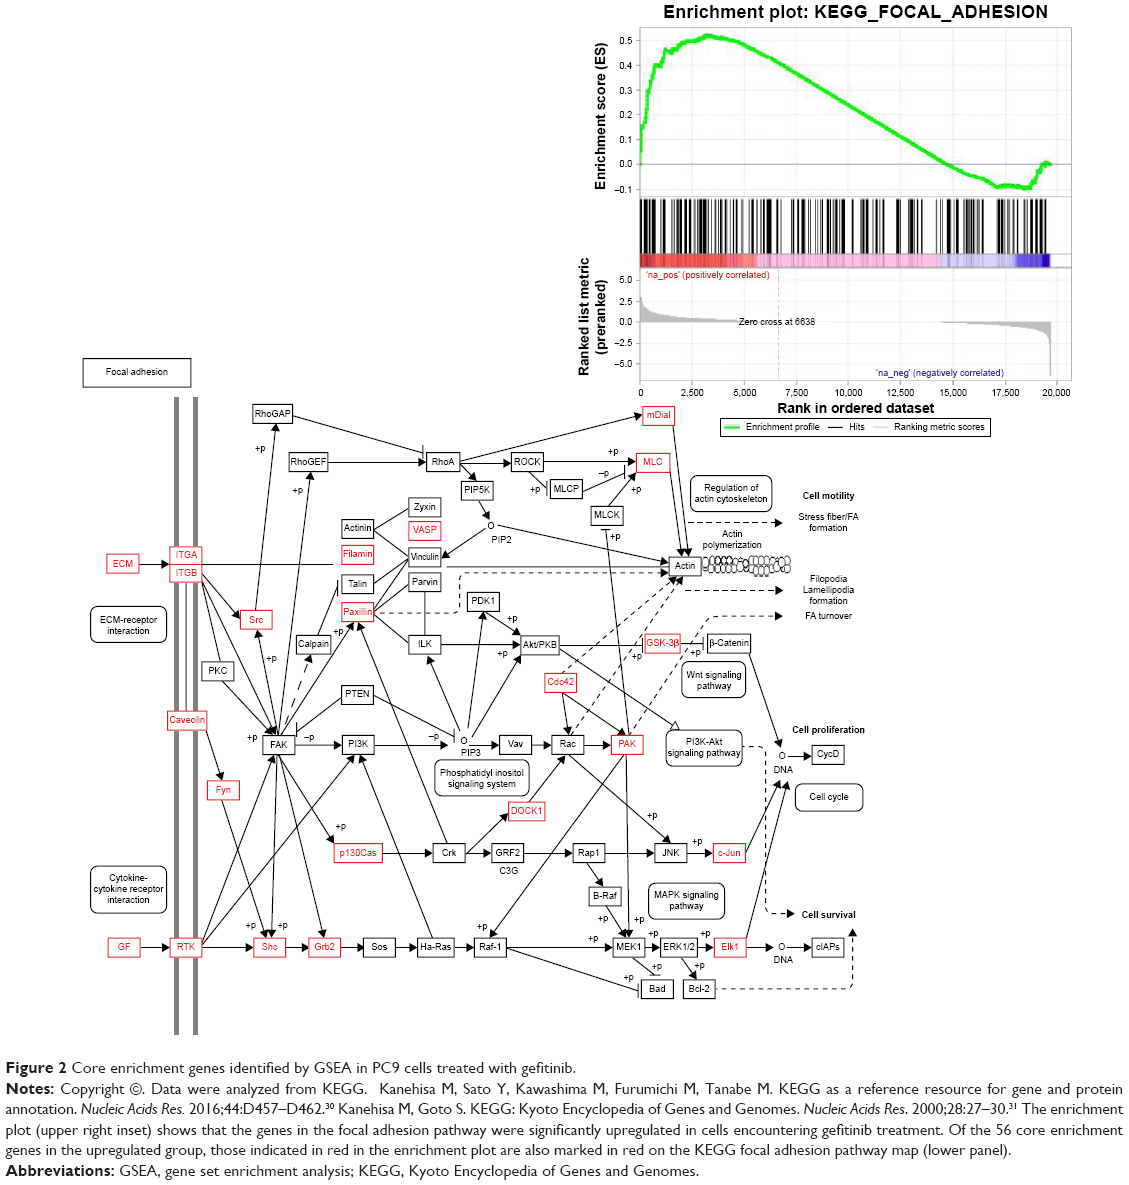 | Figure 2 Core enrichment genes identified by GSEA in PC9 cells treated with gefitinib. |
Time course of adhesion-related molecules mRNA and proteins in EGFR TKI-treated PC9 and H1975 cells
More detailed molecular analyses were performed to examine the changes with time of the relevant mRNA and the corresponding proteins. First, we analyzed the mRNA levels of FN1, ITGAV, ITGB1, Src, and FAK in PC9 cells after gefitinib treatment for 24 hours, 48 hours, and 72 hours. The results are shown in Figure 3A. Basically, at 24 hours, all the levels of the mRNAs for the five genes remained unchanged. At 48 hours, the gene expression levels went up by ~13.1-, 2.1-, 2.0-, 2.4-, and 1.3-fold for FN1, ITGAV, ITGB1, Src, and FAK, respectively. At 72 hours, the expression levels remained similar to those at 48 hours (Figure 3A).
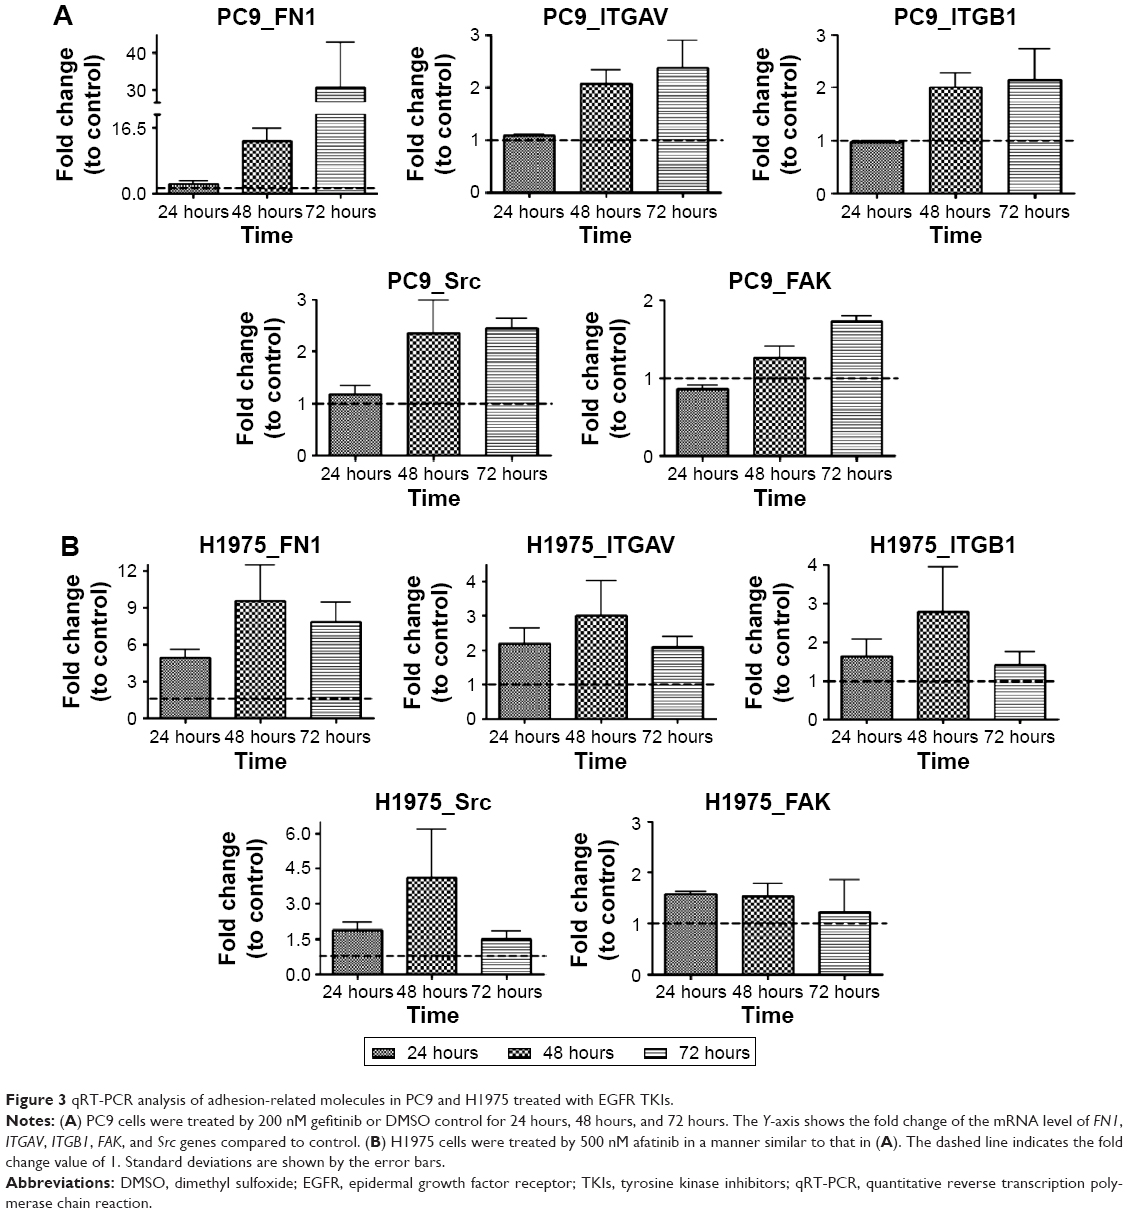 | Figure 3 qRT-PCR analysis of adhesion-related molecules in PC9 and H1975 treated with EGFR TKIs. |
The mRNA levels of FN1, ITGAV, ITGB1, Src, and FAK in H1975 cells after afatinib treatment for 24 hours, 48 hours, and 72 hours were also analyzed, and the results are shown in Figure 3B. The levels of the mRNAs for the five genes started to increase after 24 hours of drug treatment. At 48 hours, the gene expression levels went up by ~9.6-, 3.0-, 2.8-, 4.1-, and 1.5-fold for FN1, ITGAV, ITGB1, Src, and FAK, respectively. At 72 hours, the expression levels of FN1 and ITGAV remained similar to those at 48 hours. However, the mRNA levels of ITGB1, Src, and FAK seemed similar to those at 24 hours. Overall, these results are congruent with the microarray data, which indicate that PC9 and H1975 cells exert quick adhesion responses upon EGFR TKI treatments.
Changes in mRNA levels within a shorter interval (2 hours, 6 hours, and 12 hours) of FN1, ITGAV, ITGB1, Src, and FAK in the drug-treatment groups were also monitored. The gene expression levels did not change much before 12 hours (Figure S2) despite their obvious increase after 48 hours of drug treatment in PC9 and H1975 cells. The mRNA levels of these adhesion-related genes even showed a slight decrease at early times, ie, 6 hours in PC9 and 2 hours in H1975 cells, and then recovered after 12 hours. In Figure 3, after 24 hours, 48 hours, and 72 hours, the expression levels of these adhesion genes continued to increase in PC9 cells or remained stable in H1975 cells. These results indicated that 72 hours is a suitable sampling time point for pathway analysis in PC9 cells. Such dynamic expression regulation has been described in many previous reports17; while including the rate of protein degradation and mRNA stability, the mRNA levels would not always perfectly correlate with the protein levels.18
In addition to the time-lapse video, microarray data, and qRT-PCR mRNA analyses, the protein levels were also examined for FN1, ITGAV, ITGB1, Src, and FAK in PC9 or H1975 cells treated with gefitinib or afatinib, respectively, for 24 hours, 48 hours, and 72 hours. The results are shown in Figure 4.
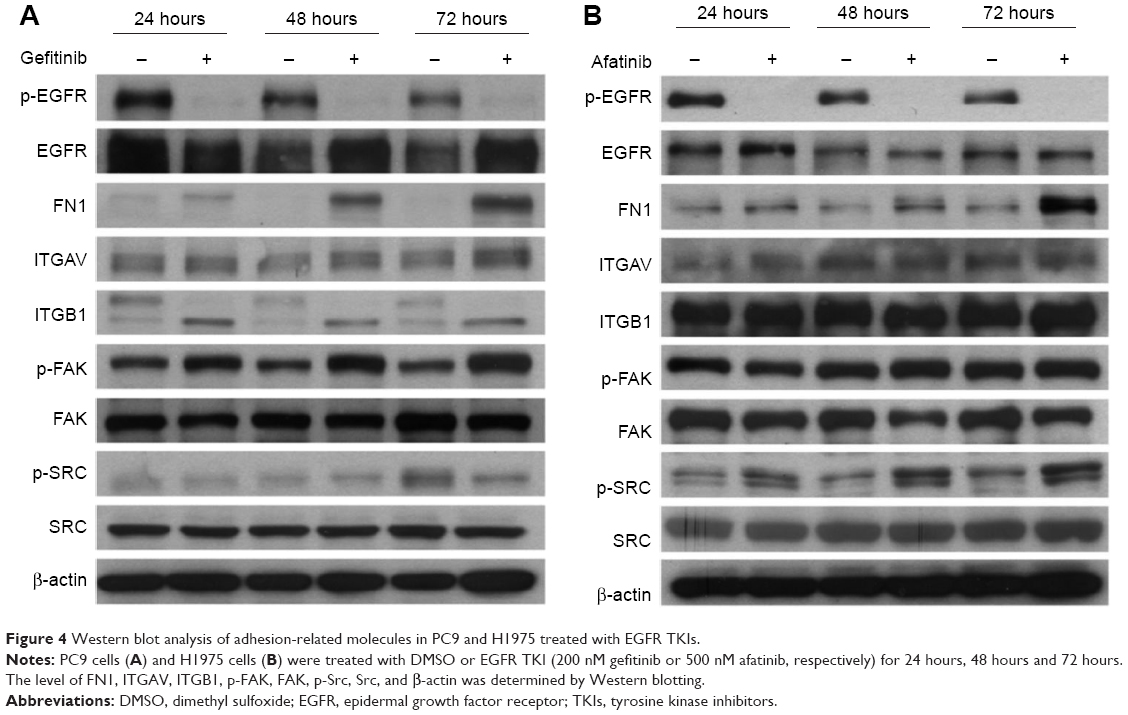 | Figure 4 Western blot analysis of adhesion-related molecules in PC9 and H1975 treated with EGFR TKIs. |
In both cell lines, the protein levels of FN1 were enhanced in TKI-treated cells in a time-dependent manner. The ITGAV protein levels were not affected by TKI in both cells. The pattern of changes of the other proteins differed in these two cells. First, there was an apparent shift from high molecular weight (130 kDa) ITGB1 to a form of lower molecular weight (115 kDa) isoform. In a previous study, it was reported that in ITGB1 two bands could be observed in some cells; they were specified as a 115 kDa partially glycosylated precursor and a 130 kDs fully glycosylated mature form.19,20 Second, p-FAK was not affected by TKI in H1975 cells but was slightly enhanced in PC9 cells treated with gefitinib. Third, the p-Src levels were enhanced in afatinib-treated H1975 cells. In nontreated PC9 cells, the p-Src level went up at 72 hours after cell passage, possibly due to the fact that cells were already confluent, as suggested by Kobayashi et al.21 Under such circumstances, the p-Src level in gefitinib-treated PC9 cells was not higher than that in control cells.
RNA interference enhanced cytotoxic effects of gefitinib in PC9 cells and weakened the emergency adhesion response
To investigate the mechanism of the cell adhesion response to gefitinib treatment, we used shRNAs to downregulate the expression of FN1, ITGAV, ITGB1, and Src mRNA in PC9 cells. After shRNA transfection and a short recovery period in the growth medium, the cells were treated with gefitinib. Cell survival analysis and flow cytometry apoptosis assays were performed to estimate the cytotoxic efficacy of gefitinib after gene silencing. After normalization with respect to control shRNA, the survival ratio was found to be significantly decreased in cells in which the two integrins (ITGAV and ITGB1) and the downstream kinase (Src) had been silenced (Figure 5A). The Annexin V-FITC/propidium iodide apoptosis assay, which was performed to determine whether apoptosis was responsible for the cell death, revealed that compared with cells transfected with the control shRNA, the cells in which ITGAV, ITGB1, and Src were downregulated demonstrated a clear increase in the apoptotic cell population (Figure 5B). In contrast to the silencing of the integrins and Src, silencing of FN1 resulted in only a limited enhancement of the cytotoxic effects of gefitinib (Figure 5A and B). These results suggest that PC9 cells could tolerate gefitinib when the adhesion pathway was functional, whereas the cells became extremely vulnerable to gefitinib after this cell adhesion lifeline was cut by the downregulation of the emergency adhesion-related proteins ITGAV, ITGB1, and Src.
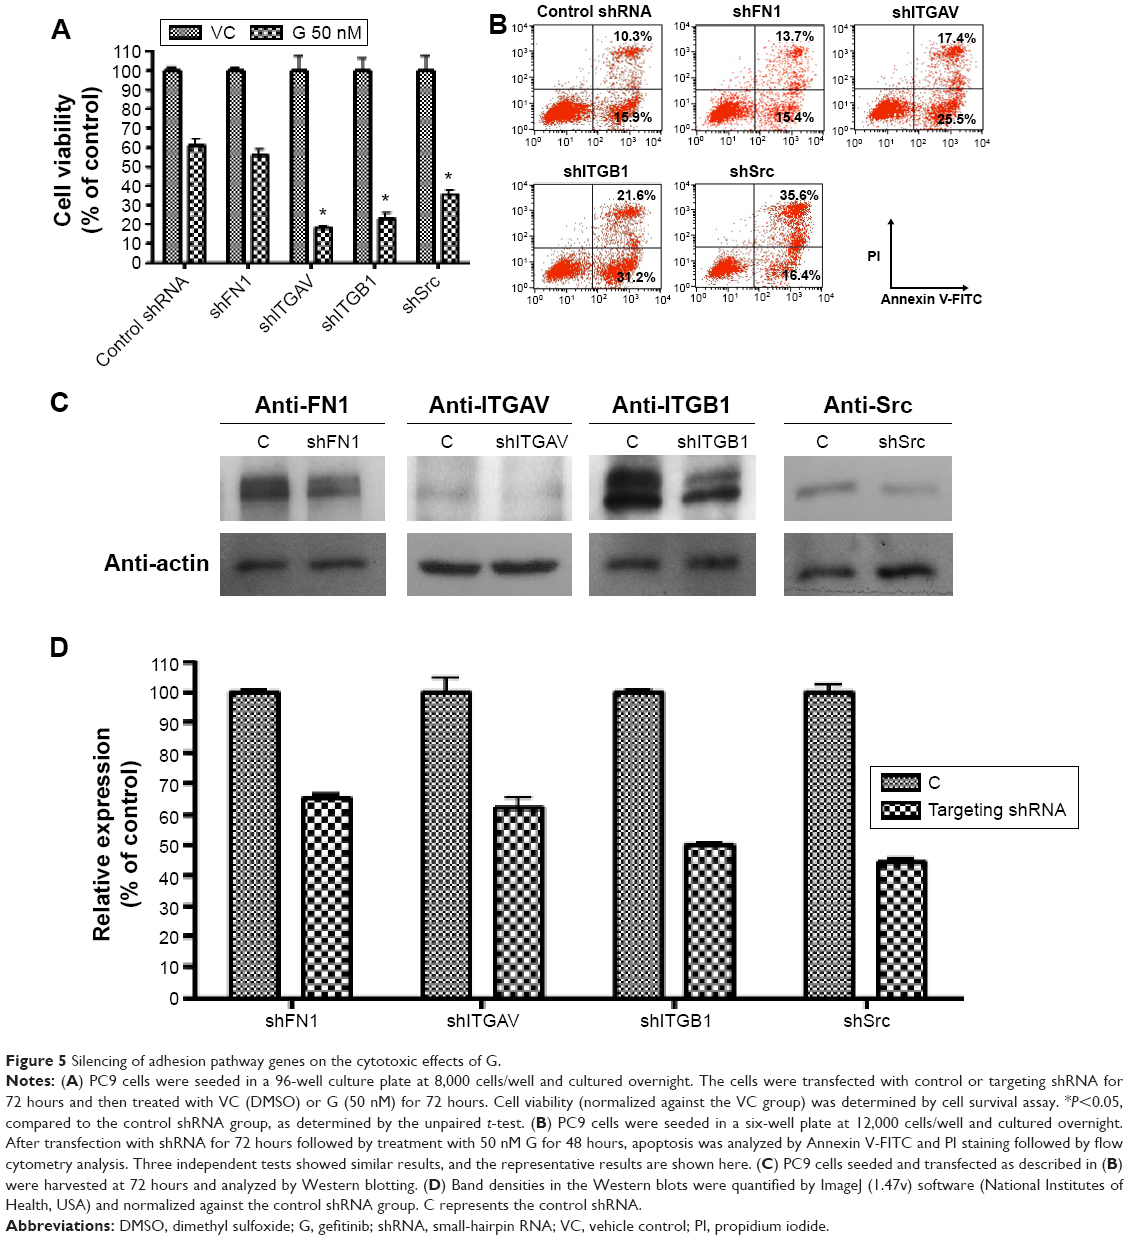 | Figure 5 Silencing of adhesion pathway genes on the cytotoxic effects of G. |
The protein levels of FN1, ITGAV, ITGB1, and Src in shRNA-transfected PC9 cells were monitored by Western blotting 48 hours after transfection (Figure 5C), and protein expression relative to that after treatment with control shRNA was estimated from the density (Figure 5D). Although the results of silencing had a dramatic effect on the efficacy of subsequent gefitinib treatment, the protein levels were only somewhat reduced in the shRNA-treated cells (FN1 65.4%±1.3%, ITGAV 62.0%±4.5%, ITGB1 50.1%±0.3%, and Src 44.3%±1.3%).
PC9 and H1975 cells were vulnerable to EGFR TKIs when the adhesion response was compromised by means of a Src family inhibitor or integrin inhibitors
To monitor in real time the consequences of interrupting the adhesion response of NSCLC cells upon treatment with EGFR TKIs, we treated PC9 and H1975 with the Src family inhibitor dasatinib, either alone or in combination with an EGFR TKI (gefitinib for the PC9 cells and afatinib for the H1975 cells). Then, we recorded cell activity using the iCELLigence system, which uses impedance changes in the culture surface for continuous and real-time measurement of cellular events. Data were transformed into CI values, which are positively correlated to cell occupancy of the culturing surface.13,22 Furthermore, the CI values were normalized by cell density to obtain cell adhesion index. The cell adhesion index described in this study reflects the cell’s adhesion ability. In PC9 or H1975 cells, treated respectively with gefitinib or afatinib, the CI values and cell adhesion index of both cells rose rapidly (within 4 hours; Figure 6A, B, E, and F), suggesting that the adhesion response was activated within hours. These iCELLigence results were in agreement with the time-lapse microscopy observations. It is interesting to note that in Figure 6B, the difference between VC (vehicle control) and A (afatinib treatment) was not as obvious as in Figure 6A. However, the cell adhesion index increased dramatically after afatinib was added into H1975 cells. In contrast to treatment with the EGFR TKIs, treatment with dasatinib resulted in a significant decrease in CI immediately after the drug was added to the cell culture medium. Although dasatinib rapidly and significantly suppressed the cells’ adhesion ability, both PC9 and the H1975 cells continued to proliferate under the adhesion-interfered condition (Figure 6C and D). However, treatment with a combination of dasatinib and an EGFR TKI (gefitinib or afatinib) resulted not only in a dramatic decrease in CI but also in a decrease in the viability of cells (Figure 6A–D). Interestingly, as shown in Figure 6E group GD, quick and severe cell death in the group of PC9 cells treated by gefitinib + dasatinib rendered an immediate drop of the cell adhesion index at the very beginning of drug treatment. The cell adhesion index started to show a rising trend after 24 hours, indicating that only the cells with strong adhesion ability still remained in the chamber.
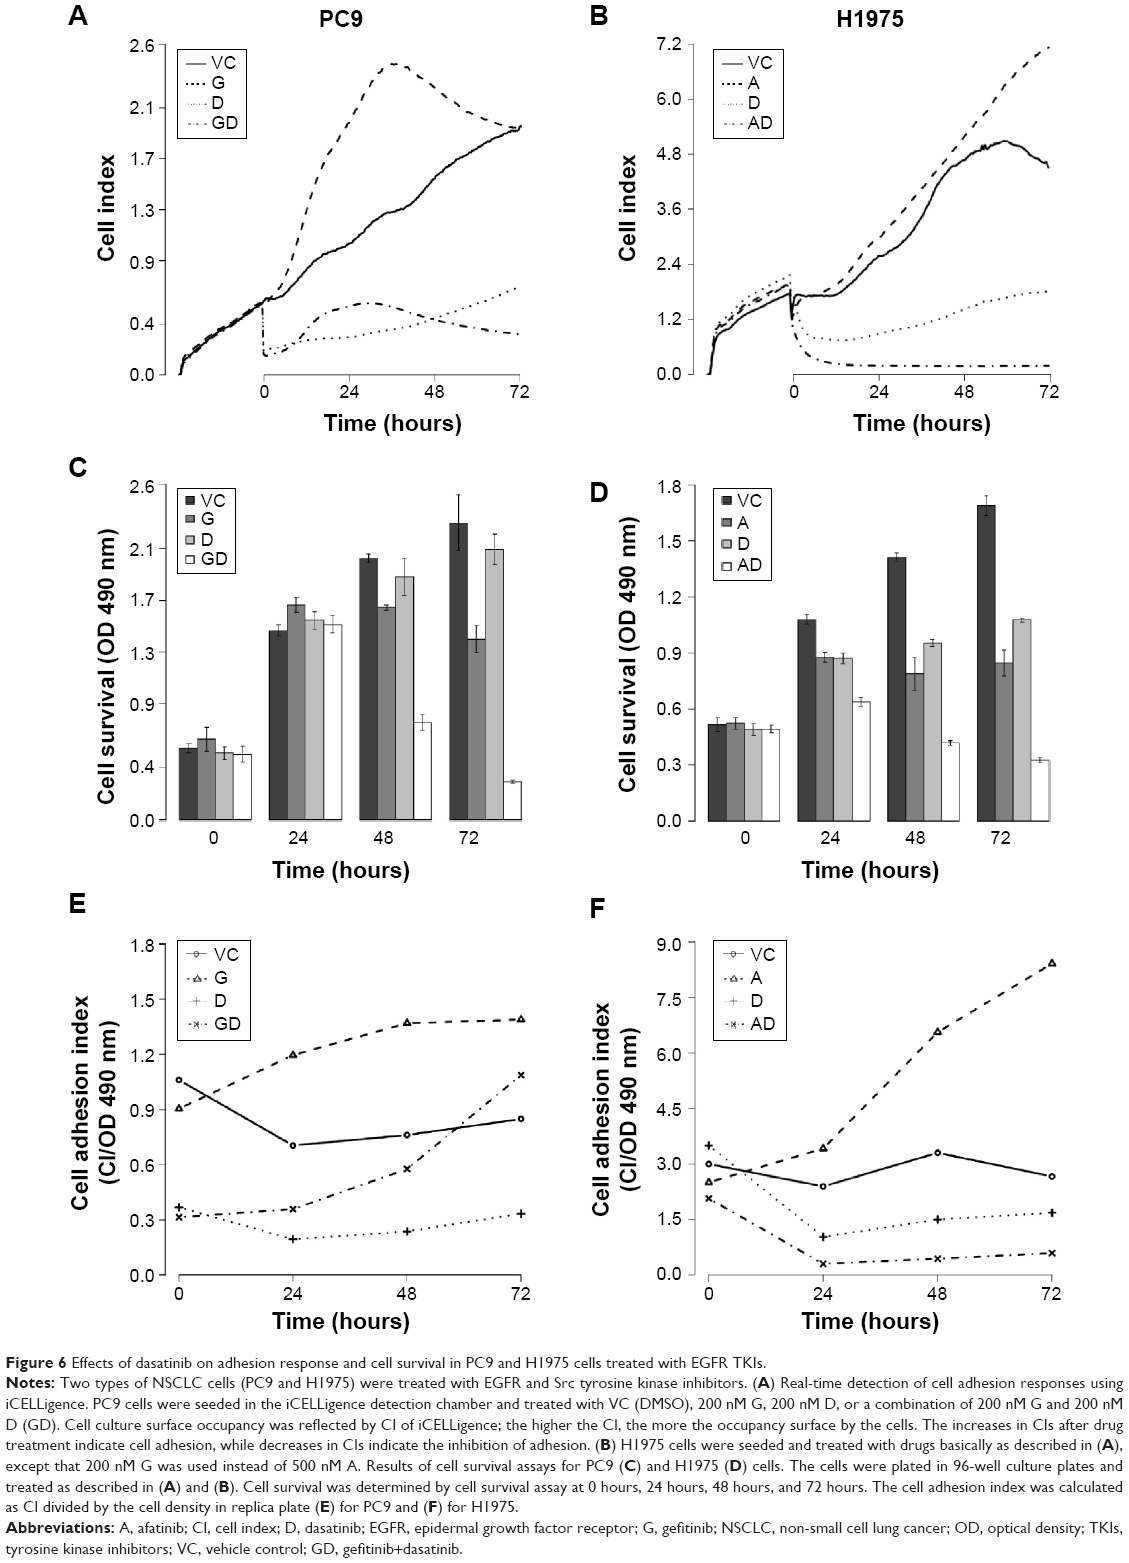 | Figure 6 Effects of dasatinib on adhesion response and cell survival in PC9 and H1975 cells treated with EGFR TKIs. |
After the addition of dasatinib to the culture medium, the PC9 cells were rounded up, and the H1975 cells were pulling back their cell edges; but the drug did not stop cell proliferation (Figure 7). A time-lapse video showed that the H1975 and PC9 cells shrank or detached and underwent cell death upon treatment with a combination of dasatinib and afatinib (Video S2 for H1975 and Video S3 for PC9). That is, these NSCLC cells became extremely vulnerable when the emergency adhesion response was attenuated by dasatinib treatment, and EGFR TKI efficacy increased dramatically.
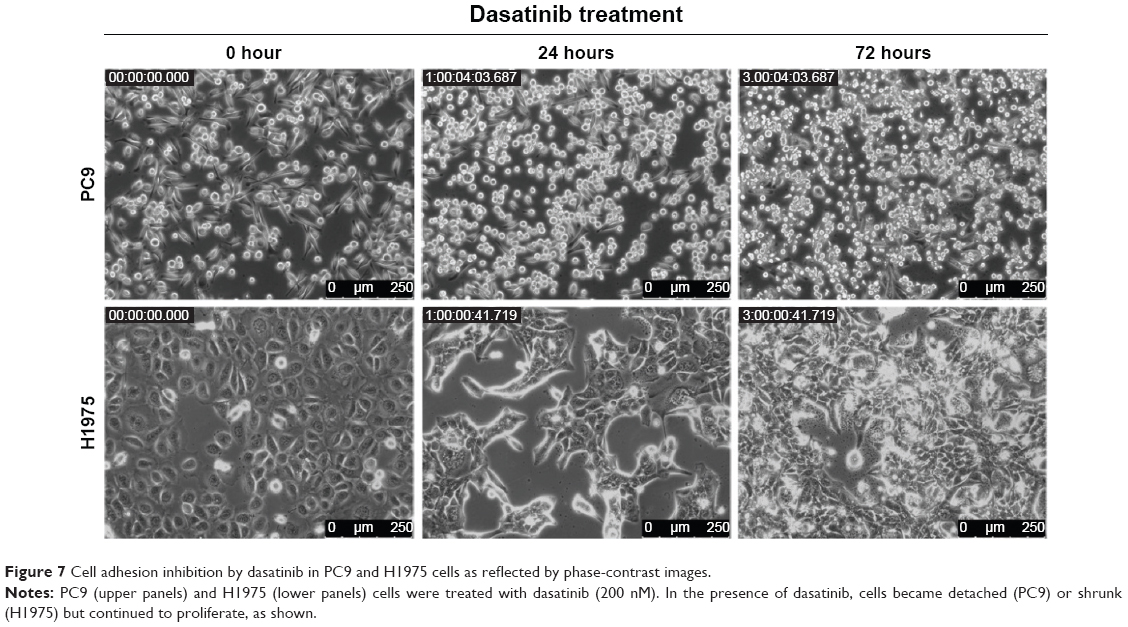 | Figure 7 Cell adhesion inhibition by dasatinib in PC9 and H1975 cells as reflected by phase-contrast images. |
Two different integrin inhibitors, c89 and ci,23 were employed to further investigate whether inhibition of cell adhesion would synergize with EGFR TKIs to suppress proliferation of PC9 or H1975 cells. The results are shown in Figure 8. In both cells, either c8 or ci was able to potentiate the efficacy of TKIs.
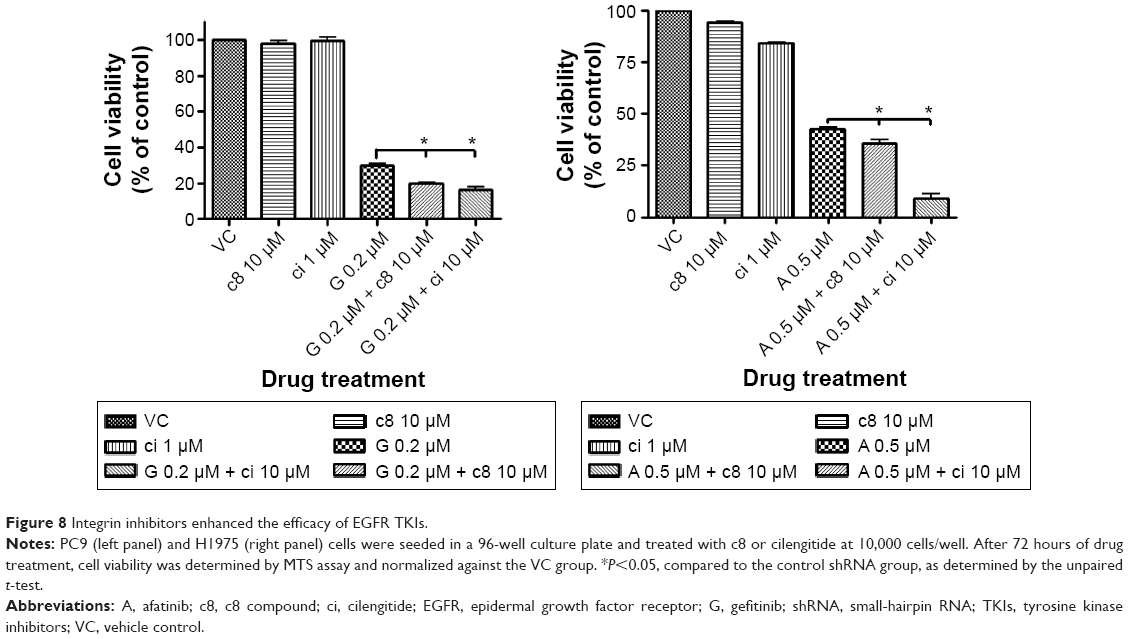 | Figure 8 Integrin inhibitors enhanced the efficacy of EGFR TKIs. |
Discussion
The ability to mount stress responses is essential for cells to defend against temporary noxious environmental stimuli.24 Without such responses, cells become vulnerable to adverse conditions, such as the presence of toxic chemicals, unsuitable temperature, improper osmolarity, and nutrient shortages. In this study, we investigated the response of NSCLC cells to treatment with EGFR-targeting drugs and made the following observations. First, PC9 cells quickly adopted a more adherent morphology upon exposure to gefitinib, as shown by time-lapse microscopy. This morphologic change correlated well with the results of gene expression analysis, which indicated that the cell adhesion-related pathways were enhanced. Second, GSEA analysis of the core enriched genes in the focal adhesion pathway revealed a plausible sequential signaling cascade: ECM → integrin → Src family, including Fyn and Src. Third, the importance of the aforementioned pathway in the cells’ defense against EGFR TKIs was supported by the fact that the effects of EGFR TKIs in suppressing NSCLC cell proliferation could be potentiated by 1) genetic silencing of two integrins (ITGAV and ITGB1), 2) pharmacological inhibition of integrins by c8 or ci, and 3) pharmacological inhibition of the Src family kinase by dasatinib. To conclude that cell adhesion is a defense response induced by EGFR TKI, we have also shown that this response is not merely a gefitinib response, since H1975 cells with the T790M mutation in EGFR and treated with gefitinib did not show any adhesion responses (Video S4). Taken together, these results indicate that NSCLC cells could temporarily escape the cell-killing pressure of EGFR TKIs by immediately activating an adhesion-related response.
Dasatinib was first used as a BCR-Abl kinase inhibitor for leukemia therapeutics. To distinguish whether the BCR-Abl inhibition activity of dasatinib contributes to the synergistic effect with gefitinib, another BCR-Abl kinase inhibitor, imatinib, alone or in combination with gefitinib, was added into PC9 cells for 3 days, and cell survival assay was performed. Imatinib did not show any effect on the viability of PC9 cells under different conditions, as shown in Figure S2. Parsons and Parsons25 have reviewed the Src family kinase as a key regulator involved in cell adhesion and cell–cell contact signal transduction. It is possible that dasatinib achieves its adhesion-inhibition effects through simultaneously targeting Src family kinases including Src or Fyn.
Song et al26 have previously reported that dasatinib could selectively induce apoptosis in EGFR-dependent lung cancer cells, including PC9, HCC827, H3255, and H1650. The EGFR-independent cells, such as A549, H1299, H460, and H358, showed more tolerance to dasatinub. H1975, deemed as an EGFR-dependent cell line, appeared insensitive to dasatinib only. In this study, the cell adhesion of H1975 cells was significantly inhibited by dasatinib, but the cells were still alive and continued to replicate (Figure 6B and D). Only after combining with afatinib did the H1975 cells show significant cell death results (Figure 6D). Although FN1 seemed to be unambiguously upregulated after EGFR TKI treatment, as indicated by microarray and Western blot analyses, gene silencing of FN1 did not affect the cytotoxic effects of EGFR TKIs. It is likely due to the fact that gene silencing only partially reduced the overexpressed FN1. Several clinical studies with the combination of EGFR TKI and dasatinib have been performed, but with only modest efficacy.27,28 In a Phase II clinical study, dasatinib was shown to have no activity in patients with acquired resistance treated with erlotinib or gefitinib.29 In this study, we found that dasatinib, when used alone, dramatically reduced the adhesion ability of NSCLC cells and slowed down the cell proliferation rate. However, the cells were still viable and continued to replicate (Figures 6 and 7). In contrast, when dasatinib was employed in combination with an EGFR TKI at the very beginning of treatment, the anticancer effects of the latter were greatly potentiated.
Conclusion
In conclusion, our results suggest that NSCLC cells can quickly and temporarily escape the cytotoxic effects of EGFR-targeting drugs by mounting an immediate adhesion-related response. Thus, as demonstrated in this study, inhibition of this response could maximize the efficacy of targeted therapeutics. Results from this study warrant further investigation aimed at the development of an inhibitor of the focal adhesion pathway to facilitate anti-NSCLC treatment. It will also be very interesting to determine whether dasatinib can provide benefit to patients with EGFR-mutant NSCLC when administered together with gefitinib or afatinib from the very beginning of treatment.
Acknowledgments
The authors thank Dr William F DeGrado, University of California, San Francisco, who kindly provided the c8 compound. We also thank the DNA Sequencing Core Lab, Microarray Core Lab, and Optical Biology Core Lab of NHRI Core Instrument Center for their support. This study was supported by grants from the Ministry of Science and Technology (NSC 102-2325-B-400) and the National Health Research Institutes (BP-101-PP-01), Taiwan, Republic of China.
Disclosure
The authors report no conflicts of interest in this work.
References
Gazdar AF. Activating and resistance mutations of EGFR in non-small-cell lung cancer: role in clinical response to EGFR tyrosine kinase inhibitors. Oncogene. 2009;28(suppl 1):S24–S31. | ||
Kobayashi S, Boggon TJ, Dayaram T, et al. EGFR mutation and resistance of non-small-cell lung cancer to gefitinib. N Engl J Med. 2005;352(8):786–792. | ||
Pao W, Miller VA, Politi KA, et al. Acquired resistance of lung adenocarcinomas to gefitinib or erlotinib is associated with a second mutation in the EGFR kinase domain. PLoS Med. 2005;2(3):e73. | ||
Chong CR, Janne PA. The quest to overcome resistance to EGFR-targeted therapies in cancer. Nat Med. 2013;19(11):1389–1400. | ||
Bean J, Brennan C, Shih JY, et al. MET amplification occurs with or without T790M mutations in EGFR mutant lung tumors with acquired resistance to gefitinib or erlotinib. Proc Natl Acad Sci U S A. 2007;104(52):20932–20937. | ||
Engelman JA, Zejnullahu K, Mitsudomi T, et al. MET amplification leads to gefitinib resistance in lung cancer by activating ERBB3 signaling. Science. 2007;316(5827):1039–1043. | ||
Ogino A, Kitao H, Hirano S, et al. Emergence of epidermal growth factor receptor T790M mutation during chronic exposure to gefitinib in a non small cell lung cancer cell line. Cancer Res. 2007;67(16):7807–7814. | ||
Cortot AB, Repellin CE, Shimamura T, et al. Resistance to irreversible EGF receptor tyrosine kinase inhibitors through a multistep mechanism involving the IGF1R pathway. Cancer Res. 2013;73(2):834–843. | ||
Reed NI, Jo H, Chen C, et al. The alphavbeta1 integrin plays a critical in vivo role in tissue fibrosis. Sci Transl Med. 2015;7(288):288ra279. | ||
Tome M, Lopez-Romero P, Albo C, et al. miR-335 orchestrates cell proliferation, migration and differentiation in human mesenchymal stem cells. Cell Death Differ. 2011;18(6):985–995. | ||
Subramanian A, Tamayo P, Mootha VK, et al. Gene set enrichment analysis: a knowledge-based approach for interpreting genome-wide expression profiles. Proc Natl Acad Sci U S A. 2005;102(43):15545–15550. | ||
Kanehisa M, Goto S. KEGG: kyoto encyclopedia of genes and genomes. Nucleic Acids Res. 2000;28(1):27–30. | ||
Ge Y, Deng T, Zheng X. Dynamic monitoring of changes in endothelial cell-substrate adhesiveness during leukocyte adhesion by microelectrical impedance assay. Chin J Biochem Biophys. 2009;41(3):256–262. | ||
Atienza JM, Zhu J, Wang X, et al. Dynamic monitoring of cell adhesion and spreading on microelectronic sensor arrays. J Biomol Screen. 2005;10(8):795–805. | ||
Storch K, Cordes N. Focal adhesion-chromatin linkage controls tumor cell resistance to radio- and chemotherapy. Chemother Res Pract. 2012;2012:319287. | ||
Wu DW, Wu TC, Wu JY, et al. Phosphorylation of paxillin confers cisplatin resistance in non-small cell lung cancer via activating ERK-mediated Bcl-2 expression. Oncogene. 2014;33(35):4385–4395. | ||
Vogel C, Marcotte EM. Insights into the regulation of protein abundance from proteomic and transcriptomic analyses. Nat Rev Genet. 2012; 13(4):227–232. | ||
de Sousa Abreu R, Penalva LO, Marcotte EM, et al. Global signatures of protein and mRNA expression levels. Mol Biosyst. 2009;5(12):1512–1526. | ||
Bellis SL. Variant glycosylation: an underappreciated regulatory mechanism for beta1 integrins. Biochim Biophys Acta. 2004;1663(1–2):52–60. | ||
She S, Xu B, He M, et al. Nm23-H1 suppresses hepatocarcinoma cell adhesion and migration on fibronectin by modulating glycosylation of integrin beta1. J Exp Clin Cancer Res. 2010;29:93. | ||
Kobayashi S, Okumura N, Nakamoto T, et al. Activation of pp60c-src depending on cell density in PC12h cells. J Biol Chem. 1997;272(26):16262–16267. | ||
Jarvis GE, Bihan D, Hamaia S, et al. A role for adhesion and degranulation-promoting adapter protein in collagen-induced platelet activation mediated via integrin alpha(2) beta(1). J Thromb Haemost. 2012;10(2):268–277. | ||
Alghisi GC, Ponsonnet L, Ruegg C. The integrin antagonist cilengitide activates alphaVbeta3, disrupts VE-cadherin localization at cell junctions and enhances permeability in endothelial cells. PLoS One. 2009;4(2):e4449. | ||
Fulda S, Gorman AM, Hori O, et al. Cellular stress responses: cell survival and cell death. Int J Cell Biol. 2010;2010:214074. | ||
Parsons SJ, Parsons JT. Src family kinases, key regulators of signal transduction. Oncogene. 2004;23(48):7906–7909. | ||
Song L, Morris M, Bagui T, et al. Dasatinib (BMS-354825) selectively induces apoptosis in lung cancer cells dependent on epidermal growth factor receptor signaling for survival. Cancer Res. 2006;66(11):5542–5548. | ||
Haura EB, Tanvetyanon T, Chiappori A, et al. Phase I/II study of the Src inhibitor dasatinib in combination with erlotinib in advanced non-small-cell lung cancer. J Clin Oncol. 2010;28(8):1387–1394. | ||
Gold KA, Lee JJ, Harun N, et al. A phase I/II study combining erlotinib and dasatinib for non-small cell lung cancer. Oncologist. 2014;19(10):1040–1041. | ||
Johnson ML, Riely GJ, Rizvi NA, et al. Phase II trial of dasatinib for patients with acquired resistance to treatment with the epidermal growth factor receptor tyrosine kinase inhibitors erlotinib or gefitinib. J Thorac Oncol. 2011;6(6):1128–1131. | ||
Kanehisa M, Sato Y, Kawashima M, Furumichi M, Tanabe M. KEGG as a reference resource for gene and protein annotation. Nucleic Acids Res. 2016;44:D457–D462. | ||
Kanehisa M, Goto S. KEGG: Kyoto Encyclopedia of Genes and Genomes. Nucleic Acids Res. 2000;28:27–30. |
 © 2016 The Author(s). This work is published and licensed by Dove Medical Press Limited. The full terms of this license are available at https://www.dovepress.com/terms.php and incorporate the Creative Commons Attribution - Non Commercial (unported, v3.0) License.
By accessing the work you hereby accept the Terms. Non-commercial uses of the work are permitted without any further permission from Dove Medical Press Limited, provided the work is properly attributed. For permission for commercial use of this work, please see paragraphs 4.2 and 5 of our Terms.
© 2016 The Author(s). This work is published and licensed by Dove Medical Press Limited. The full terms of this license are available at https://www.dovepress.com/terms.php and incorporate the Creative Commons Attribution - Non Commercial (unported, v3.0) License.
By accessing the work you hereby accept the Terms. Non-commercial uses of the work are permitted without any further permission from Dove Medical Press Limited, provided the work is properly attributed. For permission for commercial use of this work, please see paragraphs 4.2 and 5 of our Terms.