")
Back to Journals » International Journal of General Medicine » Volume 14
Non-Invasive Prediction of Coronary Artery Disease by Multiple Abdominal Fat and Anthropometric Indices: Revisit
Authors Hazem M, Ezzat M, Elsamman MK, AlYahya A, Alam-Eldeen MH
Received 1 December 2020
Accepted for publication 15 January 2021
Published 9 February 2021 Volume 2021:14 Pages 387—398
DOI https://doi.org/10.2147/IJGM.S294331
Checked for plagiarism Yes
Review by Single anonymous peer review
Peer reviewer comments 2
Editor who approved publication: Dr Scott Fraser
Mohammed Hazem,1,2 Mohamed Ezzat,3 Mahmoud Elsamman,4 Abdulwahab AlYahya,1,5 Mohamad Hasan Alam-Eldeen2
1Department of Surgery, College of Medicine, King Faisal University, Al-Ahsa, 31982, Saudi Arabia; 2Department of Radiology, Faculty of Medicine, Sohag University, Sohag, Egypt; 3Cardiology Division, Internal Medicine Department, Faculty of Medicine, Sohag University, Sohag, Egypt; 4Gastroenterology Division, Internal Medicine Department, Faculty of Medicine, Sohag University, Sohag, Egypt; 5Radiology Department, Polyclinic Center, King Faisal University, Al-Ahsa, 31982, Saudi Arabia
Correspondence: Mohammed Hazem Tel +0966562426860
Email [email protected]
Purpose: The aim of this study was to evaluate the efficiency of multiple abdominal fat indices measured by ultrasound and anthropometric indices to predict the presence and severity of coronary artery disease (CAD) assessed by coronary angiography.
Patients and Methods: All participants subjected to clinical and laboratory assessments. Anthropometric measurements were taken followed by an ultrasound examination to measure fat thickness at multiple abdominal areas. Lastly, selective coronary angiography performed by the Judkins technique. Statistical analysis was performed to detect the association between all variables and CAD, followed by regression analysis, and Odds ratio (OR) was used to quantifies the strength of the association between two events.
Results: From the abdominal indices, the posterior right perinephric fat thickness (PRPFT) above the best cutoff value had the highest hazard ratio (HR: 12.3, p = 0.001), followed by visceral adipose tissue volume (VAT) (HR: 10.7, p < 0.001), waist circumference (WC) (HR: 6.7, p = 0.001), visceral fat thickness (VFT) (HR: 5.7, p = 0.002), and body mass index (BMI) (HR: 5.48, p = 0.017). It also showed an independent association between the severity of CAD and WC (HR: 4.28, p = 0.012), VFT (HR: 3.7, p = 0.032), VAT (HR: 3.7, p = 0.034), and waist to height ratio (WHtR) (HR: 3.3, p = 0.033).
Conclusion: Posterior perinephric fat thickness and visceral adipose tissue volume measured by ultrasound are strong noninvasive predictors for coronary artery disease, followed by body mass index, waist circumference and visceral fat thickness.
Keywords: posterior perinephric fat, abdominal fat thickness, abdominal ultrasound, anthropometric measurements, coronary artery disease
Plain Language Summary
In this paper, we studied the association between nearly all reported abdominal fat and anthropometric indices as a predictor for the presence and severity of coronary artery disease, we collected most of the indices in one work and we added a cutoff value for every index to accurately determine the association and strength of each index as a predictor to the presence and severity of coronary artery disease with subsequent select patients in risk to perform coronary artery angiography and protect another group of patients from performing coronary artery angiography.
We found in this study variation between all indices as a non-invasive predictor for coronary artery disease, from all indices posterior perinephric fat tissue thickness and visceral adipose tissue volume measured by ultrasound are strong predictors for coronary disease followed by body mass index, waist circumference, and visceral fat thickness. While waist circumference, waist-height ratio, visceral tissue thickness, and visceral adipose tissue volume are noninvasive good predictors for severity of coronary artery disease.
To the best of our knowledge, all these noninvasive indices are not included together in any research before in addition to the use of the best cutoff value determined by ROC curve analysis for each index to study the strength of each predictor.
Introduction
Obesity is a widespread disease constituting a worldwide problem and is responsible for metabolic complications and increases the risk of cardiovascular diseases (CVDs)1 that are considered one of the major causes of mortality and morbidity across the world.2 The most important metabolic complications related to obesity include dyslipidemia, glucose intolerance, hyperinsulinemia, hypertension, and atherosclerosis, all of which significantly increase the risk of developing CVDs.3
Adipose tissue distribution may have different impacts on progression of coronary artery disease (CAD). There was association between noncalcified coronary plaque, plaque morphology and abdominal visceral adipose tissue.4 As well as measurement of visceral adiposity by multislice computed tomography showed significantly associated with the presence and extent of calcium deposition in coronary artery which is considered a marker of subclinical atherosclerosis.5
Several studies have proven that central obesity should take priority for detecting cardiovascular risk factors; simply, “metabolic obesity,” which refers to the accumulation of fat within the visceral cavity, has a main role in developing CVD, metabolic syndrome, or both, regardless of the patient’s obesity status.6,7 Multiple methods have used to quantify regional adiposity in clinical and epidemiological studies, including multiple anthropometric indices and abdominal fat assessment by ultrasonography (US).8
The most commonly used anthropometric indices include waist circumference (WC) and waist to hip ratio (WHR),9 as well as waist to height ratio (WHtR),10 to assess the amount of abdominal fat9,10 all of which are relatively good indicators of the risk of CVDs.11 Historically, body mass index (BMI) was used to define the degree of obesity and overweight;12 however, not all people who have atherosclerosis are obese, nor do all people defined as obese by BMI develop atherosclerosis.13
Magnetic resonance imaging (MRI) and computed tomography (CT) are the best imaging modalities for measuring fat areas;14 however, the use of these modalities have many limitations, including exposure to harmful radiation during CT, as well as the limited availability and high prices for both types of examination.15 Thus, there is a strong need for a simple, accurate, and appropriate imaging modality to measure the amount of visceral fat.16
Several studies have reported that US measurements are accurate and reliable for determining the amount of visceral fat, and it has been reported that the amounts of visceral adipose tissue measured by CT and by ultrasound are strongly correlated.3,17 Moreover, ultrasound is characterized by being non-invasive, widely available, and a suitable method for the quantification of the amount of visceral fat.3,18
Risk factors of CAD have been separately studied several times. However, very few studies have comprehensively evaluated the relationship between visceral adipose tissue indices and presence and severity of CAD as well as very few papers studied the relationship between posterior perinephric fat thickness and presence and severity of CAD. In the current study we used several abdominal fat and anthropometric indices to predict the presence and severity of CAD assessed by coronary angiography.
Patients and Methods
Study Design
Ninety patients with clinical evidence of ischemic heart disease or high probability of having ischemic heart disease were included in this prospective study during the period of October 2018 to December 2019. All patients were candidate for coronary angiography according to the opinion of their treating physician.
All participants were referred from the internal medicine outpatient’s clinic. The inclusion criteria included age >18 years, acceptance of participation in this study irrespective of BMI to allow for a reference distribution of BMI, complaints of symptoms suggestive of cardiac symptoms, and lack of fulfilment of the exclusion criteria. The exclusion criteria included all the participants who did not undergo coronary angiography after US examination, past history of confirmed coronary artery disease, taking antidyslipidemic drugs, undergone bariatric and/or upper abdominal operations, or suffering from chronic debilitating diseases (ie, renal insufficiency, liver cirrhosis, chronic infections, and malignancy). The approval for this study was obtained from our Institution Review Board (IRB) and Ethics Committee no. 128/2018 (Sohag University, Sohag Faculty of Medicine, Institutional Review Board and Ethics Committee), and the study fully complied with the Declaration of Helsinki of 1975 revised in 2013. Informed written consent was obtained from all participants.
Participant Assessment
All participants were clinically assessed, with more attention being paid to drug intake and cardiovascular risk factors. Smoking status was assessed by self-report. Blood pressure was measured in the rest state and was calculated as the mean of three measurements after an interval approximately 5 min between each measurement. Fasting blood samples were collected after 10-min rest periods and fasting plasma glucose concentrations and serum lipid profiles were assessed. All samples were examined in the same clinical laboratory and under standardized enzymatic procedures.
Anthropometric Measurements
The height and weight of all participants were measured while they were wearing light clothes, and then BMI was calculated. The hip circumference (HC) was measured over undergarments at the point of maximal protuberance of the gluteal region. WC was measured by a non-stretched tape at the end of expiration midway between the upper aspect of the iliac crest and the lowest ribs. The WHtR was obtained by dividing the WC by height (both in centimeters). The WHR was obtained by dividing WC by HC (both in centimeters). All measurements were conducted by a single experienced cardiologist and the average of two measurements was taken.
Ultrasonographic Measurement of Abdominal Fat Thickness
The examination was performed by using both constant settings and a high-resolution ultrasound system (Toshiba Aplio 500, Tokyo, Japan). The participants were examined in the supine position using a 3.5 MHz convex array; all images were obtained at the end of expiration to avoid any effects of respiration, with light compression to the abdominal wall to avoid underestimation of subcutaneous fat thickness. The following areas were measured: (i) Subcutaneous fat thickness (SCFT), ie, the fat tissue thickness between the linea alba and skin–fat interface measured at the midline between the umbilicus and xiphoid process (Figure 1A); (ii) Preperitoneal fat thickness (PPFT), ie, the maximum fat thickness between the upper surface of the liver and the inner aspect of the rectus abdominis muscle (Figure 1B); (iii) Visceral fat thickness (VFT), ie, the distance between the inner aspect of the rectus abdominis muscle and the anterior wall of the aorta, measured in the perpendicular direction to the aorta3 (Figure 2); (iv) Posterior right perinephric fat thickness (PRPFT), ie, the mean of the maximum fat thickness of the posterior right renal wall measured in the posterior right perinephric space (at three sites posterior to the upper, middle, and lower parts of the kidney)19 in this study, we used the PRPFT due to validation method in previous studies20 (Figure 3A); (v) VFT/SCFT ratio;3 (vi) Maximum distance, measured between the inner aspect of the rectus abdominis muscle and the posterior aortic wall, 1 cm above the umbilicus in a line perpendicular to the aorta;19 (vii) The distance measured between the splenic vein and the inner aspect of the abdominal muscle19 (Figure 3B); (vii) Abdominal wall fat index (AFI), ie, the ratio obtained by dividing the PPFT by the SCFT;8 (viii) Visceral adiposity tissue volume (VAT), calculated as follows: VAT volume = −9.008 + 1.191 X (distance between the splenic vein and the inner aspect of the abdominal muscle in millimeters) + 0.987 X (distance between the aortic posterior wall and the inner aspect of the abdominal muscle on the umbilicus in millimeters) + 3.644 X (fat layer thickness of the posterior right renal wall in millimeters).19
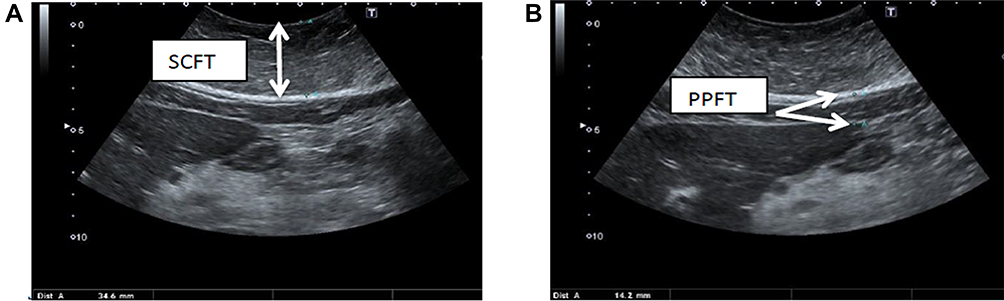 |
Figure 1 Abdominal ultrasound examination showing (A) subcutaneous fat thickness (SCFT), which is approximately 34.6 mm; (B) the preperitoneal fat thickness (PPFT), which is approximately 14.2 mm. |
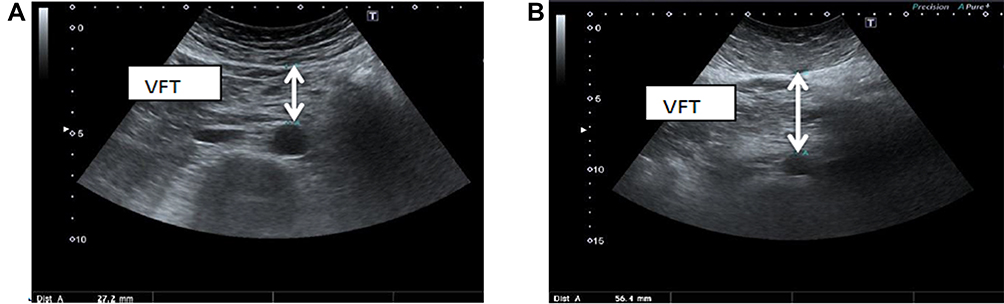 |
Figure 2 Abdominal ultrasound showing the thickness from the inner surface of the rectus abdominis muscle to the anterior wall of the aorta: (A) the thickness is 27.2 mm; (B) the thickness is 56.4 mm. VFT, visceral fat thickness. |
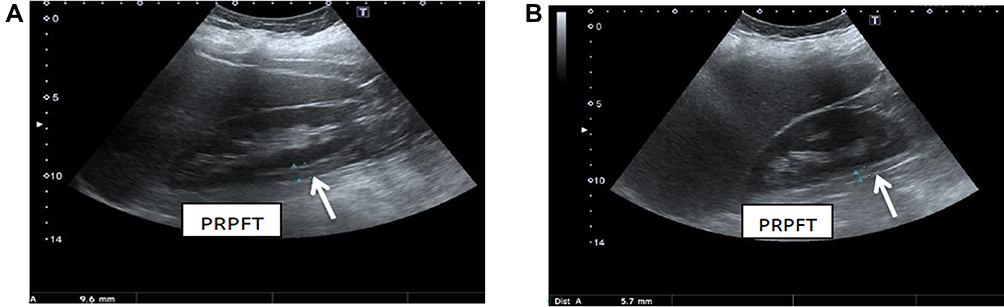 |
Figure 3 Abdominal ultrasound showing (A) the thickness of the posterior right perinephric fat (PRPFT) is 9.6 mm (posterior to the middle part of the kidney); (B) the thickness from the inner aspect of the anterior abdominal wall to the splenic vein is 37.3 mm. |
For reliability all participants were examined by an experienced sonographer, followed by another experienced sonographer blind to the other operator’s results repeating the examination for 46 of the participants. He used the same setting, US system, and technique for examination. The intra-observer and inter-observer reliability indexes for this method ranged from 0.915 to 0.964 and from 0.895 to 0.923, respectively.
Coronary Angiography Technique
The examination was carried out by a single experienced cardiologist using the Toshiba Infinix CBi. All participants underwent selective coronary angiography by the Judkins technique within one week from the US examination; images were interpreted by an expert cardiologist who did not have any knowledge of the US findings. Cases with coronary artery stenosis were classified into:
1. Significant stenosis of the coronary artery (>50%) in at least one of the major coronary arteries (Figures 4 and 5).
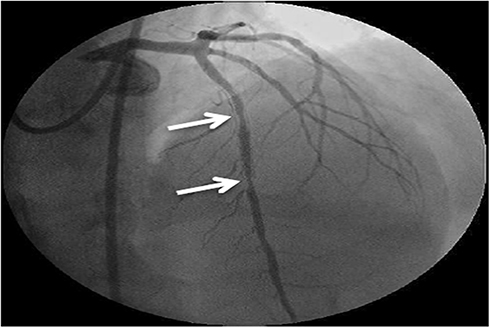 |
Figure 4 Conventional coronary angiography showing a left coronary angiogram. The anteroposterior cranial view showed two successive stenotic lesions with 90% stenosis of the mid-segment of the left anterior descending (LAD) artery (arrows show the stenotic segments). |
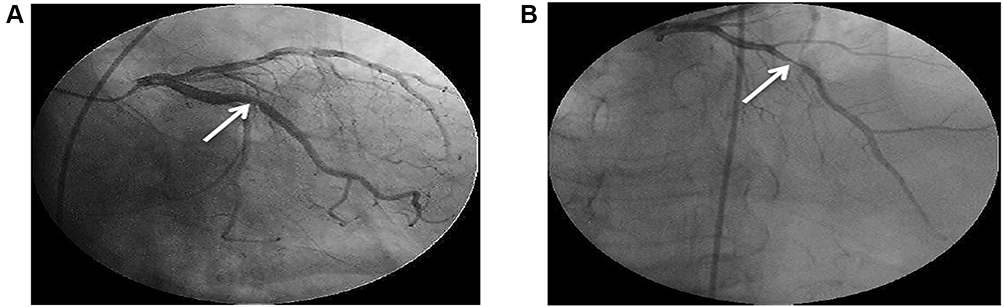 |
Figure 5 (A and B) Conventional coronary angiography showing a left coronary angiogram. The anteroposterior caudal and cranial views showed spontaneous dissection of the main left coronary artery extended to the mid-segment of the LAD artery with severe stenosis (95%) of the mid-segment of the LAD artery (arrows show the stenotic segment). |
2. Non-significant stenosis of the coronary artery (≤50%)21 (Figure 6).
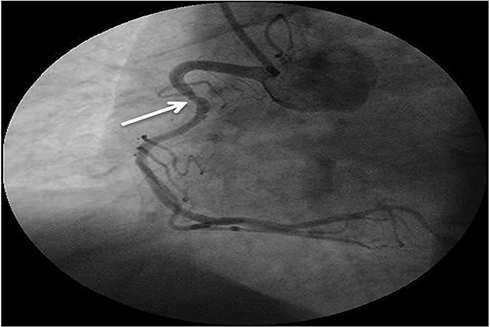 |
Figure 6 Conventional coronary angiography showing a right coronary angiogram. The left anterior oblique view showed mild atherosclerosis of the right coronary artery (RCA) (arrow shows the stenotic segment). |
Statistical Analysis
All data were statistically analyzed using the SPSS program (Statistical Package for Social Science, version 21). Data were described either by the mean and the standard deviation or the frequency and percentage, whenever appropriate. Comparisons were conducted between two independent normally distributed variables using an independent samples t-test. Fischer’s exact test was used to assess the association between qualitative variables. The area under the receiver operating curve (ROC) was determined using MedCalc Software version 14 and the best cutoff value was determined by using the Youden index.22 Univariate and multivariate regression analyses were conducted; the odds ratio (OR) was used to quantify the strength of the association between two events, and the 95% confidence intervals (CIs) were also reported. The odds of developing the disease were given exposure to risk.23 A p-value was considered statistically significantly if <0.05.
Results
Participants
In this prospective study, we enrolled 90 participants whose ages ranged between 31 and 72 years (mean 56.33 ± 9.06 years), with a male to female ratio of approximately 1.9:1. All baseline data and characteristics regarding the participants are displayed in Table 1.
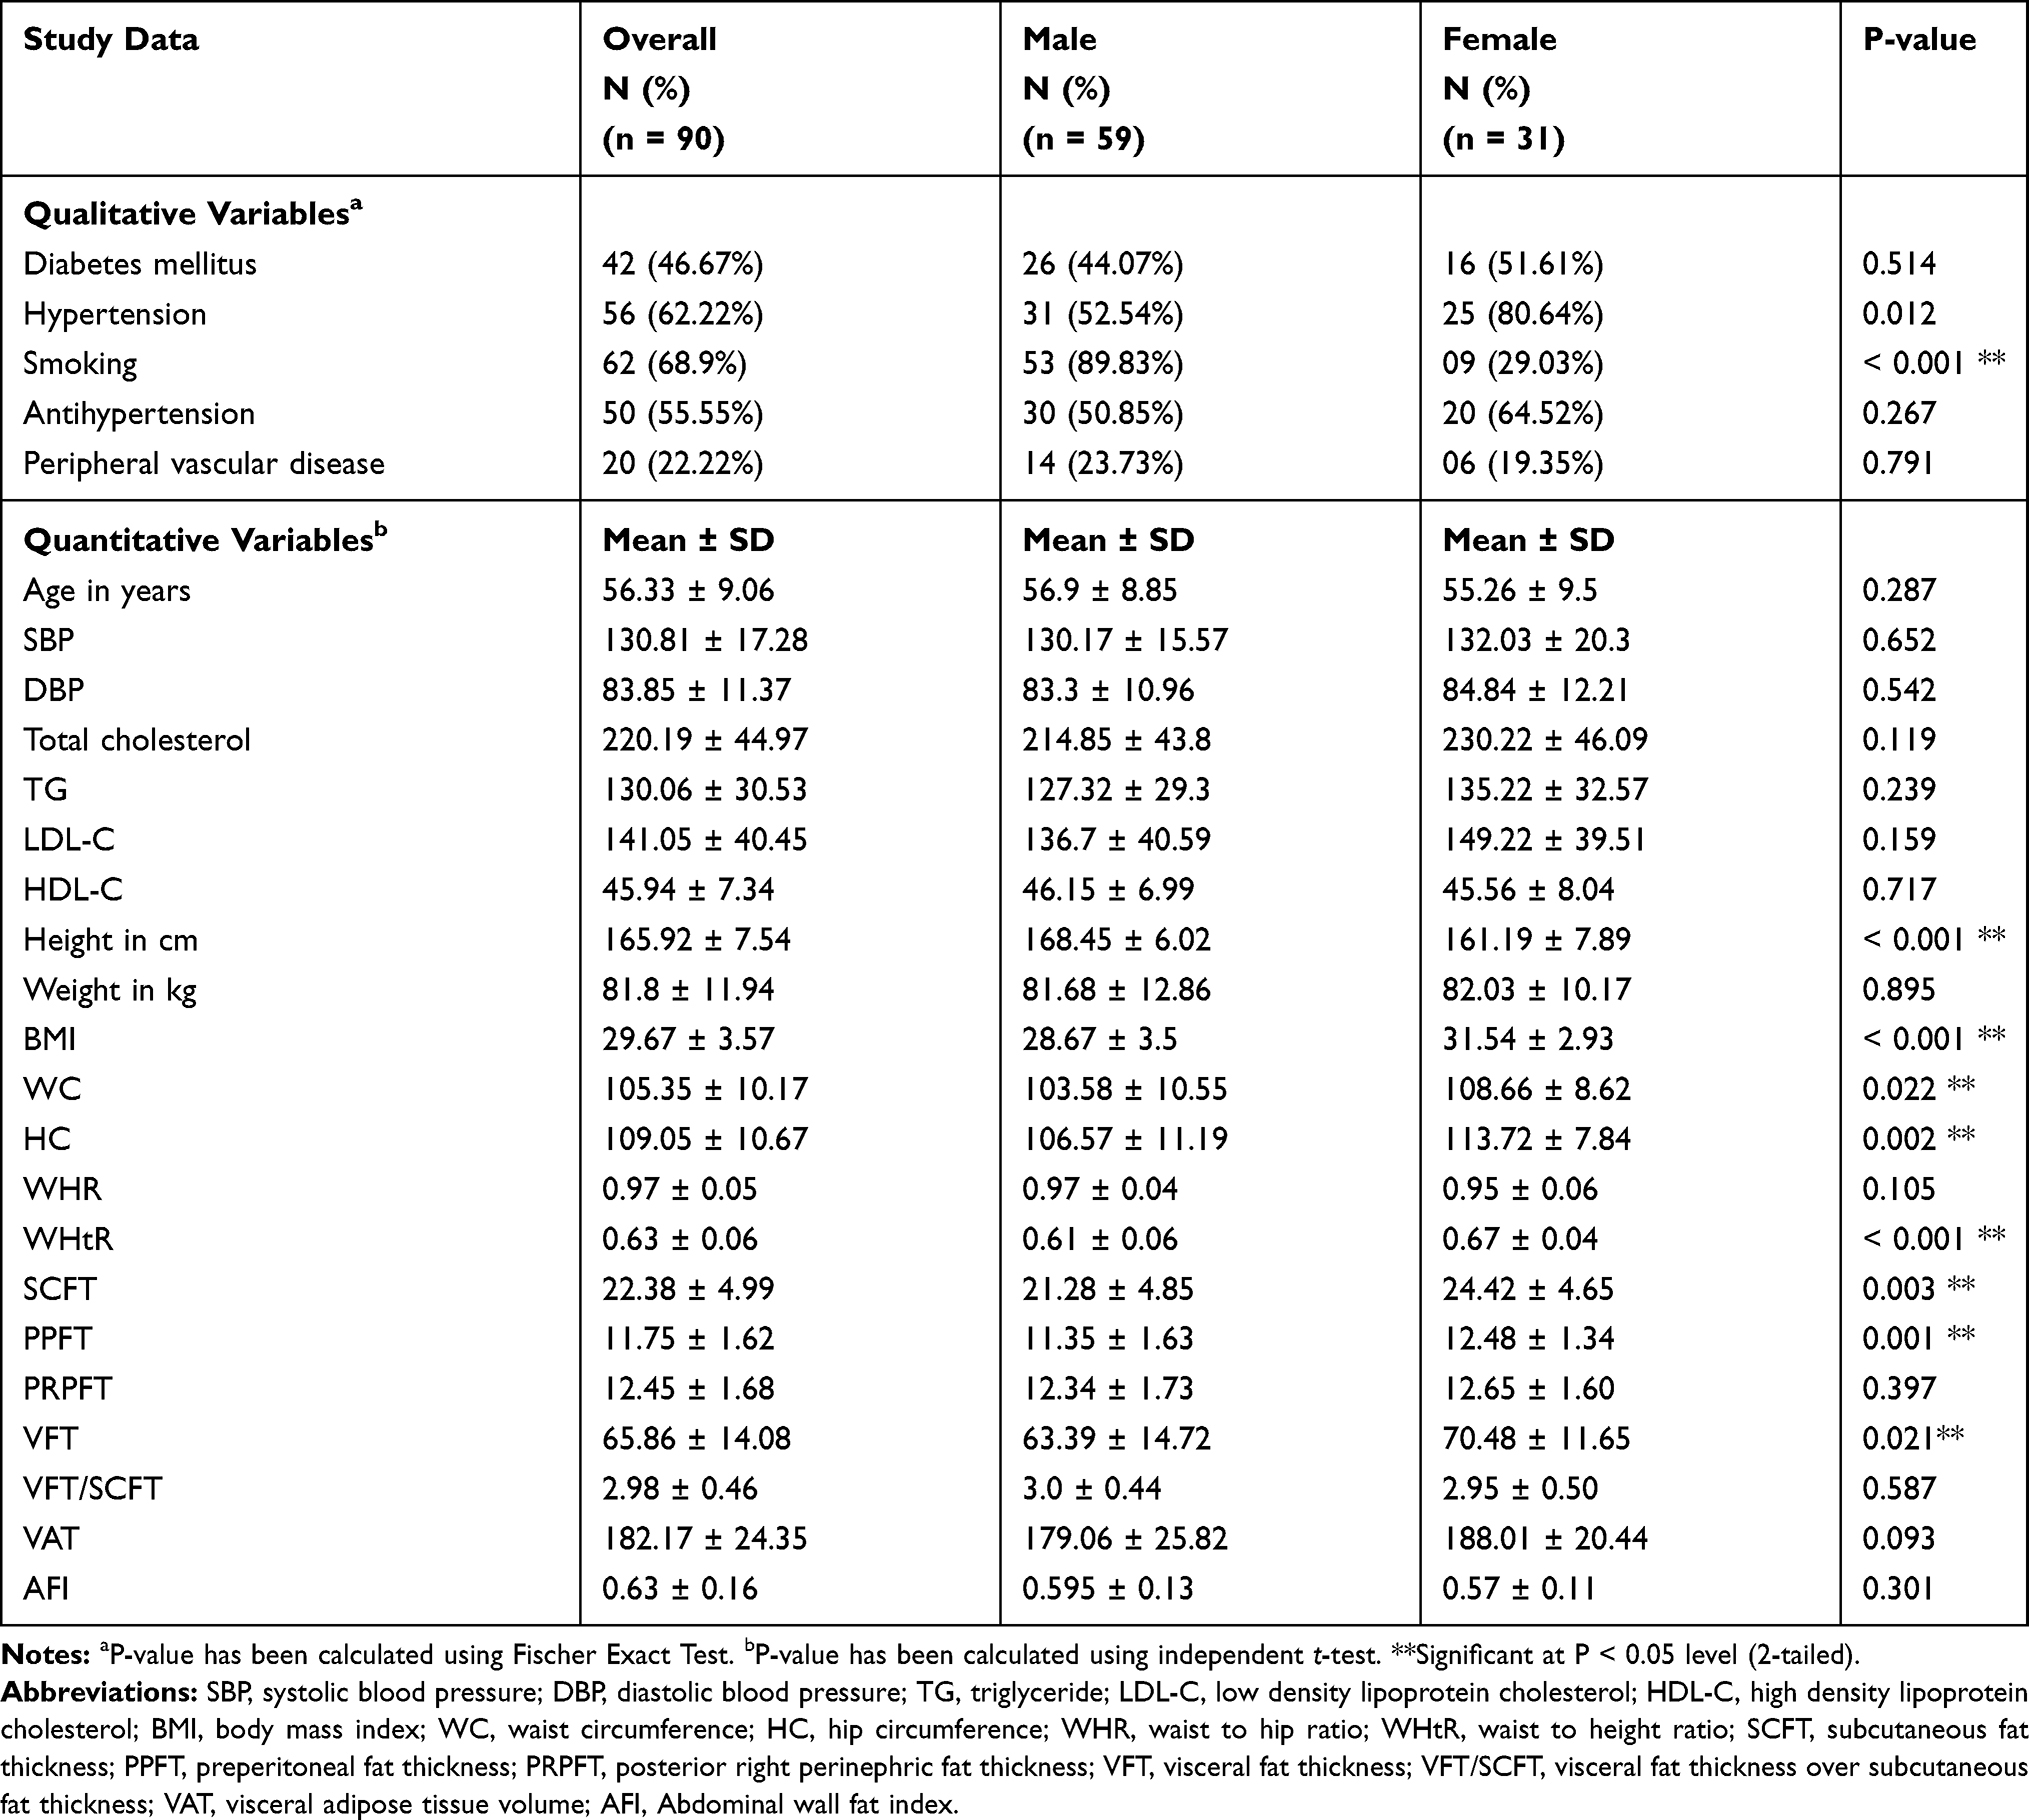 |
Table 1 Baseline Data and Characteristics Regarding All Participants According to Gender |
Association Between CAD and the Anthropometric and Abdominal Fat Indices
When measuring the association between the different variables and the presence of CAD, we found a significant statistical association between WC (p = 0.005) and HC (p = 0.001), with the presence of CAD. In contrast, from the abdominal fat indices, a significant statistical association was found between SCFT (p = 0.015), PPFT (p = 0.002), PRPFT (p < 0.001), VFT (p = 0.001), and VAT (p < 0.001) and the presence of CAD, while the other variables did not differ significantly (Table 2).
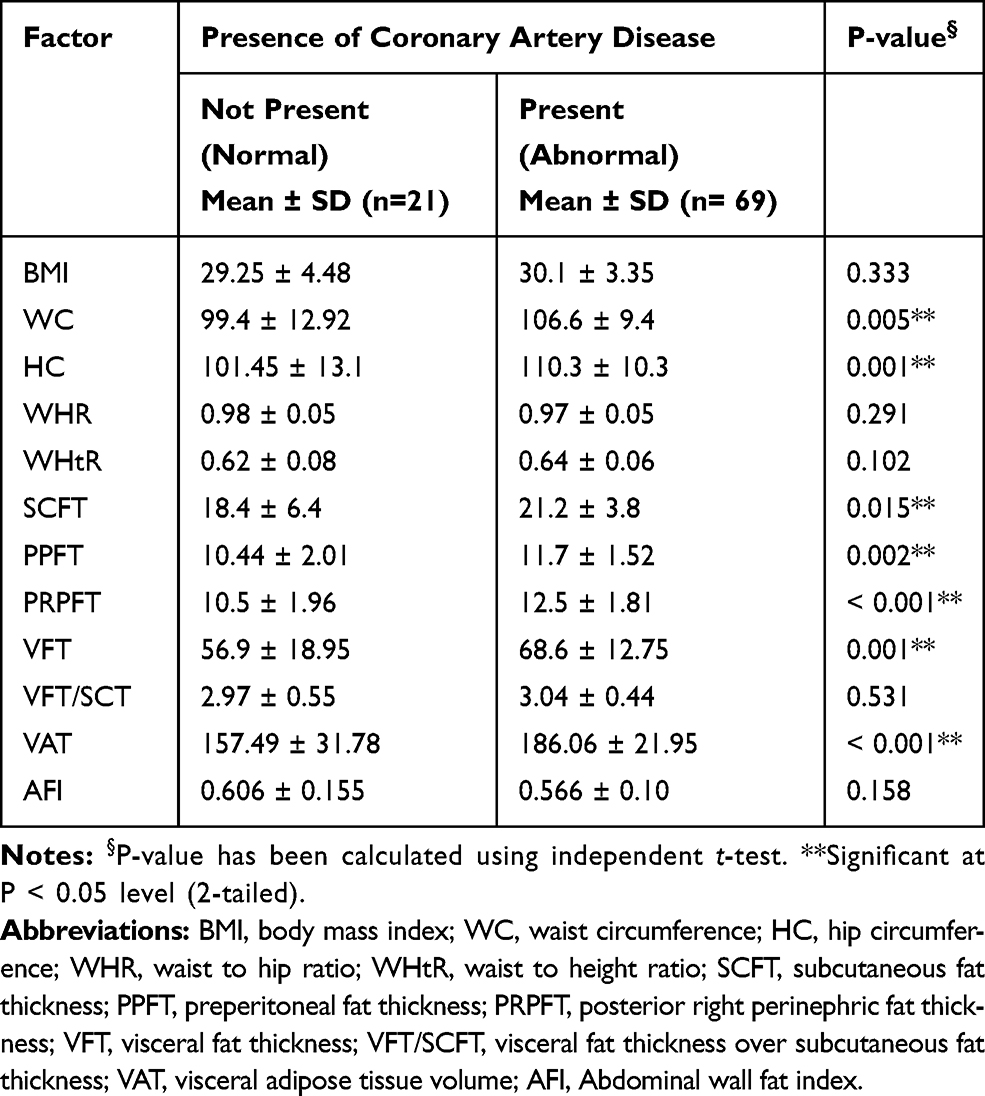 |
Table 2 Statistical Association Between CAD with Anthropometric and Abdominal Fat Indices |
Association Between the Severity of CAD and the Anthropometric and Abdominal Fat Indices
After detecting the diseased group of participants, we studied the association between the different variables and the severity of CAD. From all of the variables, WC (p = 0.006), HC (p = 0.049), and VAT (p = 0.024) were significantly associated with significant CAD, while the other variables showed no significant association with the severity of CAD (Table 3).
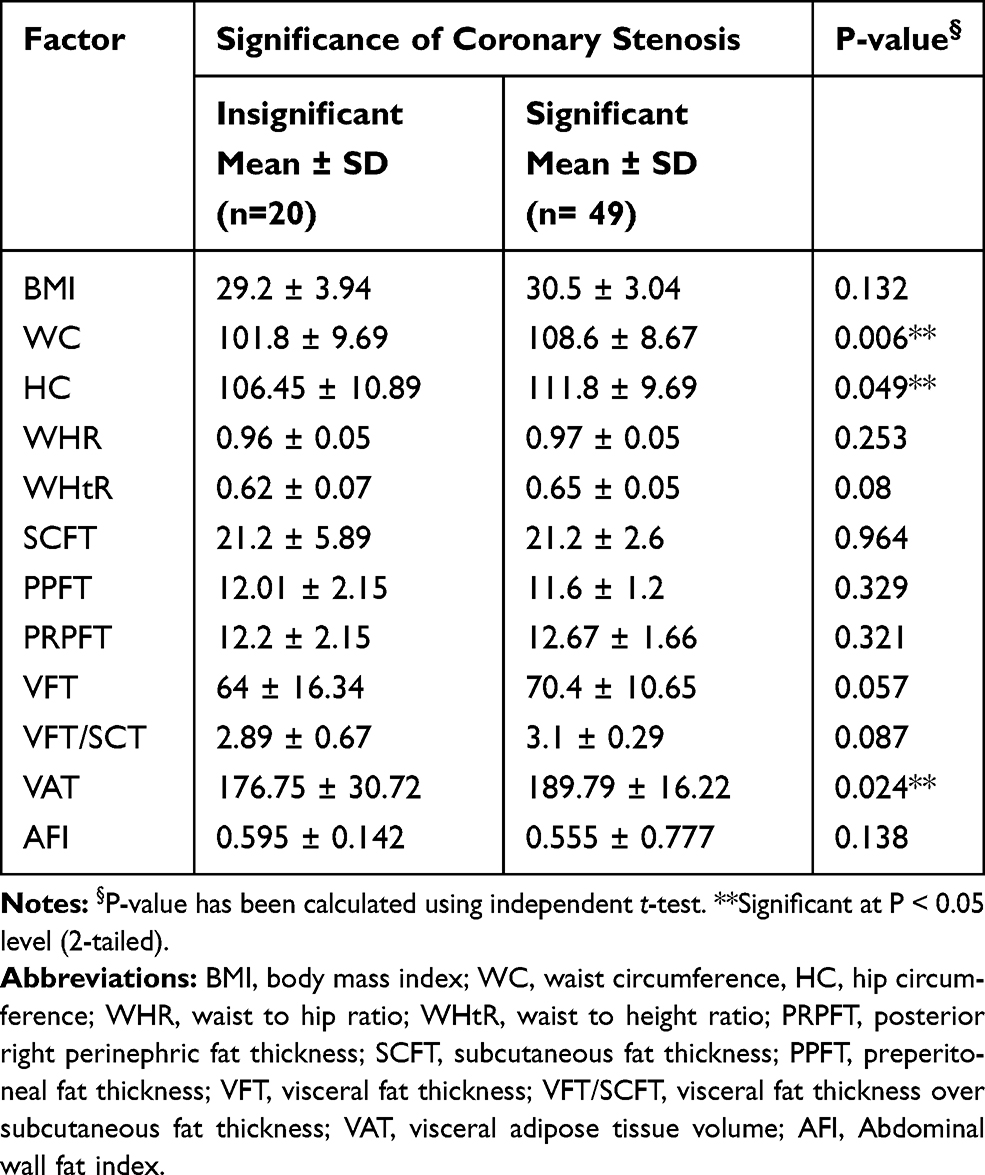 |
Table 3 Statistical Association Between Severity of CAD with Anthropometric and Abdominal Fat Indices |
Univariate and Multivariate Regression Analyses for the Different Indices Predicting CAD
We used ROC curve analysis to determine the best cutoff value of all of the indices, with the highest summation of sensitivity and specificity, as well as highest negative predictive value, followed by univariate and multivariate analysis to determines the risk [Odds ratios (ORs)] of patients above these cutoff values developing CAD compared to their counterparts below this value.
Regarding the anthropometric measurements, participants with a BMI >25 increased had a 4 times increased risk of CAD compared to their counterparts with a BMI ≤ 25 (crude OR = 4; 95% CI = 1.14–14.1; p = 0.031); however, in the multivariate analysis, the risk increased to 5.48 times (Adjusted OR (AOR) = 5.48; 95% CI = 1.35–22.2; p = 0.017). Moreover, participants with a WC >104.9 cm has a 5.45 times increased risk of CAD compared to their counterparts with a WC ≤ 104.9 cm (crude OR = 5.45; 95% CI = 1.88–15.8; p = 0.002); however, in the multivariate analysis, the risk increased to 6.74 times (AOR = 6.74; 95% CI = 2.16–21.1; p = 0.001). In contrast, participants with a HC >108.2 cm, compared to their counterparts with a HC ≤ 108.2 cm, showed a significant association in the univariate analysis with a 3 times increased risk of CAD (crude OR = 3.03; 95% CI = 1.09–8.36; p = 0.032); however, after adjustment in the multivariate analysis, no significant association was detected (AOR = 1.01; 95% CI = 0.19–5.27; p = 0.987). The other anthropometric indices showed no significant association in either the univariate or the multivariate analysis.
As regards (or concerning) the abdominal fat indices, variable degrees of increasing risk of CAD were detected. Participants with a PPFT >11.4 mm, had a 2.79 times greater risk of CAD compared to participants with a PPFT ≤11.4 mm (crude OR = 2.79; 95% CI = 1.03–7.52; p = 0.043); however, in the multivariate analysis, the results did not differ significantly. In terms of PRPFT, the risk of CAD for participants with a PRPFT >12.1 mm was likely to increase by 8.9 times compared to those with a PRPFT ≤12.1 mm (crude OR = 8.9; 95% CI = 2.4–33.1; p = 0.001); however, in the multivariate analysis, the risk increased to 12.3 times (AOR = 12.3; 95% CI = 2.9–51.6; p = 0.001). Moreover, participants with VFT >60.8 mm had a 4.9 times increased risk of CAD compared to participants with a VFT ≤60.8 mm (crude OR = 4.9; 95% CI = 1.8–13.5; p = 0.002); however, after adjustment in the multivariate analysis, the risk increased to 5.7 time (AOR = 5.7; 95% CI = 1.9–16.9; p = 0.002).
Moreover, participants with a VAT >176 had a 7.2 times increased their risk of CAD compared to those with a VAT ≤176 (crude OR = 7.2; 95% CI = 2.5–20.8; p < 0.001); however, after adjustment in the multivariate analysis, the risk increased to 10.7 time (AOR = 10.7; 95% CI = 3.0–37.3; p < 0.001). In contrast to the above findings, an inverse relationship was detected between participants with an AFI >0.65 and incidence of CAD, as they were less likely to have CAD compared to their counterparts with an AFI ≤0.65 (crude OR = 0.33; 95% CI = 0.12–0.93; p = 0.037 and AOR = 0.30; 95% CI = 0.10–0.89; p = 0.030). The last variable, VFT/SCFT, showed no significant association in either the univariate of the multivariate analysis (Table 4).
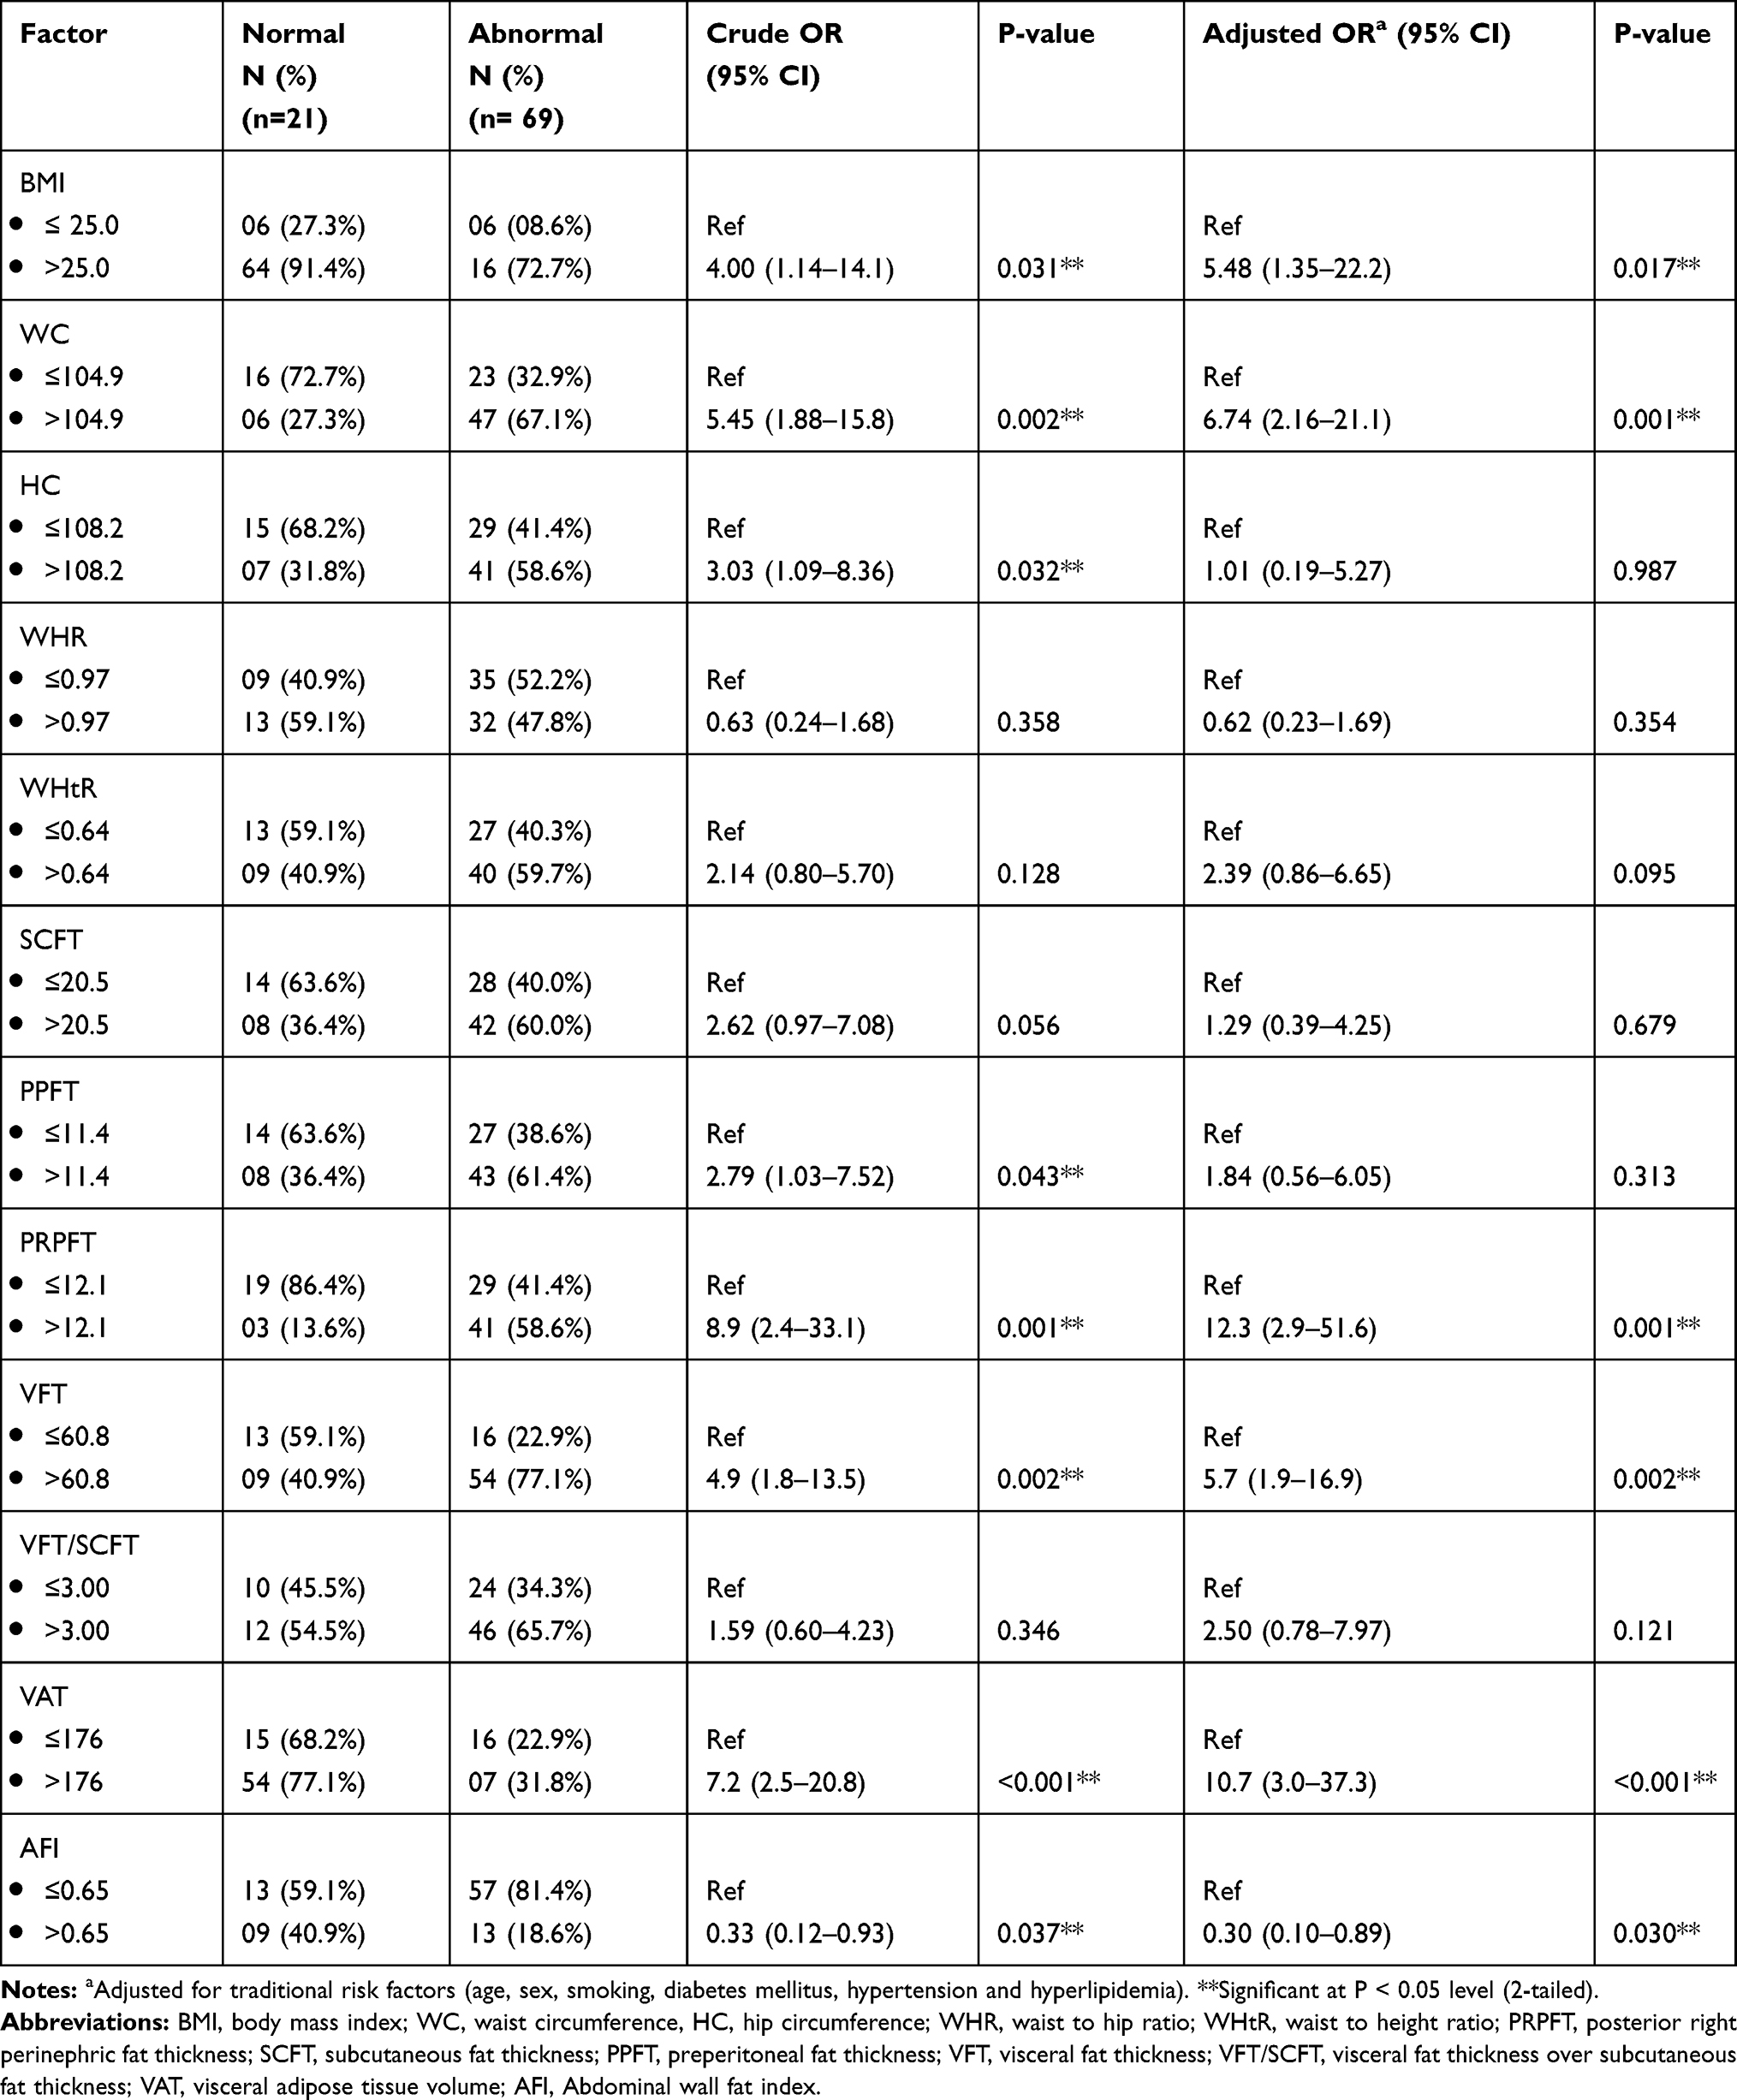 |
Table 4 Univariate and Multivariate Regression Analysis for Different Indices Predicting CAD |
Univariate and Multivariate Regression Analysis for the Different Indices Predicting the Severity of CAD
For more analyses of the association between different indices and CAD, we conducted univariate and multivariate analyses to detect which index is associated with a significant outcome. For the anthropometric measurements, participants with a WC >104.9 cm had a 3.87 increased risk of significant CAD compared to their counterparts with a WC ≤104.9 (crude OR = 3.87; 95% CI = 1.29–11.6; p = 0.015); however, after adjustment in the multivariate analysis, the risk increased to 4.28 times (AOR = 4.28; 95% CI = 1.37–13.4; p = 0.012). Moreover, patients with a WHtR >0.64 had a 3.2 times increased risk of significant coronary stenosis compared to their counterparts with a WHtR ≤0.64 (crude OR = 3.2; 95% CI = 1.08–9.47; p = 0.036); however, after adjustment in the multivariate analysis, the risk slightly increased to 3.3 times (AOR = 3.30; 95% CI = 1.10–9.89; p = 0.033).
Concerning the abdominal fat indices, participants with a VFT >60.8 mm had a 3.5 times increased risk of significant coronary stenosis compared to their counterparts with a VFT ≤60.8 mm (crude OR = 3.5; 95% CI = 1.1–11.3; p = 0.036); however, after adjustment in the multivariate analysis, the risk increased to 3.7 times (AOR = 3.7; 95% CI = 1.1–12.2; p = 0.032). Moreover, participants with a VAT >176 had a 3.5 times increased the risk of significant coronary stenosis compared to their counterparts with a VAT ≤176 (crude OR = 3.5; 95% CI = 1.1–11.3; p = 0.036); however, after adjustment in the multivariate analysis, the risk increased to 3.7 time (AOR = 3.7; 95% CI = 1.1–12.5; p = 0.034). In contrast, the AFI showed an inverse relationship with the significance of coronary artery stenosis, as participants with an AFI >0.65 were less likely to have significant CAD compared to their counterparts with an AFI ≤0.65 (crude OR = 0.25; 95% CI = 0.07–0.89; p = 0.032 and AOR = 0.25; 95% CI = 0.07–0.89; p = 0.033). No other abdominal indices showed any significant associations with the severity of CAD (Table 5).
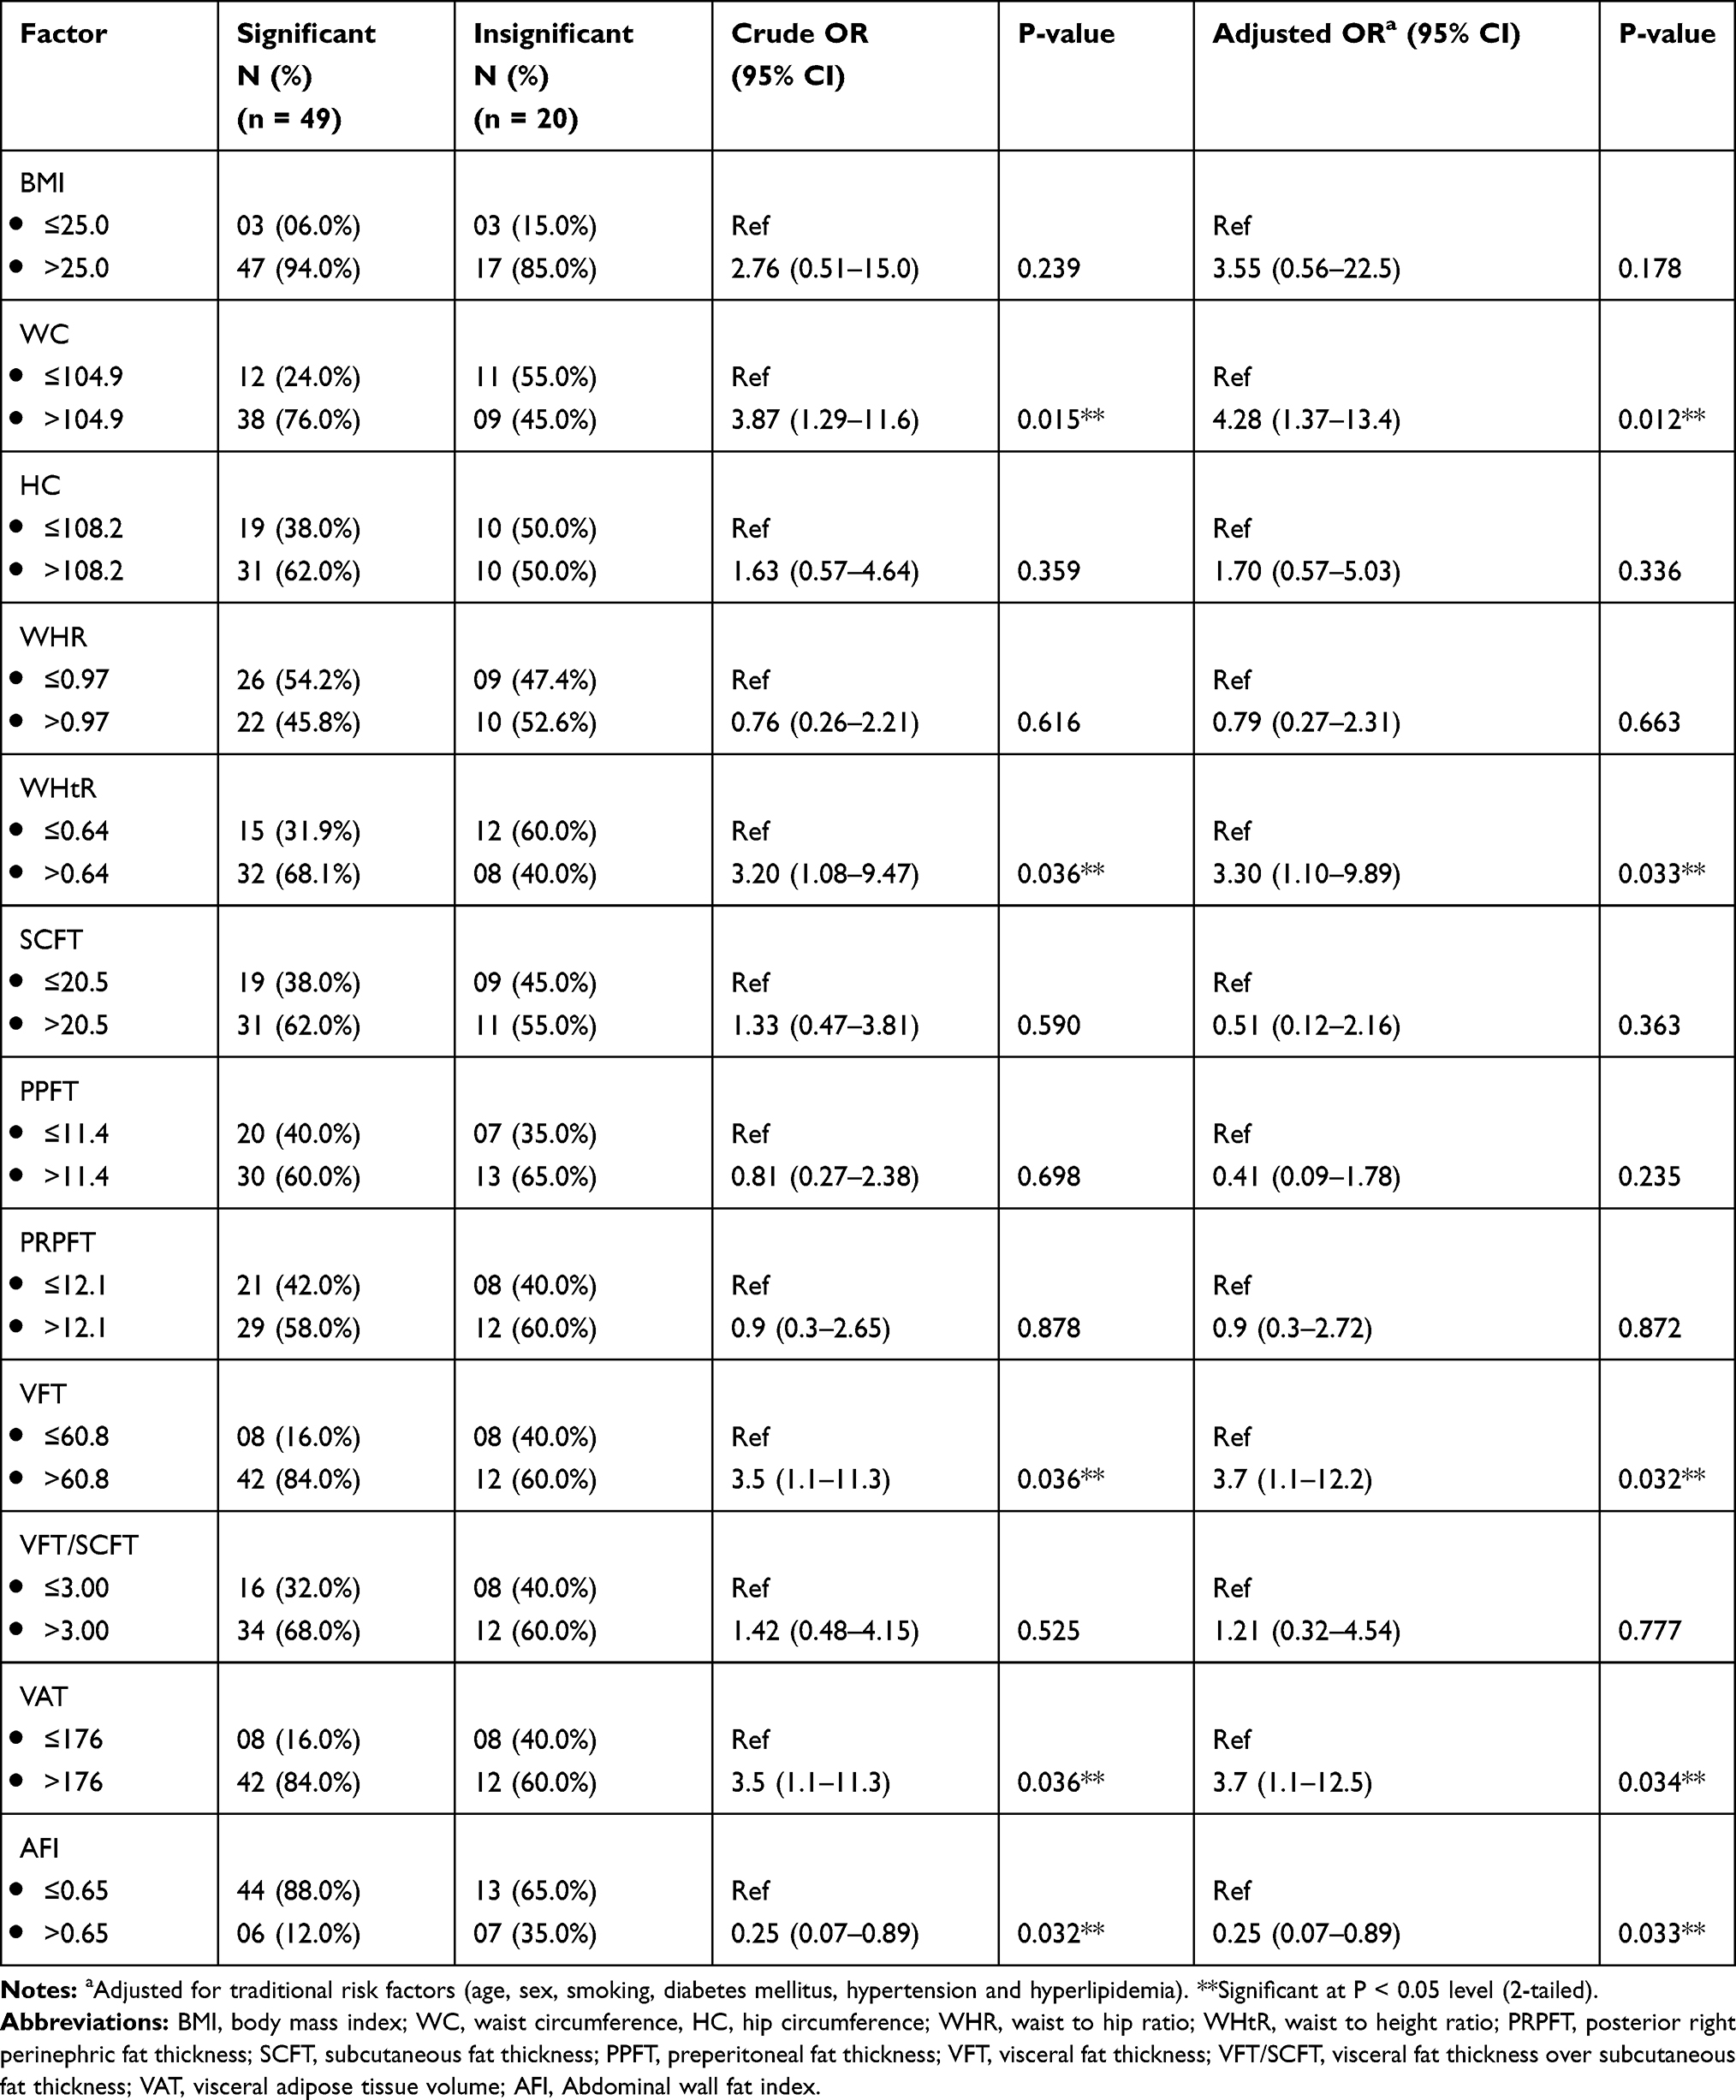 |
Table 5 Univariate and Multivariate Regression Analysis for Different Indices Predicting Severity of CAD |
Discussion
Many studies have proven that visceral adiposity plays a major role in developing diseases and disorders related to obesity more than overall obesity, suggesting the important and major role of visceral fat in cardiovascular and metabolic diseases.24 In this study, we examined nearly all abdominal fat and anthropometric indices as a predictor of coronary artery disease, using the best cutoff value determined by the ROC curve for all indices.
Our study proved that there is a significant statistical association between WC, HC, SCFT, PRPFT, VFT, PPFT, and VAT and the presence of CAD. In contrast, when we studied the association between all of the indices and the severity of coronary artery disease, only WC, HC, and VAT showed a significant association with significant disease.
For more clarification and better assessment of the association between the anthropometric and abdominal fat indices and CAD, we performed univariate and multivariate analyses for all of the indices after selecting the best cutoff value using ROC curve analysis. As regards the abdominal fat indices, we detected that a PPFT >11.4 mm increases the risk of CAD compared to its counterpart part in the univariate analysis, but this significant association disappeared in the multivariate analysis. However, a PRPFT >12.1 mm, a VFT >60.8 mm, and a VAT >176 were shown to increase the risk of CAD compared to their counterparts in both the univariate and multivariate analyses. In contrast, VFT/SCFT showed a non-significant association with the presence of CAD, while the AFI showed an inverse relationship with the incidence of CAD.
In contrast, in terms of the anthropometric indices, we detected that a BMI >25 and a WC >104.9 cm increased the risk of CAD compared to their counterparts in both the univariate and multivariate analyses. However, a HC >108.2 cm increased the risk of CAD when compared to its counterpart part in the univariate analysis but not in the multivariate analysis.
Only a few papers are available regarding the associations between the posterior perinephric fat thickness and CAD in adults. Our results agree with those of Rover et al who reported that the thickness of the PRPFT might indicate individuals with an increased atherosclerotic disease development potential.20 Moreover, Liu et al suggested that perirenal fat is a promising target for cardiovascular disease management.25 In the study performed by Hamagawa et al it was concluded that PPFT is an independent predictor of CAD;26 in contrast, Shabestari et al found that PPFT was poor predictor of CVD.15
Our results also agree with those obtained by Kim et al in which it was found that a high VFT is closely related to an increased risk of CAD and metabolic diseases in men and is considered an independent predictor of both.3 However, Shabestari et al found that sonographic VFT and WHR are associated with CAD, but only WHR has an independent role after adjustments for traditional risk factors and age.15 Meanwhile, regarding VAT, our results agree with those obtained by Lee et al in which it was found that an increased VAT volume is associated with an increased incidence of CVD risk factors.27
There has been much controversy regarding the role of SCFT. Many studies have shown strong associations between SCFT and CVD risk factors,28 while other studies have suggested a beneficial role for SCFT.29 At present, it remains unclear if SCFT increases the risk of CVD or protects from it.10
Regarding the anthropometric measurements, there is also much controversy concerning their significance. Hamagawa et al found that WC is not an independent predictor of CAD.26 Ahmed et al found that WC, WHR, and WHtR have strong correlations with all the cardiometabolic risk indices.30 Flint et al found that both WC and BMI are strongly associated with the risk of CAD, and that WC may predict the risk of CAD better than BMI among elderly women and men.12 Liu et al found that BMI, WC, and WHR have relatively weaker associations with cardiovascular risk factors.31 Meanwhile, Shabestari et al found in their study that WHR is an independent risk factor for CAD, and that it is better correlated with CAD than WC.15 Furthermore, Canoy et al found that WHR is independently more predictive of CAD in both men and women than WC or BMI.32
The current study has some limitations. First, although we included a relatively small number of participants, we included several anthropometric and abdominal indices to assess their association with CAD; we used the best cutoff value to determine the degree of risk as well. Second, it is possible that our results might have been biased by the participant population, because the participants were referred randomly from the outpatient clinic. Several risk factors can lead to coronary artery disease and many of these factors show clinical overlap and could be present in the same patient. Third, there was a high prevalence of using medication for the treatment of hypertension and diabetes in our study population, which likely affected the correlations with CAD. Finally, MRI and CT are superior imaging modalities for the measurement of abdominal fat thickness, but their limited availability, high cost, and hazards of ionizing radiation limit their usage. Therefore, we used ultrasonography in our assessment because of its higher accuracy compared to CT and MRI, its availability, its cost-effectiveness, and its high safety profile.
Conclusions
Posterior perinephric fat thickness and visceral adipose tissue volume measured by ultrasound are strong noninvasive predictors of coronary artery disease, followed by body mass index, waist circumference, and visceral fat thickness; meanwhile, waist circumference, waist height ratio, visceral tissue thickness, and visceral adipose tissue volume are good noninvasive predictors of the severity of coronary artery disease.
Study Subjects or Cohorts Overlap
Part of the study population has been previously reported in the study under press in the Ultrasonography Journal. In this study, the association between abdominal fat and anthropometric indices were assessed with carotid atherosclerosis.
Abbreviations
PRPFT, posterior right perinephric fat thickness; SCFT, subcutaneous fat thickness; PPFT, preperitoneal fat thickness; VFT, visceral fat thickness; BMI, body mass index; WC, waist circumference; HC, hip circumference; WHR, waist hip ratio; WHtR, waist height ratio; CAD, coronary artery disease.
Acknowledgment
The authors extend their appreciation to the Deputyship for Research & Innovation, Ministry of Education in Saudi Arabia for funding this research work through the project number IFT20101.
Disclosure
This research is supported and funded from Research & Innovation, Ministry of Education in Saudi Arabia through the project number IFT20101. The sponsors had no role in the design, execution, interpretation, or writing of the study. The authors report no other conflicts of interest in this work.
References
1. Haberka M, Skilton M, Biedroń M, et al. Obesity, visceral adiposity and carotid atherosclerosis. J Diabetes Complications. 2019;33(4):302–306. doi:10.1016/j.jdiacomp.2019.01.002
2. Roever LS, Resende ES, Diniz AL, et al. Abdominal obesity and association with atherosclerosis risk factors: the uberlândia heart study. Medicine (Baltimore). 2016;95(11):e1357. doi:10.1097/MD.0000000000001357
3. Kim SK, Kim HJ, Hur KY, et al. Visceral fat thickness measured by ultrasonography can estimate not only visceral obesity but also risks of cardiovascular and metabolic diseases. Am J Clin Nutr. 2004;79(4):593–599. doi:10.1093/ajcn/79.4.593
4. Ohashi N, Yamamoto H, Horiguchi J, et al. Association between visceral adipose tissue area and coronary plaque morphology assessed by CT angiography. JACC Cardiovasc Imaging. 2010;3(9):908–917. doi:10.1016/j.jcmg.2010.06.014
5. Ohashi N, Yamamoto H, Horiguchi J, et al. Visceral fat accumulation as a predictor of coronary artery calcium as assessed by multislice computed tomography in Japanese patients. Atherosclerosis. 2009;202(1):192–199. doi:10.1016/j.atherosclerosis.2008.04.019
6. Radmard AR, Poustchi H, Ansari L, et al. Abdominal fat distribution and carotid atherosclerosis in a general population: a semi-automated method using magnetic resonance imaging. Jpn J Radiol. 2016;34(6):414–422. doi:10.1007/s11604-016-0540-8
7. Strasser B, Arvandi M, Pasha EP, Haley AP, Stanforth P, Tanaka H. Abdominal obesity is associated with arterial stiffness in middle-aged adults. Nutr Metab Cardiovasc Dis. 2015;25(5):495–502. doi:10.1016/j.numecd.2015.01.002
8. Kawamoto R, Oka Y, Tomita H, Kodama A, Ootsuka N. Association between abdominal wall fat index on ultrasonography and carotid atherosclerosis in non-obese men. J Atheroscler Thromb. 2005;12(2):85–91. doi:10.5551/jat.12.85
9. Zimmet P, Magliano D, Matsuzawa Y, Alberti G, Shaw J. The metabolic syndrome: a global public health problem and a new definition. J Atheroscler Thromb. 2005;12(6):295–300. doi:10.5551/jat.12.295
10. Chiba Y, Saitoh S, Takagi S, et al. Relationship between visceral fat and cardiovascular disease risk factors: the Tanno and Sobetsu study. Hypertens Res. 2007;30(3):229–236. doi:10.1291/hypres.30.229
11. Hsieh SD, Yoshinaga H, Muto T. Waist-to-height ratio, a simple and practical index for assessing central fat distribution and metabolic risk in Japanese men and women. Int J Obes Relat Metab Disord. 2003;27(5):610–616. doi:10.1038/sj.ijo.0802259
12. Flint AJ, Rexrode KM, Hu FB, et al. Body mass index, waist circumference, and risk of coronary heart disease: a prospective study among men and women. Obes Res Clin Pract. 2010;4(3):e171–e181. doi:10.1016/j.orcp.2010.01.001
13. Lear SA, Humphries KH, Kohli S, Frohlich JJ, Birmingham CL, Mancini GB. Visceral adipose tissue, a potential risk factor for carotid atherosclerosis: results of the Multicultural Community Health Assessment Trial (M-CHAT). Stroke. 2007;38(9):2422–2429. doi:10.1161/STROKEAHA.107.484113
14. Lancaster JL, Ghiatas AA, Alyassin A, Kilcoyne RF, Bonora E, DeFronzo RA. Measurement of abdominal fat with T1-weighted MR images. J Magn Reson Imaging. 1991;1(3):363–369. doi:10.1002/jmri.1880010315
15. Shabestari AA, Bahrami-Motlagh H, Hosseinpanah F, Heidari K. Abdominal fat sonographic measurement compared to anthropometric indices for predicting the presence of coronary artery disease. J Ultrasound Med. 2013;32(11):1957–1965. doi:10.7863/ultra.32.11.1957
16. Shojaei MH, Shirani S, Eshraghian MR, Soleymanzadeh M. Sonographic prediction of body fat volume (subcutaneous and visceral fat) in cardiovascular patients. J Tehran Heart Cent. 2010;5(2):83–86.
17. Stolk RP, Wink O, Zelissen PM, Meijer R, van Gils AP, Grobbee DE. Validity and reproducibility of ultrasonography for the measurement of intra-abdominal adipose tissue. Int J Obes Relat Metab Disord. 2001;25(9):1346–1351. doi:10.1038/sj.ijo.0801734
18. Stolk RP, Meijer R, Mali WP, Grobbee DE, van der Graaf Y. Ultrasound measurements of intraabdominal fat estimate the metabolic syndrome better than do measurements of waist circumference. Am J Clin Nutr. 2003;77(4):857–860. doi:10.1093/ajcn/77.4.857
19. Rallidis LS, Baroutsi K, Zolindaki M, et al. Visceral adipose tissue is a better predictor of subclinical carotid atherosclerosis compared with waist circumference. Ultrasound Med Biol. 2014;40(6):1083–1088. doi:10.1016/j.ultrasmedbio.2013.12.017
20. Roever L, Resende ES, Veloso FC, et al. Perirenal fat and association with metabolic risk factors: the uberlândia heart study. Medicine (Baltimore). 2015;94(38):e1105. doi:10.1097/MD.0000000000001105
21. Weintraub WS, Karlsberg RP, Tcheng JE, et al. ACCF/AHA 2011 key data elements and definitions of a base cardiovascular vocabulary for electronic health records: a report of the American College of Cardiology Foundation/American Heart Association Task Force on Clinical Data Standards. J Am Coll Cardiol. 2011;58(2):202–222. doi:10.1016/j.jacc.2011.05.001
22. Hajian-Tilaki K. Receiver Operating Characteristic (ROC) curve analysis for medical diagnostic test evaluation. Caspian J Intern Med. 2013;4(2):627–635.
23. Szumilas M. Explaining odds ratios. J Can Acad Child Adolesc Psychiatry. 2010;19(3):227–229.
24. Mahabadi AA, Massaro JM, Rosito GA, et al. Association of pericardial fat, intrathoracic fat, and visceral abdominal fat with cardiovascular disease burden: the Framingham heart study. Eur Heart J. 2009;30(7):850–856. doi:10.1093/eurheartj/ehn573
25. Liu B-X, Sun W, Kong X-Q. Perirenal fat: a unique fat pad and potential target for cardiovascular disease. Angiology. 2019;70(7):584–593. doi:10.1177/0003319718799967
26. Hamagawa K, Matsumura Y, Kubo T, et al. Abdominal visceral fat thickness measured by ultrasonography predicts the presence and severity of coronary artery disease. Ultrasound Med Biol. 2010;36(11):1769–1775. doi:10.1016/j.ultrasmedbio.2010.08.004
27. Lee JJ, Pedley A, Hoffmann U, Massaro JM, Fox CS. Association of changes in abdominal fat quantity and quality with incident cardiovascular disease risk factors. J Am Coll Cardiol. 2016;68(14):1509–1521. doi:10.1016/j.jacc.2016.06.067
28. Jung CH, Kim BY, Kim KJ, et al. Contribution of subcutaneous abdominal fat on ultrasonography to carotid atherosclerosis in patients with type 2 diabetes mellitus. Cardiovasc Diabetol. 2014;13:67. doi:10.1186/1475-2840-13-67
29. Liu J, Fox CS, Hickson DA, et al. Impact of abdominal visceral and subcutaneous adipose tissue on cardiometabolic risk factors: the Jackson heart study. J Clin Endocrinol Metab. 2010;95(12):5419–5426. doi:10.1210/jc.2010-1378
30. Ahmad NM, Halim Haddad F. Suitability of visceral adiposity index as a marker for cardiometabolic risks in Jordanian adults. Nutr Hosp. 2015;32(6):2701–2709. doi:10.3305/nh.2015.32.6.9543
31. Liu J, Tse LA, Liu Z, et al. Predictive values of anthropometric measurements for cardiometabolic risk factors and cardiovascular diseases among 44,048 Chinese. J Am Heart Assoc. 2019;8(16):e010870. doi:10.1161/JAHA.118.010870
32. Canoy D, Boekholdt SM, Wareham N, et al. Body fat distribution and risk of coronary heart disease in men and women in the European Prospective Investigation Into Cancer and Nutrition in Norfolk cohort: a population-based prospective study. Circulation. 2007;116(25):2933–2943. doi:10.1161/CIRCULATIONAHA.106.673756
 © 2021 The Author(s). This work is published and licensed by Dove Medical Press Limited. The full terms of this license are available at https://www.dovepress.com/terms.php and incorporate the Creative Commons Attribution - Non Commercial (unported, v3.0) License.
By accessing the work you hereby accept the Terms. Non-commercial uses of the work are permitted without any further permission from Dove Medical Press Limited, provided the work is properly attributed. For permission for commercial use of this work, please see paragraphs 4.2 and 5 of our Terms.
© 2021 The Author(s). This work is published and licensed by Dove Medical Press Limited. The full terms of this license are available at https://www.dovepress.com/terms.php and incorporate the Creative Commons Attribution - Non Commercial (unported, v3.0) License.
By accessing the work you hereby accept the Terms. Non-commercial uses of the work are permitted without any further permission from Dove Medical Press Limited, provided the work is properly attributed. For permission for commercial use of this work, please see paragraphs 4.2 and 5 of our Terms.