")
Back to Journals » Medical Devices: Evidence and Research » Volume 7
Non-invasive imaging of microcirculation: a technology review
Authors Eriksson S, Nilsson J, Sturesson C
Received 10 August 2014
Accepted for publication 23 October 2014
Published 9 December 2014 Volume 2014:7 Pages 445—452
DOI https://doi.org/10.2147/MDER.S51426
Checked for plagiarism Yes
Review by Single anonymous peer review
Peer reviewer comments 3
Editor who approved publication: Dr Scott Fraser
Sam Eriksson,1,2 Jan Nilsson,1,2 Christian Sturesson1,2
1Department of Surgery, Clinical Sciences Lund, Lund University, 2Skåne University Hospital, Lund, Sweden
Abstract: Microcirculation plays a crucial role in physiological processes of tissue oxygenation and nutritional exchange. Measurement of microcirculation can be applied on many organs in various pathologies. In this paper we aim to review the technique of non-invasive methods for imaging of the microcirculation. Methods covered are: videomicroscopy techniques, laser Doppler perfusion imaging, and laser speckle contrast imaging. Videomicroscopy techniques, such as orthogonal polarization spectral imaging and sidestream dark-field imaging, provide a plentitude of information and offer direct visualization of the microcirculation but have the major drawback that they may give pressure artifacts. Both laser Doppler perfusion imaging and laser speckle contrast imaging allow non-contact measurements but have the disadvantage of their sensitivity to motion artifacts and that they are confined to relative measurement comparisons. Ideal would be a non-contact videomicroscopy method with fully automatic analysis software.
Keywords: laser speckle contrast imaging, sidestream dark-field, orthogonal polarization spectral imaging, laser Doppler imaging
Introduction
Microcirculation is usually defined as small arteries (<150 μm in diameter), arterioles, capillaries, and venules.1,2 It plays a crucial role in physiological processes of tissue oxygenation and nutritional exchange. In addition, studies of microcirculation have shown its involvement in a number of pathological processes, which have increased the interest in studying microcirculation in recent years.
There are several ways to measure microcirculation. Both morphological and functional studies are possible. Morphological parameters measurable with imaging methods include vessel density, rate of perfused vessels and vessel diameter in addition to dynamic measurements of microcirculatory blood flow velocity and blood cell concentration.3
Functional studies, especially targeting microcirculatory endothelial function, include pharmacological tests with vasoactive drugs and post-occlusive reactive hyperemia test.1,4 Post-occlusive hyperemia test is performed by measuring distal flow of microcirculation after a period of proximal vascular occlusion using a cuff with a pressure exceeding the systolic pressure. This is typically used to study forearm microcirculation. Further, microvascular evaluation can be performed with both single-point measurements and imaging methods, giving a full-field image of the microcirculation of a tissue surface. The use of imaging methods is preferable due to the spatial heterogeneity of perfusion seen in microvascular beds. This leads to a better reproducibility using imaging methods which measure larger areas as compared to methods with single-point measurements.5,6 In addition, imaging methods have also been shown to have good inter-day reproducibility.5
One example of the use of microvascular assessment in pathophysiology is in the field of cardiovascular disease. Studies of patients with hypertension and normotensive patients with obesity have shown structural changes in small resistance arteries by an increased tunica media to vessel lumen diameter ratio.7,8 And as for hypertension, these structural changes have been correlated to a higher risk of developing stroke and myocardial infarction.7 Using the post-occlusive reactive hyperemia test, a decrease in post-occlusive flow has been shown in patients with atherosclerosis.9 Thus, as in this model disease, microcirculatory assessment could potentially be used to stage, monitor, and even predict pathological processes and be a useful tool in the assessment of diseases.
In this paper we aim to review the technique of non-invasive methods for imaging the microcirculation and give an overview of their clinical applications. Methods covered in this review include: videomicroscopy techniques, laser Doppler perfusion imaging (LDPI), and laser speckle contrast imaging (LSCI).
Videomicroscopy techniques
Technology
Videomicroscopy techniques can be used for direct visualization of microcirculation and involve orthogonal polarization spectral (OPS) imaging and its successor sidestream dark-field (SDF) imaging. Both techniques are based on the same underlying principles that were developed many years ago.10 However, it was first in 1999 that Groner et al used OPS in a handheld device measuring microcirculation.11
The underlying technique of OPS is described in detail by Groner et al.11 Summarily, polarized light is illuminating the tissue to be examined. Only light that penetrates the tissue more deeply becomes depolarized and by sending the reflected light through a orthogonal polarizer this enables only depolarized light to be passed, thus excluding direct reflections. The collected light then forms an image of the illuminated area and can be recorded with a charge coupled device (CCD) video camera. By polarizing the light from the light source with a wavelength that is absorbed by hemoglobin (548 nm), red blood cells (RBC) will appear dark, thus forming an image of the microcirculation. This results in vessels only being visible if they contain RBC. In Figure 1, the absorption spectrum of oxygenated hemoglobin is shown. OPS imaging has been validated against intravital fluorescence microscopy and conventional capillary microscopy.12–14
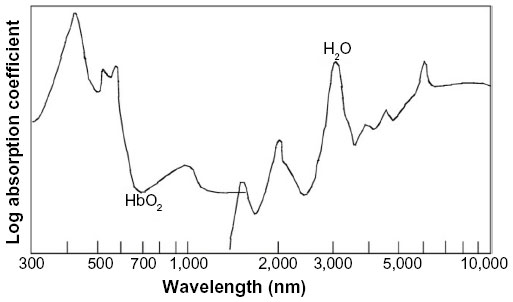 | Figure 1 Absorption spectra in tissue of oxygenated hemoglobin (HbO2) and water. |
Driven by the fact that a relatively strong external light source is needed in OPS imaging and the limited visualization of the capillaries due to blurring, SDF imaging was developed.15,16 In SDF imaging, the light source is made up of concentrically placed light emitting diodes surrounding the optics (see Figure 2). The light emitting diodes provide pulsed green light in synchrony with the CCD frame rate, thus preventing smearing of moving objects. The whole microscope including optics and light source is housed in one handheld device. Like in OPS imaging, the light wavelength is chosen so that the RBC appear dark (530 nm). SDF imaging has been validated by comparison to OPS imaging.16
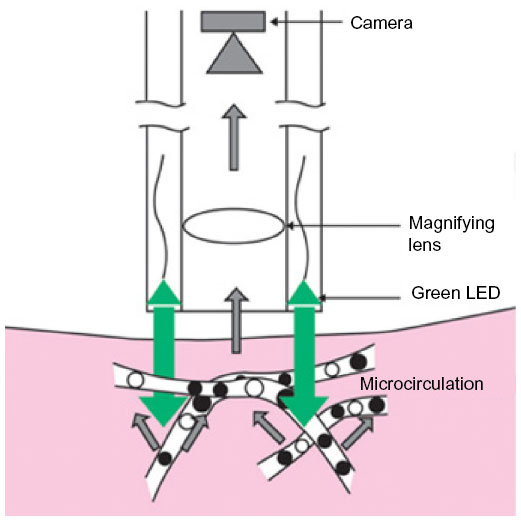 | Figure 2 Sidestream dark-field (SDF) imaging technique. |
These methods allow direct visualization of the microcirculation and vessel diameter, vessel density and red blood cell velocity can be measured. Microcirculatory analysis is made with semi-automatic analysis software. Yet, some manual intervention is still needed. According to MicroVision Medical web page, they are working on a new software package which requires less manual intervention.17 Different analyses scores of microcirculation have been developed and De Backer et al propose the use of proportion of perfused vessels (PPV), perfused vessel density, microvascular flow index (MFI), and heterogeneity index.3 PPV is calculated after manually identifying the amount of vessels that have continuous or intermittent flow. Perfused vessel density is calculated by multiplying vessel density by PPV. MFI score is based on flow characterization (absent, intermittent, sluggish or normal) in the four quadrants of the recorded images of the microcirculation. Finally, heterogeneity index can be calculated by measuring the MFI in three to five sites and then taking the difference between highest MFI minus the lowest MFI divided by the mean flow velocity.
Applications
The most studied area with these techniques is the sublingual mucosa in patients with sepsis where it has been shown that alterations in microvascular blood flow are frequent in patients with sepsis and more severe alterations have been associated with severe disease and a higher mortality rate.18,19 However, several other organs have been studied such as skin, gingiva, conjunctiva, brain, lungs, tongue, liver, gut, ileostomies or colostomies, and rectal mucosa.13,20–30 In liver transplants, assessment of hepatic microcirculation is reported to be predictive of early graft postoperative function and in liver resections, hepatic microcirculation parameters have been used to distinguish histologically damaged livers.27,30 Figure 3 shows a typical SDF image of rat liver parenchyma.
 | Figure 3 Sidestream dark-field (SDF) image of rat liver parenchyma. |
Advantages and limitations
The greatest advantage with videomicroscopic techniques is their direct visualization of the microcirculation. Yet, there are limitations as well. These methods are sensitive to motion and pressure artifacts.16,27,31 Motion can result in movement artifacts and pressure can disturb vessel blood flow. Analysis software has a built-in image stabilization that partly deals with movement artifacts and the use of a stabilization attachment has been suggested.32,33 Also, inability to measure high blood flow velocities has been reported.32,34 Moreover, when using these methods on solid organs, the organ capsule has to be thin.31 Otherwise, the capsule has to be removed before measuring.27 Also, the offline analysis is time consuming, for liver analysis approximately 5 minutes per measurement point.27
LDPI
Technology
Studying retinal perfusion, Riva et al were the first to describe flow measurements in microvascular vessels using laser Doppler flowmetry.35 The technique uses coherent laser light which undergoes a small shift in frequency due to the Doppler effect when striking moving particles such as RBC.36 This only appears when light is reflected on moving objects and reflected light from static tissue surrounding the RBC returns with unchanged frequency. The average amount of change in frequency, called Doppler shift, in the reflected light is proportional to the product of average speed and concentration of RBC. The Doppler shift is the output of laser Doppler flowmetry.
Laser Doppler flowmetry is a single-point technique measuring an average of the microcirculation in about 1 mm3 of tissue. By combining several single measurements over a tissue surface one can create an image of microcirculation of the tissue. This technique is called LDPI.37–39 The standard LDPI apparatus uses a movable mirror that directs the laser beam on the different measurement points, scanning the tissue surface of an area up to 50×50 cm2.40 Figure 4 illustrates a principal model of the LDPI technique.
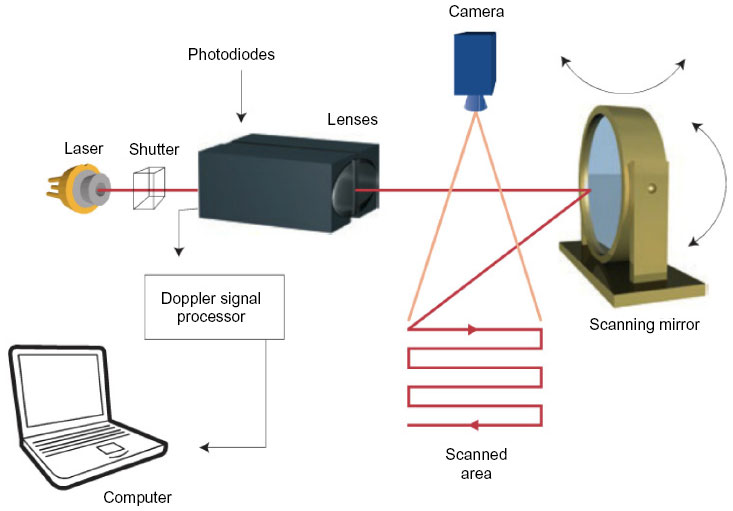 | Figure 4 Laser Doppler perfusion imaging technique. |
Using this approach of mapping with subsequent measuring points is both time consuming and produces large amounts of raw data requiring long processing times. Classically, this has impeded imaging of dynamic processes such as functional tests and increased the susceptibility to motion artifacts.5,36,40 However, in recent years, the introductions of high-speed complementary metal-oxide semiconductor cameras in combination with new ways of mapping algorithms, have shortened measurement times for LDPI substantially.41–43 The experience of these high-speed detectors in clinical settings is still small as compared to the standard mapping techniques.
Measurement depth with LDPI is dependent on laser wavelength and tissue properties but ranges from 1 to 1.5 mm.44 This is deeper than for LSCI (described in the LSCI section) and has to be accounted for when choosing a method for the specific tissue to be studied.
Applications
LDPI has been tested on a large range of organs, skin being the most frequent because of its easy accessibility. One dermatologic application is the use of LDPI for differentiation between malignant and benign skin lesions.45 Further, several studies have been conducted studying different kinds of wounds, including ischemic ulcers, diabetic foot ulcers, and skin burn wounds.46 Studying healing wounds, Gschwandtner et al, have shown increased perfusion in areas of granulation as a marker of angiogenesis, indicating that areas with low perfusion have diminished healing potential.47
Equally, in evaluation of perfusion in skin burns, LDPI can be used to grade the severity of damage of the burnt tissue.48 A high flux indicates superficial damage and low flux a deeper injury. This knowledge has been used to develop a prognostic tool for healing time and helping to decide which patients are in need of surgical treatment.49 In general, prognostic information about healing potential may be used to assist in the choice of wound therapy.
In the pathogenesis of diabetic foot ulcers both micro-angiopathy and autonomous neuropathy contribute to development of ulcers. Besides studying the angiogenesis of the wound healing process, LDPI has been used to study the neural component of the pathogenesis. By using a functional test, using heating and cooling of fingers, the autonomous nerve function have shown to be impaired in the vessels of diabetic patients.50
In addition, application on internal organs has been made in intra-operative settings. Hajivassiliou et al used LDPI on patients undergoing colectomies for inflammatory bowel disease and found inflammatory bowels to have an increased blood flow as compared to normal.51 Studies implementing LDPI in neurosurgery have been carried out in animal models. In a model of cerebral ischemia, Liu et al used LDPI to monitor an increase in cerebral perfusion as a response to albumin infusion.52
Advantages and limitations
On the contrary to videomicroscopy techniques, LDPI has the advantage of being a non-contact method, avoiding interaction with the studied tissue and thus avoiding the generation of pressure artifacts. Furthermore, the possibility of measuring large areas with a good spatial resolution gives LDPI a good reproducibility.5,53 However, measuring average Doppler shift, LDPI cannot evaluate absolute flow properties in eg, mL/s but rather measure relative comparisons of flux which are based on a normalized baseline value and presented as arbitrary flux units.54
The LDPI apparatus requires calibration before measurement due to the presence of a biological zero signal. Even during complete flow occlusion, the LDPI output signal would not be zero due to noise in the Doppler signal, denoted as the biological zero. The noise has been suggested to consist of local redistribution of blood cells within the vessels and Brownian motions of molecules.40 How to interpret and handle the biological zero is under debate and needs to be investigated further.55,56
In addition, the standard LDPI setting using a scanning technique requires measurement times of about a minute, which gives the method a low temporal resolution, unsuitable for functional tests. The new high-speed methods may provide a solution to the problem, but currently the clinical experience is low.
LSCI
Technology
Another laser based technique for microvascular imaging is LSCI. Laser light illuminating biological tissue gives rise to a light phenomenon called laser speckle.57 Laser speckle arises from the irregularities in the structure of the tissue, which backscatter the laser light irregularly, creating dark and light interference patterns. These patterns can be detected by a CCD camera. The speckle pattern of tissue changes with movement within the tissue such as blood flow,58 creating blurring of the image on the capturing camera. Speckle contrast is a quantification of the blurring at a given exposure time of the camera. Increased blood flow will increase image blurring thus lowering the contrast which is measured as the ratio of the standard deviation to the mean grayscale intensity in a square of pixels (eg, 5×5 pixels), thus representing the average velocity and concentration of moving particles in that square.44 LDPI and LSCI are related methods but rely on different physical theories and have different ways of data sampling. LSCI does not use a scanning technique as LDPI but instead measures nearly instantly the whole tissue under study enabling fast measurements with a high sampling rate. As for LDPI, LSCI measures average velocity and data are presented in an arbitrary unit.
A correlation of perfusion results between the two methods at different perfusion rates has been made showing LSCI to have a non-linear relation to blood flow and to LDPI, especially at low blood flows.59 The need for a new algorithm for comparison of the methods has been suggested.60 However, LSCI measuring depth is more superficial at about 300 μm as compared to the measuring depth of 1–1.5 mm of LDPI, which has to be accounted for when choosing a measuring technique for specific organs.40 On skin, for example, LSCI measures the more superficial slower flowing vessels while LDPI measures deeper, faster flowing vessels hence giving different results.
Applications
Briers and Fercher made the first clinical measurements with laser speckle photography on retinal perfusion in the 1980s61 and later developments of the technique led to real-time perfusion imaging with LSCI.62,63 Having faster temporal resolution than standard LDPI setups, LSCI has proven a useful method in functional tests of skin microcirculation.1 For instance, studies of burn injuries have correlated faster healing times with increased perfusion in the first week post-injury assessed with LSCI.64 Further, LSCI has been of interest in the assessment of intraoperative cerebral microcirculation where local cerebral blood flow has been measured after revascularization surgery.65 Bezemer et al have proposed LSCI for monitoring renal cortex ischemia/reperfusion injury.6 LSCI has also proven useful in the assessment of hepatic microcirculation during liver resection surgery.33,66 A typical example of an LSCI measurement of human liver is shown in Figure 5.
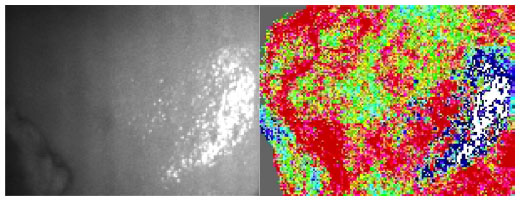 | Figure 5 Laser speckle contrast image of human liver. |
Advantages and limitations
An advantage of LSCI is its fast measurement time, nearly instantly measuring the microcirculation over a large area. This makes LSCI suitable for dynamic functional tests requiring high temporal resolution. Comparative studies of LDPI and LSCI have been made highlighting the advantages of faster measurement time with LSCI compared to LDPI.40,67 In addition, LSCI has good reproducibility.5 Another advantage is that the method is non-contact, not interacting with the tissue under study.
However, LSCI is sensitive to movement artifacts.1,66 Techniques of handling these artifacts have been suggested by using an opaque reference area for subtraction of artifact signals.68,69
Relying on similar physical principles as LDPI, LSCI also suffers from a biological zero signal, but for LSCI it is even larger. Likewise, because the LSCI signal is based on the average velocity and concentration of RBC, values cannot be given in absolute numbers, but are limited to relative measurements.
Conclusion and future challenges
In this paper we have reviewed three different techniques for imaging the microcirculation and presented examples of several different clinical applications. When choosing a method for study of a specific organ and pathological process it is important to consider the different properties of the methods. To measure the dynamic processes of functional tests, imaging methods with high temporal resolution have to be used, thus methods with fast measuring times are required. Differences in measurement depth have to be considered as the differences in optical properties of tissues.
The non-contact methods do not affect the tissue with pressure. However, they are more susceptible to motion artifacts, which both LDPI and LSCI cannot automatically differentiate from the movements of RBC. Further, LDPI and LSCI measures relative flow properties and are in need of calibration due to a relatively large biological zero signal, which is not the case for videomicroscopy techniques. Videomicroscopy techniques also have the benefit of offering direct visualization of microcirculation. In Table 1, the major differences between the methods are presented.
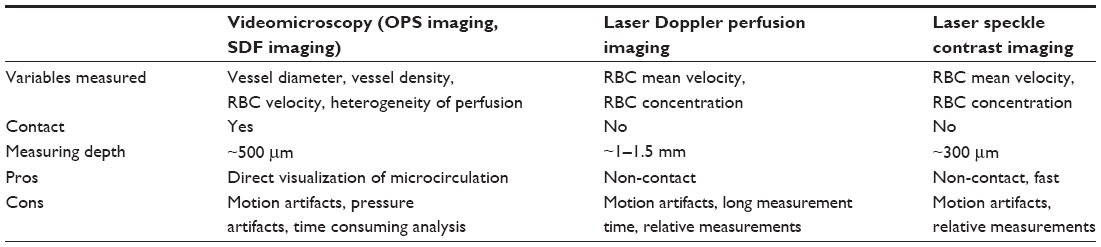 | Table 1 Overview of microcirculation imaging methods |
Regardless of the choice of technique, a challenge lies in the interpretation of the measurement output and its relation to physiological and pathological processes. The methods offer several output variables and careful thought has to be given to which one is of importance. In an attempt to solve this problem, expert conferences have been carried out, trying to set standards for experimental settings and define output variables of each technique.3,54
Another challenge is to compare microcirculatory results between different methods. Several studies have been conducted, attempting to compare the results of different techniques.33,59,60 These are important efforts for the understanding of the microvascular results and will make microcirculatory imaging more accessible for use in the clinical assessment of patients.
In the authors’ opinion, future improvement of imaging methods should focus on developing methods which allow measurement without interaction of the studied tissue, such as a non-contact method. In addition, measurements must be fast to decrease vulnerability to motion artifacts and making it possible to study dynamic processes. To simplify the interpretation of the output, data should be given in an absolute variable, for example flow in mL/s. Finally data analysis should be automatic.
Measurement of microcirculation can be applied to many organs in various pathologies. Above, examples of clinical fields of applications have been presented. The numerous skin applications described above are an example of how imaging techniques can be used to assist the clinician in staging, monitoring, and even predicting pathological processes and be a useful tool in the assessment of patients. Still, great potential lies in the implementation of microvascular imaging systems for intraoperative assessment and future studies may outline new fields of use.
Disclosure
The authors report no conflicts of interest in this work.
References
Roustit M, Cracowski JL. Assessment of endothelial and neurovascular function in human skin microcirculation. Trends Pharmacol Sci. 2013;34(7):373–384. | |
Rizzoni D, Aalkjaer C, De Ciuceis C, et al. How to assess microvascular structure in humans. High Blood Press Cardiovasc Prev. 2011;18(4):169–177. | |
De Backer D, Hollenberg S, Boerma C, et al. How to evaluate the microcirculation: report of a round table conference. Crit Care. 2007;11(5):R101. | |
Cracowski JL, Minson CT, Salvat-Melis M, Halliwill JR. Methodological issues in the assessment of skin microvascular endothelial function in humans. Trends Pharmacol Sci. 2006;27(9):503–508. | |
Roustit M, Millet C, Blaise S, Dufournet B, Cracowski JL. Excellent reproducibility of laser speckle contrast imaging to assess skin microvascular reactivity. Microvasc Res. 2010;80(3):505–511. | |
Bezemer R, Legrand M, Klijn E, et al. Real-time assessment of renal cortical microvascular perfusion heterogeneities using near-infrared laser speckle imaging. Opt Express. 2010;18(14):15054–15061. | |
De Ciuceis C, Porteri E, Rizzoni D, et al. Structural alterations of subcutaneous small-resistance arteries may predict major cardiovascular events in patients with hypertension. Am J Hypertens. 2007;20(8):846–852. | |
Grassi G, Seravalle G, Scopelliti F, et al. Structural and functional alterations of subcutaneous small resistance arteries in severe human obesity. Obesity (Silver Spring). 2010;18(1):92–98. | |
Rossi M, Matteucci E, Pesce M, et al. Peripheral microvascular dysfunction as an independent predictor of atherosclerotic damage in type 1 diabetes patients: a preliminary study. Clin Hemorheol Microcirc. 2013;54(4):381–391. | |
Sherman H, Klausner S, Cook WA. Incident dark-field illumination: a new method for microcirculatory study. Angiology. 1971;22(5):295–303. | |
Groner W, Winkelman JW, Harris AG, et al. Orthogonal polarization spectral imaging: a new method for study of the microcirculation. Nat Med. 1999;5(10):1209–1212. | |
Biberthaler P, Langer S, Luchting B, Khandoga A, Messmer K. In vivo assessment of colon microcirculation: comparison of the new OPS imaging technique with intravital microscopy. Eur J Med Res. 2001;6(12):525–534. | |
Mathura KR, Vollebregt KC, Boer K, De Graaff JC, Ubbink DT, Ince C. Comparison of OPS imaging and conventional capillary microscopy to study the human microcirculation. J Appl Physiol (1985). 2001;91(1):74–78. | |
Harris AG, Sinitsina I, Messmer K. Validation of OPS imaging for microvascular measurements during isovolumic hemodilution and low hematocrits. Am J Physiol Heart Circ Physiol. 2002;282(4):H1502–H1509. | |
Ince C. Sidestream dark field imaging: an improved technique to observe sublingual microcirculation. Crit Care. 2005;9(Suppl 1):72. | |
Goedhart PT, Khalilzada M, Bezemer R, Merza J, Ince C. Sidestream Dark Field (SDF) imaging: a novel stroboscopic LED ring-based imaging modality for clinical assessment of the microcirculation. Opt Express. 2007;15(23):15101–15114. | |
MicroVisionMedical [homepage on the Internet]. Available from: http://www.microvisionmedical.com/. Accessed June 1, 2013. | |
De Backer D, Creteur J, Preiser JC, Dubois MJ, Vincent JL. Microvascular blood flow is altered in patients with sepsis. Am J Respir Crit Care Med. 2002;166(1):98–104. | |
Paize F, Sarginson R, Makwana N, et al. Changes in the sublingual microcirculation and endothelial adhesion molecules during the course of severe meningococcal disease treated in the paediatric intensive care unit. Intensive Care Med. 2012;38(5):863–871. | |
Lupi O, Semenovitch I, Treu C, Bouskela E. Orthogonal polarization technique in the assessment of human skin microcirculation. Int J Dermatol. 2008;47(5):425–431. | |
Lindeboom JA, Mathura KR, Harkisoen S, van den Akker HP, Ince C. Effect of smoking on the gingival capillary density: assessment of gingival capillary density with orthogonal polarization spectral imaging. J Clin Periodontol. 2005;32(12):1208–1212. | |
Schaser KD, Settmacher U, Puhl G, et al. Noninvasive analysis of conjunctival microcirculation during carotid artery surgery reveals microvascular evidence of collateral compensation and stenosis-dependent adaptation. J Vasc Surg. 2003;37(4):789–797. | |
Pennings FA, Ince C, Bouma GJ. Continuous real-time visualization of the human cerebral microcirculation during arteriovenous malformation surgery using orthogonal polarization spectral imaging. Neurosurgery. 2006;59(1):167–171. | |
den Uil CA, Bezemer R, Miranda DR, et al. Intra-operative assessment of human pulmonary alveoli in vivo using Sidestream Dark Field imaging: a feasibility study. Med Sci Monit. 2009;15(10):MT137–MT141. | |
Dubin A, Pozo MO, Ferrara G, et al. Systemic and microcirculatory responses to progressive hemorrhage. Intensive Care Med. 2009;35(3):556–564. | |
Puhl G, Schaser KD, Vollmar B, Menger MD, Settmacher U. Noninvasive in vivo analysis of the human hepatic microcirculation using orthogonal polorization spectral imaging. Transplantation. 2003;75(6):756–761. | |
Nilsson J, Eriksson S, Blind PJ, Rissler P, Sturesson C. Microcirculation changes during liver resection – a clinical study. Microvasc Res. 2014;94:47–51. | |
Boerma EC, van der Voort PH, Spronk PE, Ince C. Relationship between sublingual and intestinal microcirculatory perfusion in patients with abdominal sepsis. Crit Care Med. 2007;35(4):1055–1060. | |
Dondorp AM, Ince C, Charunwatthana P, et al. Direct in vivo assessment of microcirculatory dysfunction in severe falciparum malaria. J Infect Dis. 2008;197(1):79–84. | |
Puhl G, Schaser KD, Pust D, et al. Initial hepatic microcirculation correlates with early graft function in human orthotopic liver transplantation. Liver Transpl. 2005;11(5):555–563. | |
De Backer D, Ospina-Tascon G, Salgado D, Favory R, Creteur J, Vincent JL. Monitoring the microcirculation in the critically ill patient: current methods and future approaches. Intensive Care Med. 2010;36(11):1813–1825. | |
Lindert J, Werner J, Redlin M, Kuppe H, Habazettl H, Pries AR. OPS imaging of human microcirculation: a short technical report. J Vasc Res. 2002;39(4):368–372. | |
Sturesson C, Milstein DM, Post IC, Maas AM, van Gulik TM. Laser speckle contrast imaging for assessment of liver microcirculation. Microvasc Res. 2013;87:34–40. | |
Cerny V, Turek Z, Parizkova R. Orthogonal polarization spectral imaging. Physiol Res. 2007;56(2):141–147. | |
Riva C, Ross B, Benedek GB. Laser Doppler measurements of blood flow in capillary tubes and retinal arteries. Invest Ophthalmol. 1972;11(11):936–944. | |
Humeau A, Steenbergen W, Nilsson H, Stromberg T. Laser Doppler perfusion monitoring and imaging: novel approaches. Med Biol Eng Comput. 2007;45(5):421–435. | |
Essex TJ, Byrne PO. A laser Doppler scanner for imaging blood flow in skin. J Biomed Eng. 1991;13(3):189–194. | |
Nilsson GE, Tenland T, Oberg PA. Evaluation of a laser Doppler flowmeter for measurement of tissue blood flow. IEEE Trans Biomed Eng. 1980;27(10):597–604. | |
Wardell K, Jakobsson A, Nilsson GE. Laser Doppler perfusion imaging by dynamic light scattering. IEEE Trans Biomed Eng. 1993;40(4):309–316. | |
O’Doherty J, McNamara P, Clancy NT, Enfield JG, Leahy MJ. Comparison of instruments for investigation of microcirculatory blood flow and red blood cell concentration. J Biomed Opt. 2009;14(3):034025. | |
Serov A, Steinacher B, Lasser T. Full-field laser Doppler perfusion imaging and monitoring with an intelligent CMOS camera. Opt Express. 2005;13(10):3681–3689. | |
Leutenegger M, Martin-Williams E, Harbi P, et al. Real-time full field laser Doppler imaging. Biomed Opt Express. 2011;2(6):1470–1477. | |
Draijer M, Hondebrink E, van Leeuwen T, Steenbergen W. Twente Optical Perfusion Camera: system overview and performance for video rate laser Doppler perfusion imaging. Opt Express. 2009;17(5):3211–3225. | |
Briers JD. Laser Doppler, speckle and related techniques for blood perfusion mapping and imaging. Physiol Meas. 2001;22(4):R35–R66. | |
Stucker M, Horstmann I, Nuchel C, Rochling A, Hoffmann K, Altmeyer P. Blood flow compared in benign melanocytic naevi, malignant melanomas and basal cell carcinomas. Clin Exp Dermatol. 1999;24(2):107–111. | |
Khan F, Newton DJ. Laser Doppler imaging in the investigation of lower limb wounds. Int J Low Extrem Wounds. 2003;2(2):74–86. | |
Gschwandtner ME, Ambrozy E, Schneider B, Fasching S, Willfort A, Ehringer H. Laser Doppler imaging and capillary microscopy in ischemic ulcers. Atherosclerosis. 1999;142(1):225–232. | |
Niazi ZB, Essex TJ, Papini R, Scott D, McLean NR, Black MJ. New laser Doppler scanner, a valuable adjunct in burn depth assessment. Burns. 1993;19(6):485–489. | |
Pape SA, Baker RD, Wilson D, et al. Burn wound healing time assessed by laser Doppler imaging (LDI). Part 1: Derivation of a dedicated colour code for image interpretation. Burns. 2012;38(2):187–194. | |
Freccero C, Svensson H, Bornmyr S, Wollmer P, Sundkvist G. Sympathetic and parasympathetic neuropathy are frequent in both type 1 and type 2 diabetic patients. Diabetes Care. 2004;27(12):2936–2941. | |
Hajivassiliou CA, Greer K, Fisher A, Finlay IG. Non-invasive measurement of colonic blood flow distribution using laser Doppler imaging. Br J Surg. 1998;85(1):52–55. | |
Liu Y, Belayev L, Zhao W, Busto R, Belayev A, Ginsberg MD. Neuroprotective effect of treatment with human albumin in permanent focal cerebral ischemia: histopathology and cortical perfusion studies. Eur J Pharmacol. 2001;428(2):193–201. | |
Klonizakis M, Manning G, Donnelly R. Assessment of lower limb microcirculation: exploring the reproducibility and clinical application of laser Doppler techniques. Skin Pharmacol Physiol. 2011;24(3):136–143. | |
Fullerton A, Stucker M, Wilhelm KP, et al. Guidelines for visualization of cutaneous blood flow by laser Doppler perfusion imaging. A report from the Standardization Group of the European Society of Contact Dermatitis based upon the HIRELADO European community project. Contact Dermatitis. 2002;46(3):129–140. | |
Zhong J, Seifalian AM, Salerud GE, Nilsson GE. A mathematical analysis on the biological zero problem in laser Doppler flowmetry. IEEE Trans Biomed Eng. 1998;45(3):354–364. | |
Humeau-Heurtier A, Abraham P, Mahe G. Linguistic analysis of laser speckle contrast images recorded at rest and during biological zero: comparison with laser Doppler flowmetry data. IEEE Trans Med Imaging. Epub September 16, 2013. | |
Rigden JD, Gordon EI. The granularity of scattered optical maser light. Proc IRE. 1962;50:2367–2368. | |
Stern MD. In vivo evaluation of microcirculation by coherent light scattering. Nature. 1975;254(5495):56–58. | |
Tew GA, Klonizakis M, Crank H, Briers JD, Hodges GJ. Comparison of laser speckle contrast imaging with laser Doppler for assessing microvascular function. Microvasc Res. 2011;82(3):326–332. | |
Binzoni T, Humeau-Heurtier A, Abraham P, Mahe G. Blood perfusion values of laser speckle contrast imaging and laser Doppler flowmetry: is a direct comparison possible? IEEE Trans Biomed Eng. 2013;60(5):1259–1265. | |
Briers JD, Fercher AF. Retinal blood-flow visualization by means of laser speckle photography. Invest Ophthalmol Vis Sci. 1982;22(2):255–259. | |
Briers JD, Webster S. Laser speckle contrast analysis (LASCA): a nonscanning, full-field technique for monitoring capillary blood flow. J Biomed Opt. 1996;1(2):174–179. | |
Briers JD, Richards G, He XW. Capillary Blood Flow Monitoring Using Laser Speckle Contrast Analysis (LASCA). J Biomed Opt. 1999;4(1):164–175. | |
Lindahl F, Tesselaar E, Sjoberg F. Assessing paediatric scald injuries using Laser Speckle Contrast Imaging. Burns. 2013;39(4):662–666. | |
Hecht N, Woitzik J, Dreier JP, Vajkoczy P. Intraoperative monitoring of cerebral blood flow by laser speckle contrast analysis. Neurosurg Focus. 2009;27(4):E11. | |
Eriksson S, Nilsson J, Lindell G, Sturesson C. Laser speckle contrast imaging for intraoperative assessment of liver microcirculation: a clinical pilot study. Med Devices (Auckl). 2014;7(4):257–261. | |
Stewart CJ, Frank R, Forrester KR, Tulip J, Lindsay R, Bray RC. A comparison of two laser-based methods for determination of burn scar perfusion: laser Doppler versus laser speckle imaging. Burns. 2005;31(6):744–752. | |
Mahe G, Abraham P, Le Faucheur A, Bruneau A, Humeau-Heurtier A, Durand S. Cutaneous microvascular functional assessment during exercise: a novel approach using laser speckle contrast imaging. Pflugers Arch. 2013;465(4):451–458. | |
Mahe G, Rousseau P, Durand S, Bricq S, Leftheriotis G, Abraham P. Laser speckle contrast imaging accurately measures blood flow over moving skin surfaces. Microvasc Res. 2011;81(2):183–188. | |
MoorInstuments [homepage on the Internet]. Available from: http://gb.moor.co.uk/. Accessed October 26, 2014. |
 © 2014 The Author(s). This work is published and licensed by Dove Medical Press Limited. The full terms of this license are available at https://www.dovepress.com/terms.php and incorporate the Creative Commons Attribution - Non Commercial (unported, v3.0) License.
By accessing the work you hereby accept the Terms. Non-commercial uses of the work are permitted without any further permission from Dove Medical Press Limited, provided the work is properly attributed. For permission for commercial use of this work, please see paragraphs 4.2 and 5 of our Terms.
© 2014 The Author(s). This work is published and licensed by Dove Medical Press Limited. The full terms of this license are available at https://www.dovepress.com/terms.php and incorporate the Creative Commons Attribution - Non Commercial (unported, v3.0) License.
By accessing the work you hereby accept the Terms. Non-commercial uses of the work are permitted without any further permission from Dove Medical Press Limited, provided the work is properly attributed. For permission for commercial use of this work, please see paragraphs 4.2 and 5 of our Terms.