")
Back to Journals » OncoTargets and Therapy » Volume 13
Nomograms for Prediction of Molecular Phenotypes in Colorectal Cancer
Authors Yu Z , Yu H , Zou Q, Huang Z , Wang X , Tang G, Bai L, Zhou C, Zhuang Z, Xie Y, Wang H, Xu G , Chen Z , Fu X , Huang M, Luo Y
Received 13 October 2019
Accepted for publication 24 December 2019
Published 13 January 2020 Volume 2020:13 Pages 309—321
DOI https://doi.org/10.2147/OTT.S234495
Checked for plagiarism Yes
Review by Single anonymous peer review
Peer reviewer comments 2
Editor who approved publication: Dr Federico Perche
Zhuojun Yu, 1–3,* Huichuan Yu, 1,* Qi Zou, 1, 4 Zenghong Huang, 1, 2 Xiaolin Wang, 1 Guannan Tang, 1 Liangliang Bai, 1 Chuanhai Zhou, 1–3 Zhuokai Zhuang, 1, 2 Yumo Xie, 1, 2 Heng Wang, 1 Gaopo Xu, 1 Zijian Chen, 1, 5 Xinhui Fu, 1, 6 Meijin Huang, 1, 2 Yanxin Luo 2
1Guangdong Institute of Gastroenterology, Guangdong Provincial Key Laboratory of Colorectal and Pelvic Floor Disease, The Sixth Affiliated Hospital, Sun Yat-sen University, Guangzhou, Guangdong 510655, People’s Republic of China; 2Department of Colorectal Surgery, The Sixth Affiliated Hospital, Sun Yat-sen University, Guangzhou, Guangdong 510655, People’s Republic of China; 3Zhongshan School of Medicine, Sun Yat-sen University, Guangzhou, Guangdong 510655, People’s Republic of China; 4Department of Colorectal and Anal Surgery, The Sixth Affiliated Hospital, Sun Yat-sen University, Guangzhou, Guangdong 510655, People’s Republic of China; 5Department of Gastrointestinal Surgery, The Sixth Affiliated Hospital, Sun Yat-sen University, Guangzhou, Guangdong 510655, People’s Republic of China; 6Department of Pathology, The Sixth Affiliated Hospital, Sun Yat-sen University, Guangzhou, People’s Republic of China
*These authors contributed equally to this work
Correspondence: Huichuan Yu
Guangdong Institute of Gastroenterology, Guangdong Provincial Key Laboratory of Colorectal and Pelvic Floor Disease, The Sixth Affiliated Hospital, Sun Yat-sen University, 26 Yuancun Erheng Road, Guangzhou, Guangdong 510655, People’s Republic of China
Tel +86-18302044819
Email [email protected]
Yanxin Luo
Department of Colorectal Surgery, The Sixth Affiliated Hospital, Sun Yat-sen University, 26 Yuancun Erheng Road, Guangzhou, Guangdong 510655, People’s Republic of China
Tel +86-13826190263
Email [email protected]
Background: Colorectal cancer (CRC) patients with different molecular phenotypes, including microsatellite instability (MSI), CpG island methylator phenotype (CIMP), and somatic mutations in BRAF and KRAS gene, vary in treatment response and prognosis. However, molecular phenotyping under adequate quality control in a community-based setting may be difficult. We aimed to build the nomograms based on easily accessible clinicopathological characteristics to predict molecular phenotypes.
Methods: Three hundred and six patients with pathologically confirmed stage I-IV CRC were included in the cohort. The assays for MSI, CIMP, and mutations in BRAF and KRAS gene were performed using resected tumor samples. The candidate predictors were identified from clinicopathological variables using multivariate Logistic regression analyses to construct the nomograms that could predict each molecular phenotype.
Results: The incidences of MSI, CIMP, BRAF mutation and KRAS mutation were 25.3% (72/285), 2.5% (7/270), 3.4% (10/293), and 34.8% (96/276) respectively. In the multivariate Logistic analysis, poor differentiation and high neutrophil/lymphocyte ratio (NLR) were independently associated with MSI; poor differentiation, high NLR and high carcinoembryonic antigen/tumor size ratio (CSR) were independently associated with CIMP; poor differentiation, lymphovascular invasion and high CSR were independently associated with BRAF mutation; poor differentiation, proximal tumor, mucinous tumor and high NLR were independently associated with KRAS mutation. Four nomograms for MSI, CIMP, BRAF mutation and KRAS mutation were developed based on these independent predictors, the C-indexes of which were 61.22% (95% CI: 60.28– 62.16%), 95.57% (95% CI: 95.20– 95.94%), 83.56% (95% CI: 81.54– 85.58%), and 69.12% (95% CI: 68.30– 69.94%) respectively.
Conclusion: We established four nomograms using easily accessible variables that could well predict the presence of MSI, CIMP, BRAF mutation and KRAS mutation in CRC patients.
Keywords: colorectal cancer, microsatellite instability, CpG island methylator phenotype, BRAF, KRAS, nomogram, prediction of molecular subtypes
Introduction
Colorectal cancer (CRC) is one of the most prevalent and fatal cancers worldwide.1,2 CRC is widely recognized as a result of gradual accumulations of genetic and epigenetic changes involving in different genes and pathways, and thus it is considered as a disease with high heterogeneity.3 This heterogeneous nature confers the variation of CRC patients in treatment response and prognosis. Several molecular phenotypes have been studied to investigate CRC heterogeneity in past decades. Among them, microsatellite instability (MSI), CpG island methylator phenotype (CIMP), and somatic mutations in BRAF and KRAS exons were most widely used in clinical decision-making.4,5
It has been suggested that 5-fluorouracil (5-FU) is an effective chemotherapeutic agent to markedly improve CRC survival in past decades.6 The regimen incorporating irinotecan and capecitabine is a well-established option for use as first-line, second-line and sequential treatment of CRC.7 However, adverse effects on survival were found when oxaliplatin or adjuvant treatment with 5-FU was applied in patients with MSI, while they had a special sensitivity to irinotecan.8–10 Moreover, several studies have shown that a CIMP (+) phenotype might improve the therapeutic effect of 5-FU treatment.11,12
The molecular phenotyping can guide the targeted therapy and immune-checkpoint treatments as well. The response to anti-epidermal growth factor receptor (EGFR) therapy, including cetuximab and panitumumab, also varies in molecular subtypes. It has been well documented that the patients with KRAS mutations would be resistant to anti-EGFR therapies, and thus anti-EGFR agents should be avoided in this subgroup of patients.3 In BRAF-mutant CRCs with advanced stages, the FOLFOXIRI regimen (irinotecan, oxaliplatin, 5-FU and leucovorin) and bevacizumab were considered as a favourable treatment, but they can benefit from oxaliplatin as well as patients with MSI does.8 An anti-EGFR may also be resisted in CIMP-high CRCs that display extensive DNA promoter hypermethylation and tumor suppressor gene repression. In addition, DNA methylation inhibition may be an efficient treatment for tumors with CIMP.13 Of note, MSI has become one of the most popular biomarkers in CRC and other cancers for treatment response to immune checkpoint blockades.8–10 BRAF mutation and CIMP have also been considered as promising prognostic markers in CRC.14
Given the values of these subtypes in distinguishing prognosis and response to therapies, molecular phenotyping is deserved in clinical decision-making. Unfortunately, testing tumor samples for molecular subtype under adequate quality control in a community-based setting sometimes may be difficult due to cost and technique limit, but clinicopathological information is easy-to-get in almost all clinical settings. Therefore, understanding the clinicopathological factors that could predict the presence of MSI, CIMP, and mutations in BRAF and KRAS is becoming crucial to provide crude molecular information for primary care physicians and assist molecular phenotyping for pathologists. Several studies have revealed the specific clinicopathological features associated with each molecular subtype.15–18 For example, CRCs with right-side location or poor differentiation have been shown to be associated with MSI-high, CIMP (+) and BRAF mutation. In addition, CIMP (+), BRAF mutation and KRAS mutation were more frequent in elderly female patients. Our study, therefore, aimed to conduct a comprehensive association analysis of clinicopathological variables with MSI, CIMP, and mutations in BRAF and KRAS, and establish nomograms using these easily accessible predictors for each molecular phenotype to make them be well used in clinical practice.
Materials and Methods
Patients
The eligible patients were identified from the prospectively collected tissue bank of our institute from 2009 to 2012. Three hundred and six patients with pathologically confirmed stage I-IV CRC were included. As shown in Figure 1, the patients with multiple primary cancers, inflammatory bowel disease, tumor samples having extensive DNA degradation and missing medical records, Lynch syndrome, familial adenomatous polyposis, and other hereditary cancer syndromes were excluded. To avoid the potential influence of chemo/radiotherapy on CIMP test and clonal selection of other molecular phenotypes, the patients receiving chemo/radiotherapy before sample collecting were excluded. All the patients were treated and followed according to the NCCN guideline-based protocols in our institute.19,20 The demographic and clinicopathological information of included patients were collected from the medical record. The tumors located in ascending and transverse colon were defined as proximal tumor, while the distal tumor includes the tumors located in descending colon, sigmoid colon, and rectum.21 This study was approved by the Institutional Review Board of the Six Affiliated Hospital of Sun Yat-sen University and conducted in compliance with the Declaration of Helsinki. The written informed consent was obtained from the patients included in this study.
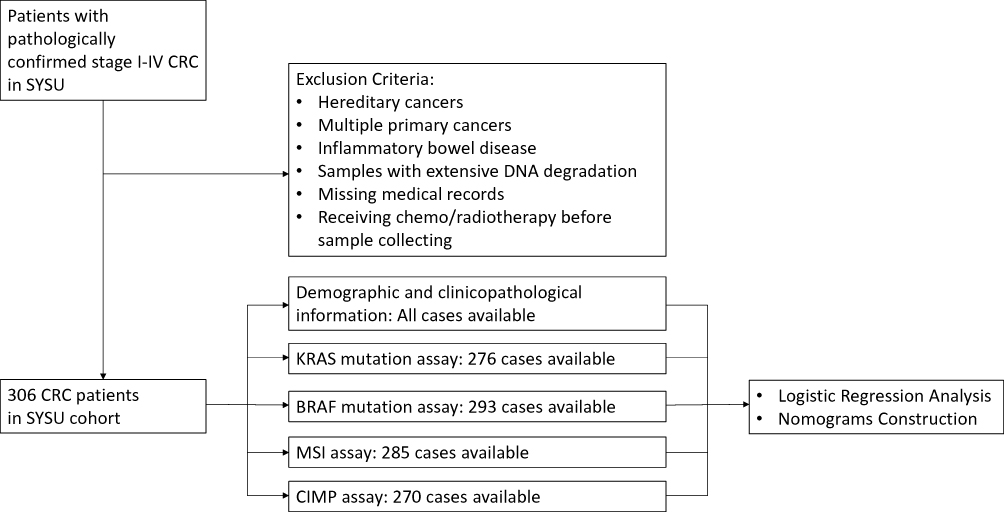 |
Figure 1 Flow diagram for patient disposition and molecular assays to construct the nomograms for prediction of molecular phenotypes. |
Mutational Analysis for KRAS and BRAF
The KRAS exon 2 and BRAFV600E mutation status of resected tumor samples were determined by Sanger sequencing. These mutation analyses were performed at the Molecular Laboratory of our institute under a high-quality control as previously described.22
CIMP Assay
To determine the CpG Island Methylator Phenotype (CIMP) in tumor samples, DNA was extracted (Qiagen, 51306) and bisulfite-treated (Zymo Research, D5002) according to the manufacturer’s protocol. The assay panel, including promoters of five genes (CACNA1G, IGF2, NEUROG1, RUNX3, SOCS1),23 was exploited to assess CIMP using quantitative methylation-specific PCR (qMSP) as previously described.24,25
Microsatellite Analysis
Microsatellite status was analyzed based on five commonly used markers of microsatellite sequence: BAT-25, BAT-26, NR-21, NR-22, and NR-24 using a fluorescence-based pentaplex polymerase chain reaction technique and capillary electrophoresis.26,27
Statistical Analysis
The potential predictive variables, including albumin (≤40 vs >40 g/L), total protein (≤60 vs >60 g/L), platelet counts (≤300×109/L vs >300×109/L), hemoglobin (≤110 vs >110 g/L), MCH (≤27 vs >27 pg), MCHC (≤320 vs >320 g/L), CEA (>5 vs ≤5 ng/mL), AFP (>25 vs ≤25 ng/mL), CA19-9 (≤37 vs >37 kU/L), CA125 (≤35 vs >35 kU/L), and CA153 (≤25 vs >25 kU/L), were preoperatively determined and categorized according to previous studies.20,28,29 BMI (<18.5 vs 18.5–24 vs ≥24 kg/m2) was categorized according to the reference standard in Chinese populations.30 The preoperative CEA/tumor size ratio (CSR), defined as the ratio of CEA level and the maximum tumor diameter, was exploited to evaluate the CEA level per tumor volume as we previously described.31 We used the preoperative neutrophil/lymphocyte ratio (NLR) and platelet/lymphocyte ratio (PLR) to determine the baseline systemic inflammation status in patients,32,33 and receiver operating characteristic curve (ROC) analysis was used to identify the optimum cutoff point for these variables (Supplementary Figure 1 and Supplementary Table 1).
Descriptive statistics were used to summarize baseline characteristics between patients with different molecular phenotypes, and the variables were compared using the Chi-square test or Rank-sum test according to their distributions. To estimate the predictive value of variables for each molecular phenotype, univariate Logistic regression analysis was used, and the odds ratio (OR) and the 95% confidence intervals (95% CI) were calculated. The variables considered significant in the univariate logistic regression analysis were further entered into the backward stepwise multivariable logistic regression analysis, based on which nomograms were constructed to predict the status of CIMP, MSI, KRAS mutation and BRAF mutation. The C-index was acquired for each nomogram, and internal validation using the bootstrap method was performed to determine the adjusted C-index. Calibration curves of the nomograms were generated to show the relationship between the predicted and observed outcomes. The SPSS (23.0) and R (3.6.0) were used for all analyses. The significant values were 2-tailed, and all variables were considered statistically significant if P values were less than 0.05.
Results
Three hundred and six patients meeting the inclusion and exclusion criteria were finally included in this study. Among them, the assays for MSI, CIMP, BRAF mutation, and KRAS mutation are available in 285, 270, 293, 276 patients, respectively (Figure 1), the incidences of which were 25.3% (72/285), 2.5% (7/270), 3.4% (10/293), and 34.8% (96/276) respectively. In consistent with previous studies, patients with CIMP (+) are tightly associated with the status of BRAF mutation (83.3% vs 1.7%, P < 0.001, Table 1). In addition, patients with MSI had significantly higher CIMP (+) frequency (6.9% vs 0.5%, P = 0.004, Table 1), and patients with KRAS mutation had significantly higher BRAF mutation rate (5.6% vs 0%, P = 0.017, Table 1). Patients’ baseline characteristics are summarized in Table 1.
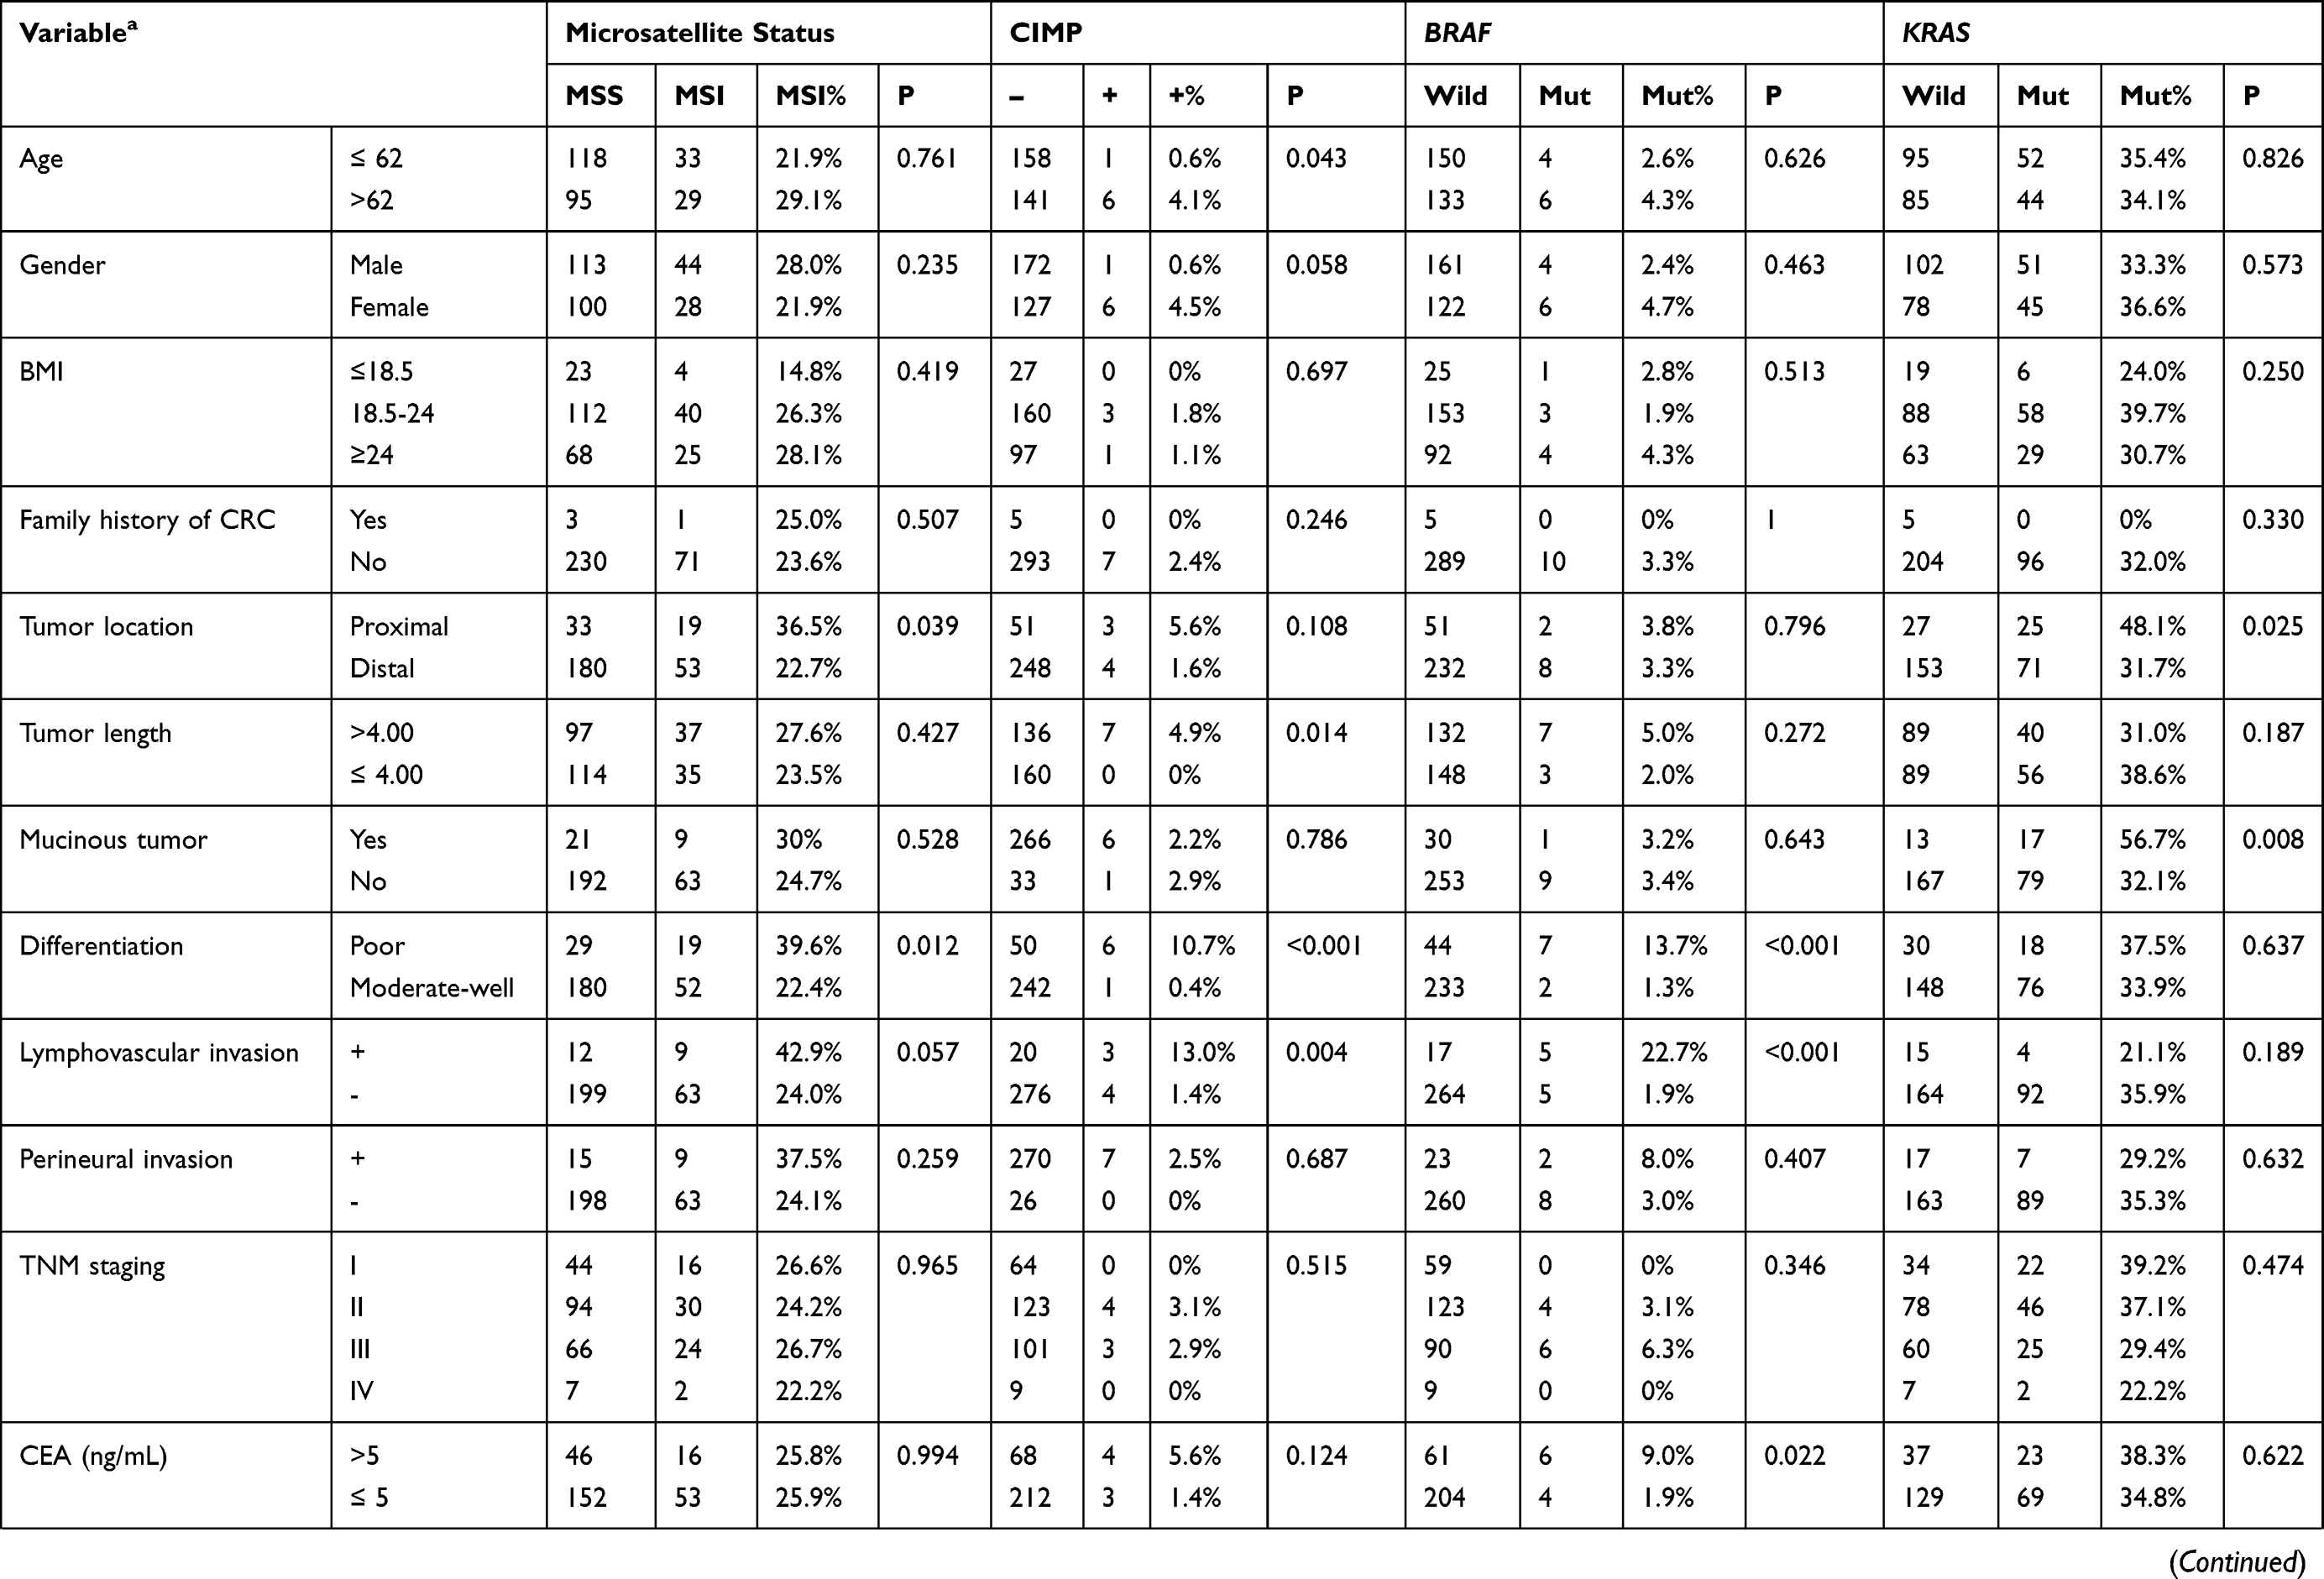 |  |  |
Table 1 Baseline Characteristics of Included CRC Patients with Different Molecular Phenotypes |
Predictive Variables for MSI
In our cohort, the characteristics of patients with MSI and microsatellite stability (MSS) are similar except for tumor differentiation and location. MSI was more frequent in poorly differentiated CRCs [39.6% (19/48) vs 22.4% (52/232), P=0.013] and proximal CRCs [36.5% (19/52) vs 22.7% (53/233), P=0.039] (Table 1). Next, we performed logistic regression analyses to identify the clinicopathological variables that predict MSI in CRC. In the univariate analysis, tumor differentiation, location and NLR were significantly associated with MSI (Table 2). These factors were entered into a multivariate analysis, in which poor differentiation (OR=2.392, 95% CI: 1.213–4.715; P=0.012) and high NLR (OR=3.893, 95% CI: 1.14–13.293; p=0.030) were independently associated with MSI status (Table 3).
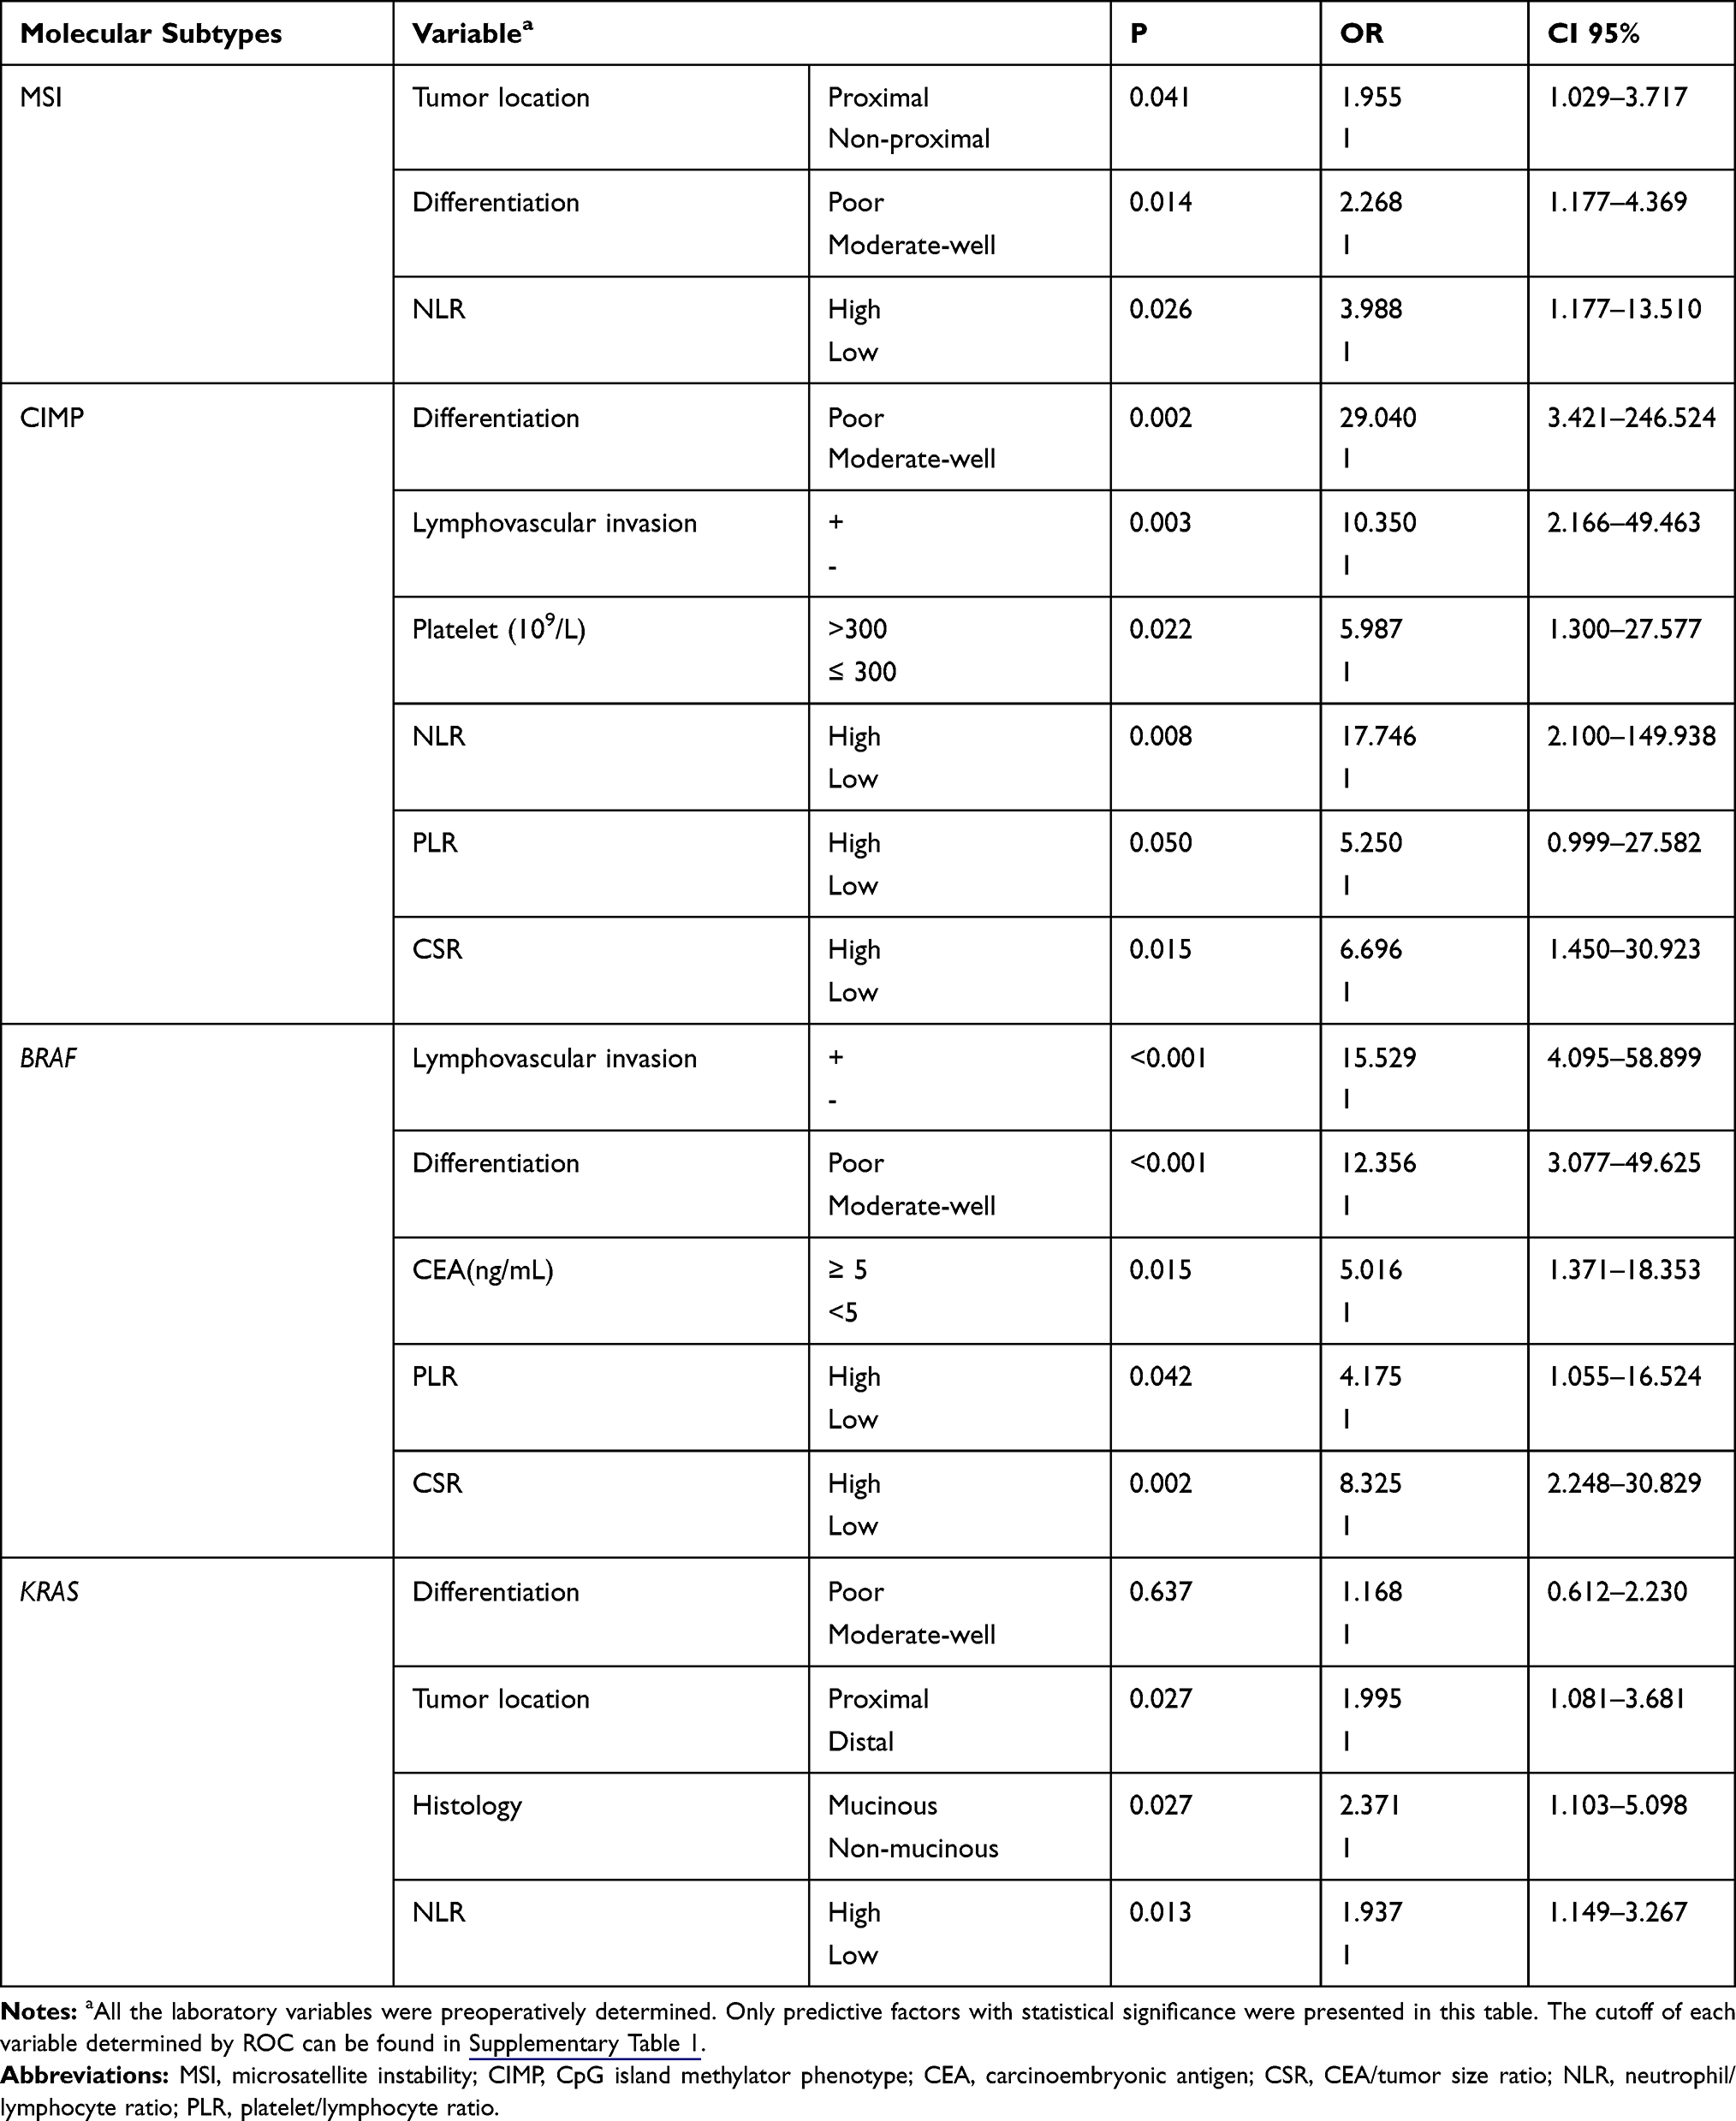 |
Table 2 Predictive Factors for Molecular Phenotypes in Univariate Logistic Regression Analysis |
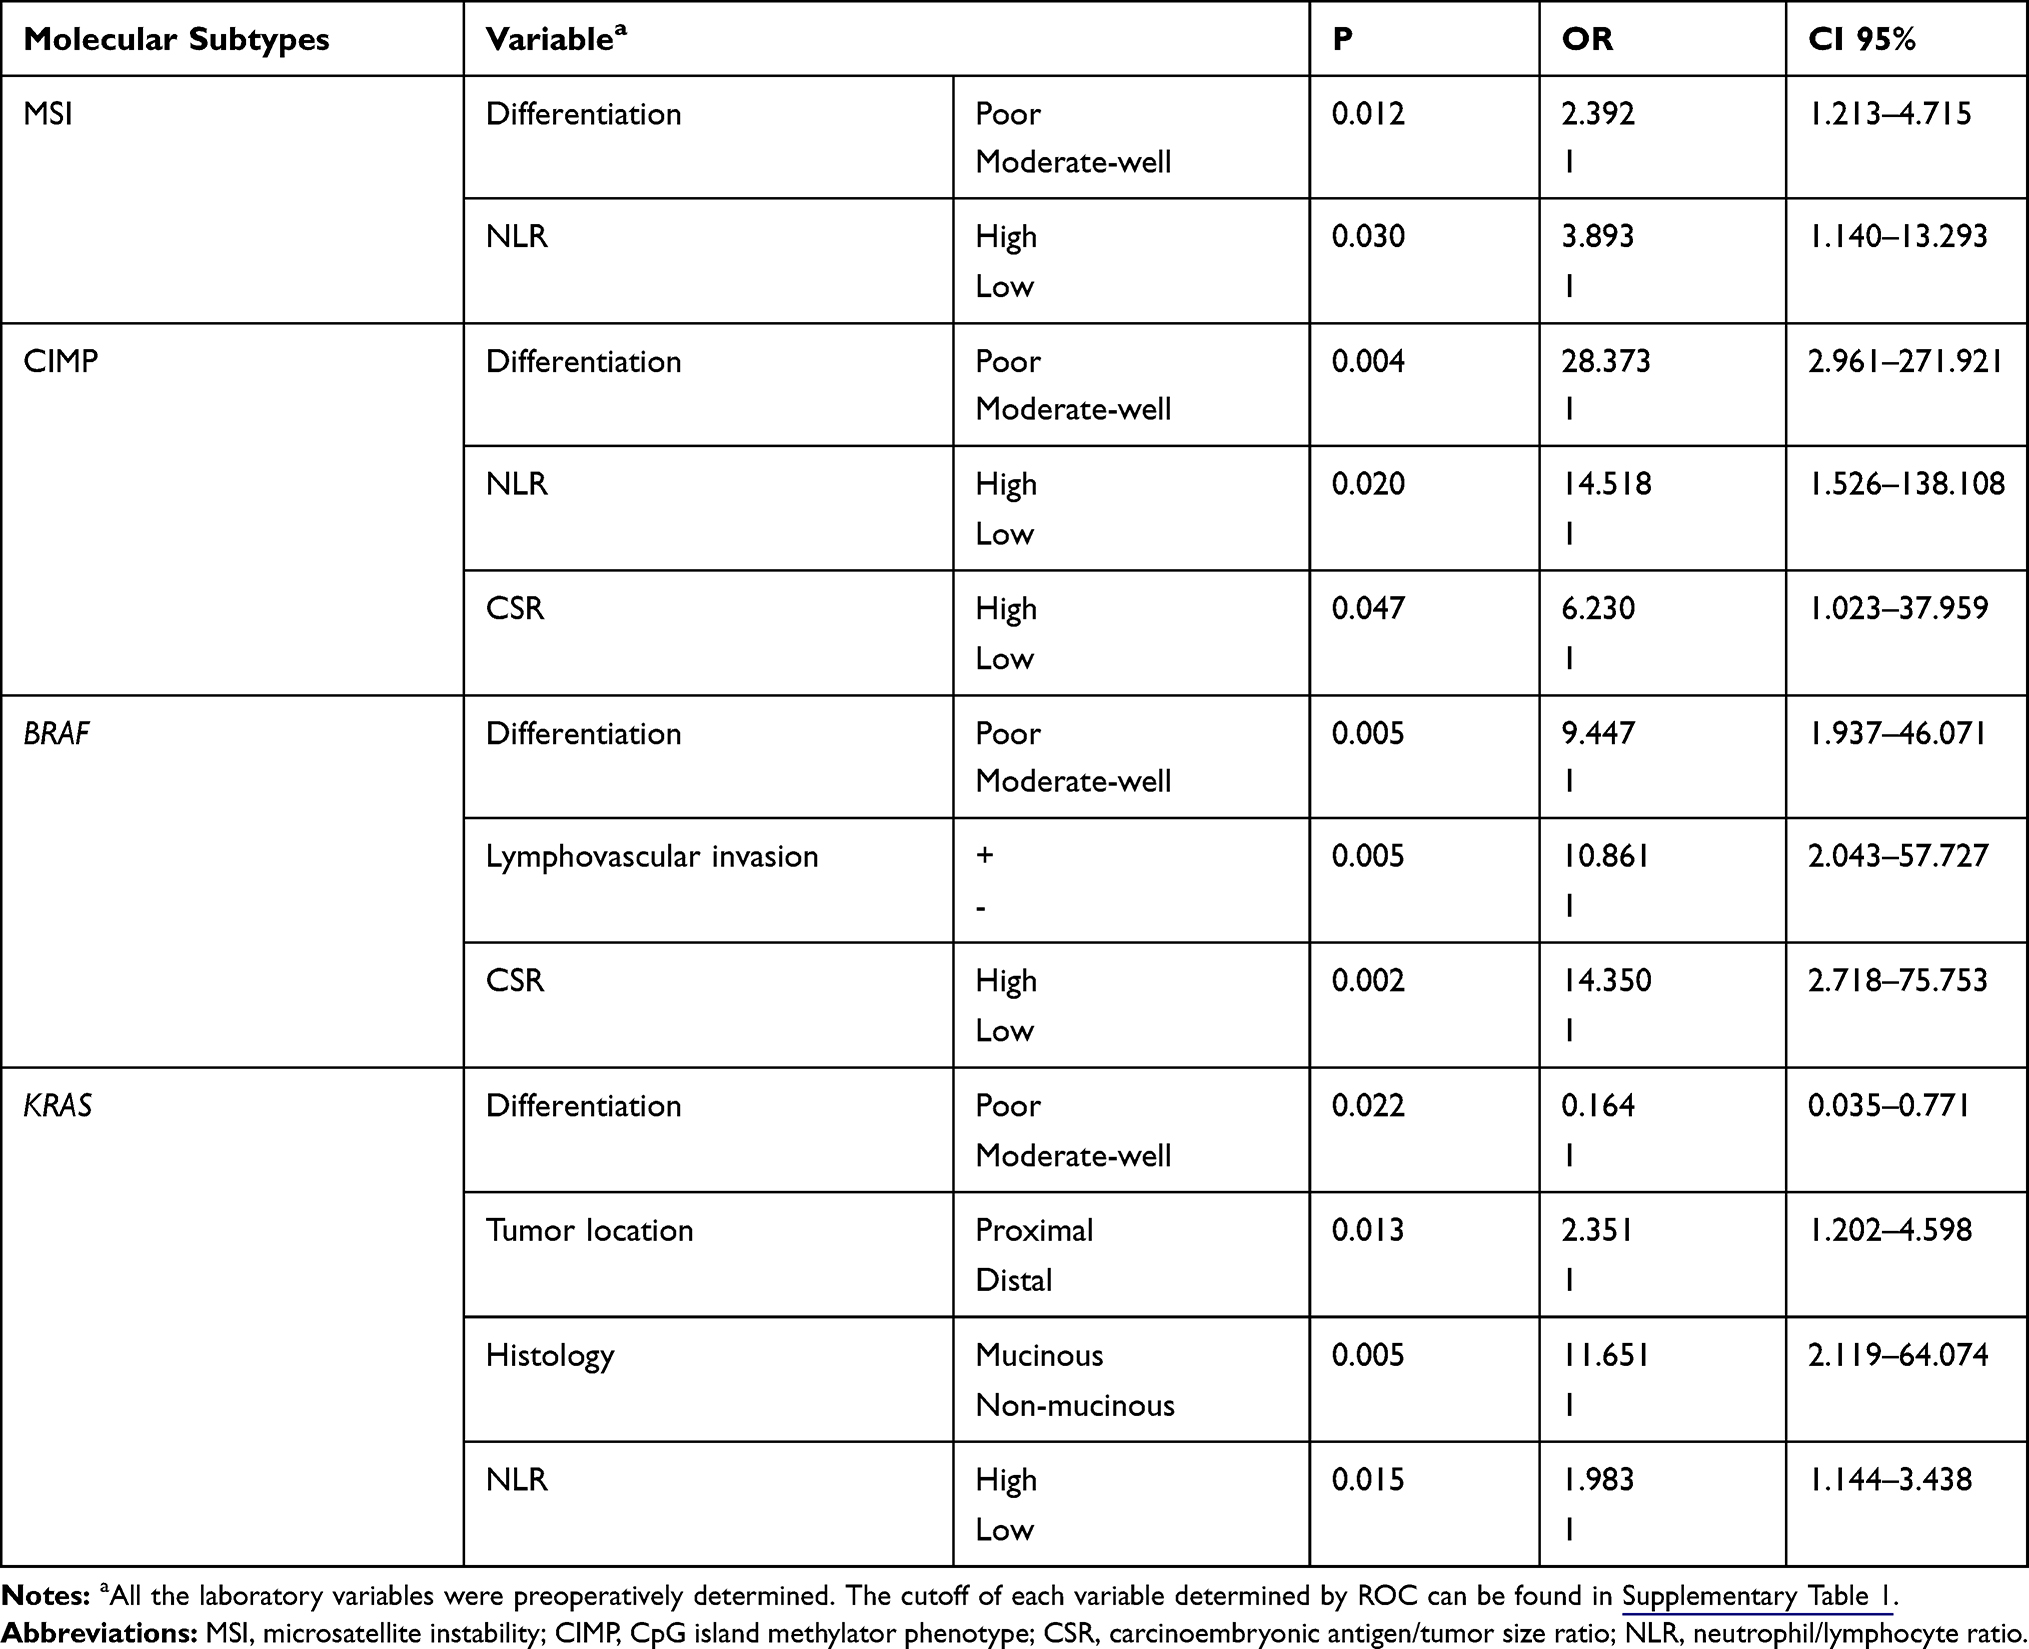 |
Table 3 Predictive Factors for Molecular Phenotypes in Multivariate Logistic Regression Analysis |
Predictive Variables for CIMP
A CIMP (+) status was more frequent in CRCs characterized as older patients [4.1%(6/147) vs 0.6%(1/159), P=0.043], larger size [4.9%(7/143) vs 0.0%(0/160), P=0.014], poor differentiation [10.7%(6/56) vs 0.4%(1/243), P<0.001], lymphovascular invasion [13.0%(3/23) vs 1.4%(4/280), P=0.004], and elevated CA125 [15.0%(3/20) vs 1.5%(4/239), P=0.003] (Table 1). To identify the clinicopathological predictors for CIMP (+) in CRC, we performed Logistic regression analyses. A CIMP (+) status was found to be associated with poor differentiation, lymphovascular invasion, platelet counts, NLR, PLR and CSR in the univariate analysis (Table 2), while only the association with poor differentiation (OR=28.373, 95% CI: 2.961–271.921; P=0.004), NLR (OR 14.518, 95% CI: 1.526–138.108; P=0.020), and CSR (OR=14.350, 95% CI: 2.718–75.753; P=0.047) were still significant in multivariate analysis (Table 3).
Predictive Variables for BRAF Mutation
BRAF mutation was more frequent in CRCs with poor differentiation [13.7% (7/51) vs 1.3% (2/235), P<0.001], lymphovascular invasion [22.7% (5/22) vs 1.9% (5/269), P<0.001], elevated CEA [9.0% (6/67) vs 1.9% (4/208), P=0.022], elevated CA19-9 [12.8% (5/39) vs 2.2% (5/231), P=0.005], and elevated CA125 level [20.0% (4/20) vs 2.4% (6/249), P=0.001] (Table 1). Next, we performed Logistic regression analyses to identify predictors for BRAF mutation from clinicopathological variables. The predictors that was significant in the univariate analysis, including poor differentiation, lymphovascular invasion, CEA, NLR, PLR and CSR (Table 2), were entered into a multivariate analysis, in which poor differentiation (OR=9.447, 95% CI: 1.937–46.071; P=0.005), lymphovascular invasion (OR=10.861, 95% CI: 2.043–57.727; P=0.005), and high CSR (OR=14.350, 95% CI: 2.718–75.752; P=0.002) were independently associated with BRAF mutation (Table 3).
Predictive Variables for KRAS Mutation
KRAS mutation was more frequent in patients with proximal tumors [48.1% (35/52) vs 31.7% (71/224), P=0.025], mucinous tumor [56.7% (17/30) vs 32.1% (79/46), P=0.008], and high platelet counts [0.0% (0/4) vs 38.7% (79/204), P=0.015], while other characteristics were similar between KRAS wild-type and mutant patients (Table 1). Next, we performed logistic regression analyses to identify the clinicopathological predictors for KRAS mutation in CRC. In the univariate analysis, poor differentiation, proximal tumor, mucinous tumor and NLR were significant predictors for harboring KRAS mutation (Table 2). The further multivariate analysis showed all these variables, including poor differentiation (OR=0.164, 95% CI: 0.035–0.771; P=0.022), proximal tumor (OR=2.351, 95% CI: 1.202–4.598; P=0.013), mucinous tumor (OR=11.651, 95% CI: 2.119–64.074; P=0.005), and high NLR (OR=1.983, 95% CI: 1.144–4.438; P=0.015), were independently associated with KRAS mutation (Table 3).
Predictive Nomograms Established for MSI, CIMP, BRAF and KRAS Mutation
Four Nomograms were developed based on the independently significant factors in the multivariate logistic regression analysis (Figure 2, left). The nomogram for predicting MSI status was a model in which NLR weighted more than differentiation. Tumor differentiation weighted most, and NLR and CSR were followed in the nomogram for predicting CIMP (+). The nomogram for predicting BRAF mutation included predictors similar to that for CIMP (+), except for NLR replaced by lymphovascular invasion. These three predictors weighted similar in this model. In the nomogram for predicting KRAS mutation, the histological features of differentiation and mucinous tumor showed a superior impact on the prediction over proximal location and NLR. Using these nomograms, we could easily calculate the probability of MSI, CIMP (+), BRAF mutation and KRAS mutation based on clinicopathological information.
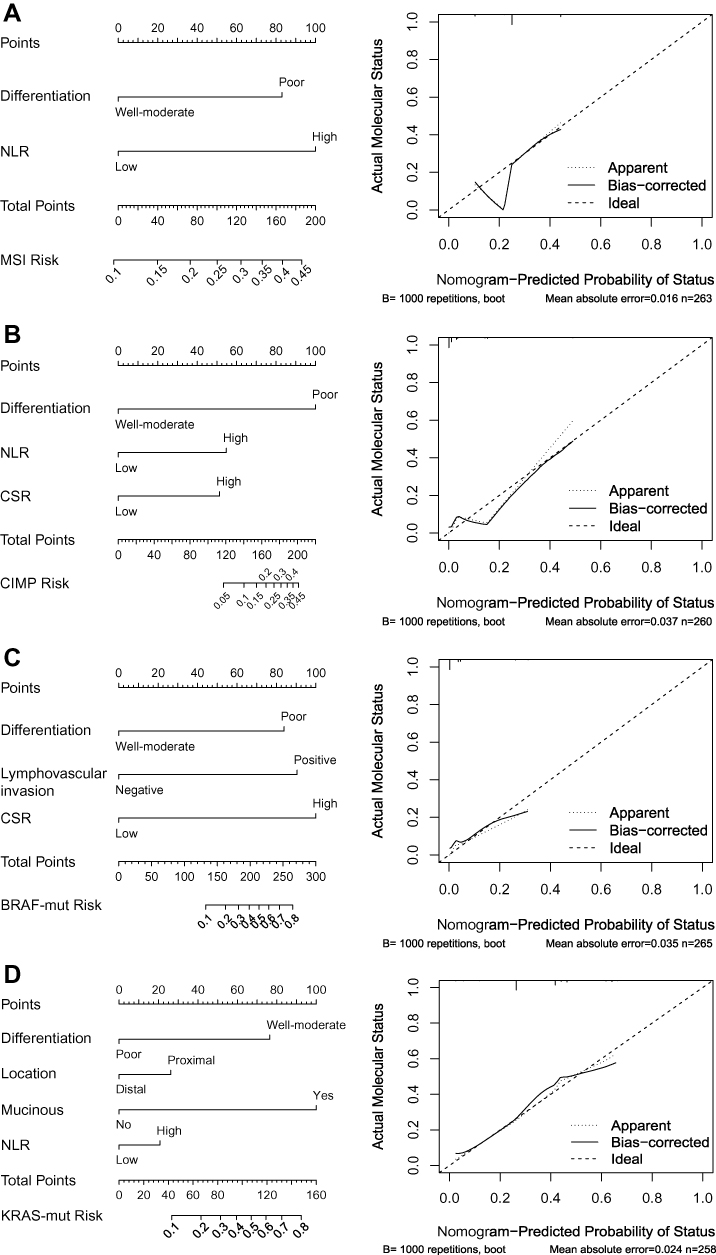 |
Figure 2 Nomograms and calibration curves for predicting the probability of (A) MSI, (B) CIMP (+), (C) BRAF mutation and (D) KRAS mutation. The predicted and observed probabilities of MSI, CIMP (+), BRAF mutation and KRAS mutation were shown in the calibration curves. Abbreviations: NLR, neutrophil/lymphocyte ratio; PLR, platelet/lymphocyte ratio; CSR, CEA/tumor size ratio. |
We further used 1000 bootstrap resamples to compute adjusted C-indexes. The C-indexes of MSI, CIMP (+),BRAF mutation and KRAS mutation were 61.22% (95% CI: 60.28–62.16%), 95.57% (95% CI: 95.20–95.94%), 83.56% (95% CI: 81.54–85.58%), and 69.12% (95% CI: 68.30–69.94%) respectively. Calibration curves between predicted and actual observations by internal validation demonstrated that these nomograms showed good statistical performance for predicting the probability of each phenotype, except for the nomograms for MSI and CIMP (+), in which the probability of MSI would be overestimated when the probability was less than 0.2 (Figure 2, right).
Discussion
In this study, we identified the independent predictors for MSI, CIMP (+), BRAF mutation and KRAS mutation. Among these predictors, NLR and PLR as the systemic inflammation markers, and CSR as a tumor size-corrected CEA indicator have not been reported to be associated with any of molecular phenotypes so far. To the best of our knowledge, this is the first study exploiting them in models to predict molecular phenotypes. We constructed four nomograms using these independent predictors, and their internal validations showed good statistical performance to predict molecular phenotypes. Considering the significance of MSI, CIMP (+), BRAF mutation and KRAS mutation in currently clinical decision-making, the nomograms we generated that could predict molecular phenotypes using easily accessible clinicopathological variables would be widely used in clinical practice.
The missense mutations in KRAS occur in approximately 37.5–38% CRCs in Chinese populations.22,34 A similar sequencing result was found in our cohort, in which KRAS mutation presented in 34.8% (96/276) patients with CRC. KRAS mutation has been found to be more likely to present in female, older patients, and tumors with right-side location, poor differentiation, elevated CEA or CA19-9, and high albumin/globular protein.17,28 In our study, we found similar results in the association analysis with poor differentiation and proximal tumor. We also identified high systemic inflammation status (high NLR) as an independent predictor for KRAS mutation. The preference to developing KRAS mutations in high-NLR CRC supports the recent findings that inflammatory signaling plays a critical role in promoting KRAS-driven oncogenesis through the interaction with autophagy and MAPK signaling.35
It has been reported that BRAF mutation presented in approximately 10–15% CRCs in Western cohort.36 However, several studies showed that BRAF mutation was only found in 2.8–4.4% CRCs in Chinese population.22,34 In our study, BRAF mutation presented in 3.4% (10/293) cases, which is accordant to the reported mutation rate in Chinese population. These results showed that there may exist a distinct nature of CRC between populations. The previous studies have reported various predictors for BRAF mutation, including elderly female patients and tumors characterized as right-sided, mucinous and poor differentiation.17,22,37 In our study, poor differentiation, lymphovascular invasion and high CSR were independent predictors for BRAF mutation. The distinct BRAF-mutation epidemiology and genetic basis between our population and previous cohort may contribute to the variation in predictors. The developed nomogram using these variables showed a high predictive accuracy up to 83.56%. As shown in the calibration curve, nomogram-predicted probability of status also fitted well with actual molecular status. This nomogram showed good statistical performance for predicting the probability of BRAF mutation.
It has been shown in both our cohort (Table 1) and previous report16,38 that CIMP (+) is tightly associated with BRAF mutation. Since CIMP (+) was reported to represent about 15% of CRCs in western population,39 it is not surprising that CIMP (+) incidence in our study, similar to BRAF mutation frequency, is lower than that in the previous report (2.7% versus 15%). Some retrospective studies have described the clinical features associated with CIMP (+) CRCs, including proximal tumor, elderly females, poor differentiation and mucinous tumor.16 In consistent with this study, poor differentiation was also independently associated with CIMP (+) status in our study. Moreover, high NLR and high CSR were independent predictors for CIMP (+) status as well. We built a nomogram showing good statistical performance for predicting CIMP (+) using these three independent predictors. However, this nomogram could only predict tumor with low risk of CIMP (+). This might result from low CIMP (+) incidence in our cohort.
Approximately 5% to 25% of sporadic CRCs develop with the defects in DNA mismatch repair (MMR) system.39–41 Similarly, MSI presented in 25.3% (72/285) patients in our cohort. MMR deficiency leads to MSI in cancer cells, which is the second most common pathway for CRC development. According to previous studies, the CRCs with MSI have distinct features, including right-sided tumor, poor differentiation, abundant tumor-infiltrating lymphocytes and less aggressive clinical course.18,34,42 It has been demonstrated that MSI has high sensitivity as the screening test to identify individuals with Lynch syndrome.43 Our nomogram for MSI, thus, may provide useful information for primary physicians to identify this subgroup of hereditary cancers. Models for predicting the presence of MSI-H status has been built. Jenkins et al developed the MsPath model in 2007.15 However, this model is only applied to patients diagnosed before the age of 60 years. In addition, Angela Hyde et al developed a histology-based model for predicting MSI in 2010.18 Unfortunately, popular use of this model would be limited by its predictors that need to be evaluated by experienced pathologists. In current study, we identified NLR as an independent predictor for MSI, which could be easily used and provided valuable information in practice. However, there were only two independent predictors in this model, and the generated nomogram using differentiation and NLR did not perform well for the prediction.
The robustness of this study includes the high quality-control in molecular assays, strict patient selection to eliminate the confounding influence on molecular phenotyping, and reliable statistical workflow to construct nomograms using continuous and categorized variables. However, this study has some limitations. First, the statistical power of the results in CIMP and BRAF mutation was limited by their low incidences in our population. Second, the sample size of stage-IV patients was small, and thus the nomograms need to be further trained and validated in a cohort with sufficient stage-IV cases to make them can be applied to stage-IV CRC. Moreover, patients included in our study were from a single institution. As a result, there may exist a variation of predictive ability of models among institutions, and an external validation set would be useful to validate our predictive models.
In conclusion, we established four models with easily obtained variables to predict the probability of MSI, CIMP (+), BRAF mutation and KRAS mutation. The nomograms should not replace the molecular laboratory tests of CRC, but it could allow physicians to speculate molecular subtypes of CRCs, then better estimate patients’ prognosis where genetic testing is not available or reimbursed because of infrastructure limits.
Disclosure
The authors declare that they have no competing interests.
References
1. Bray F, Ferlay J, Soerjomataram I, Siegel RL, Torre LA, Jemal A. Global cancer statistics 2018: GLOBOCAN estimates of incidence and mortality worldwide for 36 cancers in 185 countries. CA Cancer J Clin. 2018;68:394–424. doi:10.3322/caac.v68.6
2. Siegel RL, Miller KD, Jemal A. Cancer statistics, 2019. CA Cancer J Clin. 2019;69(1):7–34. doi:10.3322/caac.v69.1
3. Punt CJ, Koopman M, Vermeulen L. From tumour heterogeneity to advances in precision treatment of colorectal cancer. Nat Rev Clin Oncol. 2017;14(4):235–246. doi:10.1038/nrclinonc.2016.171
4. Kocarnik JM, Shiovitz S, Phipps AI. Molecular phenotypes of colorectal cancer and potential clinical applications. Gastroenterol Rep (Oxf). 2015;3(4):269–276. doi:10.1093/gastro/gov046
5. Cunningham D, Atkin W, Lenz HJ, et al. Colorectal cancer. Lancet. 2010;375(9719):1030–1047. doi:10.1016/S0140-6736(10)60353-4
6. Mocellin S, Baretta Z, Roque IFM, et al. Second-line systemic therapy for metastatic colorectal cancer. Cochrane Database Syst Rev. 2017;1:CD006875.
7. Van Cutsem E, Kohne CH, Lang I, et al. Cetuximab plus irinotecan, fluorouracil, and leucovorin as first-line treatment for metastatic colorectal cancer: updated analysis of overall survival according to tumor KRAS and BRAF mutation status. J Clin Oncol. 2011;29(15):2011–2019. doi:10.1200/JCO.2010.33.5091
8. Rodriguez-Salas N, Dominguez G, Barderas R, et al. Clinical relevance of colorectal cancer molecular subtypes. Crit Rev Oncol Hematol. 2017;109:9–19. doi:10.1016/j.critrevonc.2016.11.007
9. Ribic CM, Sargent DJ, Moore MJ, et al. Tumor microsatellite-instability status as a predictor of benefit from fluorouracil-based adjuvant chemotherapy for colon cancer. N Engl J Med. 2003;349(3):247–257. doi:10.1056/NEJMoa022289
10. Singh PP, Sharma PK, Krishnan G, Lockhart AC. Immune checkpoints and immunotherapy for colorectal cancer. Gastroenterol Rep (Oxf). 2015;3(4):289–297. doi:10.1093/gastro/gov053
11. Shiovitz S, Bertagnolli MM, Renfro LA, et al. CpG island methylator phenotype is associated with response to adjuvant irinotecan-based therapy for stage III colon cancer. Gastroenterology. 2014;147(3):637–645. doi:10.1053/j.gastro.2014.05.009
12. Van Rijnsoever M, Elsaleh H, Joseph D, McCaul K, Iacopetta B. CpG island methylator phenotype is an independent predictor of survival benefit from 5-fluorouracil in stage III colorectal cancer. Clin Cancer Res. 2003;9(8):2898–2903.
13. Weisenberger DJ, Liang G, Lenz HJ. DNA methylation aberrancies delineate clinically distinct subsets of colorectal cancer and provide novel targets for epigenetic therapies. Oncogene. 2018;37(5):566–577. doi:10.1038/onc.2017.374
14. Juo YY, Johnston FM, Zhang DY, et al. Prognostic value of CpG island methylator phenotype among colorectal cancer patients: a systematic review and meta-analysis. Ann Oncol. 2014;25(12):2314–2327. doi:10.1093/annonc/mdu149
15. Jenkins MA, Hayashi S, O’Shea AM, et al. Pathology features in Bethesda guidelines predict colorectal cancer microsatellite instability: a population-based study. Gastroenterology. 2007;133(1):48–56. doi:10.1053/j.gastro.2007.04.044
16. Weisenberger DJ, Levine AJ, Long TI, et al. Association of the colorectal CpG island methylator phenotype with molecular features, risk factors, and family history. Cancer Epidemiol Biomarkers Prev. 2015;24(3):512–519. doi:10.1158/1055-9965.EPI-14-1161
17. Loupakis F, Moretto R, Aprile G, et al. Clinico-pathological nomogram for predicting BRAF mutational status of metastatic colorectal cancer. Br J Cancer. 2016;114(1):30–36. doi:10.1038/bjc.2015.399
18. Hyde A, Fontaine D, Stuckless S, et al. A histology-based model for predicting microsatellite instability in colorectal cancers. Am J Surg Pathol. 2010;34(12):1820–1829. doi:10.1097/PAS.0b013e3181f6a912
19. Deng Y, Chi P, Lan P, et al. Neoadjuvant modified FOLFOX6 with or without radiation versus fluorouracil plus radiation for locally advanced rectal cancer: final results of the Chinese FOWARC trial. J Clin Oncol. 2019;37:3223–3233.
20. Ren DL, Li J, Yu HC, et al. Nomograms for predicting pathological response to neoadjuvant treatments in patients with rectal cancer. World J Gastroenterol. 2019;25(1):118–137. doi:10.3748/wjg.v25.i1.118
21. Baran B, Mert ON, Yerli TN, Acar E, Bekcioglu O, Baskin Y. Difference between left-sided and right-sided colorectal cancer: a focused review of literature. Gastroenterology Res. 2018;11(4):264–273. doi:10.14740/gr1062w
22. Fu X, Huang Y, Fan X, et al. Demographic trends and KRAS/BRAF(V600E) mutations in colorectal cancer patients of South China: a single-site report. Int J Cancer. 2019;144(9):2109–2117. doi:10.1002/ijc.31973
23. Weisenberger DJ, Siegmund KD, Campan M, et al. CpG island methylator phenotype underlies sporadic microsatellite instability and is tightly associated with BRAF mutation in colorectal cancer. Nat Genet. 2006;38(7):787–793. doi:10.1038/ng1834
24. Yu H, Bai L, Tang G, et al. Novel assay for quantitative analysis of DNA methylation at single-base resolution. Clin Chem. 2019;65:664–673. doi:10.1373/clinchem.2018.298570
25. Eads CA, Danenberg KD, Kawakami K, et al. MethyLight: a high-throughput assay to measure DNA methylation. Nucleic Acids Res. 2000;28(8):E32. doi:10.1093/nar/28.8.e32
26. Winkelmann R, Schneider M, Hartmann S, et al. Microsatellite instability occurs rarely in patients with cholangiocarcinoma: a retrospective study from a german tertiary care hospital. Int J Mol Sci. 2018;19(5). doi:10.3390/ijms19051421
27. Xicola RM, Llor X, Pons E, et al. Performance of different microsatellite marker panels for detection of mismatch repair-deficient colorectal tumors. J Natl Cancer Inst. 2007;99(3):244–252. doi:10.1093/jnci/djk033
28. Xiang W, Dai W, Cai G. A nomogram for the prediction of KRAS mutation in colorectal cancer. Ann Oncol. 2018;29. doi:10.1093/annonc/mdy318.015
29. Shahid S. Review of hematological indices of cancer patients receiving combined chemotherapy & radiotherapy or receiving radiotherapy alone. Crit Rev Oncol Hematol. 2016;105:145–155. doi:10.1016/j.critrevonc.2016.06.001
30. WHO Expert Consultation. Appropriate body-mass index for Asian populations and its implications for policy and intervention strategies. Lancet. 2004;363(9403):157–163. doi:10.1016/S0140-6736(03)15268-3
31. Cai D, Huang ZH, Yu HC, et al. Prognostic value of preoperative carcinoembryonic antigen/tumor size in rectal cancer. World J Gastroenterol. 2019;25(33):4945–4958. doi:10.3748/wjg.v25.i33.4945
32. Dell’Aquila E, Cremolini C, Zeppola T, et al. Prognostic and predictive role of neutrophil/lymphocytes ratio in metastatic colorectal cancer: a retrospective analysis of the TRIBE study by GONO. Ann Oncol. 2018;29(4):924–930. doi:10.1093/annonc/mdy004
33. Lu C, Gao P, Yang Y, et al. Prognostic evaluation of platelet to lymphocyte ratio in patients with colorectal cancer. Oncotarget. 2017;8(49):86287–86295. doi:10.18632/oncotarget.v8i49
34. Ye JX, Liu Y, Qin Y, Zhong HH, Yi WN, Shi XY. KRAS and BRAF gene mutations and DNA mismatch repair status in Chinese colorectal carcinoma patients. World J Gastroenterol. 2015;21(5):1595–1605. doi:10.3748/wjg.v21.i5.1595
35. Kitajima S, Thummalapalli R, Barbie DA. Inflammation as a driver and vulnerability of KRAS mediated oncogenesis. Semin Cell Dev Biol. 2016;58:127–135. doi:10.1016/j.semcdb.2016.06.009
36. Corcoran RB, Ebi H, Turke AB, et al. EGFR-mediated re-activation of MAPK signaling contributes to insensitivity of BRAF mutant colorectal cancers to RAF inhibition with vemurafenib. Cancer Discov. 2012;2(3):227–235. doi:10.1158/2159-8290.CD-11-0341
37. Roth AD, Tejpar S, Delorenzi M, et al. Prognostic role of KRAS and BRAF in stage II and III resected colon cancer: results of the translational study on the PETACC-3, EORTC 40993, SAKK 60-00 trial. J Clin Oncol. 2010;28(3):466–474. doi:10.1200/JCO.2009.23.3452
38. Hinoue T, Weisenberger DJ, Lange CP, et al. Genome-scale analysis of aberrant DNA methylation in colorectal cancer. Genome Res. 2012;22(2):271–282. doi:10.1101/gr.117523.110
39. Puccini A, Berger MD, Naseem M, et al. Colorectal cancer: epigenetic alterations and their clinical implications. Biochim Biophys Acta Rev Cancer. 2017;1868(2):439–448. doi:10.1016/j.bbcan.2017.09.003
40. Alexander J, Watanabe T, Wu TT, Rashid A, Li S, Hamilton SR. Histopathological identification of colon cancer with microsatellite instability. Am J Pathol. 2001;158(2):527–535. doi:10.1016/S0002-9440(10)63994-6
41. Bonneville R, Krook MA, Kautto EA, et al. Landscape of microsatellite instability across 39 cancer types. JCO Precis Oncol. 2017;2017:1–15.
42. Boland CR, Thibodeau SN, Hamilton SR, et al. A National Cancer Institute Workshop on Microsatellite Instability for cancer detection and familial predisposition: development of international criteria for the determination of microsatellite instability in colorectal cancer. Cancer Res. 1998;58(22):5248–5257.
43. Latham A, Srinivasan P, Kemel Y, et al. Microsatellite instability is associated with the presence of lynch syndrome pan-cancer. J Clin Oncol. 2019;37(4):286–295. doi:10.1200/JCO.18.00283
 © 2020 The Author(s). This work is published and licensed by Dove Medical Press Limited. The full terms of this license are available at https://www.dovepress.com/terms.php and incorporate the Creative Commons Attribution - Non Commercial (unported, v3.0) License.
By accessing the work you hereby accept the Terms. Non-commercial uses of the work are permitted without any further permission from Dove Medical Press Limited, provided the work is properly attributed. For permission for commercial use of this work, please see paragraphs 4.2 and 5 of our Terms.
© 2020 The Author(s). This work is published and licensed by Dove Medical Press Limited. The full terms of this license are available at https://www.dovepress.com/terms.php and incorporate the Creative Commons Attribution - Non Commercial (unported, v3.0) License.
By accessing the work you hereby accept the Terms. Non-commercial uses of the work are permitted without any further permission from Dove Medical Press Limited, provided the work is properly attributed. For permission for commercial use of this work, please see paragraphs 4.2 and 5 of our Terms.