")
Back to Journals » Diabetes, Metabolic Syndrome and Obesity » Volume 14
Nomogram Model for Screening the Risk of Type II Diabetes in Western Xinjiang, China
Authors Wang Y, Zhang Y, Wang K , Su Y, Zhuge J, Li W, Wang S, Yao H
Received 3 April 2021
Accepted for publication 29 June 2021
Published 7 August 2021 Volume 2021:14 Pages 3541—3553
DOI https://doi.org/10.2147/DMSO.S313838
Checked for plagiarism Yes
Review by Single anonymous peer review
Peer reviewer comments 3
Editor who approved publication: Dr Konstantinos Tziomalos
Yushan Wang,1,* Yushan Zhang,2,* Kai Wang,3 Yinxia Su,1 Jinhui Zhuge,2 Wenli Li,2 Shuxia Wang,1 Hua Yao1
1Center of Health Management, The First Affiliated Hospital, Xinjiang Medical University, Urumqi, People’s Republic of China; 2College of Public Health, Xinjiang Medical University, Urumqi, People’s Republic of China; 3Department of Medical Engineering and Technology, Xinjiang Medical University, Urumqi, People’s Republic of China
*These authors contributed equally to this work
Correspondence: Hua Yao; Shuxia Wang
Center of Health Management, The First Affiliated Hospital of Xinjiang Medical University, No. 137 Liyushan South Road, Urumqi, 830011, People’s Republic of China
Tel +86-13999180161
; +86-13579901672
Email [email protected]; [email protected]
Objective: A simple type 2 diabetes mellitus (T2DM) screening model was established preciously based on easily available variables for identifying high-risk individuals in western Xinjiang, China.
Methods: A total of 458,153 cases participating in the national health examination were recruited. Logistic regression and the least absolute shrinkage and selection operator (LASSO) models were used for univariate analysis, factors selection, and the establishment of prediction model. Receiver operating characteristic (ROC) curve, Hosmer–Lemeshow test and clinical decision curve (CDA) were applied for evaluating the discrimination, calibration and clinical validity, respectively. The optimal threshold for predicting risk factors for T2DM has been estimated as well.
Results: The nomogram depicted the risk of T2DM based on different genders, the factors mainly consisted of age, family history of T2DM (FHOT), waist circumference (WC), total cholesterol (TC), triglycerides (TG), low-density lipoprotein cholesterol (LDLc), body mass index (BMI), high-density lipoprotein cholesterol (HDLc), etc. The area under ROC of men and women was 0.864 and 0.816 in the development group, similarly in the validation group, which was 0.865 and 0.815, respectively. The calibration curve showed that the nomogram was accurate for predicting the risk of T2DM, and the CDA proved great clinical application value of the nomogram. Threshold values of the age, WC, TC, TG, HDLc, BMI in different genders were 52.5 years old (men) and 48.5 years old (women), 85.50 cm (men) and 89.9 cm (women), 4.94 mmol/L (men) and 4.94mmol/L (women), 1.26mmol/L (men) and 1.67mmol/L (women), 1.40mmol/L (men) and 1.40mmol/L (women), 24.70kg/m2 (men) and 24.95kg/m2 (women), respectively.
Conclusion: Our results give a clue that the nomogram may be useful for identifying adults who have high risk for diabetes, which is simple, affordable, with high credibility and can be widely implemented. Further studies are needed to evaluate the utility and feasibility of this model in various settings.
Keywords: type 2 diabetes mellitus, T2DM, nomogram, risk factor, risk predictive model
Introduction
Diabetes mellitus (DM) is a metabolic disease characterized by hyperglycemia,1 which can lead to a variety of complications, such as cardiovascular disease, diabetic nephropathy, diabetic retinopathy, diabetic neuropathy and diabetic lung.2–4 In the past 20 years, due to the increase in obesity rate and the change of lifestyle, the number of people diagnosed with diabetes has been increasing all over the world.5 According to the latest report of the International Diabetes Federation, in 2019, there are 463 million diabetic patients (aged between 20 and 79 years) in the world. It is estimated that the number will increase to 578 million by 2030 and 700 million by 2045.6 It is estimated that the largest increase is in developing countries.7 The incidence rate of diabetes and its complications is one of the main causes of death, which has brought enormous burden to patients, especially those living in underdeveloped countries or developing countries.8
At present, there are 1 billion 380 million people and 110 million diabetes mellitus in China, which owns the most cases in the world. And this number is still growing. The incidence rate of diabetes is younger in recent years,9 bringing great burden to the health care system.10 A survey based on a total of 75,880 participants from 31 provinces and municipalities in China shows that the prevalence of diabetes is 18–29 in China’s population aged 18–29 years and 6.3% in the 30–39-year-old population. The significant increase in the prevalence of diabetes is mainly attributed to type 2 diabetes, which is estimated to account for less than 5% of diabetes cases in China.11 Because of the rising prevalence rate of diabetes, high economic cost and serious complications, it is crucial to prevent and delay the onset of T2DM by investigating the high risk factors of diabetes, implementing timely intervention and controlling the incidence rate.12
Xinjiang is located in the west of China, with relatively backward social and economic level, obvious cultural differences, and genetic difference, leading to a high level of the diabetes prevalence. As we all know, lifestyle changes or drug intervention can prevent or delay T2DM,13–18 but there is no specific method to accurately predict T2DM, so it is still the focus of clinical research. Nomography is an intuitive graphical prediction model, which can provide accurate and personalized risk prediction for everyone, so it is widely used in gastric cancer, invasive ductal cancer, prostate cancer, osteosarcoma and other diseases.19 Although several different diabetes risk prediction models have been established in China, most of them are concentrated in the economically developed southern region,20 and there are few diabetes risk prediction models in Northwest China, especially the research on related risk factors based on laboratory examination.
The purpose of this study is to develop an effective and easily available risk prediction model for T2DM patients in the western region of Xinjiang, China. By consulting a large number of references, this study is the first to incorporate laboratory test data into T2DM risk prediction model, as well as to provide evidence for the relationship between selected risk factors and T2DM in western China.
Methods
Study Population
National Physical Examination is a large-scale community physical examination provided by the government, which is free to residents. In the study, we collected data from the 2018 national health examination in Ili Kazakh Autonomous Prefecture, Xinjiang, including 494,999 people, all of whom signed an informed consent form. Participants were excluded from the study if 1) between 0 and 18 years of age: delete the data of participants younger than 19 years old in the age variable; 2) with type 1 diabetes: fasting insulin is less than 5μIU/mL, fasting plasma glucose is more than 6.8mmol/L, which affects the function of insulin, and leads to the increase of fasting plasma glucose to more than 6.8mmol/L, It is regarded as type 1 diabetes; 3) pregnant: after clinical examination and other ways to determine the pregnancy of women; 4) with incomplete baseline and laboratory data; 5) participants had a history of cancer, cardiovascular disease, or stroke: cancer was diagnosed by clinicopathological diagnosis, cardiovascular disease was diagnosed by clinicians through the patient’s symptoms and signs and laboratory examination, and stroke history refers to whether the participants had suffered from stroke before. After rigorous data cleansing and processing, 458,153 samples were obtained. We randomly divided the data into development group (N = 366,523) and validation group (N = 91,630), the ratio was 8:2. We constructed the male and female nomograms using data from the development group, and validated the constructed nomograms using the validation group. The study was based on principles in the Declaration of Helsinki and approved by the Ethics Committee and Agency Review Board in the Central of Disease Control in Xinjiang.
Risk Factors for T2DM
The national physical examination is composed of questionnaire survey, routine examination and laboratory test. This study evaluated the potential risk factors of T2DM mainly through the above three parts of data. The past medical history and demographic characteristics of each subject were obtained from a standard questionnaire (The standard questionnaire is called the “personal questionnaire”. The survey includes gender, age, family address, occupation, medical expenses, family history of diabetes, hypertension, etc.); Routine examination mainly includes symptoms, general condition (height, weight, waist circumference and blood pressure) and physical observation (Fundus, hearing, lymph node, lung, heart, etc.) of participants. The height was measured to the nearest 0.5cm, and the weight was measured to the nearest 0.1kg. BMI was calculated by body weight (kg)/height2(m2); The laboratory test mainly includes blood routine, urine routine, fasting blood glucose, blood lipid and other indicators. Blood glucose, TC, LDLc, HDLc and TG were measured by automatic biochemical analyzer.
Some factors such as diet habit and exercise condition were excluded because of difficulty in estimation. Besides, smoking status was excluded due to the wide existence of passive smoking.
In this study, participants were diagnosed with hypertension according to the criteria of “2005 Chinese hypertension treatment guidelines”. Participants measured their blood pressure several times without taking antihypertensive drugs. If systolic blood pressure was ≥140mmHg, diastolic blood pressure was ≥90mmHg, combined with chronic disease records, they could be diagnosed with hypertension.
The definition of diabetes in this study was as follows: 2 hours after meal, blood glucose≥11.1mmol/l, fasting blood glucose≥7.0mmol/l, or the main complaint of diabetes and taking hypoglycemic drugs.
Statistical Analysis
Because of the huge size of data, many extreme values and vacancy values existed, the original data need pre-processing. Firstly, we deleted nearly 20 variables that did not make sense for our study, including participants’ name, ID number, home address, work unit, telephone number, contact name, contact telephone number, permanent type, blood type, disability status, hospitalization history, medical expenses payment method, vaccination history, main medication situation, etc. Secondly, we deleted 36,846 sample data because there are many missing data in some sample variables. Finally, variables with less missing information were filled in with the mean values.
In this study, continuous variables were expressed as mean (standard deviation), and classification variables were expressed as frequency (percentage). The R software package “nortest” was used for Lilliefors (Lillie) test to judge whether the continuous variable was positive distribution. One-way ANOVA and Kruskal–Wallis test were used to analyze the differences between groups (development group and validation group) of the continuous variables of normal distribution and non-normal distribution, respectively. All the variables were first analyzed by single-factor regression analysis and multi-collinearity diagnosis. We found that the variables with the variance inflation factor greater than 10 had higher co-llinearity21 Secondly, we further used the least absolute contraction and the selection operator (LASSO) regression to select the most useful candidate prediction variables. Thirdly, we combined the variables with statistical significance both in univariate regression analysis and LASSO regression, then incorporated multivariable logistic regression analysis, the OR (95% CI), and P values of each candidate were calculated to predict a possible diagnosis. Finally, based on the regression coefficients of independent variables, the individual nomograms of T2DM of both genders had been established.
We evaluated the performance of nomograms in terms of differentiation, calibration, and clinical validity. First, we evaluated the performance of the model by drawing a ROC curve,22 and the area under the ROC curve (AUC). The closer the area of the ROC curve (AUC) is to 1, the better the prediction model is. In general, a predictive model with AUC between 0.5 and 0.75 is considered acceptable A model with AUC more than 0.75 is considered to have good discrimination. We also calculated the sensitivity, specificity, positive predictive value (PPV), negative predictive value (NPV), positive likelihood ratio (PLR) and negative likelihood ratio (NLR) of the model, and then evaluated the model correction using Hosmer–Lemeshow goodness-of-fit test. If the chi-square value of the statistic is smaller and the corresponding p value is larger, the calibration effect of the prediction model is better. If the test result is statistically significant (P< 0.05), it shows that there is a certain difference between the predicted value and the observed value, while the correction of the model is poor.23 We performed a CDA analysis to assess the clinical validity of the model.24 By subtracting the proportion of people with false-positive results from the proportion with true-positive results and then weighing the relative risks of false-positive and false-negative results, we got the net benefit of the decision. In addition, we conducted further ROC analysis to determine the best cut-off value for each risk factor. The best cut-off value is defined as the point on the ROC curve at which the Youden's Index (sensitivity + specificity – 1) is highest.
R software (version 4.0.4) was used for data analysis. The main software packages involved were “hmisc”, “RMS”, “foreign”, “caret”, “nortest” and “survival”.
Results
Baseline Characteristics of Type 2 Diabetes
A total of 366,523 and 91,630 cases were recruited in the development and validation groups, respectively. There were 8.39% and 8.27% participants with diabetes in the two groups (Table 1).
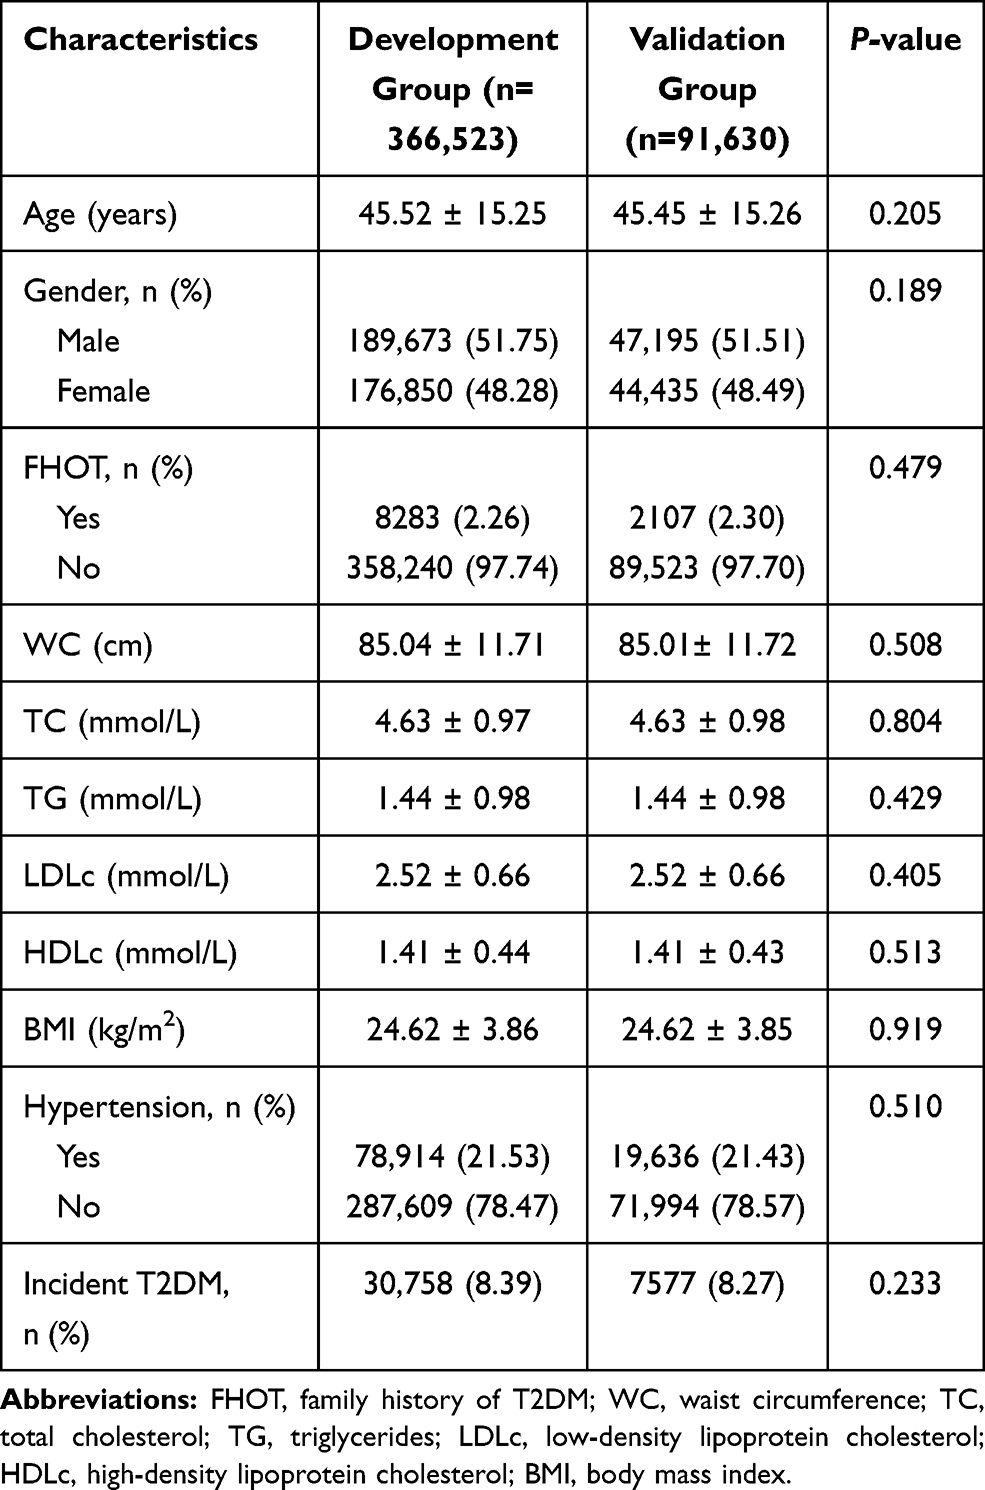 |
Table 1 Comparison of Factor Characteristics Between Development Set and Validation Set (N=458,153) |
Characteristics Selection
Table 2 depicts the baseline characteristics of development group, showing significant difference. The age, WC, TC, TG, HDLc, LDLc of T2DM patients were higher than those of baseline. The proportion of cases with FHOT and Hypertension was high, which was consistent with the result of univariate logistic regression analysis.
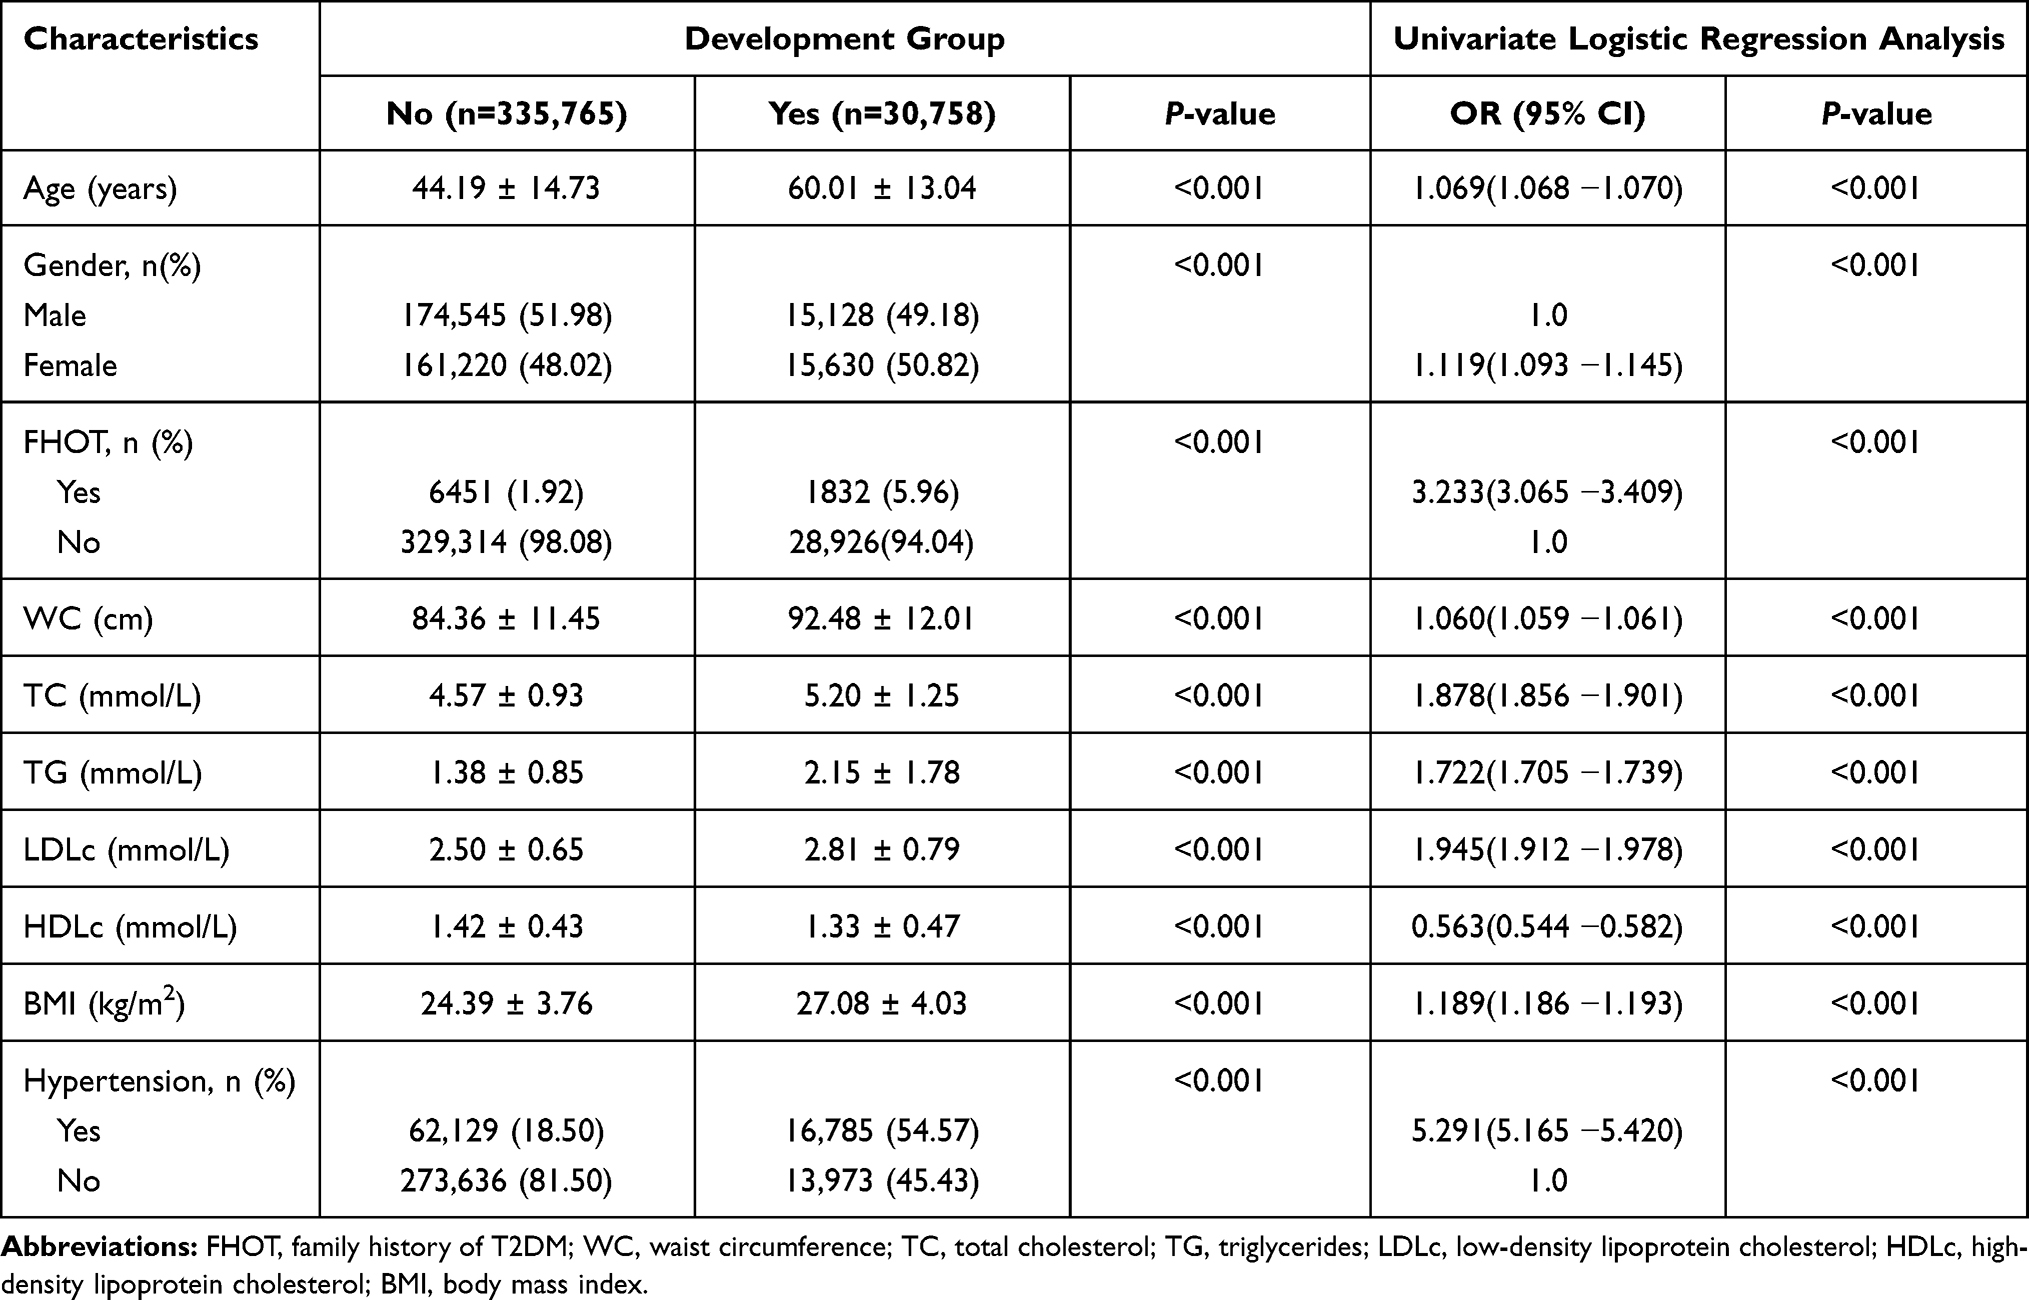 |
Table 2 Baseline Characteristics According to the Incidence of T2DM and the Univariate Logistic Regression Analysis in the Development Group (N= 366,523) |
Through LASSO regression, we got eight non-zero coefficient characteristics, which are shown in Figure 1. The characteristics included age, family history of T2DM (FHOT), waist circumference (WC), total cholesterol (TC), triglycerides (TG), BMI, high-density lipoprotein cholesterol (HDLc) and history of previous hypertension.
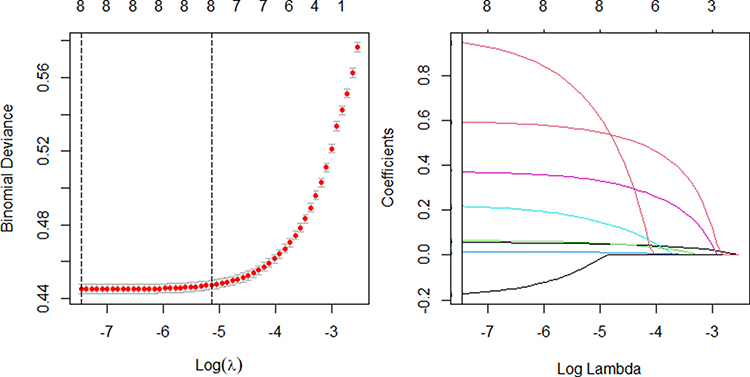 |
Figure 1 The least absolute contraction selection operator (LASSO) and binary logistic regression model were used for variance selection. (A) The optimal parameters (λ) of LASSO were selected through 10 times of cross-validation, and the relationship graph between mean square error and logarithm (λ) had been drawn. The vertical line was drawn at the optimal value using the minimum criterion and the minimum criterion of 1SE. (B) LASSO coefficient profile of nine features. The coefficient profile of log (λ) sequence had been created, and a vertical line at the selected value using 10 cross-validation tests was drawn, where the optimum resulted in eight candidate coefficients being non-zero. |
Independent Prognostic Factors in the Development Group
Eight variables were collected in the multiple logistic regression. Details are shown in Table 3. In terms of the results of OR and P value, the age, family history of T2DM, WC, TC, TG, BMI, previous history of hypertension were positively correlated with the prevalence of T2DM, while HDLc presented negative correlation. Besides, the maximum variance inflation factors among covariant was 1.88, the minimum was 1.00, indicating there was no multi-collinearity. Finally, we took the eight independent factors into the prediction model.
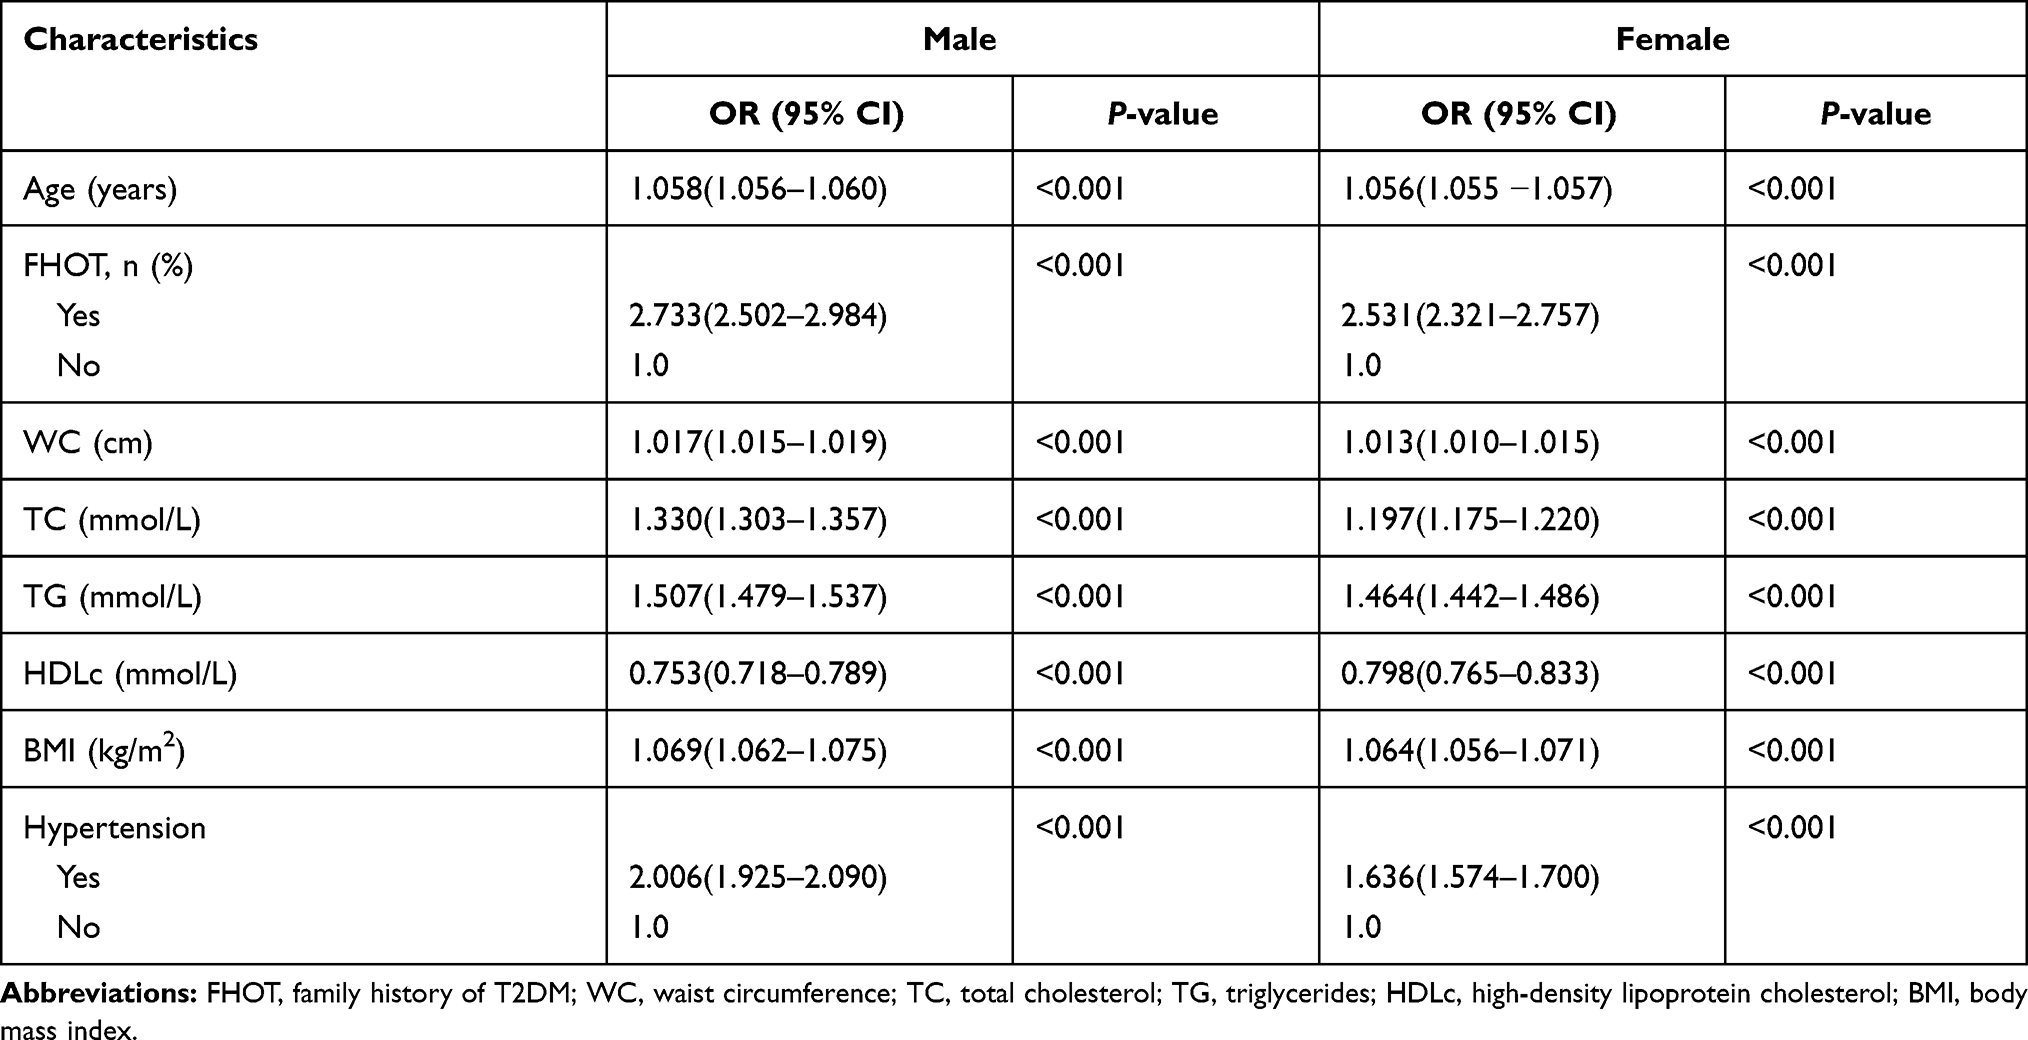 |
Table 3 Multivariate Logistic Regression Analysis for Risk Factors Associated Hypertension in the Development Group (N=386,413) |
Development of a T2DM-Predicting Nomogram
Based on multiple regression, we got Yili Prefecture Diabetes Nomogram Model consisting of eight factors (Figure 2). Each sub-type in these variables was assigned a score. Each sub-type in these variables was assigned a score. The cumulative sum of each “point” was the “total points”. The corresponding “diagnostic possibility” of “total point” was the predicted probability of T2DM suggested by our designed nomogram.
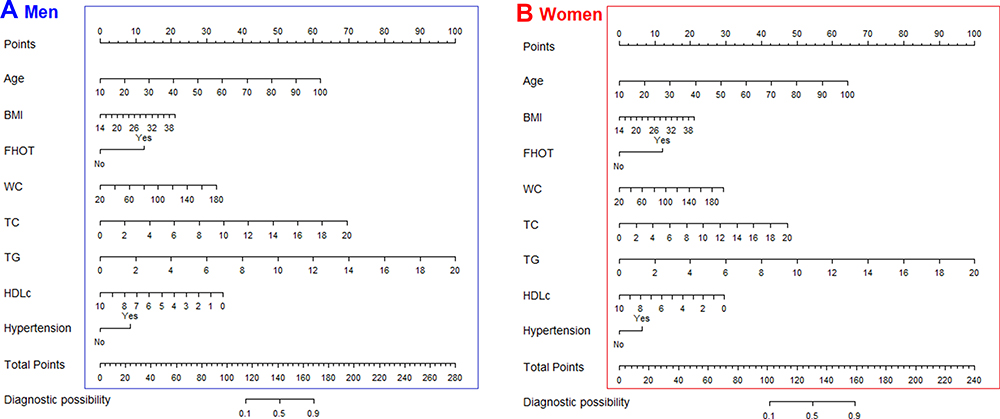 |
Figure 2 Nomogram was used for predicting the risk of T2DM in healthy population. (A) Men, (B).Women. |
Take an example of nomogram usage: a sample was randomly selected, a 50-year-old man, he had a family history of diabetes mellitus, with a WC of 110cm, BMI of 26kg/m2, TC of 6mmol/L, TG of 6mmol/L, a HDLc of 5mmol/L, and suffered from hypertension, with a total score of 144.43, the corresponding incidence probability of diabetes was 56.26%. A woman, 60 years old, she had a family history of diabetes mellitus, with a WC of 115cm, BMI of 26kg/m2, TC of 5mmol/L, TG of 5.5mmol/L, a HDLc of 3mmol/L, and suffered from hypertension, with a total score of 139.54, the corresponding incidence probability of diabetes was 66.58%.
Validation of Nomogram for T2DM
The validation model was evaluated based on discrimination, calibration and clinical effect. Plot prediction accuracy curve ROC and calculated AUC value of development group and validation group are shown in Figure 3. And the AUC value of development group in men and women was 0.864 (95% CI, 0.861–0.866) and 0.816 (95% CI, 0.813–0.819), respectively, while 0.865 (0.859–0.871) and 0.815 (0.808–0.821) in validation group. In both groups, the AUC in men was higher than that of women.
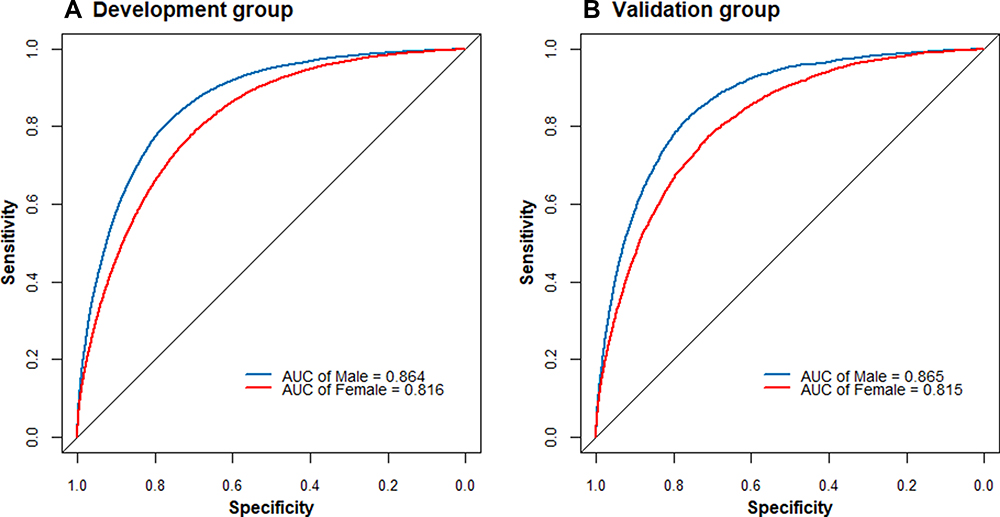 |
Figure 3 The ROC curves of the nomogram for T2DM risk in the development group (A) and validation group (B). |
Table 4 shows the basic information of the prediction accuracy of nomogram. In the development group, the best cut-off points of ROC curve of men and women were 0.0817 and 0.0821, respectively, the sensitivity were 80.06% and 77.88%, respectively, and the specificity were 77.71% and 70.68, respectively. In the validation group, the best cut-off points of ROC curve of men and women were 0.0803 and 0.0822, respectively, the sensitivity were 81.42% and 77.45%, respectively, and the specificity were 77.23% and 71.05%, respectively. We also found that NPV was high in both development and validation groups. In conclusion, nomogram showed good predictive differentiation in estimating the risk of T2 DM in male and female subjects.
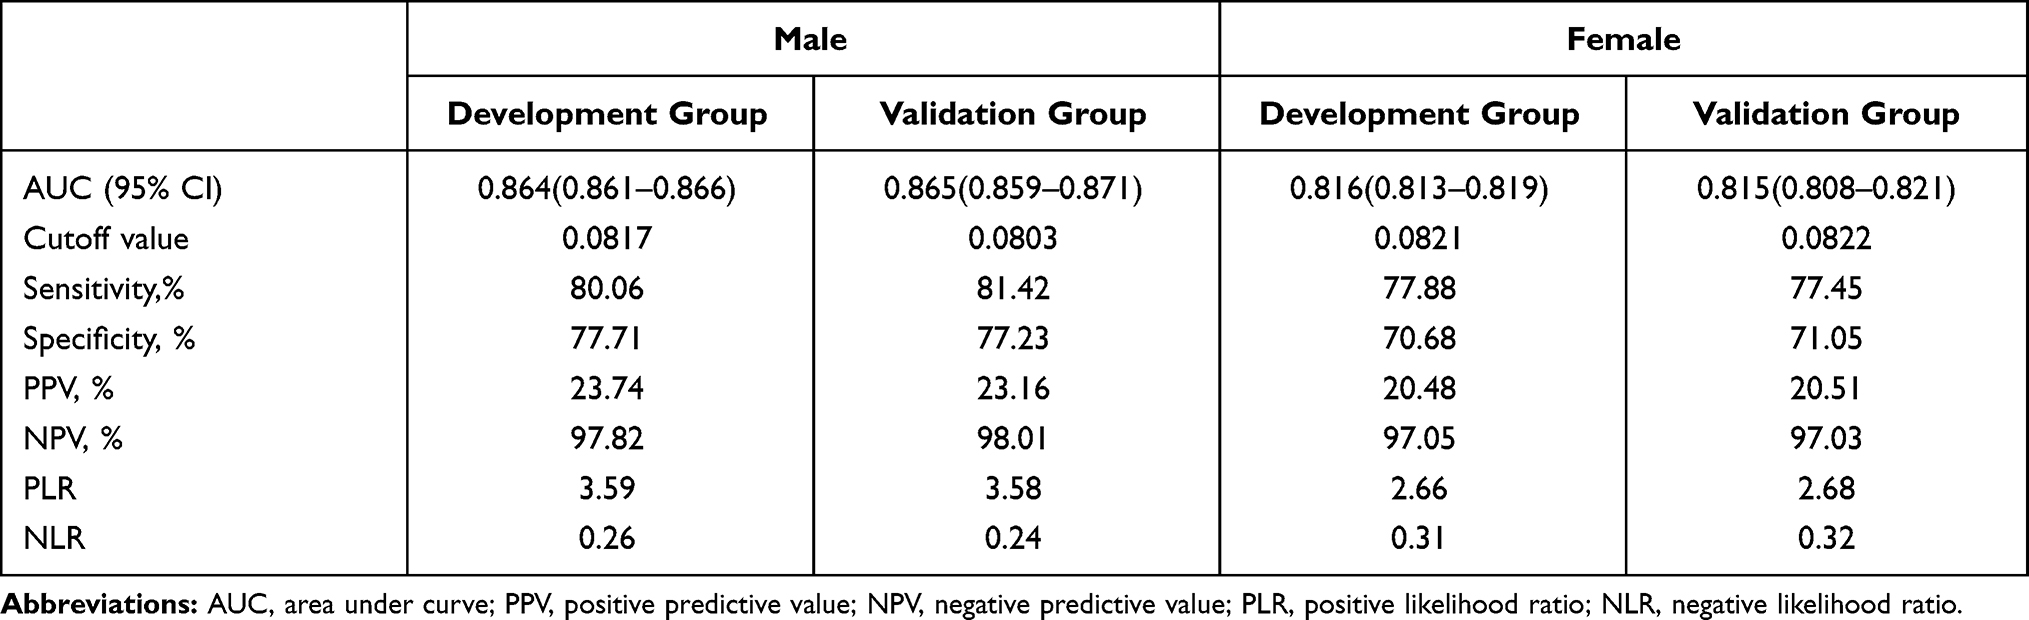 |
Table 4 Prediction Performance of the Nomogram for Estimating Hypertension |
The calibration of the prediction model was evaluated by Hosmer–Lemeshow test, and the calibration curve had been drawn (Figure 4). When P > 0.05, the ability was better. The calibration curves of men and women in the development group were P = 0.089 and 0.227, respectively, while those of the validation group were P = 0.517 and 0.438, respectively. Both calibration curves were greater than 0.05, indicating that the model had good calibration ability.
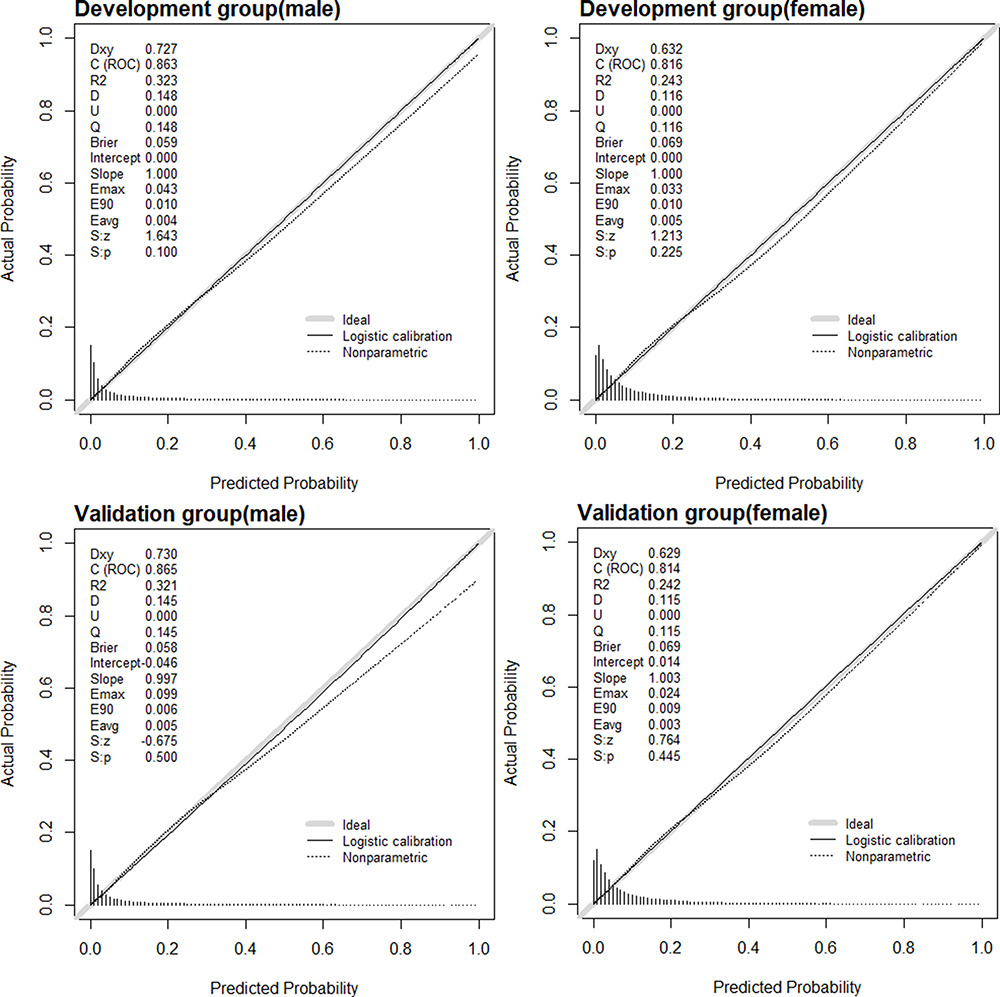 |
Figure 4 Calibration curves for the validation and development group models. |
Figure 5 depicts the CDA curve of development and validation groups for predicting T2DM incidence rate. The gray line represented the model, the blue line represented the net benefit when all participants had T2DM, while the red line represented the net benefit when no participant had T2DM. The area between the “red line” and “blue line” of the model curve meant the clinical validity of the model. If the gray line is above the horizontal red line and the left oblique blue line, we can think that the gray line value of this section can benefit. From the CDA curve, the net benefit of the development group and the validation group of the men and women prediction model was significantly higher than that of the two extreme cases, everyone got the benefit. For example, in the development group, at a risk threshold of 20%, the net benefit of men was about 2%. The nomogram model is a good assessment tool because of available selectivity threshold probability.
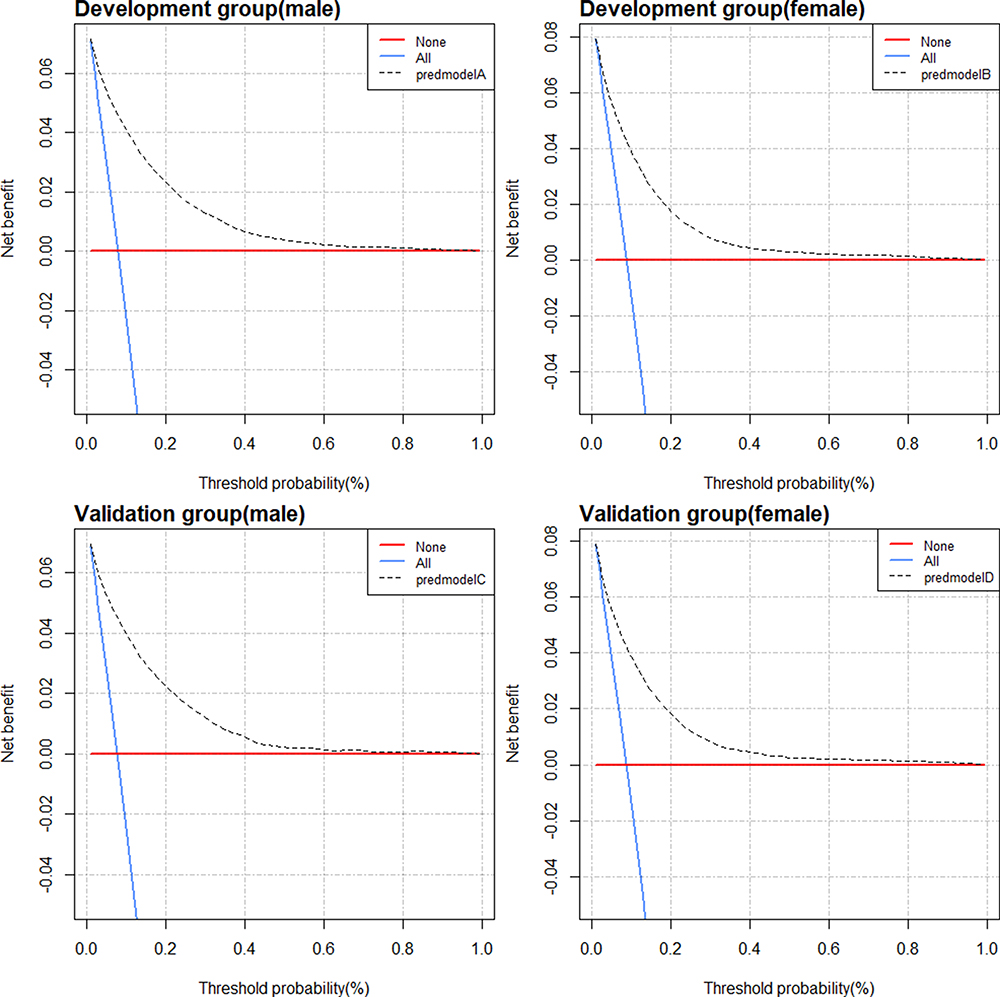 |
Figure 5 The CDA curve of T2DM risk prediction nomogram model in the validation and development groups. |
ROC was used for the optimized thresholds of predicting T2DM risk factors in men and women (Table 5). The age, WC, TC, TG, HDLc, BMI of men was 52.5 years old, 85.50cm, 4.94mmol/L, 1.26mmol/L, 1.40mmol/L, and 24.70kg/m2, respectively. And for women, the corresponding value was 48.5 years old, 89.9cm, 4.94mmol/L, 1.67mmol/L, 1.40mmol/L, and 24.95kg/m2, respectively.
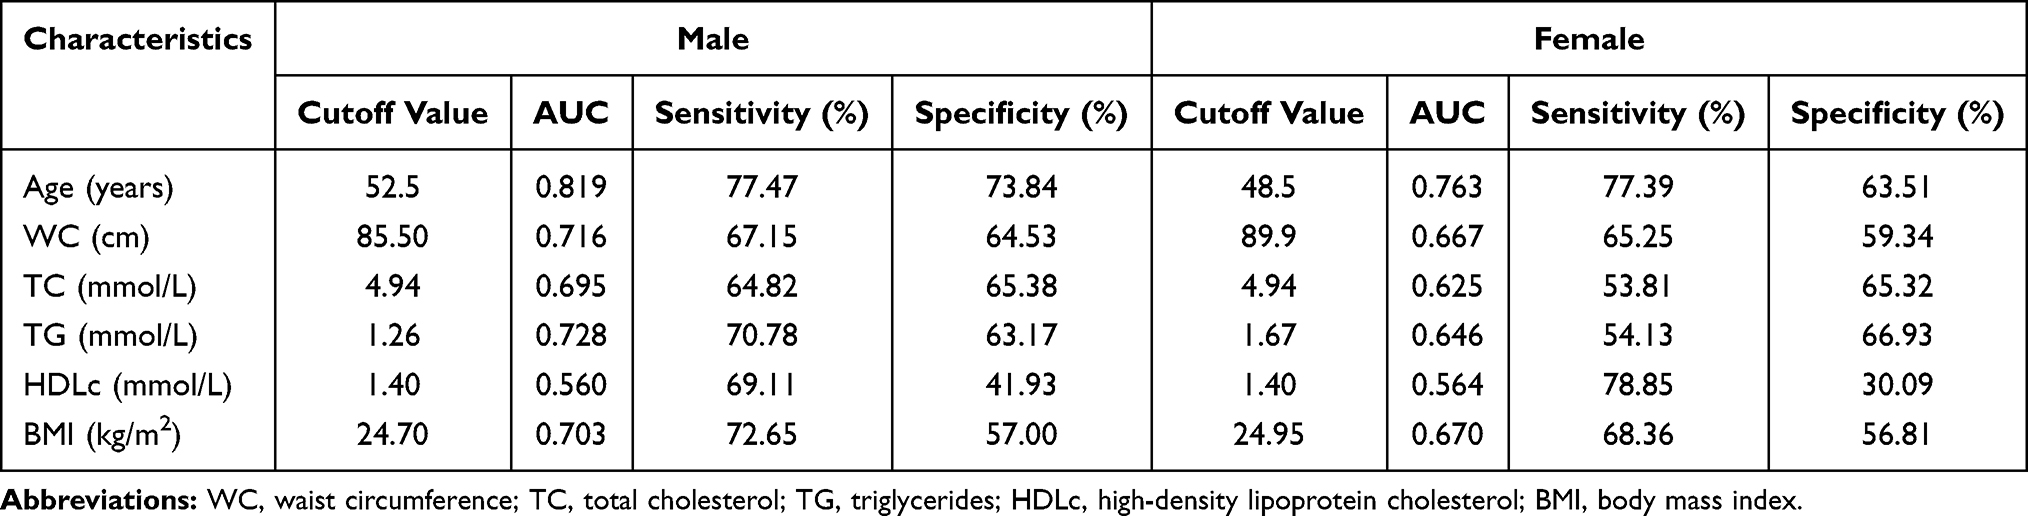 |
Table 5 ROC of the Risk Factors in the Development Group (N=386,413) |
Figures 6 and 7 show the ROC curves of various risk factors for men and women in the development group. The best cut-off values for the prediction probability of age, BMI, WC, TC, TG, HDLc of men were 0.079, 0.076, 0.066, 0.080, 0.076, and 0.086, respectively, while 0.079, 0.094, 0.067 0.083, 0.081 and 0.085 of women, respectively.
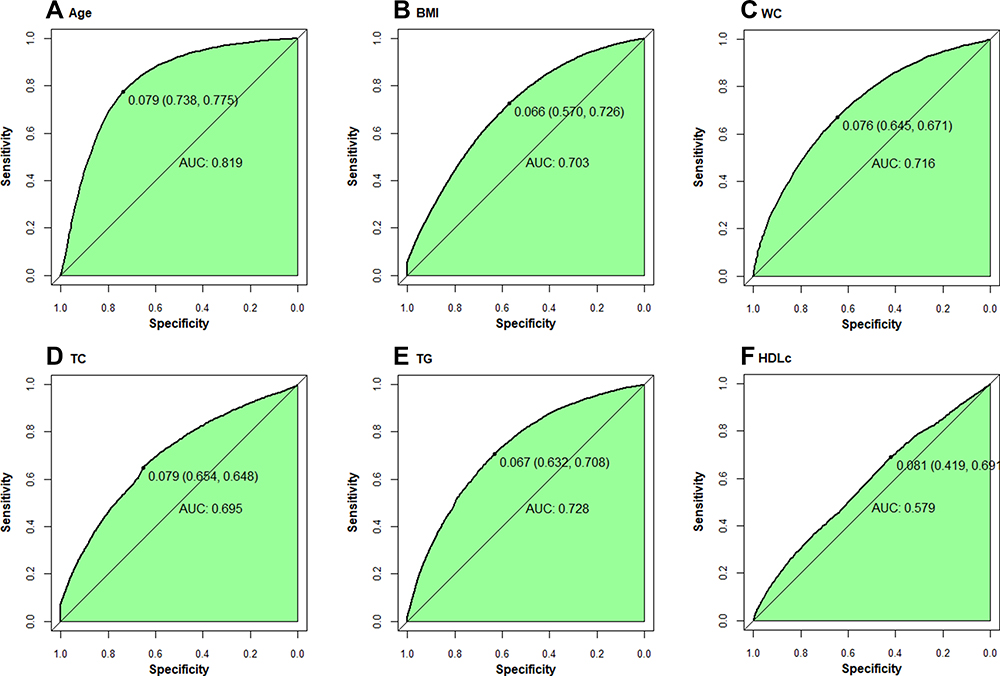 |
Figure 6 ROC curve of risk factors in the development group (men). |
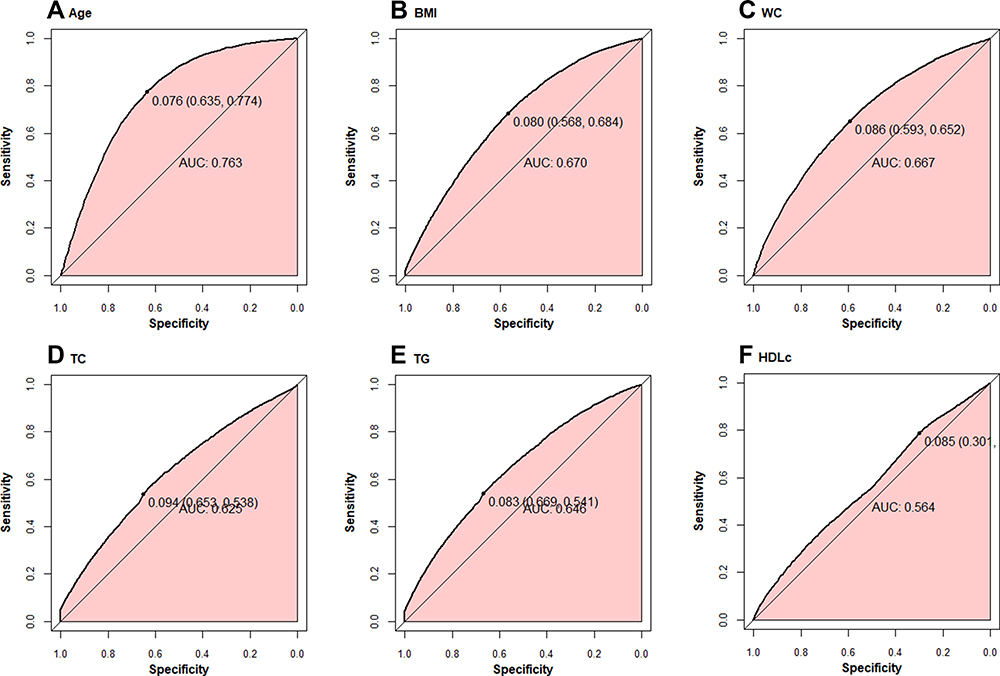 |
Figure 7 ROC curve of risk factors in the development group (women). |
Discussion
Primary prevention and timely intervention are the core to prevent or delay the onset of T2DM, indicating that it is crucial to identify the high-risk group of diabetes. In this study, we developed a quantifiable and simple nomogram model to predict the risk of type 2 diabetes in western Xinjiang, China, which can help clinicians identify high-risk or low-risk patients with T2DM. Through analysis, the age, FHOT, WC, TC, TG, BMI, HDLc, and history of hypertension were independent risk factors of T2DM. Data were randomly divided into development group (n=366,523) and validation group (n=91,630), analysis demonstrated that the model in both groups facilitated great discrimination ability, as AUC in the development group was 0.894 and 0.816 for men and women, respectively, and 0.865,0.815 for men and women respectively in the validation group.
The American Diabetes Association (ADA) provided a simple “T2DM risk test”, which used age, gender, family history of diabetes, hypertension, physical activity and weight status, and can be used by 10 populations to assess the risk of diabetes.25 In 2010, Chitlert Pongchayakul et al26 proposed a prediction model to predict the risk of diabetes in Thai population, whose studies showed that age, gender, BMI and systolic blood pressure (SBP) were independently associated with the risk of type 2 diabetes. In 2013–2014, Seung Min Chung et al27 established a simple risk prediction model for the Korean population based on the data of the national health and nutrition survey of South Korea, which indicated that age, gender, education level, income status, smoking status, waist circumference, family history of T2DM, previous hypertension, dyslipidemia or cardiovascular history were independent risk factors of T2DM. In 2015, Carlos et al28 developed a simple nomogram in Hong Kong, China, to predict the risk of diabetes in the normal population, and the results had shown that the effect of semi-laboratory model was better than that of non-laboratory model when laboratory test data such as triglycerides were added. From 2016 to 2017, Li et al29 established non-laboratory and semi-laboratory risk prediction models for diabetes mellitus based on a multi-center and multi-ethnic cross-sectional study on six ethnic groups in seven provinces of China. The non-laboratory model showed that gender, age, body mass index, waist circumference, high blood pressure, race, daily vegetable consumption and family history of diabetes were independent risk factors for diabetes. The AUC of the semi-laboratory model (86.8%) was significantly higher than that of the non-laboratory model (76.3%). Based on the above research, we found that the effect of semi-laboratory model depending on questionnaire survey information and laboratory examination information was significantly higher than that of non-laboratory model.
There are several diabetes risk predicting models; however, most of which mainly focused on developed areas such as East China and South China, fewer associated with semi-laboratory. Taking the differences of surroundings and genetics into consideration, the risk factors of T2DM owned different distributions, indicating that the predicting model performed different in various populations.30 Even individuals of the same ethnic group living in different cultural environments may perform differently.31 Therefore, we established the semi-laboratory T2DM predicting model based on population in western Xinjiang, China.
This study suggested that age, BIMI, WC were the independent risk factors of T2DM, which was consistent with other studies.8–10 T2DM mainly occurred in adults and the old people, as the aging β cells may show low glucose responsiveness and glucose sensitivity, resulting in hyperglycemia and T2DM.32 Most people with insulin resistance were overweight and obesity,33 studies had shown that metabolic disorders and adipose organ dysfunction caused by obesity played a key role in insulin resistance.34 In this study, FHOT was viewed as the key risk factors of T2DM, which was consistent with the previous studies.35,36 Compared with those without family history, people with family history of T2DM had an increased risk of T2DM by 2 to 30 times.37 Previous history of hypertension was also an important risk factor for T2DM, which was consistent with other studies.38,39 People with hypertension were more likely to develop diabetes than those with normal blood pressure. We have taken TC, TG, HDLc and some variables measured through laboratory into the prediction model, whose results suggested that the TC and TG were the independent risk factors of T2DM, while the HDLc was the protective factor, which was similar to corresponding studies.40 Few studies consisted of information about 2hPG insulin resistance and genetic markers, as the testing cost for which was expensive, and needed amount of time. The addition of 2hPG and insulin resistance did not improve the accuracy of risk prediction of simple clinical model.41 CDA analysis indicated that the nomogram could reduce the disease burden and cost because of the prevention of oral glucose tolerance test in low-risk population. In this study, we estimated the optimized thresholds of predicting the T2DM incidence based on a large sample and offered a reference for people in western Xinjiang, China.
There are some advantages in our model’ on the one hand, we used a relatively large community-based sample to set up models that ensure representativeness and stability. On the other hand, the nomogram is composed of questionnaire and laboratory indicators, including various types of variables, which improves the predicting accuracy. The limitations in this study are as follows: firstly, we failed to analyze the causal relationship from the cross-sectional data of national health examination, which needs further verification in the future research. Secondly, the data used in this study is the physical examination data of Yili prefecture, China, which may limit the extrapolation of the results. Thirdly, not all risk factors of T2DM were contained, which may lead to bias in predicting.
Conclusions
Xinjiang occupies one-sixth land areas of China, and the incidence of diabetes has always been in the forefront. As far as we know, this is the first nomogram study designed for northern China using semi-laboratory indicators. We designed nomogram models for Xinjiang people in China, and screened eight risk factors including age, FHOT, WC, TG, TC, BMI, HDLc and previous hypertension condition to predict diabetes through LASSO regression and multivariate logistic regression analysis. The screening models we conducted can be used as the tool for identifying citizens with high risk for diabetes in western Xinjiang, China, which is simple, affordable and suitable for wide use.
Data Sharing Statement
The datasets generated and analyzed during the current study are available from the corresponding author on reasonable request.
Compliance with Ethics Guidelines
The study was approved by the local ethics committees of all study sites and all patients provided written informed consent for participation in the study. All procedures performed in studies were in accordance with the ethical standards of the institutional committee and with the 1964 Helsinki Declaration and its later amendments or comparable ethical standards.
Acknowledgments
Thanks to the health commission of Xinjiang Uygur Autonomous Region and the health management institute of Xinjiang medical university for data support, as well as Professor Wang Kai, School of medical engineering and technology of Xinjiang Medical University for guidance. Thanks to all the participants for their help. This project is supported by the Xinjiang science and technology support project (No.2018E02057) and the Program for Tianshan Innovative Research Team of Xinjiang Uygur Autonomous Region,China (2020D14020).
Author Contributions
WK and YH conceived the study. WYS, SYX, LWL, ZGJH and WSX collected the data. WYS, ZYS and WK performed the statistical analyses. ZYS and WYS drafted the manuscript. WSX and YH critically reviewed and edited the manuscript. All authors contributed to data analysis, drafting and revising the article, gave final approval of the version to be published, have agreed on the journal to which the article has been submitted, and agree to be accountable for all aspects of the work.
Disclosure
The authors declare that they have no conflict of interest.
References
1. Mo RH, Shi R, Hu YH, Hu F. Nomogram-based prediction of the risk of diabetic retinopathy: a retrospective study. J Diabetes Res. 2020;3:1–9. doi:10.1155/2020/7261047
2. Wolde HF, Atsedeweyen A, Jember A, et al. Predictors of vascular complications among type 2 diabetes mellitus patients at University of Gondar Referral Hospital: a retrospective follow-up study. BMC Endocr Disord. 2018;18:52. doi:10.1186/s12902-018-0280-0
3. Eid S, Sas KM, Abcouwer SF, et al. New insights into the mechanisms of diabetic complications: role of lipids and lipid metabolism. Diabetologia. 2019;62:1539–1549. doi:10.1007/s00125-019-4959-1
4. Fuso L, Pitocco D, Antonelli Incalzi R. Diabetic lung, an underrated complication from restrictive functional pattern to pulmonary hypertension. Diabetes Metab Res Rev. 2019;35:e3159. doi:10.1002/dmrr.3159
5. Hu G, Lindström J, Jousilahti P, et al. The increasing prevalence of metabolic syndrome among Finnish men and women over a decade. J Clin Endocrinol Metab. 2008;93:832–836. doi:10.1210/jc.2007-1883
6. International Diabetes Federation, IDF Diabetes Atlas, International Diabetes 297 Federation, Brussels, Belgium, 9th edition, 2019.
7. Wild S, Roglic G, Green A, Sicree R, King H. Global prevalence of diabetes: estimates for the year 2000 and projections for 2030. Diabetes Care. 2004;27:1047–1053. doi:10.2337/diacare.27.5.1047
8. Duarte AA, Mohsin S, Golubnitschaja O. Diabetes care in figures: current pitfalls and future scenario. EPMA J. 2018;9(2):125–131. doi:10.1007/s13167-018-0133-y
9. Golubnitschaja O, Costigliola V. General report & recommendations in predictive, preventive and personalised medicine 2012: white paper of the European Association for Predictive, Preventive and Personalised Medicine. EPMA J. 2012;3(1):14. doi:10.1186/1878-5085-3-14
10. Xue M, Su Y, Feng Z, et al. A nomogram model for screening the risk of diabetes in a large-scale Chinese population: an observational study from 345,718 participants. Entific Reports. 2020;10(1):11600.
11. Weng J, Ji L, Jia W, et al. Standards of care for type 2 diabetes in China. Diabetes Metab Res Rev. 2016;32:442–458. doi:10.1002/dmrr.2827
12. Lin Z, Guo D, Chen J, et al. A nomogram for predicting 5-year incidence of type 2 diabetes in a Chinese population. Endocrine. 2020;67(3):561–568. doi:10.1007/s12020-019-02154-x
13. Ley SH, Hamdy O, Mohan V, Hu FB. Prevention and management of type 2 diabetes: dietary components and nutritional strategies. Lancet. 2014;383(9933):1999–2007. doi:10.1016/S0140-6736(14)60613-9
14. Hernández M, Ruiz de Eguilaz M, Batlle MA, et al. [Alimentary and lifestyle changes as a strategy in the prevention of metabolic syndrome and diabetes mellitus type 2: milestones and perspectives]. An Sist Sanit Navar. 2016;39(2):269–289. Turkish.
15. Sathish T. Diabetes prevention and lifestyle intervention in resource-limited settings. Lancet Diabetes Endocrinol. 2019;7(3):165–167. doi:10.1016/S2213-8587(19)30027-0
16. Kolb H, Martin S. Environmental/lifestyle factors in the pathogenesis and prevention of type 2 diabetes. BMC Med. 2017;15(1):131. doi:10.1186/s12916-017-0901-x
17. Dennison RA, Ward RJ, Griffin SJ, et al. Women’s views on lifestyle changes to reduce the risk of developing Type 2 diabetes after gestational diabetes: a systematic review, qualitative synthesis and recommendations for practice. Diabet Med. 2019;36(6):702–717. doi:10.1111/dme.13926
18. le Roux CW, Astrup A, Fujioka K, et al. 3 years of liraglutide versus placebo for type 2 diabetes risk reduction and weight management in individuals with prediabetes: a randomised, double-blind trial. Lancet. 2017;389(10077):1399–1409. doi:10.1016/S0140-6736(17)30069-7
19. Kim SH, Shin KH, Kim HY, et al. Postoperative nomogram to predict the probability of metastasis in Enneking stage IIB extremity osteosarcoma. BMC Cancer. 2014;14(1):666. doi:10.1186/1471-2407-14-666
20. Schaefer KK, Xiao WQ, Chen QZ, et al. Prediction of gestational diabetes mellitus in the Born in Guangzhou Cohort Study, China. Int J Gynaecol Obstet. 2018;143:164–171. doi:10.1002/ijgo.12627
21. Mansfield ER, Helms BP. Detecting multicollinearity. Am Stat. 1982;36:158–160.
22. Harrell FE
23. Kramer AA, Zimmerman JE. Assessing the calibration of mortality benchmarks in critical care: the Hosmer–Lemeshow test revisited. Crit Care Med. 2007;35:2052–2056. doi:10.1097/01.CCM.0000275267.64078.B0
24. Fitzgerald M, Saville BR, Lewis RJ. Decision curve analysis. JAMA. 2015;313(4):409–410. doi:10.1001/jama.2015.37
25. American Diabetes Association. 2. Classification and Diagnosis of Diabetes. Diabetes Care. 2017;40(Suppl 1):S11–S24. doi:10.2337/dc17-S005
26. Pongchaiyakul C, Kotruchin P, Wanothayaroj E, et al. An innovative prognostic model for predicting diabetes risk in the Thai population. Diabetes Res Clin Pract. 2011;94(2):193–198. doi:10.1016/j.diabres.2011.07.019
27. Chung SM, Park JC, Moon JS, et al. Novel nomogram for screening the risk of developing diabetes in a Korean population. Diabetes Res Clin Pract. 2018;38(02):163–175.
28. Wong CK, Siu SC, Wan EY, et al. Simple non-laboratory- and laboratory-based risk assessment algorithms and nomogram for detecting undiagnosed diabetes mellitus. J Diabetes. 2016;8(3):414–421. doi:10.1111/1753-0407.12310
29. Li W, Xie B, Qiu SH, et al. Non-lab and semi-lab algorithms for screening undiagnosed diabetes: a cross-sectional study. EBioMedicine. 2018;35:307–316. doi:10.1016/j.ebiom.2018.08.009
30. Lacy ME, Wellenius GA, Carnethon MR, et al. Racial differences in the performance of existing risk prediction models for incident type 2 diabetes: the CARDIA study. Diabetes Care. 2016;39(2):285–291.
31. Ramachandran A, Snehalatha C, Vijay V, Wareham NJ, Colagiuri S. Derivation and validation of diabetes risk score for urban Asian Indians. Diabetes Res Clin Pract. 2005;70(1):63–70. doi:10.1016/j.diabres.2005.02.016
32. Coordt MC, Ruhe RC, McDonald RB. Aging and insulin secretion. Proc Soc Exp Biol Med. 1995;209:213–222. doi:10.3181/00379727-209-43879B
33. Popkin BM, Adair LS, Ng SW. Global nutrition transition and the pandemic of obesity in developing countries. Nutr Rev. 2012;70:3–21. doi:10.1111/j.1753-4887.2011.00456.x
34. Barazzoni R, Gortan Cappellari G, Ragni M, Nisoli E. Insulin resistance in obesity: an overview of fundamental alterations. Eat Weight Disord. 2018;23:149–157. doi:10.1007/s40519-018-0481-6
35. Hemminki K, Li X, Sundquist K, Sundquist J. Familial risks for type 2 diabetes in Sweden. Diabetes Care. 2010;33:293–297. doi:10.2337/dc09-0947
36. Sakurai M, Nakamura K, Miura K, et al. Family history of diabetes, lifestyle factors, and the 7-year incident risk of type 2 diabetes mellitus in middle-aged Japanese men and women. J Diabetes Investig. 2013;4:261–268. doi:10.1111/jdi.12033
37. Cornelis MC, Zaitlen N, Hu FB, Kraft P, Price AL. Price, Genetic and environmental components of family history in type 2 diabetes. Hum Genet. 2015;134:259–267. doi:10.1007/s00439-014-1519-0
38. Cryer MJ, Horani T, Dipette DJ. Diabetes and hypertension: a comparative review of current guidelines. J Clin Hypertens (Greenwich). 2016;18(2):1631–1635. doi:10.1111/jch.12638
39. Sowers JR. Insulin resistance and hypertension. Am J Physiol Heart Circ Physiol. 2004;286:H1597–H1602. doi:10.1152/ajpheart.00026.2004
40. Wang K, Gong M, Xie S, et al. Nomogram prediction for the 3-year risk of type 2 diabetes in healthy mainland China residents. EPMA J. 2019;10:227–237. doi:10.1007/s13167-019-00181-2
41. Gao WG, Dong YH, Pang ZC, et al. A simple Chinese risk score for undiagnosed diabetes. Diabet Med. 2010;27(3):274–281. doi:10.1111/j.1464-5491.2010.02943.x
 © 2021 The Author(s). This work is published and licensed by Dove Medical Press Limited. The full terms of this license are available at https://www.dovepress.com/terms.php and incorporate the Creative Commons Attribution - Non Commercial (unported, v3.0) License.
By accessing the work you hereby accept the Terms. Non-commercial uses of the work are permitted without any further permission from Dove Medical Press Limited, provided the work is properly attributed. For permission for commercial use of this work, please see paragraphs 4.2 and 5 of our Terms.
© 2021 The Author(s). This work is published and licensed by Dove Medical Press Limited. The full terms of this license are available at https://www.dovepress.com/terms.php and incorporate the Creative Commons Attribution - Non Commercial (unported, v3.0) License.
By accessing the work you hereby accept the Terms. Non-commercial uses of the work are permitted without any further permission from Dove Medical Press Limited, provided the work is properly attributed. For permission for commercial use of this work, please see paragraphs 4.2 and 5 of our Terms.