")
Back to Journals » Diabetes, Metabolic Syndrome and Obesity » Volume 13
Nomogram for the Risk of Diabetic Nephropathy or Diabetic Retinopathy Among Patients with Type 2 Diabetes Mellitus Based on Questionnaire and Biochemical Indicators: A Cross-Sectional Study
Authors Shi R, Niu Z , Wu B , Zhang T, Cai D, Sun H, Hu Y , Mo R, Hu F
Received 31 December 2019
Accepted for publication 8 April 2020
Published 20 April 2020 Volume 2020:13 Pages 1215—1229
DOI https://doi.org/10.2147/DMSO.S244061
Checked for plagiarism Yes
Review by Single anonymous peer review
Peer reviewer comments 2
Editor who approved publication: Dr Konstantinos Tziomalos
Rong Shi, Zheyun Niu, Birong Wu, Taotao Zhang, Dujie Cai, Hui Sun, Yuhong Hu, Ruohui Mo, Fan Hu
School of Public Health, Shanghai University of Traditional Chinese Medicine, Shanghai, People’s Republic of China
Correspondence: Fan Hu
School of Public Health, Shanghai University of Traditional Chinese Medicine, Shanghai, People’s Republic of China
Tel +8613585828140
Fax +862151322466
Email [email protected]
Purpose: This study aimed to develop a diabetic nephropathy (DN) or diabetic retinopathy (DR) incidence risk nomogram in China’s population with type 2 diabetes mellitus (T2DM) based on a community-based sample.
Methods: We carried out questionnaire evaluations, physical examinations and biochemical tests among 4219 T2DM patients in Shanghai. According to the incidence of DN and DR, 4219 patients in our study were divided into groups of T2DM patients with DN or DR, patients with both, and patients without any complications. We successively used least absolute shrinkage and selection operator regression analysis and logistic regression analysis to optimize the feature selection for DN and DR. To ensure the accuracy of the results, we carried out multivariable logistic regression analysis of the above significant risk factors on the sample data for both DN and DR. The selected features were included to establish a prediction model. The C-index, calibration plot, curve analysis and internal validation were used to validate the distinction, calibration, and clinical practicality of the model.
Results: The predictors in the prediction model included disease course, body mass index (BMI), total triglycerides (TGs), systolic blood pressure (SBP), postprandial blood glucose (PBG), haemoglobin A1C (HbA1c) and blood urea nitrogen (BUN). The model displayed moderate predictive power with a C-index of 0.807 and an area under the receiver operating characteristic curve of 0.807. In internal verification, the C-index reached 0.804. The risk threshold was 16– 75% according to the analysis of the decision curve, and the nomogram could be applied in clinical practice.
Conclusion: This DN or DR incidence risk nomogram incorporating disease course, BMI, TGs, SBP, PBG, HbA1c and BUN can be used to predict DN or DR incidence risk in T2DM patients. The research team has developed an online app based on a clinical prediction model incorporating risk factors for rapid and simple prediction.
Keywords: diabetic nephropathy, diabetic retinopathy, predictors, nomogram, type 2 diabetes mellitus
Introduction
Type 2 diabetes mellitus (T2DM) is a type of progressive endocrine disease associated with various metabolic disorders that is clinically characterized by hyperglycemia.1 According to the latest Diabetes Atlas released by the International Diabetes Federation (IDF) in 2019, approximately 463 million adults aged 20 to 79 years old in the world have diabetes. It is estimated that in 2045, the number of individuals with diabetes mellitus (DM) will reach 700.2 million. In 2019, the number of diabetic patients in China was 116 million, and the number is expected to be 147 million by 2045. In addition, diabetes is accompanied by many complications. In recent years, DM incidence has been exhibiting increasing trends in younger populations. According to the IDF report, diabetes and its complications were responsible for the deaths of approximately 4.2 million adults aged 20 to 79 in 2019, which accounts for 11.3% of global deaths.
Diabetic nephropathy (DN) and diabetic retinopathy (DR) are two typical microvascular complications of T2DM. DN is progressive renal failure characterized by persistent proteinuria and hypertension,2–4 which is one of the most common complications of diabetes5 and the major pathogenesis of end-stage renal disease (ESRD) in developed countries. DR patients lose their vision due to retinal detachment, preretinal or vitreous haemorrhage, neovascular glaucoma, macular degeneration or capillary perfusion.6 Kainz et al predicted that the prevalence of ESRD caused by DN would increase by 3.2% per year from 2012 to 2015.7 In China, the incidence of DN in patients with T2DM is 20% to 40%.2 The global incidence of DR is nearly 30%.8 In 2010, the number of patients with DR was 126.6 million worldwide, and this number is expected to increase by approximately 50.87% in 20 years.9 In this study, we collected 4219 effective data points, revealing a prevalence of DN of 27.97% and a prevalence of DR of 11.33%. DN and DR not only impose a heavy financial burden associated with medical treatment but also seriously affect the quality of life of the patients and increases the risk of death of T2DM patients.2 DN and DR are closely related. Some studies have shown that the prevalence of DR in patients with DN confirmed by biopsy was 48%,9 and the prevalence of DN in patients with confirmed DR was 35.6%.10 Compared with the prevalence of DN or DR mentioned above, DN significantly increased the possibility of developing DR in these patients,11 and the same is true for the opposite relationship. There is evidence that DR has a potential role in predicting the occurrence of DN.12 In the clinical diagnosis of DN, the disease course of DR is also an important factor.13 Compared with DN patients with DR, DN patients without DR have less renal damage and better prognosis.14 On the other hand, many studies have shown that proteinuria is not only a diagnostic sign of DN but also a diagnostic sign of DR. The reasons for the connection between DN and DR in different studies are as follows. Some studies have shown that the gene 677C/T polymorphism might be related to an increased risk of DN and DR.15 Some scholars think that there are similar molecular pathways leading to damage to the diabetic kidney and retinal microvasculature,16,17 and oxidative stress plays an important role in this process.18
This study aims to build a convenient and practical prediction model to evaluate the risk of DN or DR in T2DM patients. At present, most literature related to T2DM is related to factors of DN or DR. To avoid neglecting the potential relationship between DN and DR and improve the reliability of the results, this study first screened the risk factors for DN and DR, and patients with both DN and DR were further tested.
Patients and Methods
Patients
Through cooperation with the community health centre affiliated with Shanghai University of Traditional Chinese Medicine, a retrospective survey of T2DM patients in six communities in Shanghai was carried out from September 2014 to September 2019, including the Community of Huamu, the Community of Jinyang, the Community of Sanlin, the Community of Siping, the Community of Yinhang and the Community of Daqiao. In the process of data sorting, the patients with abnormal or missing indicators were removed. The following were the inclusion criteria: patients with T2DM with a registered regional household or who were permanent residents (living in the community for more than 6 months). None of the participants had severe chronic diseases (advanced malignant tumour, cirrhosis, liver failure, myocardial infarction or severe heart failure). Finally, 4219 patients were included in the study. Among them, 1180 diabetes patients were diagnosed with DN, 478 with DR, and 417 with DN and DR. Before the data were included in the study, we obtained informed consent from all participants, and they signed an informed consent form.
For the diagnosis of DR, the fundi of patients were examined by using a nonmydriatic fundus camera (CR-2 AF, Canon Inc., Tokyo, Japan) to obtain digital, colour and nonstereoscopic retina photos. A 45° digital retinal photograph of the posterior pole of each eye was saved in JPG format (2592×1728 pixels). According to the severity classification definition of early Treatment Diabetic Retinopathy (ETDRS), if any characteristic lesions are detected, the patient will be diagnosed as DR, including microarterial aneurysm, hard exudate, wadding spot, hemorrhage, new retinal vessels, proliferative vitreoretinopathy (PVR), photocoagulation scar, retinal detachment vitreoretinopathy.19,20 The minimum standard for DR diagnosis is to have at least one confirmed microaneurysm in any photography area.19 There were obvious differences between normal retinas and pathological retinas (Figure 1). According to the ratio of microalbumin to creatinine (ACR), DN was divided into three stages: non-albuminuria (NAU) with ACR < 30 mg/g, microalbuminuria (MAU) with 30≤ACR≤300 mg/g, and clinical albuminuria (CAU) with ACR>300 mg/g.21 Both MAU and CAU indicated DN in this study.
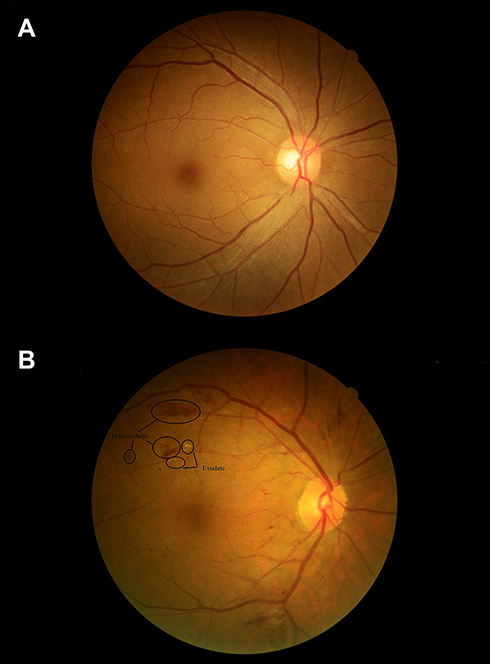 |
Figure 1 The fundus photos of non-DR and DR patients with T2DM. Notes: (A) The fundus photo reflects the normal fundus characteristics of patients with T2DM. (B) The fundus photo reflects the abnormal fundus characteristics of DR patients. |
Methods
Index Measurement Method
In this study, biochemical indexes were tested in cooperation with affiliated community health centres and central hospitals. According to China guideline for type 2 diabetes 2017, some relevant blood and urine indexes of patients were tested. Biochemical indexes included fasting blood glucose (FBG), postprandial blood glucose (PBG), glycosylated haemoglobin A1c (HbA1c), total cholesterol (TC), triglycerides (TGs), low-density lipoprotein cholesterol (LDL-C), high-density lipoprotein cholesterol (HDL-C), blood urea nitrogen (BUN), serum creatinine (SCR), uric acid (UA), uric creatinine (UCR) and urinary microalbumin (UMA). ACR was calculated according to the UCR and UMA. All eligible participants were informed in advance to maintain a normal lifestyle for at least 5 days before the biochemical test and to fast for at least 10 hours before the test. The patients’ fasting blood samples were collected before the participants could eat. Blood samples were taken again 2 hours after a meal. Additionally, the patients were asked to empty their bladder and collect their urine at 2 hours. All blood samples were centrifuged in situ within 30 minutes after collection and sent to Ruijin Hospital Affiliated with Shanghai Jiaotong University for inspection on the same day. Urine biochemical indexes were analysed by urine test 500B (RIT, China). The investigators conducted a questionnaire survey, and the design of the questionnaire referred to the relevant content in the China guideline for type 2 diabetes 2017, including sociodemographic characteristics (sex, age), lifestyle factors (smoking, alcohol), disease course, family history of diabetes (FHD) and complications (DN and DR). Body mass index (BMI) and abdominal obesity (Aobesity) were calculated according to the weight, height and waist circumference that were measured by a standardized protocol. After the participants had been sitting for 5 minutes, systolic blood pressure (SBP) and diastolic blood pressure (DBP) were measured with the sphygmomanometer (Model: HEM-7137. Specification: body weight excluding battery: 300g, width: 110mm, height: 86mm, length excluding arm belt: 150 mm; arm belt (central part of upper arm): 220mm-320mm. China drug regulatory No.: 2016 No. 2200146).
Statistical Analysis
According to the incidence of DN and DR, 4219 patients in our study could be divided into groups as follows: T2DM patients with DN or DR, patients with both, and patients without any complications. The purpose of this study was to establish a risk prediction model for DN and DR in patients with T2DM. All data analyses in this study were conducted by R software (version 3.6.2; https://www.r-project.org). First, we screened the risk factors for DN and DR by the least absolute contraction selection operator (LASSO). This method is suitable for high dimensional data compression and can be used to analyse the optimal predicted risk factors of the disease.22 After features with nonzero coefficients in the LASSO regression model were selected, multivariable logistic regression analysis was performed on patients with DN and DR to screen out all significant risk factors. Multivariable logistic regression analysis was usually used to develop the predicting model23 Due to the potential connection between DN and DR, to ensure the accuracy of the results, we carried out multivariable logistic regression analysis of the above significant risk factors on the sample data of patients with both DN and DR. The features were assessed by odds ratios (ORs) with 95% confidence intervals (CIs), and the corresponding P-values were then obtained. The statistical significance levels were all two-sided. Then, we selected features with P≤0.05 and built the nomogram prediction model and tested the accuracy of the above features through nomogram−predicted probability of DN or DR incidence risk, calibration, C index, receiver operating characteristic (ROC) curve, and decision curve analysis (DCA) measurements. ROC curve with AUC is a useful tool to evaluate the performance of biomedical and chemoinformatics data.24 And DCA can be used in performance measures for prediction models.25 The reliability and replicability of above study methods have been proved in many other studies. Lyu et al carried out logistic regression analysis to establish the risk prediction model of new acute coronary artery disease in the population with type 2 diabetes. And the stability of the model is verified by calibration, C index, ROC and DCA.26 An article published in EBioMedicine applied the similar methods were used to screen the undiagnosed diabetes.27 Besides, these methods were also used to predict the risk of drug noncompliance in Chinese patients with inflammatory rheumatism.2,2 To further verify the stability of this prediction model, the whole data set was used for internal verification, and the C index was obtained.
Results
Patient Characteristics
The 4219 T2DM patients in our study were divided into four groups: patients without DN or DR (n =2144), patients with DR and no DN (n=478), patients with DN and no DR (n=1180), and patients with DN and DR (n=417). Among all participants, there were 1775 men and 2444 women. The mean age of the participants was 64.50±6.76 years. The specific demographic indicators and clinical characteristics of the four groups are given in Table 1.
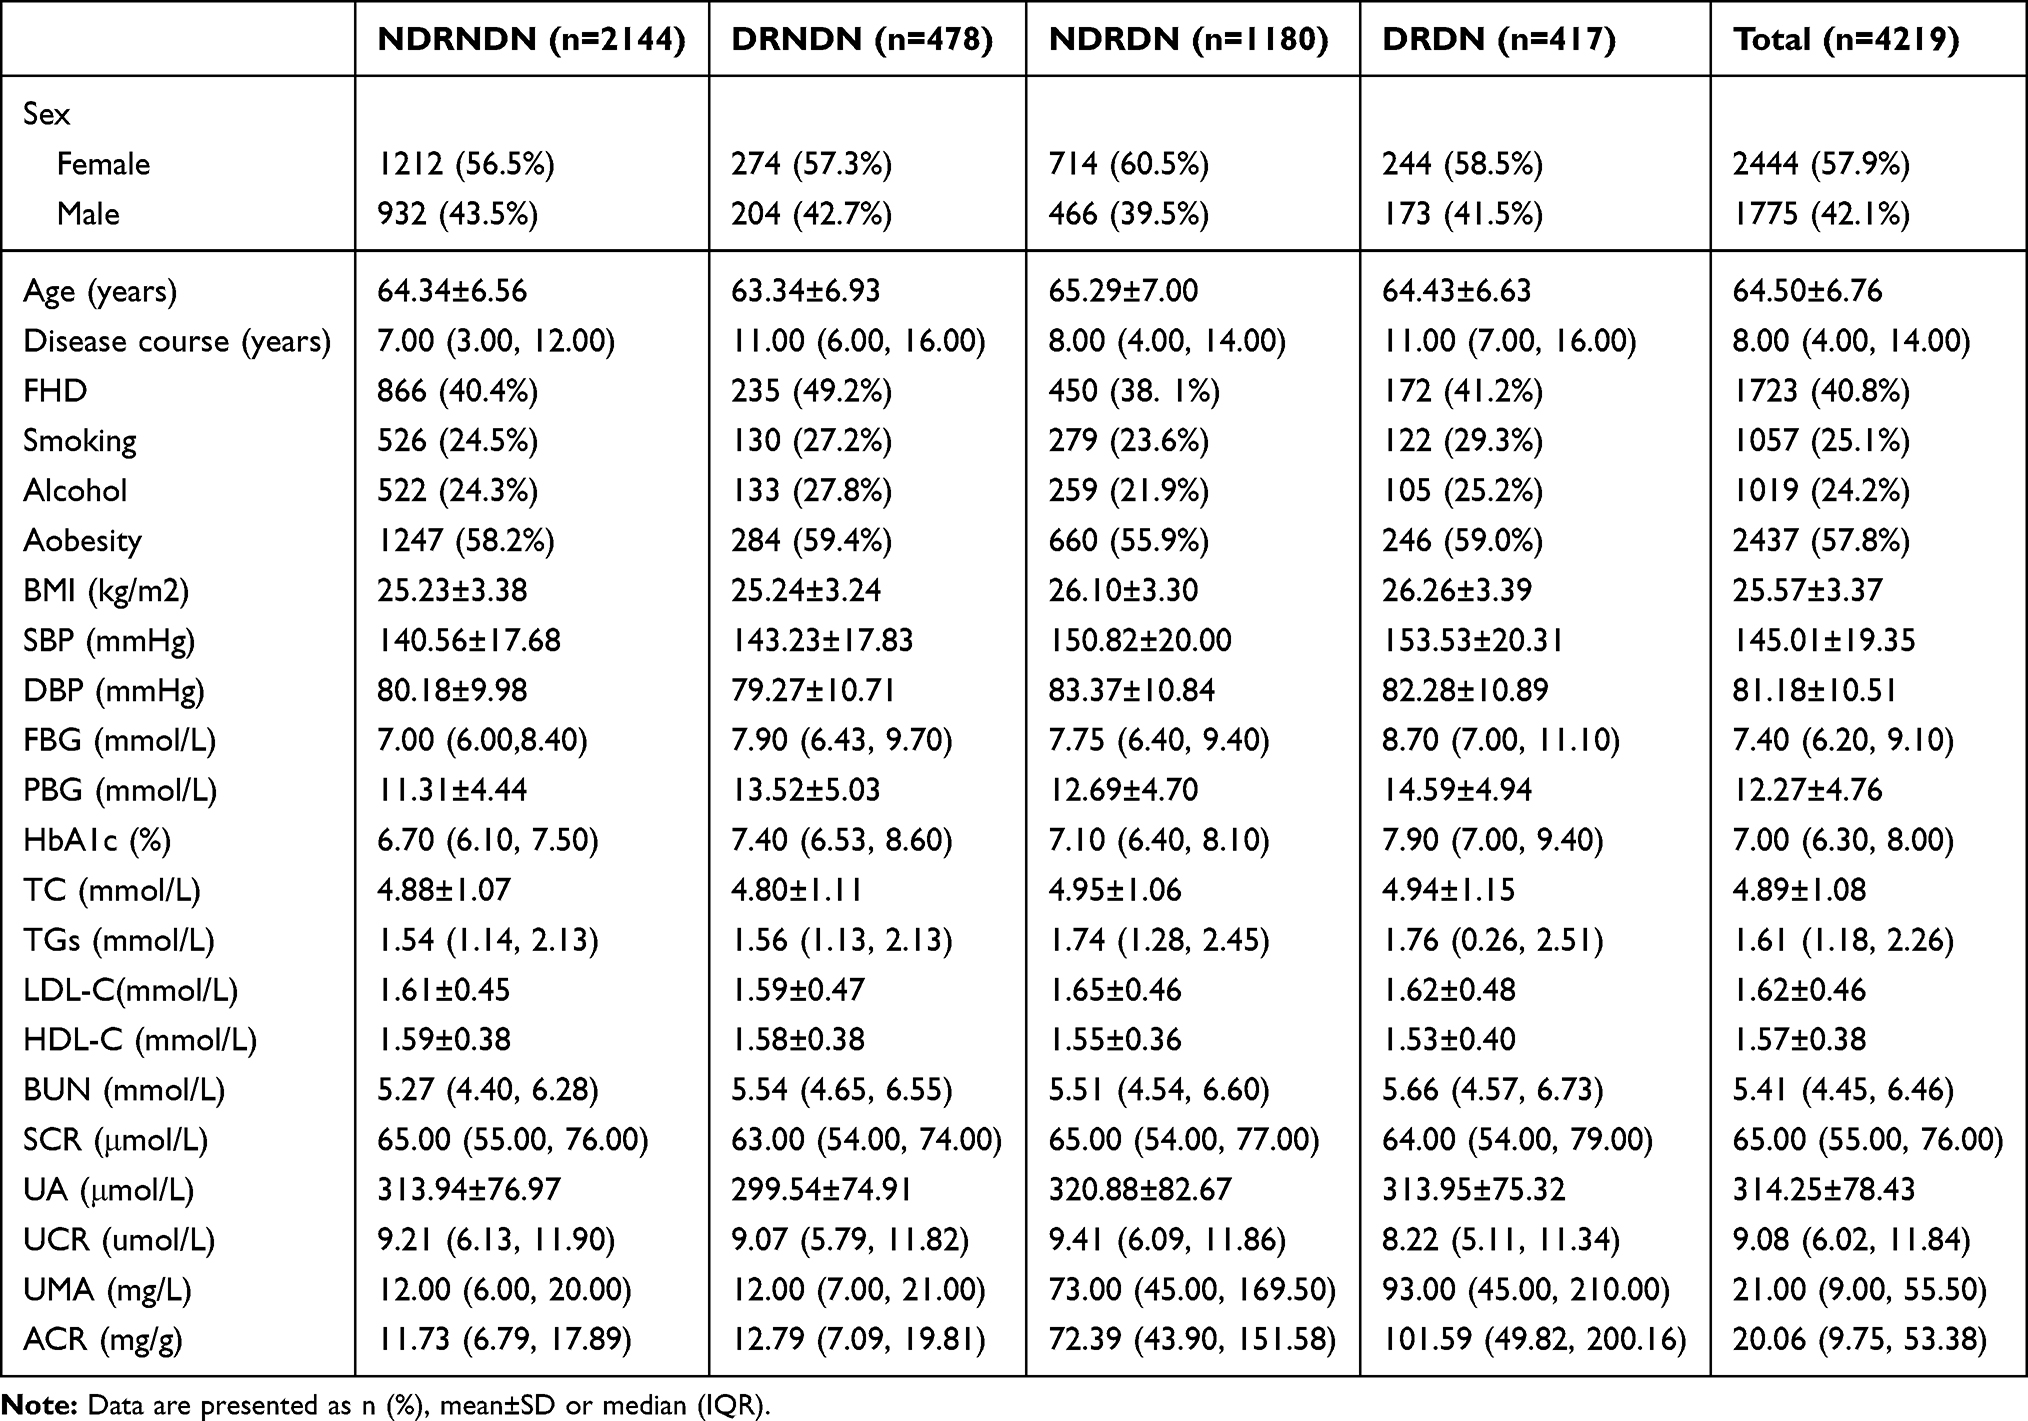 |
Table 1 Demographic and Clinical Characteristics of Patients in the NDRNDN, DRNDN, NDRDN and DRDN Groups |
Feature Selection
In terms of demography and clinical characteristics, we included 23 potential predictors. Using the LASSO regression method, we selected nonzero features in the LASSO regression; thus, the number of potential predictors was 7 in DNNDR (Table 2, Figure 2A and B) and 4 in DRNDN (Table 3, Figure 3A and B). Five risk characteristic factors with P values less than 0.05 in DNNDR (Table 4) and 3 risk characteristic factors with P values less than 0.05 in DRNDN (Table 5) were then screened out by logistic regression.
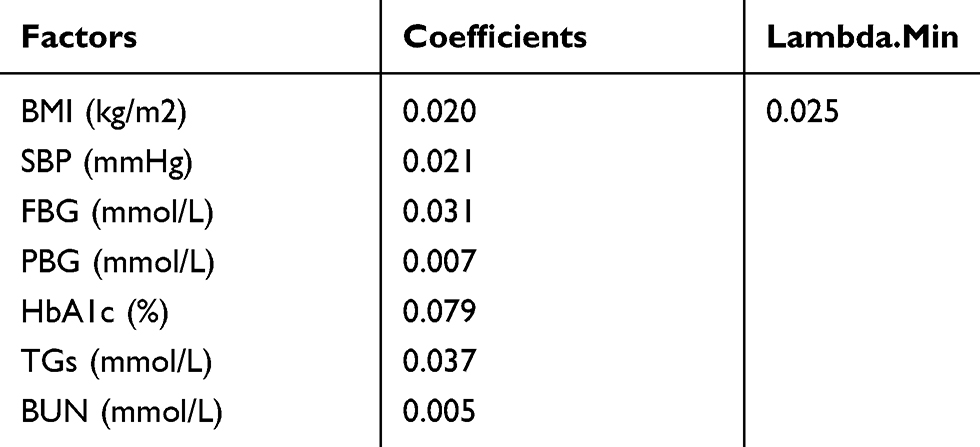 |
Table 2 Screening Out Risk Factors for DN by LASSO Regression |
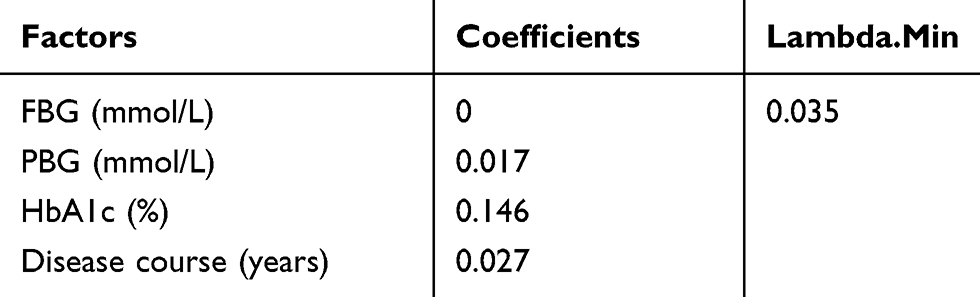 |
Table 3 Screening Out Risk Factors for DR by LASSO Regression |
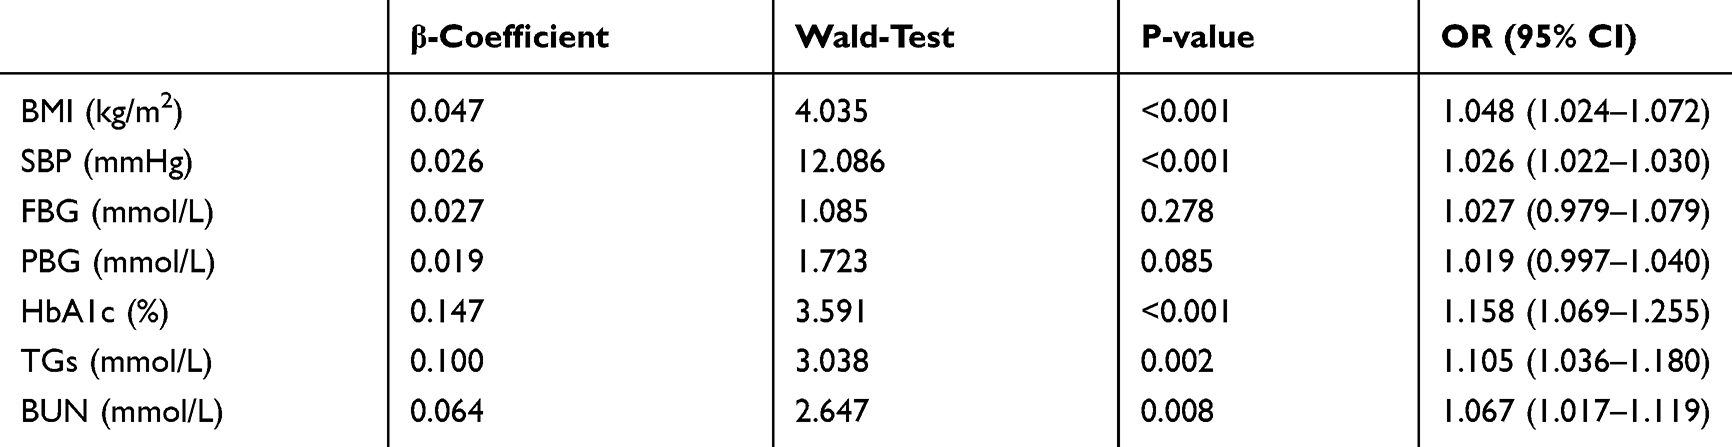 |
Table 4 Screening Out Risk Factors for DN by Logistic Regression |
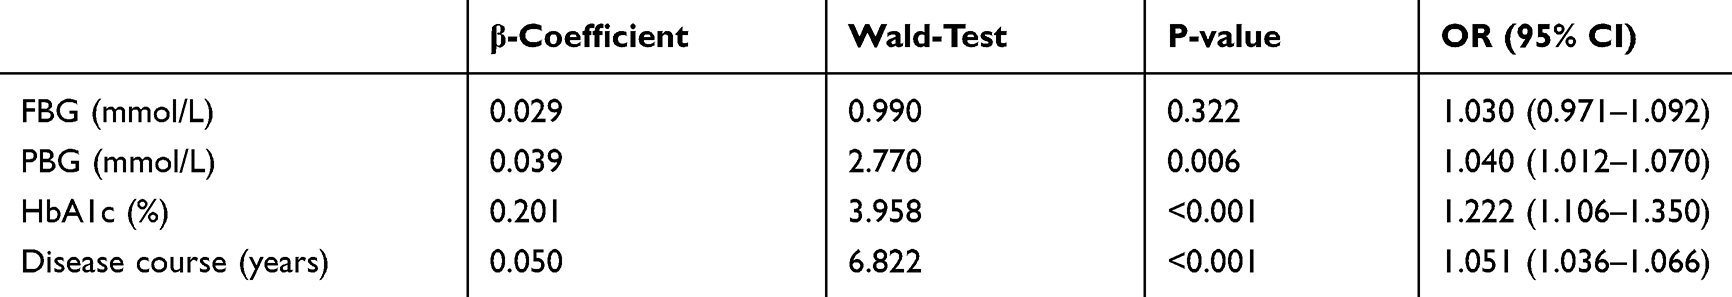 |
Table 5 Screening Out Risk Factors for DR by Logistic Regression |
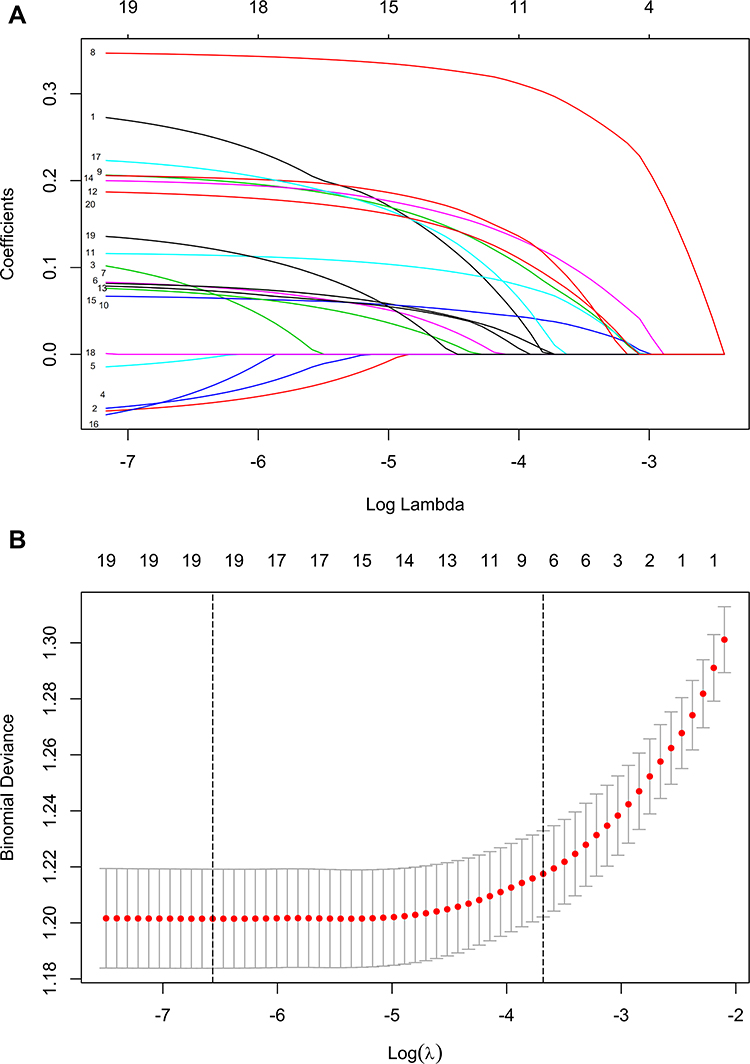 |
Figure 2 Demographic and clinical feature selection using the LASSO binary logistic regression model for DN. Notes: (A) Optimal parameter (lambda) selection in the LASSO model used fivefold cross-validation based on minimum criteria. The partial likelihood deviance (binomial deviance) curve was plotted versus log (lambda). Dotted vertical lines were drawn at the optimal values by using the minimum criteria and the 1 SE of the minimum criteria (the 1-SE criteria). (B) LASSO coefficient profiles of the 7 features. A coefficient profile plot was produced against the log (lambda) sequence. A vertical line was drawn at the value selected using fivefold cross-validation, where optimal lambda resulted in seven features with nonzero coefficients. Abbreviations: LASSO, least absolute shrinkage and selection operator; SE, standard error. |
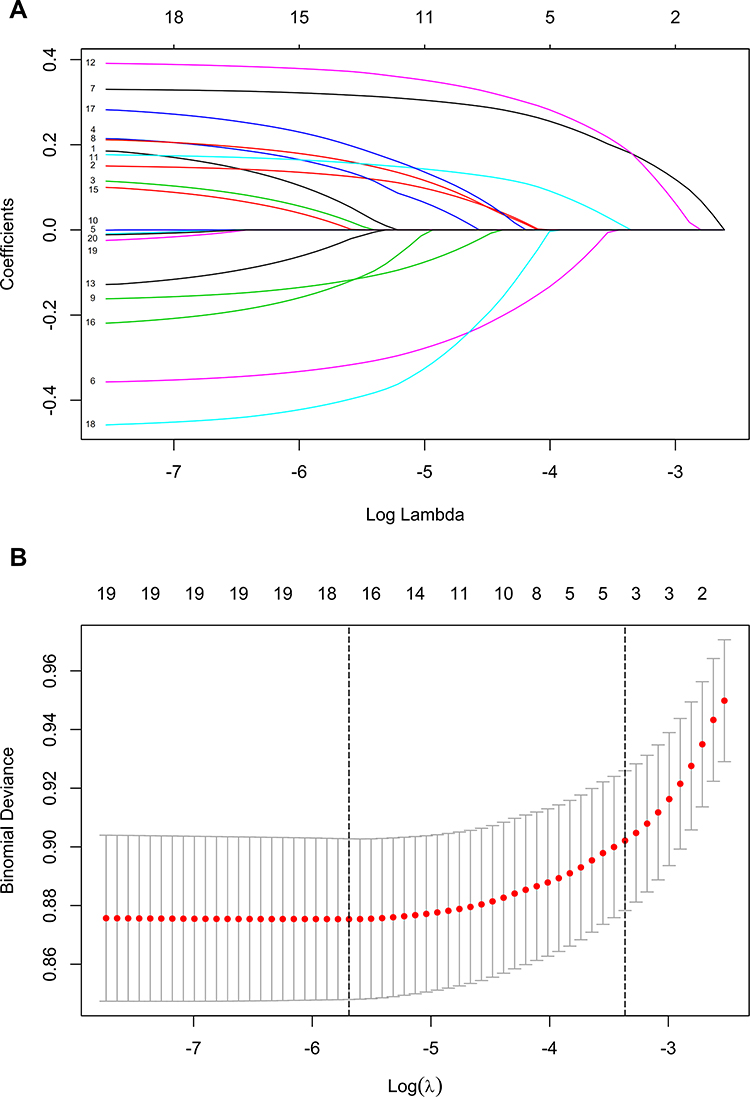 |
Figure 3 Demographic and clinical feature selection using the LASSO binary logistic regression model for DR. Notes: (A) Optimal parameter (lambda) selection in the LASSO model used fivefold cross-validation based on minimum criteria. The partial likelihood deviance (binomial deviance) curve was plotted versus log (lambda). Dotted vertical lines were drawn at the optimal values by using the minimum criteria and the 1 SE of the minimum criteria (the 1-SE criteria). (B) LASSO coefficient profiles of the 4 features. A coefficient profile plot was produced against the log (lambda) sequence. A vertical line was drawn at the value selected using fivefold cross-validation, where optimal lambda resulted in four features with nonzero coefficients. Abbreviations: LASSO, least absolute shrinkage and selection operator; SE, standard error. |
Development of an Individualized Prediction Model
Seven characteristic variables (disease course, BMI, TGs, SBP, PBG, HbA1c and BUN) were screened out in DNNDR and DRNDN by logistic regression. Logistic regression analysis of the above significant risk factors using the sample data with both DN and DR was carried out, and all risk factors had P values less than 0.05 (Table 6). The result is shown in the forest plot (Figure 4). We combined the above 7 independent predictors to develop a prediction model and display it as a nomogram diagram (Figure 5).
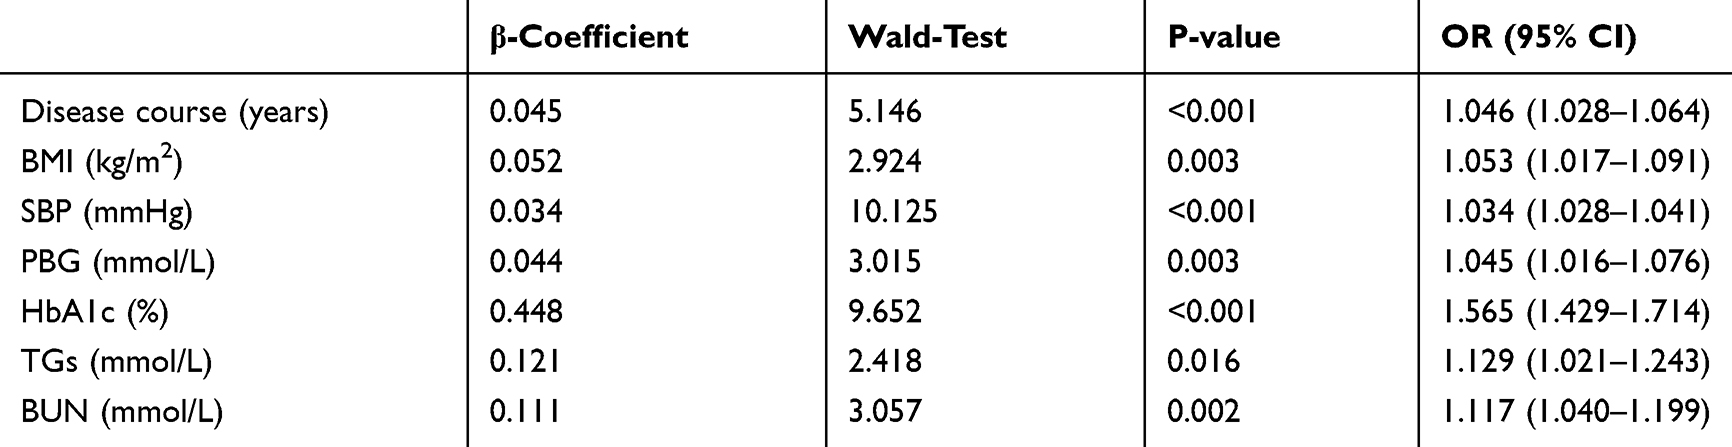 |
Table 6 The Model to Predict the DN Combined with DR Established by Logistic Regression |
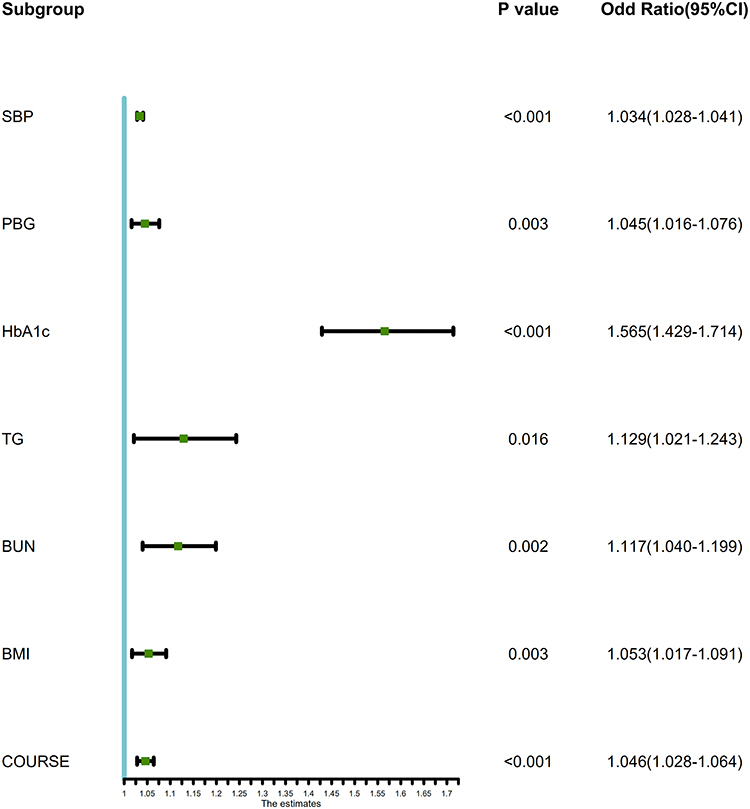 |
Figure 4 Forest plot of the OR of the selected feature. Use of forest plot for outcome of logistic regression analysis. |
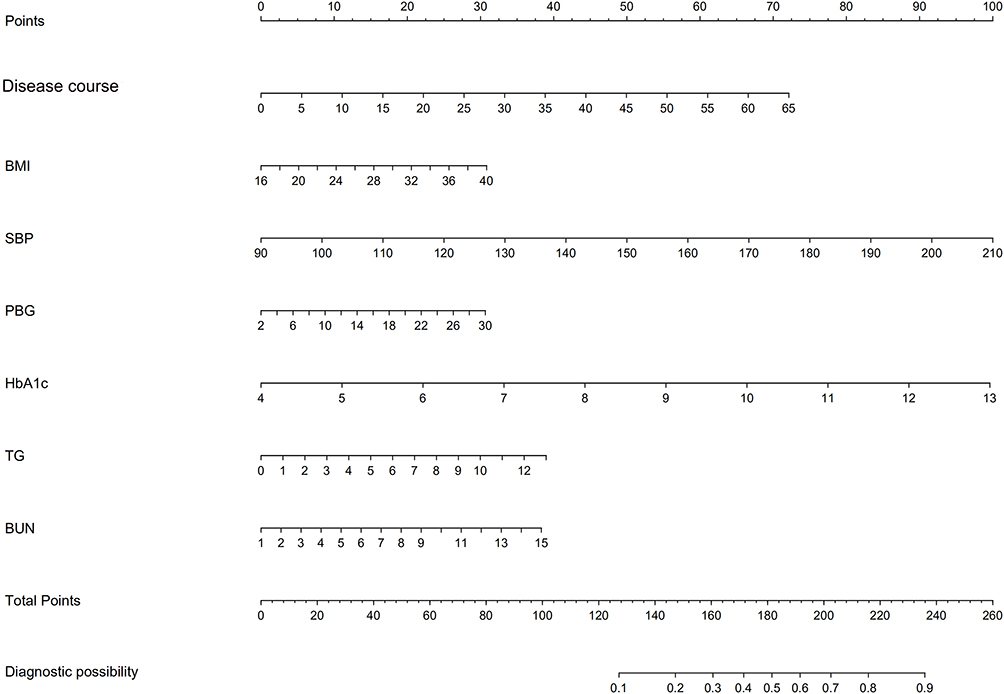 |
Figure 5 Developed nomogram for DN or DR. Notes: The nomogram for DN or DR in T2DM patients was developed in the cohort by integrating disease course, BMI, TGs, SBP, PBG, HbA1c and BUN. |
Apparent Performance of the Diabetic Nephropathy or Diabetic Retinopathy Risk Nomogram in the Array
For 417 T2DM patients in the array, the calibration curve of the nomogram to predict the DN or DR risk in T2DM patients showed moderate agreement (Figure 6). The C-index of the nomogram was 0.807 (0.784–0.830), as shown in Table 7, and the C-index of the internal verification was 0.804, which indicated that the model had medium prediction accuracy. The pooled area under the ROC curve was 0.807 (Figure 7), which indicates moderately good performance. To summarize the results from the above verification, the nomogram of the model has medium predictive ability.
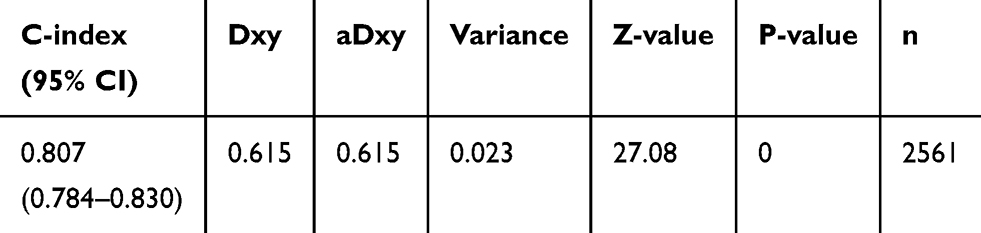 |
Table 7 C-Index in the Array |
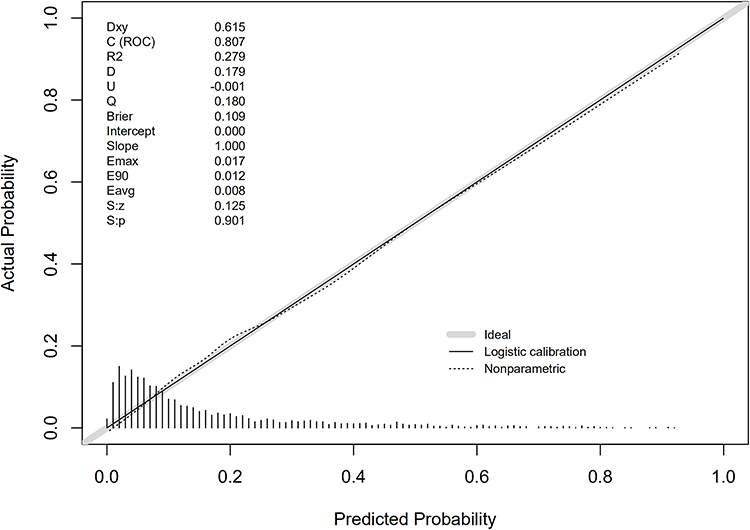 |
Figure 6 Calibration curves of the DN or DR incidence risk nomogram prediction in the array. Notes: The x-axis represents the predicted incidence risk. The y-axis represents the actual diagnosed DN or DR. The diagonal dotted line represents a perfect prediction by an ideal model. The solid line represents the performance of the nomogram; a closer fit to the diagonal dotted line represents a better prediction. |
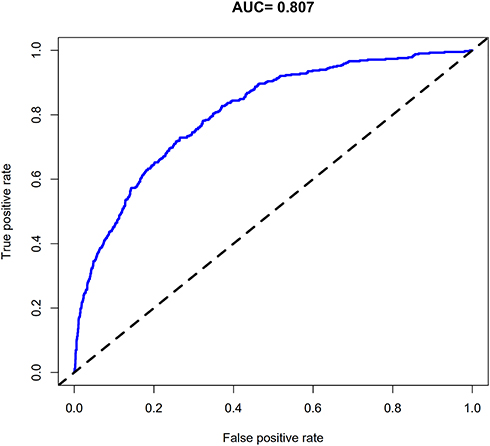 |
Figure 7 The pooled AUC of the ROC curve. Notes: The y-axis indicates the true positive rate of the risk prediction. The x-axis indicates the false-positive rate of the risk prediction. The blue line represents the performance of the nomogram. |
Clinical Use
The decision curve implied that if the threshold probability of a patient and a doctor is 16% and 75%, respectively, applying this nomogram in the present study to predict DN or DR incidence risk is more effective than the intervention-for-all-patients scheme (Figure 8).
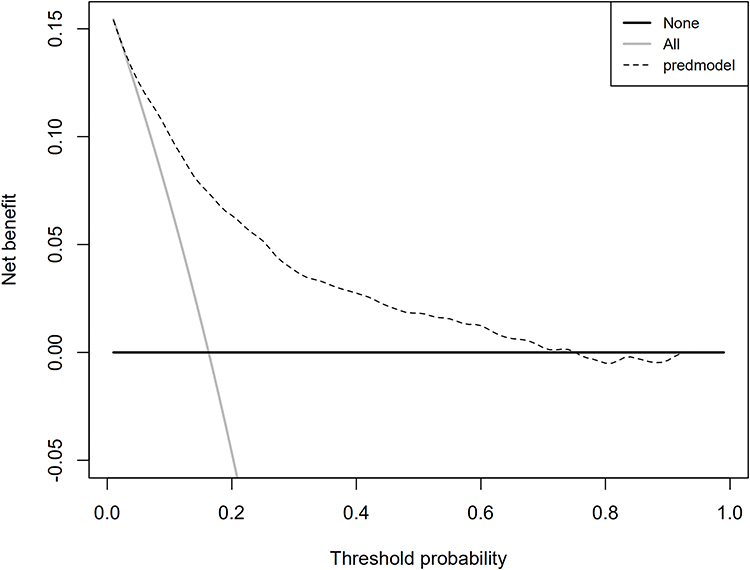 |
Figure 8 Decision curve analysis for the incidence risk nomogram of DN or DR. Notes: The y-axis indicates the net benefit. The dotted line represents the incidence risk nomogram of DN or DR. The thin solid line represents the assumption that all patients are diagnosed as DN or DR. Thin thick solid line represents the assumption that no patients are diagnosed as DN or DR. |
Discussion
Recently, many studies have used nomograms in medicine and oncology because nomograms have the benefits of user-friendly interfaces, better accuracy and more easily understood results.28
An innovative prediction tool for the incidence risk of DN or DR among T2DM patients was developed with only seven easily available variables. A prediction app was developed using R language with the shiny package; the URL is https://doctorhu.shinyapps.io/DN_DR_DynNomapp/. Integrating demographic, disease, lifestyle habits, physical examination results and biochemical test results into a user-friendly nomogram benefited the prediction of DN or DR incidence among T2DM patients. Internal validation in the cohort displayed moderate-good distinction and validation capabilities; particularly, our moderate C-index in the internal verification showed that this nomogram can be correctly used in a wide range of individuals due to the considerable sample size.28
As an example to better explain the nomogram, if the T2DM patient’s disease course was 9 years, BMI was 23.60 kg/m2, TGs were 1.14 mmol/l, SBP was 170 mmHg, PBG was 15.7 mmol/l, HbA1c was 8%, and BUN was 4.46 mmol/l, the probability of DN or DR was estimated to be 28.3% (Figure 9).
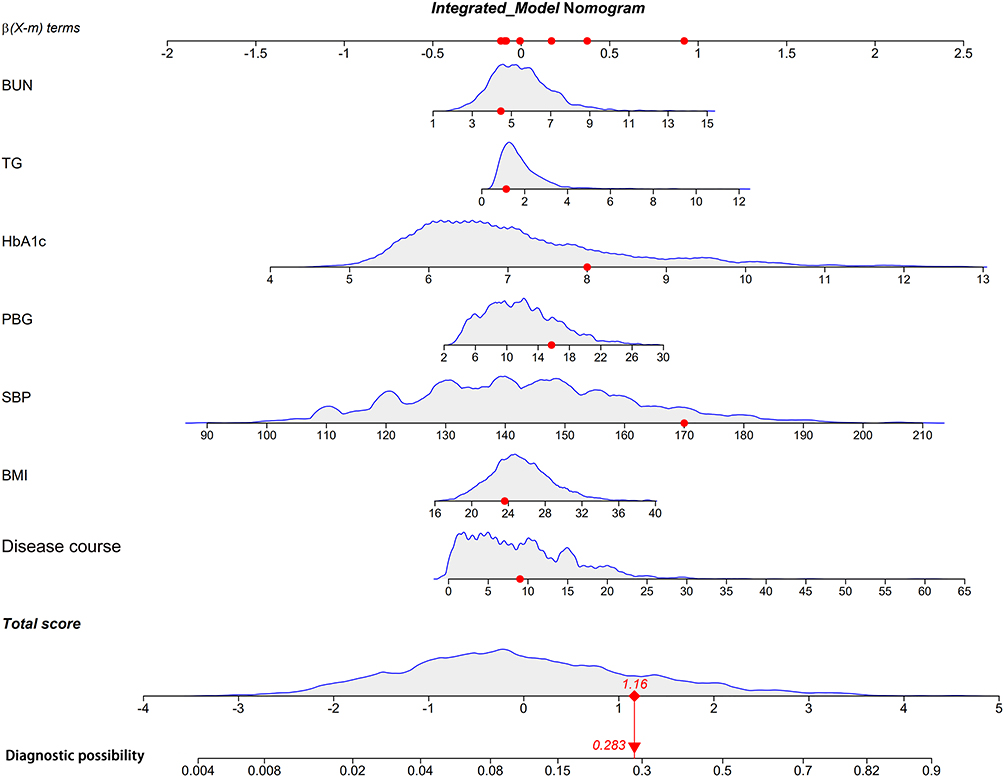 |
Figure 9 An example of nomogram for DN or DR. Notes: HbA1c, SBP and disease course are the main contributors to the prediction model, BUN, PBG and BMI are the medium contributors, and TG is the minimum contributor. |
Prevalence of DN Combined with DR Among T2DM Patients Was Consistent with Other Studies
The prevalence of DN and DR in community-based patients with T2DM in our study was 27.97% and 11.33%, respectively, and the prevalence of DN complicated with DR was 9.88%, which was consistent with other studies.
Thirty-nine percent of 32,208 patients with T2DM from 33 countries were found to have MAU, and 10% were found to have CAU in a previous study. The National Health and Nutrition Survey revealed that 23.7% of T2DM patients had DN in the United States.29,30 According to a retrospective review of T2DM by the Chinese Diabetes Society in 2001, the prevalence of renal complications in T2DM patients in 3A hospitals was 34.7%.31 The investigation implemented with outpatients in six Shanghai communities revealed that the prevalence of DN in patients with diabetes was 38.4%.31 A global case-control study involving 2535 patients with T2DM from 24 areas of 13 countries found that 48.05% of T2DM patients had DR.32 A survey in Iran Yazd showed that the prevalence of DM was high,33 and the prevalence of DR was 39.3%.34 Another cross-sectional study in Yazd Diabetes Research Center in 2014 showed that the prevalence of DR was 41%.35 According to a study in China, 10.7% and 10.8% of T2DM patients suffered from DN and ocular lesions, respectively.36 A total of 6.16% of patients with T2DM developed DN combined with DR.37 A total of 35.6% of patients with T2DM developed DR on the basis of DN, while the prevalence was 35.34% in this study.10
Main Risk Factors for T2DM with DN or DR
Through the risk factor analysis, disease course, BMI, TGs, SBP, PBG, HbA1c and BUN were related to the incidence of DN and DR in T2DM patients. This nomogram indicated that longer disease course and higher BMI, TGs, SBP, PBG, HbA1c and BUN may be independent risk factors that affect the incidence risk of DN or DR for T2DM patients.
Disease course
This study concluded that disease course is an interfering factor in both DR and DN combined with DR. A 12-year follow-up study from Karachi-Pakistan found that a longer duration of DM was associated with the incidence of these complications. By analysing data records of T2DM outpatients, the morbidity data show that DR, neuropathy, and DN were markedly higher in DM patients with a duration of diabetes >10 years, followed by those with a duration of 5–10 years.38 Jiang et al developed a predictive model incorporating risk factors, including the duration of diabetes, and found that classic T2DM patients with DN usually had a disease duration over 10 years.39 A Saudi National study including a total of 54,670 T2DM patients found a strong correlation between duration and DN incidence, recording that 21.8% of patients over 15 years of age had DN.40 Inassi et al worked on the association between DN and the duration of diabetes and found that as the duration increased, renal function was gradually impaired.41 A study on Thai patients with T2DM identified the duration of diabetes as a risk factor for DN based on a cross-sectional study.42
Body Mass Index and Triglycerides
High BMI and TGs indicate that patients are obese and have a higher possibility of poor blood lipid status. In this study, we found that BMI and TGs were high-risk factors for DN and DN combined with DR in T2DM patients, which verified the conclusions of other studies. Multivariate model analysis illustrated that the risk for a negative renal function outcome is significantly associated with increasing BMI.43 Morbid obesity may be an influencing factor of chronic kidney disease (CKD) in women.44 A U-shaped association between BMI and DR in Chinese T2DM patients was found by Lu et al.45 A central-based, cross-sectional study containing 518 DM patients showed the relationship between DR and BMI in adult patients with T2DM. The correlation study between DR and BMI found that BMI had an inverse relationship with DR when BMI was deemed a continuous variable (p = 0.009 and correlation coefficient 0.467).35 A study involving 17,152 patients demonstrated a high correlation between TGs and DR in T2DM patients (P < 0.001).46 The Singapore Malay Eye study showed that a high TC level was a factor that protected against DR.47 In China, a community-based study found that the TC/TG ratio affected the presence of DR in Chinese T2DM patients.48
Systolic Blood Pressure
T2DM patients frequently suffer from comorbidities, such as obesity and depression.49 The comorbidity most strongly related to T2DM is hypertension. SBP is one of the main diagnostic indicators of hypertension. Hypertension is the basis of arteriosclerosis, which can cause endothelial hyperplasia, sclerosis, vascular stenosis and even occlusion, thus causing retinal ischaemia, hypoxia, haemangioma, and neovascularization, eventually leading to DR. This study showed that SBP is a risk factor for DN as well as DN combined with DR in T2DM patients. It has been proven that in patients with T2DM, hypertension is a key individual risk factor for the incidence and progression of DN. Relevant studies demonstrated that the level of SBP also influences the risk of DR. The UK Prospective Diabetes Study (UKPDS) is the only intervention study of sufficient scale to study the effect of lowering blood glucose and blood pressure on DR in DM patients. Among the 1148 hypertensive patients, blood pressure control lowered the occurrence and development of retinopathy by 34% after 7.5 years.50 A retrospective case-control study of Asian T2DM patients concluded that both wider variability in SBP and a higher mean SBP were related to moderate DR.51 For subjects with impaired glucose regulation, elevated blood pressure, including systolic and diastolic blood pressure, would increase the risk of diabetic retinopathy.52 Through a survey of 16,305 patients with DR in eight hospitals in mainland China, a higher level of SBP was one of the risk factors for the presence of DR in patients with T2DM.53
Postprandial Blood Glucose and Glycosylated Haemoglobin A1c
Both PBG and HbA1c are indicators of blood sugar. The former indicates the degree of blood glucose fluctuation, while the latter indicates the mean level of blood glucose in the past two or three months. HbA1c is the key parameter for controlling diabetes, as it is associated with the risk of diabetic complications.54 A study in Taiwan found that HbA1c is an indicator for microalbuminuria development among T2DM patients.55 Among T2DM studies, glucose variability showed a positive association with the progression of DR.54 A ten-year survey follow-up of diabetes patients in Taiwan showed that visit-to-visit glucose variations in both FPG-CV and HbA1c-CV independently predicted ESRD in patients with T2DM duration >30 years.56 Some data show that glucose variability, namely, fasting plasma glucose variability, and retinopathy in T2DM patients have a possible connection.57 To reduce the risk of long-term complications such as DR and DN, maintaining an HbA1c concentration of 7.0% or less is recommended for all patients with diabetes.58
Blood Urea Nitrogen
BUN is the end product of human protein metabolism and is the main nitrogen-containing substance excreted by the kidney. When the filtration function of the glomerulus is weakened, the level of BUN will increase. BUN is used to evaluate the function of the kidney. An epidemiological survey of T2DM in premenopausal and postmenopausal women in China found that BUN plays an important role in abnormal renal function,59 which was consistent with this study. Li yongmei et al found that male T2DM patients were vulnerable to having high UA among those with higher BMI (OR 1.711, p = 0.038), BUN (OR 1.100, p = 0.034), and 24-hour urinary microalbumin levels (OR 1.004, p = 0.021). In this study, BUN was considered not only a predictor of DN but also an influencing factor of DR combined with DN. A population-based study indicated that BUN was directly associated with DR. Moreover, a strong relationship was found between DN and DR.10 Guihua et al illustrated higher blood urea nitrogen (BUN) (OR, 1.012) as a characteristic variable of the presence of DR through the Lifeline Express Diabetic Retinopathy Screening Program.53
Limitations
This study is somewhat limited. First, the data we collected mainly focus on T2DM patients in Shanghai communities, which cannot represent all T2DM patients in China. In addition, our data collection phase required the on-site participation of patients, and patients with T2DM who were seriously ill in the hospital or undergoing home treatment had no way to participate in our study. Second, this was a cross-sectional study. The patients with DN or DR were observed in the static state, without the monitoring of the dynamic change process. If the patients’ indicators were tested dynamically, the accuracy of the prediction model would be improved to a certain extent. Third, although the stability of our nomogram had been tested in the internal validation of the same population, the external validation in other T2DM populations in other regions or countries was not performed. In summary, the study findings need to be evaluated and validated in a broader population. Finally, indicators of this study can also include patient education, income and drug use, such as antihypertensive drugs and lipid-lowering drugs.
Conclusion
Currently, most of the studies on DN or DR in T2DM patients in China are mainly focused on inpatients, and there are few epidemiological investigations involving community patients. This study established a simple nomogram with a comparatively moderate accuracy to evaluate the risk of DN or DR incidence in patients with T2DM. By assessing T2DM individuals, clinicians can implement effective interventions for patients and provide health education in regard to the lifestyle of patients. This nomogram needs more extensive clinical external verification, and further research is needed to determine whether intervention in T2DM patients on the basis of this nomogram would promote risk reduction of DN or DR incidence and facilitate recovery. In our study, the prevalence rates of DN and DR were 27.97% and 11.33%, respectively, among T2DM patients from six communities in Shanghai, which was consistent with previous research. In recent years, the prevalence of complications in patients with type 2 diabetes has demonstrated a trend toward affecting younger people. This increasing trend in T2DM can be attributed to the rapid increase in urbanization and obesity. Health education should be carried out by the government for T2DM patients according to the risk factors. Through early detection and improvement of diabetes management, the quality of life of diabetic patients (in some populations) is improved, thus reducing early mortality.
Abbreviations
T2DM, type 2 diabetes mellitus; IDF, International Diabetes Federation; DM, diabetes mellitus; DN, diabetic nephropathy; DR, diabetic retinopathy; ESRD, End-stage renal disease; ETDRS, treatment diabetic retinopathy; PVR, proliferative vitreoretinopathy; ACR, ratio of microalbumin to creatinine; NAU, non-albuminuria; MAU, microalbuminuria; CAU, clinical albuminuria; FBG, fasting blood glucose; PBG, postprandial blood glucose; HbA1c, glycosylated haemoglobin A1c; TC, total cholesterol; TGs, triglycerides; LDL-C, low-density lipoprotein; HDL-C, high-density lipoprotein; BUN, blood urea nitrogen; SCR, serum creatinine; UA, uric acid; UCR, uric creatinine; UMA, urinary microalbumin; FHD, family history of diabetes; BMI, body mass index; Aobesity, abdominal obesity; SBP, systolic blood pressure; DBP, diastolic blood pressure; LASSO, least absolute shrinkage and selection operator; OR, odds ratio; CI, confidence interval; ROC, receiver operating characteristic; DCA, decision curve analysis; CKD, chronic kidney disease; UKPDS, UK Prospective Diabetes Study.
Ethics and Consent Statement
All participants were carefully informed about the protocol and provided written informed consent before inclusion in the study. The study was approved by the Shanghai Medical Ethics Committee and performed in accordance with the principles of the Declaration of Helsinki.
Acknowledgments
The authors thank all the participating community health centres that helped recruit the participants, including Huamu Community, Jinyang Community, Yinhang Community, Siping Community, Sanlin Community, and Daqiao Community, and all participants who volunteered to be studied.
Funding
This research was financially supported by the fourth round of Shanghai Public Health Three-Year Action Plan Key Discipline Construction–Health Education and Health Promotion (Grant No. 15GWZK1002).
Disclosure
The authors declare no conflicts of interest in this work.
References
1. Bui HDT, Jing X, Lu R, et al. Prevalence of and factors related to microvascular complications in patients with type 2 diabetes mellitus in Tianjin, China: a cross-sectional study. Ann Transl Med. 2019;7(14).
2. Aldemir O, Turgut F, Gokce C. The association between methylation levels of targeted genes and albuminuria in patients with early diabetic kidney disease. Ren Fail. 2017;39(1):597–601. doi:10.1080/0886022X.2017.1358180
3. Dal Canto E, Ceriello A, Ryden L, et al. Diabetes as a cardiovascular risk factor: an overview of global trends of macro and micro vascular complications. Eur J Prev Cardiol. 2019;26(2_SUPPL):25–32. doi:10.1177/2047487319878371
4. Liu ZH. Nephrology in china. Nat Rev Nephrol. 2013;9(9):523–528. doi:10.1038/nrneph.2013.146
5. Kute VB, Godara SM, Shah PR, et al. Outcome of deceased donor renal transplantation in diabetic nephropathy: a single-center experience from a developing country. Int Urol Nephrol. 2012;44(1):269–274.
6. Fong DS, Aiello L, Gardner TW, et al. Retinopathy in diabetes. Diabetes Care. 2004;27(suppl Supplement 1):s84–s87. doi:10.2337/diacare.27.2007.S84
7. Kainz A, Hronsky M, Stel VS, et al. Prediction of prevalence of chronic kidney disease in diabetic patients in countries of the European Union up to 2025. Nephrol Dial Transplant. 2015;30(suppl_4):iv113–iv118.
8. Mellati AA, Tabaei BS, Alavi M, et al. Association of serum zinc and vitamin a levels with severity of retinopathy in type 2 diabetic patients: a cross-sectional study. Biol Trace Elem Res. 2019;192(2):123–128.
9. Zhang J, Wang Y, Li L, et al. Diabetic retinopathy may predict the renal outcomes of patients with diabetic nephropathy. Ren Fail. 2018;40(1):243–251.
10. Ahmed MH, Elwali ES, Awadalla H, et al. The relationship between diabetic retinopathy and nephropathy in Sudanese adult with diabetes: population based study. Diabetes Metab Syndr. 2017;11:S333–S336.
11. Das D, Gupta S. Diabetic retinopathy in patients of type2 diabetes mellitus with diabetic nephropathy. Int J Scie Res. 2020;9(1).
12. He F, Xia X, Wu X, et al. Diabetic Retinopathy in Predicting Diabetic Nephropathy in Patients with Type 2 Diabetes and Renal Disease: A Meta-Analysis. Springer; 2013.
13. Prakash J, Lodha M, Singh S, et al. Diabetic retinopathy is a poor predictor of type of nephropathy in proteinuric type 2 diabetic patients. J Assoc Physicians India. 2007;55:412–416.
14. Cao X, Gong X, Ma X, et al. Diabetic nephropathy versus diabetic retinopathy in a Chinese population: a retrospective study. Med Sci Monit. 2019;25:6446. doi:10.12659/MSM.915917
15. Niu W, Qi Y. An updated meta-analysis of methylenetetrahydrofolate reductase gene 677C/T polymorphism with diabetic nephropathy and diabetic retinopathy. Diabetes Res Clin Pract. 2012;95(1):110–118. doi:10.1016/j.diabres.2011.10.009
16. Klein R, Zinman B, Gardiner R, et al. The relationship of diabetic retinopathy to preclinical diabetic glomerulopathy lesions in type 1 diabetic patients: the Renin-Angiotensin system study. Diabetes. 2005;54(2):527–533.
17. Kofoed-Enevoldsen A, Jensen T, Borch-Johnsen K, et al. Incidence of retinopathy in type I [insulin-dependent] diabetes: association with clinical nephropathy. J Diabetes Complications. 1987;1(3):96–99.
18. Yang J-K, Wang -Y-Y, Liu C, et al. Urine proteome specific for eye damage can predict kidney damage in patients with type 2 diabetes: a case-control and a 5.3-year prospective cohort study. Diabetes care. 2017;40(2):253–260.
19. Yan ZP, Ma JX. Risk factors for diabetic retinopathy in northern Chinese patients with type 2 diabetes mellitus. Int J Ophthalmol. 2016;9(8):1194.
20. None. Classification of diabetic retinopathy from fluorescein angiograms. Ophthalmology. 1991;98(5):807–822.
21. Association AD. Diabetic nephropathy. Diabetes Care. 2000; 23 Suppl 1: S69-72.
22. Wang H, Le Zhang ZL, Wang X, et al. Predicting medication nonadherence risk in a Chinese inflammatory rheumatic disease population: development and assessment of a new predictive nomogram. Patient Prefer Adherence. 2018;12:1757.
23. Huang Y-Q, Liang C-H, He L, et al. Development and validation of a radiomics nomogram for preoperative prediction of lymph node metastasis in colorectal cancer. J Clin Oncol. 2015;2065:9128.
24. Lätti S, Niinivehmas S, Pentikäinen OT. Rocker: open source, easy-to-use tool for AUC and enrichment calculations and ROC visualization. J Cheminform. 2016;8(1):1–5. doi:10.1186/s13321-016-0158-y
25. Vickers AJ, Cronin AM, Elkin EB, et al. Extensions to decision curve analysis, a novel method for evaluating diagnostic tests, prediction models and molecular markers. BMC Med Inform Decis Mak. 2008;8(1):53. doi:10.1186/1472-6947-8-53
26. Lyu J, Li Z, Wei H, et al. A potent risk model for predicting new-onset acute coronary syndrome in patients with type 2 diabetes mellitus in Northwest China. Acta Diabetol. 2020;1–9.
27. Li W, Xie B, Qiu S, et al. Non-lab and semi-lab algorithms for screening undiagnosed diabetes: a cross-sectional study. EBioMedicine. 2018;35:307–316. doi:10.1016/j.ebiom.2018.08.009
28. Wei L, Champman S, Li X, et al. Beliefs about medicines and non-adherence in patients with stroke, diabetes mellitus and rheumatoid arthritis: a cross-sectional study in China. BMJ Open. 2017;7(10):e017293.
29. de Boer IH, Rue TC, Hall YN, et al. Temporal trends in the prevalence of diabetic kidney disease in the United States. JAMA. 2011;305(24):2532–2539.
30. Zhang X, Saaddine JB, Chou C-F, et al. Prevalence of diabetic retinopathy in the United States, 2005-2008. JAMA. 2010;304(6):649–656. doi:10.1001/jama.2010.1111
31. Lou J, Jing L, Yang H, et al. Risk factors for diabetic nephropathy complications in community patients with type 2 diabetes mellitus in Shanghai: logistic regression and classification tree model analysis. Int J Health Plann Manage. 2019;34(3):1013–1024.
32. Sacks FM, Hermans MP, Fioretto P, et al. Association between plasma triglycerides and high-density lipoprotein cholesterol and microvascular kidney disease and retinopathy in type 2 diabetes mellitus: a global case–control study in 13 countries. Circulation. 2014;129(9):999–1008.
33. Tolonen N, Hietala K, Forsblom C, et al. Associations and interactions between lipid profiles, retinopathy and nephropathy in patients with type 1 diabetes: the FinnDiane study. J Intern Med. 2013;274(5):469–479. doi:10.1111/joim.12111
34. Rooney D, Lye WK, Tan G, et al. Body mass index and retinopathy in Asian populations with diabetes mellitus. Acta Diabetol. 2015;52(1):73–80.
35. Sarrafan-Chaharsoughi Z, Manaviat MR, Namiranian N, et al. Is there a relationship between body mass index and diabetic retinopathy in type II diabetic patients? A cross sectional study. J Diabetes Nutr Metab Dis. 2018;17(1):63–69.
36. Liu Z, Fu C, Wang W, et al. Prevalence of chronic complications of type 2 diabetes mellitus in outpatients-a cross-sectional hospital based survey in urban China. Health Qual Life Outcomes. 2010;8(1):62.
37. Pedro R-A, Ramon S-A, Marc -B-B, et al. Prevalence and relationship between diabetic retinopathy and nephropathy, and its risk factors in the North-East of Spain, a population-based study. Ophthalmic Epidemiol. 2010;17(4):251–265.
38. Fawwad A, Mustafa N, Zafar AB, et al. Incidence of microvascular complications of type 2 diabetes: a 12 year longitudinal study from Karachi-Pakistan. Pak J Med Sci. 2018;34(5):1058.
39. Jiang S, Fang J, Yu T, et al. Novel Model predicts diabetic nephropathy in type 2 diabetes. Am J Nephrol. 2020;51(2):130–138.
40. Al-Rubeaan K, Youssef AM, Subhani SN, et al. Diabetic nephropathy and its risk factors in a society with a type 2 diabetes epidemic: a Saudi National diabetes registry-based study. PloS one. 2014;9(2).
41. Inassi J, Vijayalakshmy R. Role of duration of diabetes in the development of nephropathy in type 2 diabetic patients. Nat J Med Res. 2013;3(1):5–8.
42. Krairittichai U, Potisat S, Jongsareejit A, et al. Prevalence and risk factors of diabetic nephropathy among Thai patients with type 2 diabetes mellitus. J Med Assoc Thai. 2011;94:S1–S5.
43. Kwan JM, Hajjiri Z, Metwally A, et al. Effect of the obesity epidemic on kidney transplantation: obesity is independent of diabetes as a risk factor for adverse renal transplant outcomes. PloS one. 2016;11(11).
44. Cohen E, Fraser A, Goldberg E, et al. Association between the body mass index and chronic kidney disease in men and women. A population-based study from Israel. Nephrol Dial Transplant. 2013;28(suppl_4):iv130–iv135.
45. Lu J, Hou X, Zhang L, et al. Association between body mass index and diabetic retinopathy in Chinese patients with type 2 diabetes. Acta Diabetol. 2015;52(4):701–708.
46. Larsen MB, Henriksen JE, Grauslund J, et al. Prevalence and risk factors for diabetic retinopathy in 17 152 patients from the island of Funen, Denmark. Acta Ophthalmol (Copenh). 2017;95(8):778–786. doi:10.1111/aos.13449
47. Wong TY, Cheung N, Tay WT, et al. Prevalence and risk factors for diabetic retinopathy: the Singapore malay eye study. Ophthalmology. 2008;115(11):1869–1875.
48. Zhong Y, Yue S, Wu J, et al. Association of the serum total cholesterol to triglyceride ratio with diabetic retinopathy in chinese patients with type 2 diabetes: a community-based study. Diabetes Ther. 2019;10(2):597–604.
49. Campbell RK. Type 2 diabetes: where we are today: an overview of disease burden, current treatments, and treatment strategies. J Am Pharm Assoc. 2009;49(5):S3–S9.
50. United Kingdom Prospective Diabetes Study Group. Intensive blood-glucose control with sulphonylureas or insulin compared with conventional treatment and risk of complications in patients with type 2 diabetes (UKPDS 33). Lancet. 1998;352(9131):837–853. doi:10.1016/S0140-6736(98)07019-6
51. Foo V, Quah J, Cheung G, et al. HbA1c, systolic blood pressure variability and diabetic retinopathy in Asian type 2 diabetics: 亚洲 2 型糖尿病患者的 HbA1c 以及收缩压的变异性与糖尿病视网膜病变之间的关系. J Diabetes. 2017;9(2):200–207. doi:10.1111/1753-0407.12403
52. Pang C, Jia L, Jiang S, et al. Determination of diabetic retinopathy prevalence and associated risk factors in Chinese diabetic and pre‐diabetic subjects: shanghai diabetic complications study. Diabetes Metab Res Rev. 2012;28(3):276–283.
53. Zhang G, Chen H, Chen W, et al. Prevalence and risk factors for diabetic retinopathy in China: a multi-hospital-based cross-sectional study. Br J Ophthalmol. 2017;101(12):1591–1595.
54. Nalysnyk L, Hernandez-Medina M, Krishnarajah G. Glycaemic variability and complications in patients with diabetes mellitus: evidence from a systematic review of the literature. Diabetes Obes Metab. 2010;12(4):288–298. doi:10.1111/j.1463-1326.2009.01160.x
55. Chen W-Z, Hung -C-C, Wen Y-W, et al. Effect of glycemic control on microalbuminuria development among type 2 diabetes with high-normal albuminuria. Ren Fail. 2014;36(2):171–175.
56. Yang Y-F, Li T-C, Li C-I, et al. Visit-to-visit glucose variability predicts the development of end-stage renal disease in type 2 diabetes: 10-year follow-up of Taiwan diabetes study. Medicine. 2015;94(44).
57. Skrha J, Soupal J, Skrha J
58. Cheng A; Canadian Diabetes Association Clinical Practice Guidelines Expert Committee. Canadian Diabetes Association 2013 clinical practice guidelines for the prevention and management of diabetes in Canada. Introduction. Can J Diabetes. 2013;37:S1. doi:10.1016/j.jcjd.2013.01.009
59. Li Q, Wang X, Ni Y, et al. Epidemiological characteristics and risk factors of T2DM in Chinese premenopausal and postmenopausal women. Lipids Health Dis. 2019;18(1):155.
 © 2020 The Author(s). This work is published and licensed by Dove Medical Press Limited. The full terms of this license are available at https://www.dovepress.com/terms.php and incorporate the Creative Commons Attribution - Non Commercial (unported, v3.0) License.
By accessing the work you hereby accept the Terms. Non-commercial uses of the work are permitted without any further permission from Dove Medical Press Limited, provided the work is properly attributed. For permission for commercial use of this work, please see paragraphs 4.2 and 5 of our Terms.
© 2020 The Author(s). This work is published and licensed by Dove Medical Press Limited. The full terms of this license are available at https://www.dovepress.com/terms.php and incorporate the Creative Commons Attribution - Non Commercial (unported, v3.0) License.
By accessing the work you hereby accept the Terms. Non-commercial uses of the work are permitted without any further permission from Dove Medical Press Limited, provided the work is properly attributed. For permission for commercial use of this work, please see paragraphs 4.2 and 5 of our Terms.