")
Back to Journals » Cancer Management and Research » Volume 11
Nomogram For The Prediction Of Malignancy In Small (8–20 mm) Indeterminate Solid Solitary Pulmonary Nodules In Chinese Populations
Authors Chen XB, Yan RY, Zhao K, Zhang DF , Li YJ, Wu L, Dong XX, Chen Y , Gao DP, Ding YY, Wang XC, Li ZH
Received 2 August 2019
Accepted for publication 4 October 2019
Published 6 November 2019 Volume 2019:11 Pages 9439—9448
DOI https://doi.org/10.2147/CMAR.S225739
Checked for plagiarism Yes
Review by Single anonymous peer review
Peer reviewer comments 2
Editor who approved publication: Dr Chien-Feng Li
Xiao-Bo Chen,1,* Rui-Ying Yan,2,* Ke Zhao,3,4,* Da-Fu Zhang,2 Ya-Jun Li,3,4 Lin Wu,5 Xing-Xiang Dong,2 Ying Chen,1 De-Pei Gao,2 Ying-Ying Ding,2 Xi-Cai Wang,6 Zhen-Hui Li2
1First Department of Thoracic Surgery, The Third Affiliated Hospital of Kunming Medical University, Yunnan Cancer Hospital, Yunnan Cancer Center, Kunming 650118, People’s Republic of China; 2Department of Radiology, The Third Affiliated Hospital of Kunming Medical University, Yunnan Cancer Hospital, Yunnan Cancer Center, Kunming 650118, People’s Republic of China; 3Department of Radiology, Guangdong General Hospital, Guangdong Academy of Medical Sciences, Guangzhou 510080, People’s Republic of China; 4School of Medicine, South China University of Technology, Guangzhou 510641, People’s Republic of China; 5Department of Pathology, The Third Affiliated Hospital of Kunming Medical University, Yunnan Cancer Hospital, Yunnan Cancer Center, Kunming 650118, People’s Republic of China; 6Cancer Research Institute, The Third Affiliated Hospital of Kunming Medical University, Yunnan Cancer Hospital, Yunnan Cancer Center, Kunming 650118, People’s Republic of China
*These authors contributed equally to this work
Correspondence: Xi-Cai Wang
Cancer Research Institute, The Third Affiliated Hospital of Kunming Medical University, Yunnan Cancer Hospital, Yunnan Cancer Center, No.519 Kun Zhou Road, Xi shan District, Kunming 650118, People’s Republic of China
Tel +86 13888087351
Email [email protected]
Zhen-Hui Li
Department of Radiology, The Third Affiliated Hospital of Kunming Medical University, Yunnan Cancer Hospital, Yunnan Cancer Center, No.519 Kun Zhou Road, Xi shan District, Kunming 650118, People’s Republic of China
Tel +86 13698736132
Email [email protected]
Purpose: This study aimed to develop and validate a nomogram for predicting the malignancy of small (8–20 mm) solid indeterminate solitary pulmonary nodules (SPNs) in a Chinese population by using routine clinical and computed tomography data.
Methods: The prediction model was developed using a retrospective cohort that comprised 493 consecutive patients with small indeterminate SPNs who were treated between December 2012 and December 2016. The model was independently validated using a second retrospective cohort comprising 216 consecutive patients treated between January 2017 and May 2018. The investigated variables included patient characteristics (e.g., age and smoking history), nodule parameters (e.g., marginal spiculation and significant enhancement), and tumor biomarker levels (e.g., carcinoembryonic antigen). A prediction model was developed by using multivariable logistic regression analysis, and the model’s performance was presented as a nomogram. The model was evaluated based on its discriminative ability, calibration, and clinical usefulness.
Results: The developed nomogram was ultimately based on age, marginal spiculation, significant enhancement, and pleural indentation. The Harrell concordance index values were 0.869 in the training cohort (95% confidence interval: 0.837–0.901) and 0.847 in the validation cohort (95% confidence interval: 0.792–0.902). The Hosmer-Lemeshow test revealed good calibration in each of the training and validation cohorts. Decision curve analysis confirmed that the nomogram was clinically useful (risk threshold from 0.10 to 0.85).
Conclusion: Patient age, marginal spiculation, significant enhancement, and pleural indentation are independent predictors of malignancy in small indeterminate solid SPNs. The developed nomogram is easy-to-use and may allow the accurate prediction of malignancy in small indeterminate solid SPNs among Chinese patients.
Keywords: lung cancer, solitary pulmonary nodule, solid nodule, nomogram, China
Introduction
The incidences of solitary pulmonary nodules (SPNs) detected by thoracic computed tomography (CT) performed for lung cancer screening or other reasons are increasingly common.1,2 SPNs are classifiable into solid or subsolid types according to their CT manifestation. Subsolid SPNs have a significantly higher likelihood of being malignant than solid counterparts;3 the risk of malignancy among subsolid SPNs is over 90%, while that among solid SPNs ranges from 5% to 70% among patients who undergo surgical resection.3–5 Hence, the timely and accurate identification of SPN type is critical for the management of adults with solid SPNs.
CT-based surveillance is recommended for adults with solid SPNs ≤8 mm because the chances of malignancy in nodules of this size are low. Meanwhile, the guidelines for adults with solid SPNs >8 mm recommend follow-up with CT after 3 months, positron emission tomography (PET)/CT, or tissue biopsy.2,6,7 Some individuals with solid SPNs >8 mm, particularly those who are anxious, may prefer tissue sampling or PET/CT in order to detect any malignancy as soon as possible.8 When tissue sampling is required, guided bronchoscopy technologies or transthoracic needle aspiration is recommended.9–11 The diagnostic yields of guided bronchoscopy, transthoracic needle aspiration, and PET/CT are reportedly 82.5%, 86.7%, and 84.1%, respectively, for SPNs >20 mm and are 60.9%, 78.9%, and 64.2%, respectively, for SPNs ≤20 mm.9–12 As such, PET/CT or tissue sampling may not be ideal for evaluating solid SPNs that are 8–20 mm in size, necessitating alternative means of identifying malignancies.
Some prediction models have been developed to estimate the malignancy of SPNs, and have been used extensively in clinical practice.3,5,12–17 However, these models may not be applicable for solid SPNs that are 8–20 mm, since studies that devised these models may not have necessarily evaluate the patients’ final diagnoses,13 may have evaluated both solid and subsolid SPNs together,3 or were based on general lung cancer screenings that may have missed incidental pulmonary nodules.
Hence, the aim of our study was to develop and validate a nomogram for predicting the malignant potential of small (8–20 mm) indeterminate solid SPNs that were detected using routine clinical examinations and CT image data in a Chinese population.
Materials And Methods
The local ethics committee of the Yunnan Cancer Hospital, Xishan Region, Kunming, People’s Republic of China, approved this retrospective study, which complied with the Declaration of Helsinki and good clinical practice guidelines. The requirement for informed consent was waived by the committee owing to the study’s retrospective nature. All the patient data in the survey were anonymized.
Patients
We retrospectively identified consecutive patients with small indeterminate solid SPNs who underwent surgical resection between December 2012 and March 2018 at Yunnan Cancer Center, China. The patients were divided into two separate cohorts: 493 patients treated between December 2012 and December 2016 comprised the training cohort, whereas 216 patients treated between January 2017 and May 2018 comprised the validation cohort. Supplemental Figure 1 shows the study flowchart, including the inclusion and exclusion criteria.
Thoracic CT Scans And Image Analysis
CT was performed with a 128-slice CT scanner (SOMATOM Definition AS+, Siemens Medical Solutions, Forchheim, Germany). CT examination included unenhanced imaging with a tube voltage of 120 kVp (100 mA/s, CARE kV on, CARE dose 4D on, pitch = 0.6, rotation = 0.5 s, display field of view = 42 cm2, matrix = 512 × 512, and collimation = 128 × 0.6 mm). Patients were then injected with nonionic contrast material (Ultravist 300, Bayer Schering Pharma AG, Berlin, Germany; or Iohexol 300, Yangtze River Pharmaceutical Group, Taizhou, China) with antecubital venous access at a rate of 3.5 mL/s. A total of 80–100 mL (1.5 mL per kilogram of body weight) was injected with a CT-compatible power injector (Bracco ACIST EZEM, Empower CTA) followed by a 20 mL saline flush at the same rate. Scanning for contrast enhancement was performed 30 and 50–60 seconds after injection. The images were reconstructed using lung- and soft tissue-based algorithms with a thickness of 1 mm, as described previously.18 The CT features were assessed in the following settings: lung window center, −500 Hounsfield units (HU)/lung window width, 1,500 HU; mediastinal window center, 40 HU/mediastinal window width, 350 HU. All image features were prospectively evaluated by a thoracic radiologist with 11 years of experience who was blinded to the histopathological results of the SPNs.
Variables
The present study analyzed the following variables:
- Patient characteristics including age, sex, body mass index, smoking history (yes or on), chronic interstitial or obstructive lung disease (yes or no), family history of lung cancer (yes or no), and history of extra-thoracic malignant neoplasm (>5 years ago, yes or no).
- Image-based features consisted of emphysema (yes or no) and nodule parameters including diameter, upper lobe location (yes or no), marginal spiculation (yes or no), significant lung nodule enhancement (yes [>15 HU] or no [≤15 HU]), and pleural indentation (yes or no) based on previous studies.5,13,15
- Tumor biomarkers including carcinoembryonic antigen (CEA, normal [≤5.0 μg/L] or abnormal [>5.0 μg/L]), carbohydrate antigen 125 (normal [≤35.0 kU/L] or abnormal [>35.0 kU/L]), carbohydrate antigen 199 (normal [≤27.0 kU/L] or abnormal [>27.0 kU/L]), carbohydrate antigen 724 (normal [≤6.9 kU/L] or abnormal [>6.9 kU/L]), neuron-specific enolase (normal [≤16.3 μg/L] or abnormal [>16.3 μg/L]), squamous cell carcinoma antigen (normal [≤1.5 μg/L] or abnormal [>1.5 μg/L]), and ferritin (normal [13–150 μg/L] or abnormal [<13 or >150 μg/L]).
SPN Diagnosis
All the SPNs were diagnosed by histopathological examination after surgical resection and were thereby categorized into the benign and malignant groups.
Statistical Analysis
The R software (version 3.4.0; http://www.R-project.org) was used to perform all statistical analyses. The expectation-maximization imputation method was used to impute missing values for covariates with lapses of <10%.19 The reported statistical significance levels are all two-sided, with statistical significance set at a P-value <0.05.
Mean values ± standard deviations are provided for normally distributed variables, whereas frequencies are provided for categorical data. Differences in characteristics between the training and validation cohorts and between the benign and malignant groups in each of these cohorts were analyzed using the independent-samples t-test or Chi-square test.
Univariate and multivariate logistic regression models were used to calculate the odds ratios and 95% confidence intervals. Independent predictors of malignancy in solid SPNs that were 8–20 mm was determined using the multivariate logistic regression model using the training data (P < 0.05). The prediction model was revised to incorporate only the significant predictors. The model’s performance was evaluated using bootstrapping, in which the dataset was tested 1,000 times with random resampling each time (i.e., patient overlap was possible).
Evaluation Of The Prediction Model
Discrimination
The Harrell concordance index (C-index) was calculated as a measure of the goodness of fit for the prediction model; this index is equal to the area under the receiver operating characteristic (ROC) curve and ranges from 0.5 to 1. The discrimination slope, which is defined as the slope of the linear regression of predicted probabilities for events derived from a binary event status model, is used as a measure of discriminative ability.20
Reclassification
The net reclassification improvement (NRI) and integrated discrimination improvement (IDI), which were calculated to measure the improvement in prediction performance gained by adding a marker, were used to compare the discriminative abilities of two models.21
Calibration
Calibration is used to describe the consistency between observed outcomes and predicted values. The calibration curve was represented as predictions on the x-axis and actual outcomes on the y-axis and was evaluated using the Hosmer-Lemeshow test.
Clinical Usefulness
The decision curve analysis (DCA) proposed by Vickers et al is a simple method to quantify the clinical utility of a predictive model (or an extension to such a model).22 Instead of the net benefit (NB), the standardized NB (sNB) was used in this study as a function of the risk threshold in the decision curve, as the sNB was much easier to interpret and compare (sNB values range from 0 to 1). The sNB was calculated at the cut-off of 0.5 of the risk threshold, which implied a relative weight of 1:1 for false positive decisions against true positive decisions.23 The clinical impact plot was used to estimate the cut-off number that would determine the high risk point for each threshold, and to illustrate their proportions.24 The ROC component plot shows the constituents of sNB; i.e., the true- and false- positive rates, where the former is displayed as a convex function of the risk threshold and the latter as a concave function of the same.24
Nomogram
A nomogram was constructed based on the logistic regression model,25 and the probabilities of malignancy in patients with 8–20 mm solid SPNs who were of different ages and had different imaging features were calculated directly using the predictive model, which was listed as a table for the ease of clinical use.
Results
Clinical Characteristics
The features of patients in the training and validation cohorts are shown in Table 1 and Supplemental Table 1. There were no significant differences between the two cohorts in terms of patient characteristics, image-based features, and tumor biomarkers (P-values ranged between 0.110 and 0.985). There was also no significant difference in the prevalence of malignant solid SPNs between the two cohorts (P = 0.509); the malignancy rates in the training and validation cohorts were 43.41% and 40.74%, respectively.
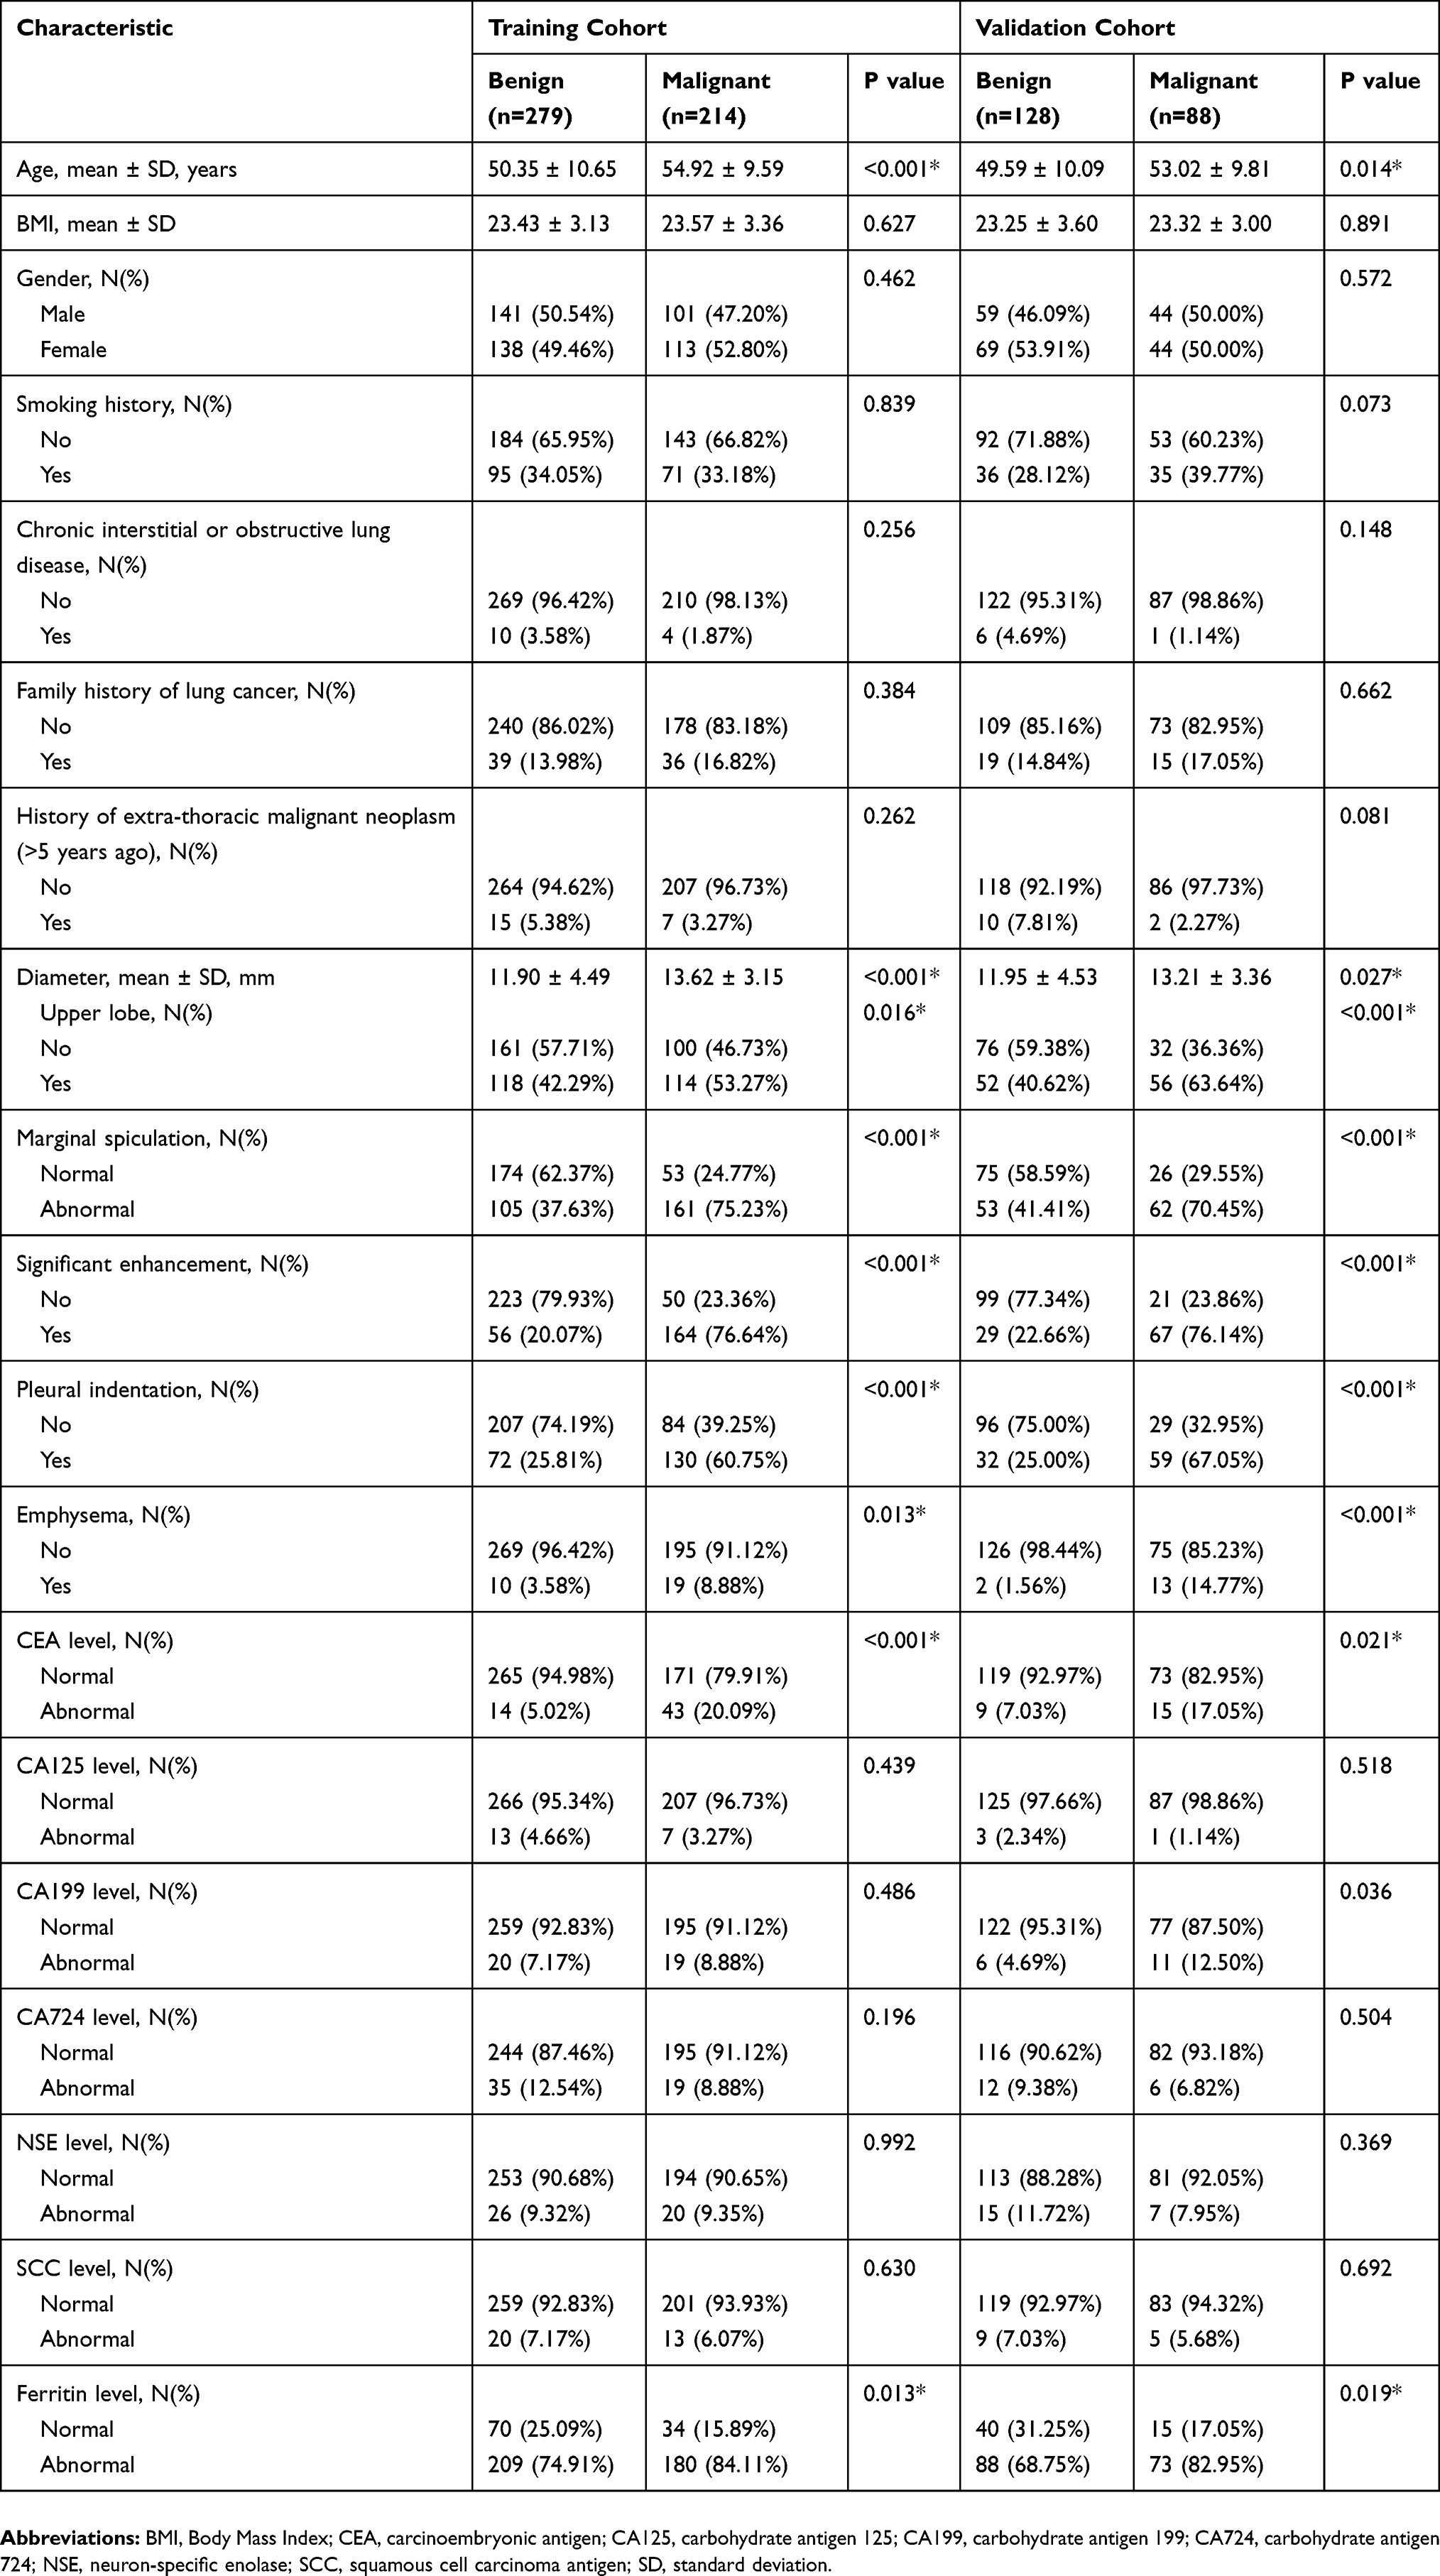 |
Table 1 Characteristics Of The Patients In The Training And Validation Cohorts |
Identifying Predictors And Developing The Model
Supplemental Table 2 shows the results of univariate logistic regression analyses performed to identify potential clinical and CT-based predictors of malignancy in small indeterminate solid SPNs in the training, validation, and pooled cohorts. These analyses showed that age, diameter, upper lobe rate, marginal spiculation rate, significant enhancement rate, pleural indentation rate, emphysema rate, CEA level, and ferritin level were associated with the probability of malignancy in each of the three cohorts (all P < 0.05).
Multivariate logistic regression analyses revealed that age, marginal spiculation, significant enhancement, pleural indentation, and abnormal CEA levels were independent predictors of malignancy (Table 2). As such, we developed two models: model 1 incorporated age, marginal spiculation, significant enhancement, and pleural indentation, while model 2 incorporated model 1 factors plus CEA level.
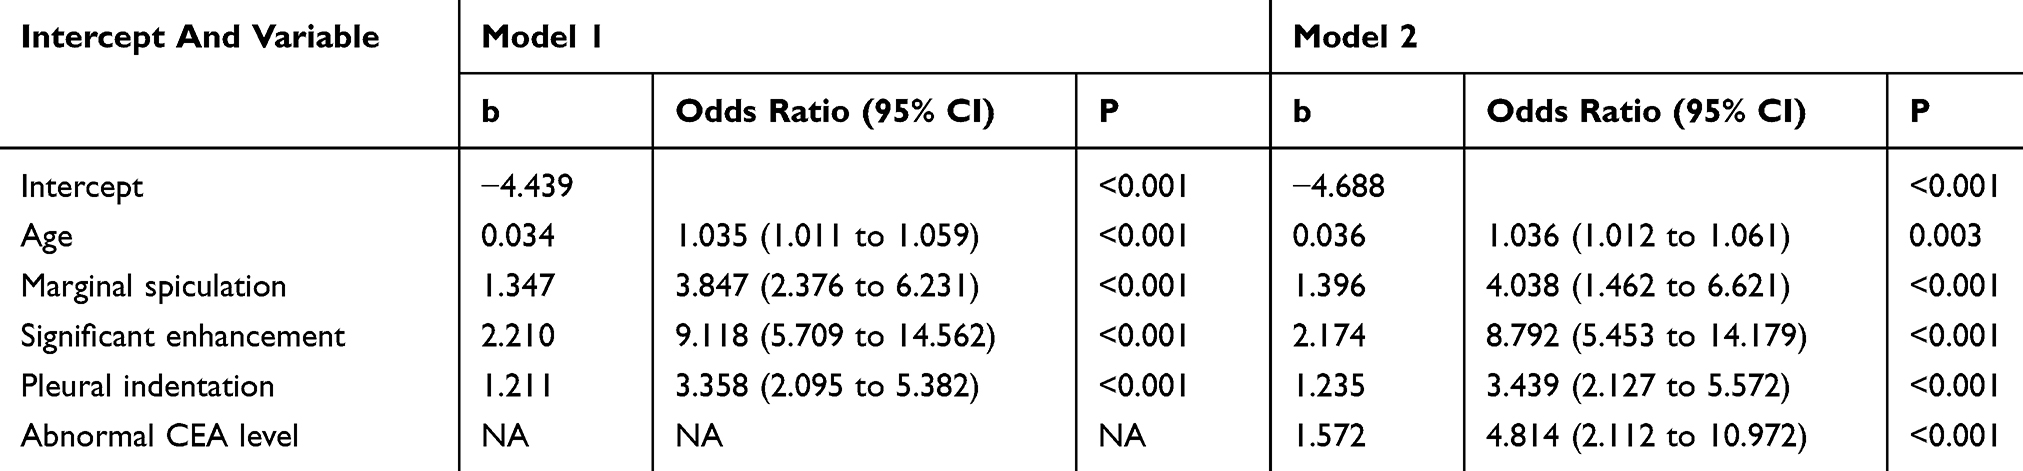 |
Table 2 Predictors Of Malignancy In Indeterminate Solid Solitary Pulmonary Nodules 8–20 Mm In Size |
Model Performance
Table 3 shows the C-index, discrimination slope, calibration slope, and sNB of models 1 and 2, respectively, within the training and validation cohorts. The C-index and sNB were not significantly different between model 1 and model 2 in either of the two cohorts.
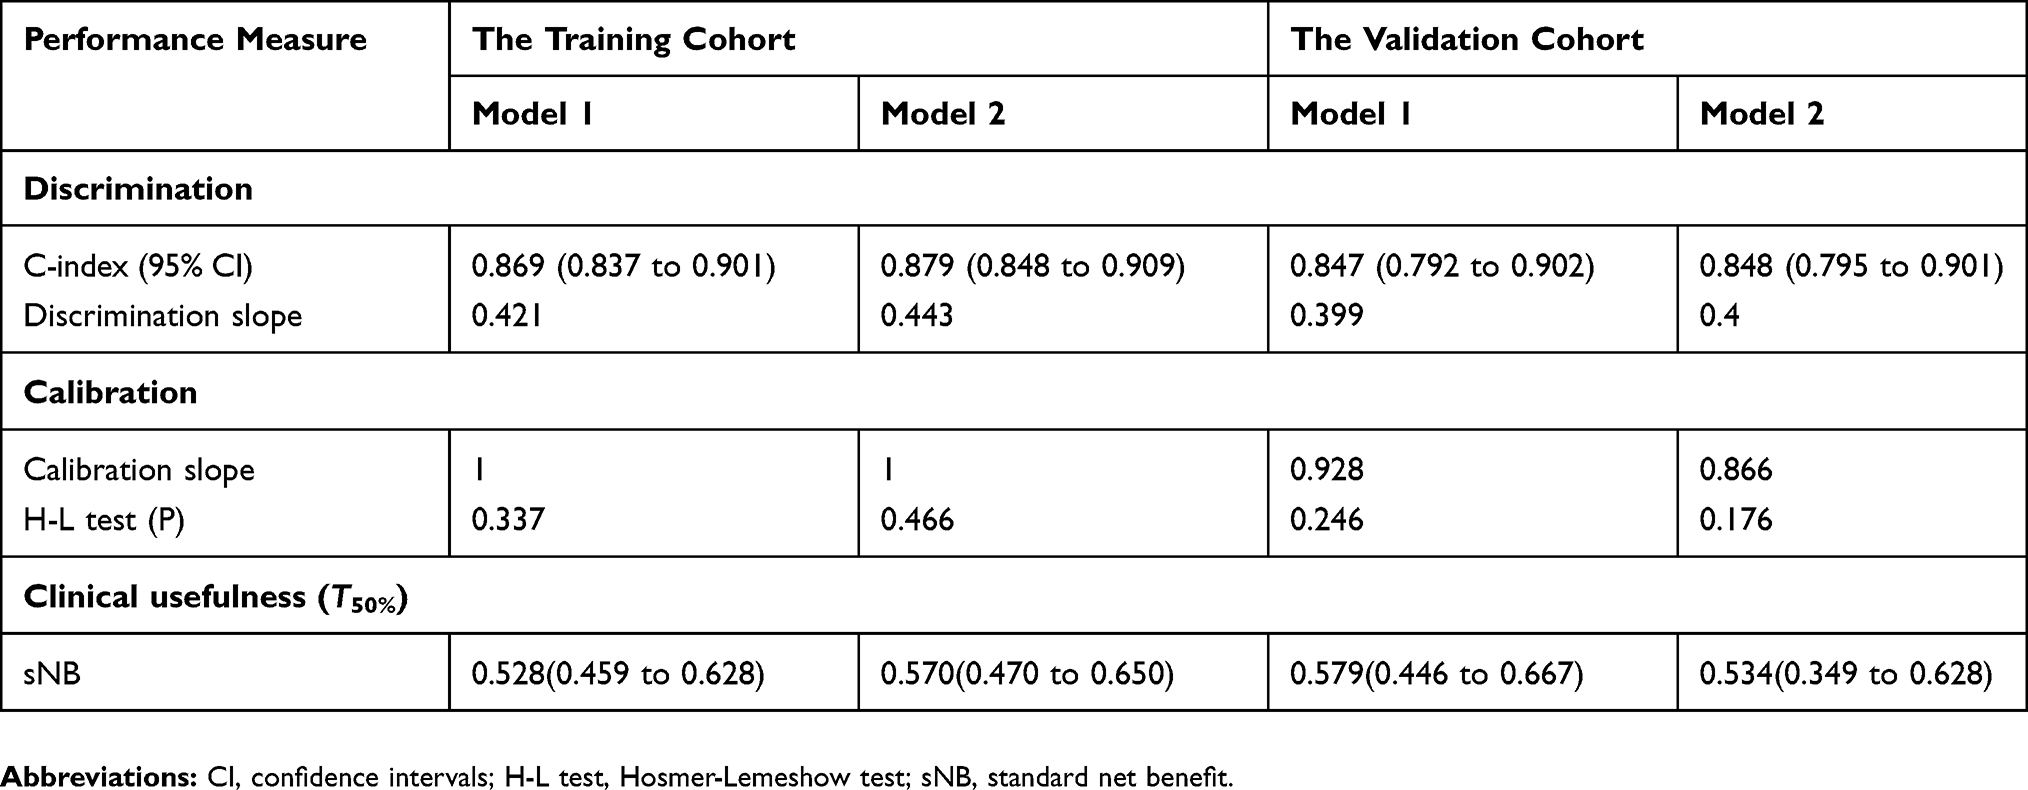 |
Table 3 Performance Of The Models Predicting Malignancy In Indeterminate Solid Solitary Pulmonary Nodules 8–20 Mm In Size Within The Training Cohort (n = 493) And Validation Cohort (n = 216) |
The integration of CEA into the prediction model showed significantly improved prediction performance in terms of NRI in the validation cohort (0.200; P < 0.001) but did not show significantly improved prediction performance in terms of IDI (0.001; P = 0.941) (Supplemental Table 3).
The Hosmer-Lemeshow calibration test showed no significant difference in the model 1-predicted versus observed malignant SPNs in either the training cohort (P = 0.337) or the validation cohort (P = 0.246) (Figure 1).
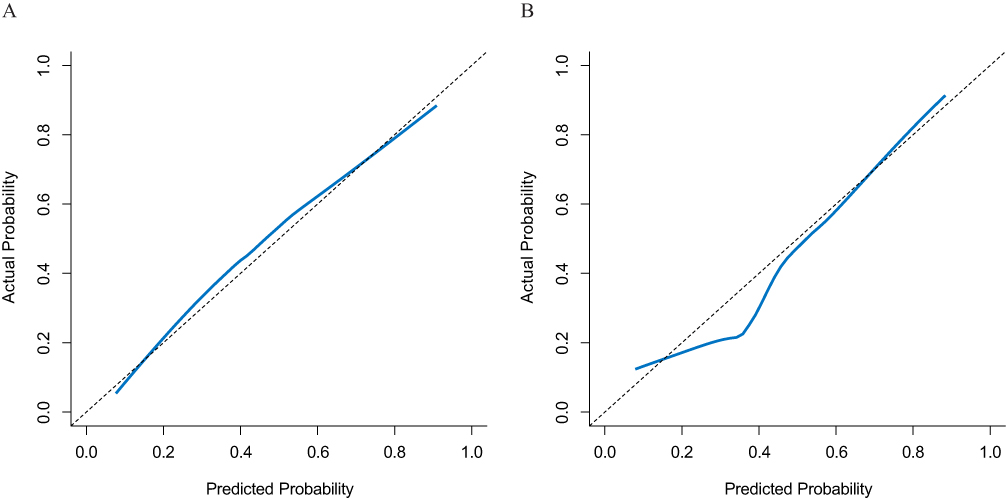 |
Figure 1 Plots depict the calibration of model 1 in terms of agreement between the predicted and observed malignant solitary pulmonary nodules (SPNs) in the training (A) and validation (B) cohorts. The nomogram estimated malignant SPNs are plotted on the X-axis, while the observed malignant SPNs are plotted on the Y-axis. The diagonal dotted line indicates perfect calibration based on an ideal model that would reflect the outcomes perfectly. The solid line indicates the nomogram’s actual performance; a close alignment between the solid and dotted lines indicates better estimation of the actual outcomes. |
The DCA plot showed that the probability of malignancy as predicted by each of model 1 and model 2 provided better outcomes than scenarios in which either all patients were treated, or no patients were treated. Model 2 did not outperform model 1, with risk thresholds ranging from 0.10 to 0.85 in both the training and validation cohorts (Figure 2A and B). The clinical impact plot shows that if a 0.5 risk threshold was used in model 1, approximately 382 of 1,000 men would be predicted to have a high risk of malignancy, with approximately 351 of these being actual cases of malignancy in the validation cohort (Figure 2C and D). The true- and false-positive fractions are displayed as convex and concave functions, respectively, of the risk threshold in the ROC components plot for the model in the training and validation cohorts (Figure 2E and F).
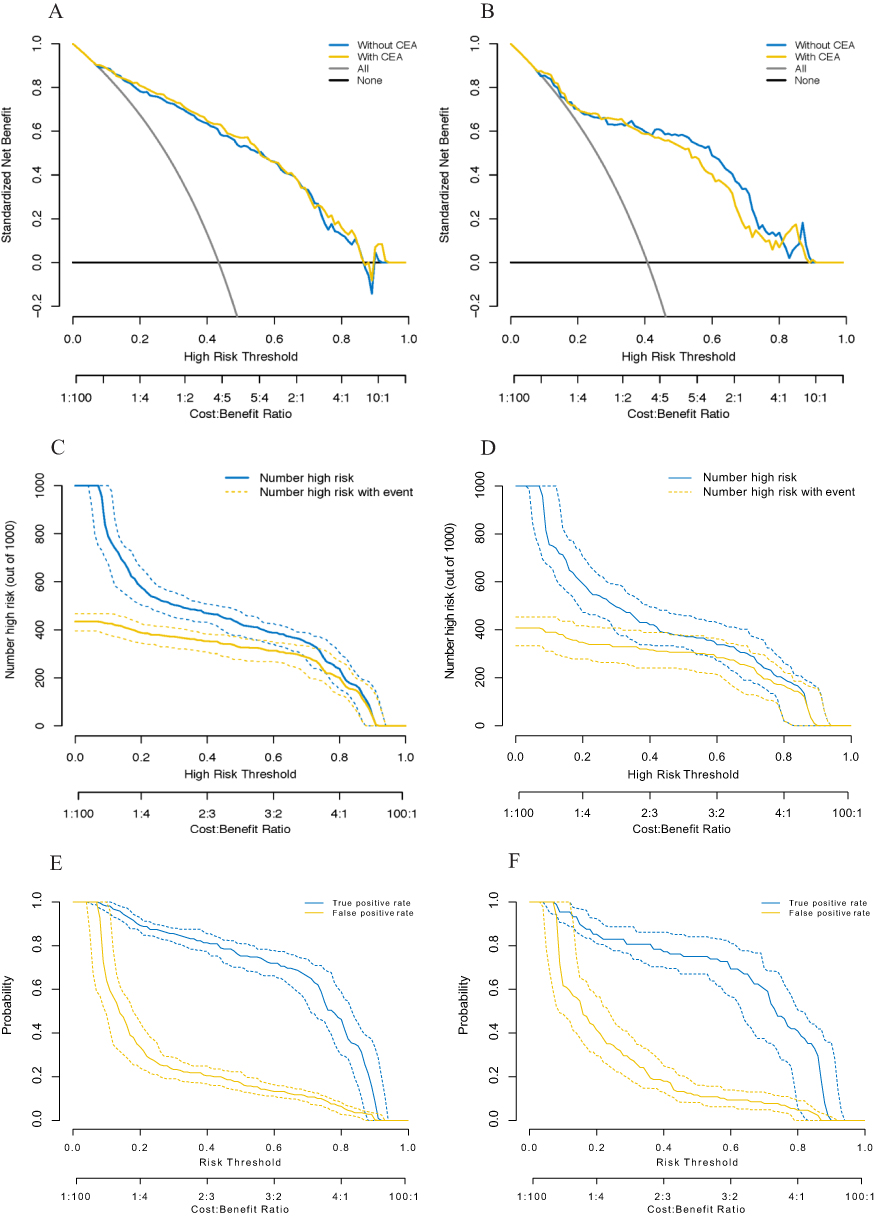 |
Figure 2 Decision curves for two risk prediction models for the malignancy of indeterminate solid solitary pulmonary nodules (A, B). The vertical axis shows the net benefit of standardization. The two horizontal axes display the correspondence between the risk threshold and cost-benefit ratio. The clinical impact curves for model 1 are shown in (C) and (D). Of 1,000 patients, the solid blue line indicates the total number of people who would be considered at high-risk for each risk threshold. The solid gold line indicates the number of true positive cases. True- and false-positive rates, as functions of the risk threshold for model 1, are shown in (E) and (F). The figure shows information similar to that of a receiver operating characteristic curve and also shows the risk threshold corresponding to each true- and false-positive rate. Bands on all plots represent pointwise 95% confidence intervals constructed via bootstrapping. Left: the training cohort (A, C, and E); right: the validation cohort (B, D, and F). |
Nomogram
Model 1 was used as a nomogram for easy clinical use (Figure 3). Supplemental Table 4 shows the probability of malignancy among small indeterminate solid SPNs among patients of different ages using eight combinations involving the presence and absence of selected categorical predictors (marginal spiculation, significant enhancement, and pleural indentation), which were derived using model 1.
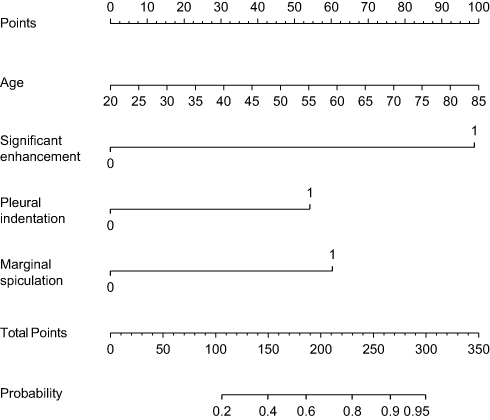 |
Figure 3 Nomograms for predicting the malignancy of 8–20 mm indeterminate solid solitary pulmonary nodules. Each variable was assigned a score, the sum of which was converted into a probability on the lowest scale. |
Discussion
We developed and validated a nomogram for predicting the malignancy of small (8–20 mm) indeterminate solid SPNs based on routine clinical and CT image data. The nomogram incorporates four items: age, marginal spiculation, significant enhancement, and pleural indentation. This nomogram has similar performance to, but is simpler than, currently available nomograms or models.3,12–17
To our knowledge, ours is the first nomogram or model that focuses on predicting the malignancy of 8–20 mm indeterminate solid SPNs, which is more challenging to do owing to the smaller nodules and more rigorous research standards required.3,12–17 First, most previous models focused on the SPNs in general, both solid and subsolid.3,12–14 However, previous models for subsolid SPNs may outperform those for solid SPNs in terms of predicting the probability of malignancy because subsolid SPNs are significantly more likely to be malignant.3 Second, some previous models focused on solid SPNs, including those 20–30 mm or 8–20 mm in size.15–17 Models for 20–30 mm solid SPNs may outperform those used for 8–20 mm counterparts in terms of predicting the probability of malignancy because such a probability increases among larger SPNs.13 Third, our study focused on indeterminate solid SPNs diagnosed on imaging without identifying their types, such as hamartomas and arteriovenous malformations, as had been performed in previous studies.15–17
Our study showed that features including age; diameter; rates of upper lobe tumors, marginal spiculation, significant enhancement, pleural indentation, and emphysema; CEA level, and ferritin level are associated with the probability of malignancy in indeterminate solid SPNs 8–20 mm, which is consistent with previous studies.3,12–18 However, we also found that only age, marginal spiculation, significant enhancement, pleural indentation, and abnormal CEA level were independent predictors of malignancy of small indeterminate solid SPNs, which differs from the results of previous studies.3,12–18 Smoking history, upper lobe location, and diameter, which were independent predictors of SPN malignancy in most previous studies, were not so in small solid SPNs according to our data. This could be related to differences in characteristics between Chinese and European/American patients, among other reasons. First, the risk of lung cancer owing to air pollution (such as cooking oil vapor and passive smoke experienced by Chinese non-smokers, especially women) is higher than that owing to cigarette smoking among Chinese populations; this is not the case among Europeans and Americans.26 Second, tuberculosis, which often requires a definitive diagnosis because of both individual treatment and public health implications, is often located in the upper lobe, as are malignant SPNs; however, the incidence rate of tuberculosis among Chinese people is higher than that among Europeans and Americans.27 Third, it has been speculated that a correlation exists between marginal spiculation, pleural indentation, and SPN size in terms of prediction values, and the predicted values of marginal spiculation and pleural indentation are higher than that of SPN size; this warrants further investigation.
A strength of our study was that we confirmed the value of significant lung nodule enhancement (>15 HU) for predicting the malignancy of small indeterminate solid SPNs; this was an independent predictor in our model. We utilized clinical and imaging information (including enhancement CT) to the fullest when developing the prediction model, thereby differentiating them from previously described counterparts.3,12–18 Additionally, our model outperformed those that used PET/CT or tissue sampling for predicting the malignancy of small indeterminate solid SPNs,9–12 and was therefore more useful for assessing the probability of malignancy in such lesions to enable optimal clinical decision-making. Of note, our model is not necessarily applicable for lung screening.
The CEA level was not included in our nomogram, which may be controversial. A previous study found that incorporating CEA level as an additional predictor only incrementally increased the reliability of solid SPN diagnoses. However, we observed no significant differences in the C-index, calibration, sNB, or IDI between the prediction model that incorporated CEA and the model that did not, although the INR was significantly improved in the former. Our nomogram that does not include CEA enhances the generalizability of our findings to low- and middle-income areas in which tumor biomarkers testing (such as CEA) is difficult or unavailable.
Our study had three major limitations. First, it was a single-center retrospective investigation; the accuracy of our prediction model ought to be confirmed in a multicenter prospective study, which could enable the use of our nomogram as a clinical aid for predicting the malignancy of small indeterminate solid SPNs. Second, we did not use radiomics, which is a popular method that may markedly improve the predictive value of our model. However, models based on radiomics are sometimes limited in their generalizability. In contrast, our current model arguably improves generalizability by using routine clinical and CT image data. Third, the rate of benign lesion is relatively high in our study. It was because that most of these individuals with solid SPNs >8 mm, particularly those who are anxious, may prefer direct surgical resection rather than follow-up CT surveillance to detect any malignancy in the past ten years in Yunnan, China.
Conclusion
Age, marginal spiculation, significant enhancement, and pleural indentation are independent predictors of small indeterminate solid SPN malignancy. We developed and validated a prediction model and nomogram that were more accurate than PET/CT or tissue sampling in terms of predicting the malignancy of such SPNs. Our nomogram is easy to use and may allow clinicians to accurately predict the malignant potential of small indeterminate solid SPNs in Chinese populations.
Acknowledgments
This work was supported by grants from the National Key Research and Development Program of China (2017YFC0907902), the National Key Research and Development Program (2016YFE0103400), and the Applied Basic Research Projects of Yunnan Province, China (2018FE001-065, 2018FE001-251 and2018FE001-252).
Author Contributions
ZHL, XCW, XBC, RYY, and KZ made substantial contributions to the conception, design, analysis, and interpretation of data, and wrote and revised the manuscript. DFZ, YJL, LW, XXD, YC, DPG, and YYD collected and analyzed the data and took part in the drafting of the manuscript. All authors contributed toward data analysis, drafting, and revising the paper, and all agree to be accountable for all aspects of the work. All authors have read and approved the final version of the manuscript.
Disclosure
The authors declare that they have no potential conflicts of interest in this work.
References
1. Anderson IJ, Davis AM. Incidental pulmonary nodules detected on CT images. JAMA. 2018;320(21):2260–2261. doi:10.1001/jama.2018.16336
2. MacMahon H, Naidich DP, Goo JM, et al. Guidelines for management of incidental pulmonary nodules detected on CT images: from the Fleischner Society 2017. Radiology. 2017;284(1):228–243. doi:10.1148/radiol.2017161659
3. McWilliams A, Tammemagi MC, Mayo JR, et al. Probability of cancer in pulmonary nodules detected on first screening CT. N Eng J Med. 2013;369(10):910–919. doi:10.1056/NEJMoa1214726
4. Sharma P, Singh H, Basu S, Kumar R. Positron emission tomography-computed tomography in the management of lung cancer: an update. South Asian J Cancer. 2013;2(3):171–178. doi:10.4103/2278-330x.114148
5. White CS, Dharaiya E, Campbell E, Boroczky L. The Vancouver lung cancer risk prediction model: assessment by using a subset of the National Lung Screening Trial cohort. Radiology. 2017;283(1):264–272. doi:10.1148/radiol.2016152627
6. Oudkerk M, Devaraj A, Vliegenthart R, et al. European position statement on lung cancer screening. Lancet Oncol. 2017;18(12):e754–e766. doi:10.1016/s1470-2045(17)30861-6
7. Gould MK, Donington J, Lynch WR, et al. Evaluation of individuals with pulmonary nodules: when is it lung cancer? Diagnosis and management of lung cancer, 3rd ed: American College of Chest Physicians evidence-based clinical practice guidelines. Chest. 2013;143(5 Suppl):e93S–e120S. doi:10.1378/chest.12-2351
8. Gibson G, Kumar AR, Steinke K, et al. Risk stratification in the investigation of pulmonary nodules in a high-risk cohort: positron emission tomography/computed tomography outperforms clinical risk prediction algorithms. Intern Med J. 2017;47(12):1385–1392. doi:10.1111/imj.13576
9. Ohno Y, Hatabu H, Takenaka D, et al. CT-guided transthoracic needle aspiration biopsy of small (< or="20” mm)="” solitary="” pulmonary="">. AJR Am J Roentgenol. 2003;180(6):1665–1669. doi:10.2214/ajr.180.6.1801665
10. Wang Memoli JS, Nietert PJ, Silvestri GA. Meta-analysis of guided bronchoscopy for the evaluation of the pulmonary nodule. Chest. 2012;142(2):385–393. doi:10.1378/chest.11-1764
11. Tsukada H, Satou T, Iwashima A, Souma T. Diagnostic accuracy of CT-guided automated needle biopsy of lung nodules. AJR Am J Roentgenol. 2000;175(1):239–243. doi:10.2214/ajr.175.1.1750239
12. Ruilong Z, Daohai X, Li G, Xiaohong W, Chunjie W, Lei T. Diagnostic value of 18F-FDG-PET/CT for the evaluation of solitary pulmonary nodules: a systematic review and meta-analysis. Nucl Med Commun. 2017;38(1):67–75. doi:10.1097/mnm.0000000000000605
13. Swensen SJ, Silverstein MD, Ilstrup DM, Schleck CD, Edell ES. The probability of malignancy in solitary pulmonary nodules. Application to small radiologically indeterminate nodules. Arch Intern Med. 1997;157(8):849–855.
14. Li Y, Chen KZ, Wang J. Development and validation of a clinical prediction model to estimate the probability of malignancy in solitary pulmonary nodules in Chinese people. Clin Lung Cancer. 2011;12(5):313–319. doi:10.1016/j.cllc.2011.06.005
15. Xiang Y, Sun Y, Liu Y, et al. Development and validation of a predictive model for the diagnosis of solid solitary pulmonary nodules using data mining methods. J Thorac Dis. 2019;11(3):950–958. doi:10.21037/jtd.2019.01.90
16. Soardi GA, Perandini S, Larici AR, et al. Multicentre external validation of the BIMC model for solid solitary pulmonary nodule malignancy prediction. Eur Radiol. 2017;27(5):1929–1933. doi:10.1007/s00330-016-4538-5
17. She Y, Zhao L, Dai C, et al. Development and validation of a nomogram to estimate the pretest probability of cancer in Chinese patients with solid solitary pulmonary nodules: a multi-institutional study. J Surg Oncol. 2017;116(6):756–762. doi:10.1002/jso.24704
18. Swensen SJ, Viggiano RW, Midthun DE, et al. Lung nodule enhancement at CT: multicenter study. Radiology. 2000;214(1):73–80. doi:10.1148/radiology.214.1.r00ja1473
19. Gadbury G. Analysis of incomplete multivariate data (Monographs on statistics and applied probability, No. 72) by J. L. Schafer. J Am Stat Assoc. 2000;95(451):1013–1014. doi:10.2307/2669497
20. Pencina MJ, Fine JP, D’Agostino RB
21. Pencina MJ, D’Agostino RB
22. Vickers AJ, Elkin EB. Decision curve analysis: a novel method for evaluating prediction models. Med Decis Making. 2006;26(6):565–574. doi:10.1177/0272989X06295361
23. Zhang Z, Rousson V, Lee WC, et al. Decision curve analysis: a technical note. Ann Transl Med. 2018;6(15):308. doi:10.21037/atm.2018.07.02
24. Kerr KF, Brown MD, Zhu K, Janes H. Assessing the clinical impact of risk prediction models with decision curves: guidance for correct interpretation and appropriate use. J Clin Oncol. 2016;34(21):2534–2540. doi:10.1200/JCO.2015.65.5654
25. Grimes DA. The nomogram epidemic: resurgence of a medical relic. Ann Intern Med. 2008;149(4):273–275. doi:10.7326/0003-4819-149-4-200808190-00010
26. Guan WJ, Zheng XY, Chung KF, Zhong N-S. Impact of air pollution on the burden of chronic respiratory diseases in China: time for urgent action. Lancet. 2016;388(10054):1939–1951. doi:10.1016/s0140-6736(16)31597-5
27. Bai C, Choi CM, Chu CM, et al. Evaluation of pulmonary nodules: clinical practice consensus guidelines for Asia. Chest. 2016;150(4):877–893. doi:10.1016/j.chest.2016.02.650
 © 2019 The Author(s). This work is published and licensed by Dove Medical Press Limited. The full terms of this license are available at https://www.dovepress.com/terms.php and incorporate the Creative Commons Attribution - Non Commercial (unported, v3.0) License.
By accessing the work you hereby accept the Terms. Non-commercial uses of the work are permitted without any further permission from Dove Medical Press Limited, provided the work is properly attributed. For permission for commercial use of this work, please see paragraphs 4.2 and 5 of our Terms.
© 2019 The Author(s). This work is published and licensed by Dove Medical Press Limited. The full terms of this license are available at https://www.dovepress.com/terms.php and incorporate the Creative Commons Attribution - Non Commercial (unported, v3.0) License.
By accessing the work you hereby accept the Terms. Non-commercial uses of the work are permitted without any further permission from Dove Medical Press Limited, provided the work is properly attributed. For permission for commercial use of this work, please see paragraphs 4.2 and 5 of our Terms.