")
Back to Journals » Diabetes, Metabolic Syndrome and Obesity » Volume 15
Nomogram for Prediction of Diabetic Retinopathy Among Type 2 Diabetes Population in Xinjiang, China
Authors Li Y , Li C, Zhao S , Yin Y, Zhang X, Wang K
Received 17 December 2021
Accepted for publication 23 March 2022
Published 7 April 2022 Volume 2022:15 Pages 1077—1089
DOI https://doi.org/10.2147/DMSO.S354611
Checked for plagiarism Yes
Review by Single anonymous peer review
Peer reviewer comments 2
Editor who approved publication: Professor Ming-Hui Zou
Yongsheng Li,1,* Cheng Li,2,* Shi Zhao,3 Yi Yin,4 Xueliang Zhang,5 Kai Wang5
1College of Public Health, Xinjiang Medical University, Urumqi, 830011, People’s Republic of China; 2Center for Data Statistics and Analysis, First Affiliated Hospital of Xinjiang Medical University, Urumqi, 830054, People’s Republic of China; 3JC School of Public Health and Primary Care, Chinese University of Hong Kong, Hong Kong, 999077, People’s Republic of China; 4Department of Epidemiology and Biostatistics, School of Public Health, Nanjing Medical University, Nanjing, Jiangsu, 211166, People’s Republic of China; 5Department of Medical Engineering and Technology, Xinjiang Medical University, Urumqi, 830011, People’s Republic of China
*These authors contributed equally to this work
Correspondence: Xueliang Zhang; Kai Wang, Department of Medical Engineering and Technology, Xinjiang Medical University, No. 567 Shangde North Road, Shuimogou District, Urumqi City, Xinjiang, 830011, People’s Republic of China, Tel +86 18999978069 ; +86 13999801720, Fax +8609912110396, Email [email protected]; [email protected]
Purpose: To establish an accurate risk prediction model of diabetic retinopathy (DR) using cost effective and easily available patients’ characteristics and clinical biomarkers.
Patients and Methods: Totally 18,904 cases diagnosed type 2 diabetes mellitus (T2DM) were collected, among which 13,980 cases were selected after quality screening. The least absolute shrinkage and selection operator (LASSO) regression models were used for univariate analysis and factors selection, and the multi-factor logistic regression analysis was used to establish the prediction model. Discrimination, calibration, and clinical usefulness of the prediction model were assessed using AUC/ Harrell’s C statistic, calibration plot, and decision curve analysis. Both the development group and validation group were assessed.
Results: Candidate variables were selected by Lasso regression and multivariate logistic regression analysis. Finally, the candidate predictive variables were included diabetic peripheral neuropathy (DPN), age, neutrophilic granulocyte (NE), high-density lipoprotein (HDL), hemoglobin A1c (HbA1C), duration of T2DM, and glycosylated serum protein (GSP) were used to establish a nomogram model for predicting the risk of DR. In the development group, the area under the receiver operating characteristic curve (AUC) was 0.882 (95% CI, 0.875– 0.888). In the validation group, the AUC was 0.870 (95% CI, 0.856– 0.881). Meanwhile, the optimism-corrected Harrell’s C statistic were 0.878 and 0.867 in the development group and the validation group, respectively. Decision curve analysis demonstrated that the nomogram was clinically useful.
Conclusion: We constructed and verified nomograms that could accurately predict the risk of DR in T2DM patients, which could be used to predict the personalized risk of DR patients in Xinjiang, China.
Keywords: diabetic peripheral neuropathy, risk factors, prediction model, nomogram
Introduction
The prevalence of diabetes is explosive worldwide, especially in developing countries.1 In 2019, the Diabetes Atlas of International Diabetes Federation (IDF) (9th Edition) indicated that about 463 million patients exist over the world, which is expected to rise to 700 million in 2045.2 In China, the number of diabetics has reached 116.4 million, takes up about one third of the amount of diabetics worldwide.3 Diabetic retinopathy (DR), as one of the complications of diabetes, is considered to be one of the main causes of vision loss and visual impairment in adults, which can lead to blindness in severe cases.4,5 It’s difficult to detect the symptoms of DR in early stage. Blindness often suddenly occurs. Unfortunately, there is no effective treatment for DR to recover patients’ vision. The incidence rate of DR increases with the increase of DM and the prolongation of lifespan. In recent years, a meta-analysis of 35 epidemiological studies showed that the prevalence of DR in DM patients was 34.6%. It is estimated that the number of DR patients will increase from 127 million in 2010 to 191 million in 2030.6 Therefore, the key to reduce diabetic blindness lies in the early detection of asymptomatic DR, so that patients can get effective treatment before blindness occurs.
The current clinical diagnosis of DR is highly subjective description reported as vision loss by patients and regular fundus examination. Once diagnosed, it is difficult to reverse. It is necessary to find the early markers of DR. Many epidemiological studies on DR, including cross-sectional studies7,8 and cohort studies,9,10 are carried out around the world to explore the risk factors associated with the disease so as to prevent and treat the disease. Older T2DM patients with longer disease course tend to have higher risk of DR. In addition, diabetic renal complications, poor glycemic control, hyperlipidemia or hypertension have also been reported as risk factors for DR, affecting the progress of DR.11 Early treatment of DR was used to evaluate the effects of these reported factors.12 It was found that the duration of T2DM, hyperglycemia and hypertension were the most important risk factors for the progression of visual loss.13 However, little attention has been paid to DR, related risk factors, as well as eye screening.14 Therefore, more research are needed to improve the understanding of risk factors.
At present, more and more researchers have made a lot of efforts to build prediction models or improve existing prediction models.15–17 among which building nomogram is one of the hottest research directions. In the latest research,15,18,19 the use of nomogram prediction has shown good performance.
In this paper, totally 13,980 T2DM cases were included for exploring the potential relationship between DR and its dangerous factors, as well as establishing a nomogram model benefiting clinical workers for early diagnose of DR patients.
Materials and Methods
Study Design and Participants
The clinical data of 18,904 patients with T2DM in Xinjiang from 2010 to 2019 was retrospectively collected. The exclusion criteria included, (1) Age below 10 years old (a progressive insulin secretory defect on the background of insulin resistance);20 (2) incomplete clinical data; (3) patients with cancer or cardiovascular disease; (4) abnormal data. Through strict data filtering and preprocessing, 13,980 samples were obtained (Figure 1). All subjects were randomly divided into development group (n = 10,485) and validation group (n = 3495) according to the ratio of 3:1. We used retinopathy as the outcome variable. Nomogram was constructed based on development group and was verified using validation group. The study was approved by the Medical Ethics Committee of the First Affiliated Hospital of Xinjiang Medical University, and written informed consent was obtained for each subject. The study was performed in accordance with the Declaration of Helsinki.
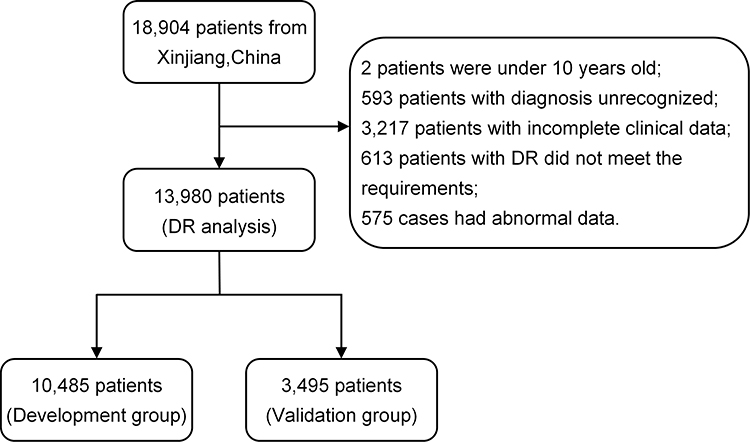 |
Figure 1 Flow diagram of the data screening. Notes: diagnosis unrecognized: Comprehensive eye examinations without mydriasis; incomplete clinical data: Delete samples missing more than 2 variables; DR did not meet the requirements: retinopathy caused by hypertension; abnormal data: data that cannot be included in the evaluation due to severe cataracts and other reasons; 76 patients in incomplete clinical data and DR did not meet the requirements were repeated. |
Information Collection
General data, gender, Age, Duration of T2DM, diabetic peripheral neuropathy, Hypertension (The diagnostic criteria for diabetic peripheral neuropathy and Hypertension was based on the Standards of medical care for type 2 diabetes in China (2010)).21
DPN, (1) Abnormal temperature perception; (2) Abnormal vibration perception; (3) Nylon filament examination, foot sensation decreased or disappeared; (4) Ankle reflex disappeared; (5) Nerve conduction velocity (NCV). If someone has two or more of the above phenomena, he/she is diagnosed as DPN;
Hypertension: blood pressure ≥140/90 mmHg or on therapy for hypertension.
Biochemical data: the patient’s fasting venous blood was drawn from the morning after admission and sent to the laboratory of our hospital for determination of white blood cell, neutrophilic granulocyte, eosinophil, lymphocyte, total cholesterol, high-density lipoprotein, low-density lipoprotein, aspartate aminotransferase, alanine aminotransferase, glucose, Hemoglobin A1c, Glycosylated Serum Protein, Apolipoprotein A1, apolipoprotein B, triglyceride, Urea.
Fundus examination, all patients were examined by ophthalmologists for vision, intraocular pressure, optometry, ophthalmoscope, and then taken mydriatic fundus photography. For those who were not clearly staged, fundus angiography was performed to determine whether there was retinopathy.21
Statistical Analysis
Firstly, we deleted 20 variables which makes no sense in this study (No sense variables included admission time, discharge time, hospitalization days, and pre-hospital inspection indicators (the inspection indicators on the second day of hospitalization were meaningful variables)). Secondly, 4924 samples that did not meet the requirements of this study were excluded. Finally, we used multivariate multiple imputation to impute missing values of 13,980 cases to maximise statistical power (Figure 1).
Statistics description, when describing the baseline characteristics, the count data were described by frequency and proportion, and chi square test was used to compare the two groups. The measurement data with normal distribution was statistically described with mean ± standard deviation, and t-test was used to compared the data between the two groups. The measurement data of skewed distribution was described by median and interquartile distance, and compared between the two groups by non-parametric test.
Establishment of nomogram model, according to the collected clinical data and research purposes, Considering that there may be multicollinearity between variables, which will cause the unstable in the estimation of regression coefficient and intercept coefficient and result in the instability of the model. Therefore, in this study, the minimum absolute contraction and lasso regression are used to select the most useful candidate predictors, as well as improve the performance of the model,22,23 and the Odds ratio (OR),95% CI and P values of each candidate were calculated to predict the possible diagnosis. Finally, both statistically significant variables and clinically significant variables were included in the multivariate logistic regression analysis, and the nomogram model was constructed using the statistically significant variables selected at last (P < 0.05).15,24,25
Effectiveness evaluation of nomogram model, the effectiveness evaluation of prediction model mainly includes discrimination ability (discrimination), accuracy (calibration curve) and clinical practicability. Discrimination and calibration are commonly used to evaluate the prediction model. Discrimination refers to the ability to distinguish high-risk and low-risk groups. AUC, also known as C statistic, is used to evaluate the discrimination, whose value is between 0.5 and 1. The closer the AUC value is to 1, the better the prediction model is.26 It is generally believed that AUC greater than 0.8 is of great diagnostic value, and the specific predictive value should be evaluated in combination with clinical practice. Meanwhile, The nomogram was subjected to bootstrapping validation (1000 bootstrap resamples) to calculate an optimism-corrected Harrell’s C statistic (C-index)19,27 in the development group and the validation group, respectively. Calibration degree is an important index to evaluate the accuracy of disease risk model in predicting the probability of individual future outcome events. Calibration degree, also called consistency, reflects whether the predicted risk is consistent with the actual risk. Akaike information criterion (AIC) and Hosmer-Lemeshow of fit test (H-L test) were also used to evaluate the consistency of the model. The smaller the AIC value is, the closer the p value of H-L test is to 1, indicating that there is no significant difference between the probability of model prediction and the probability of actual observation. Smaller AIC represents a better calibration degree of the model.28 Finally, we conducted a decision curve analysis to evaluate the clinical effectiveness of the model.29 The results showed that the proportion of true positive minus the proportion of false positive, and then weighed the relative risks of false positive and false negative results to obtain the net benefits of making decisions.
Statistical analysis and establishment of nomogram model were performed using R software (version 4.0.2).
Results
Baseline Characteristics of DR
Totally 13,980 T2DM patients were recruited in this study, including 8071 patients without DR and 5909 with DR. Table 1 depicted the baseline information. Compared with T2DM patients without DR, DR patients were older, with longer duration of T2DM and higher HbA1C. Females patients with DR had higher prevalence of DPN and hypertension than those without DR. However, indicators as EOS, Tc, HDL, LDL, GSP presented no differences between DR patients and T2DM patients without DR.
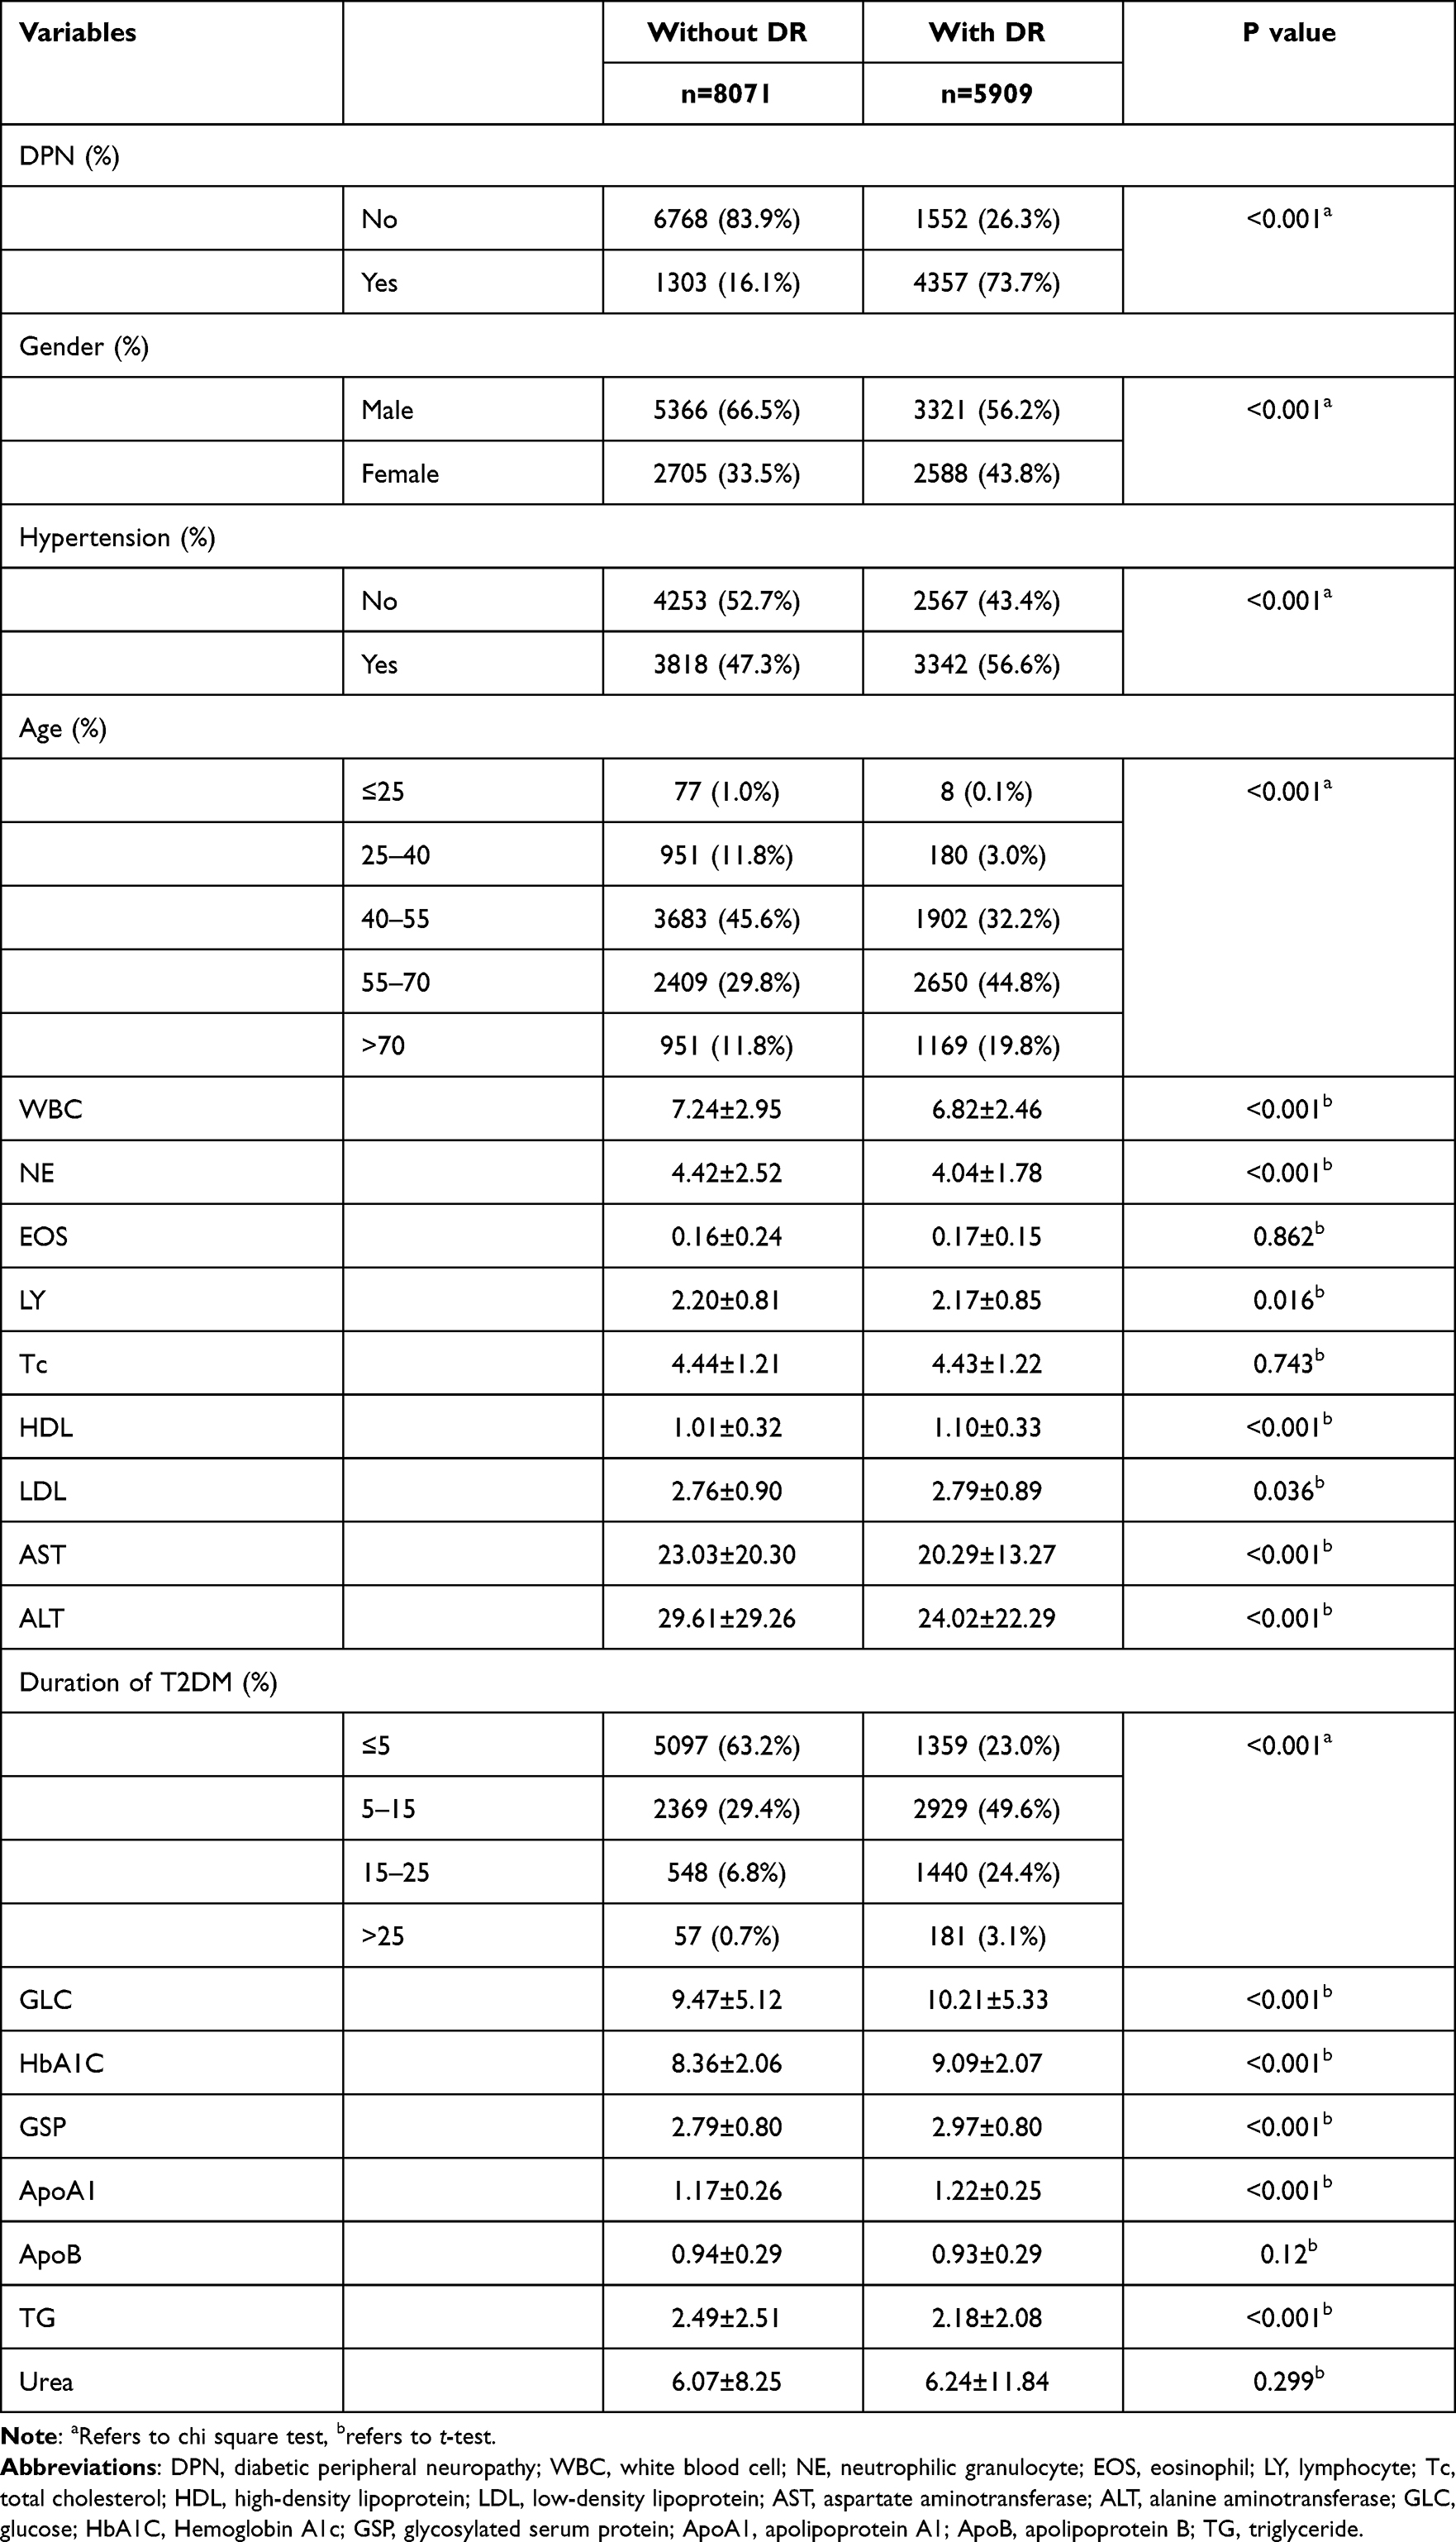 |
Table 1 Clinical Characteristics of the Study Population (N=13,980) |
Characteristics Selection
In this study, the least absolute shrinkage and selection operator (Lasso) regression was applied to the development group. With the change of the penalty coefficient λ, the variables included in the model were gradually reduced. Finally, the 10-fold cross-validation error was selected as the minimum λ+1 (lambda. 1se=0.012) as the optimal value of the model, at this time we get 8 variables (Figure 2). Then the 8 variables obtained from Lasso regression were included in the logistic multiple regression model, including DPN, Age, WBC, NE, HDL, HbA1C, Duration of T2DM and GSP (details in Table 2).
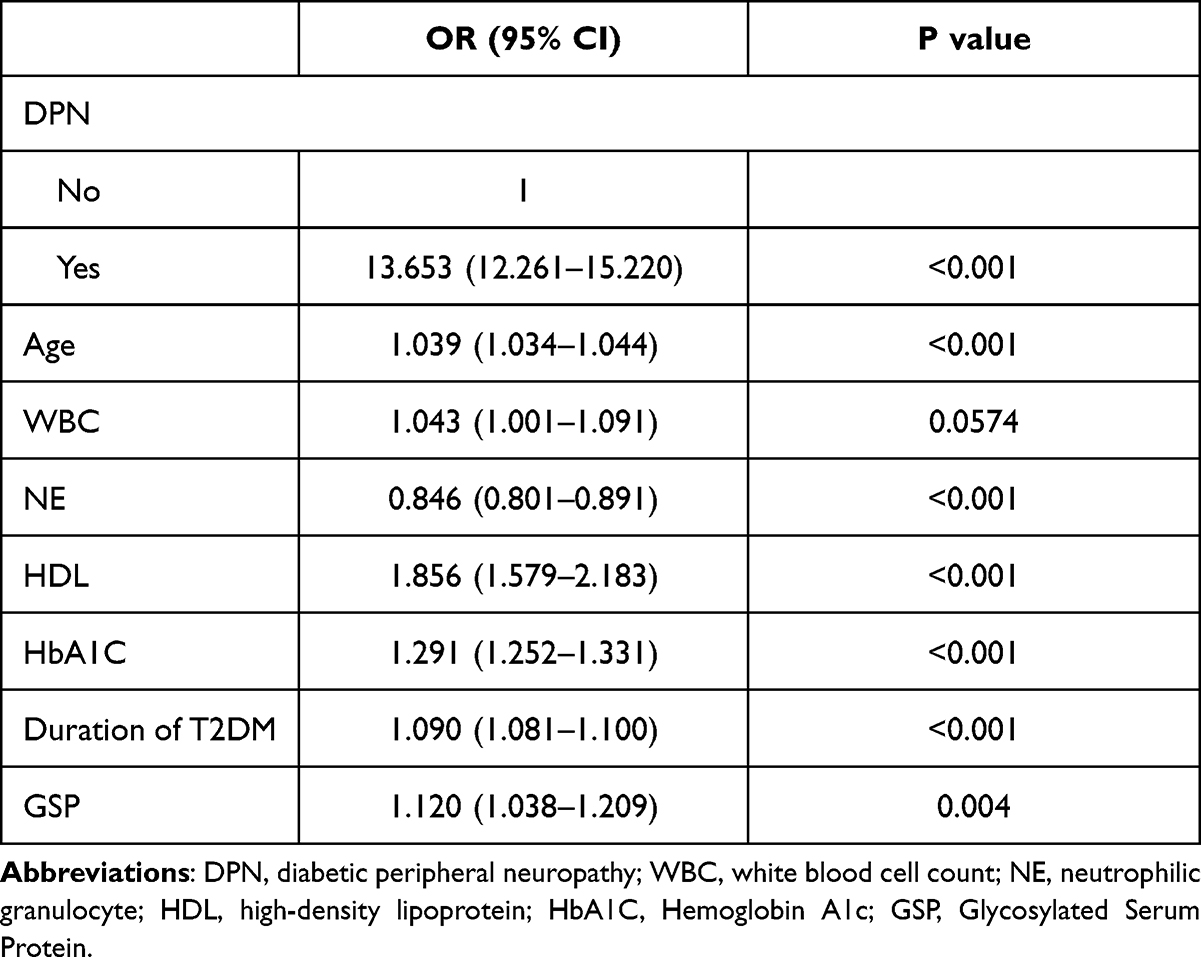 |
Table 2 Baseline Characteristics Were Analyzed by Multivariate Logistic Regression in the Training Group. (N= 10,485) |
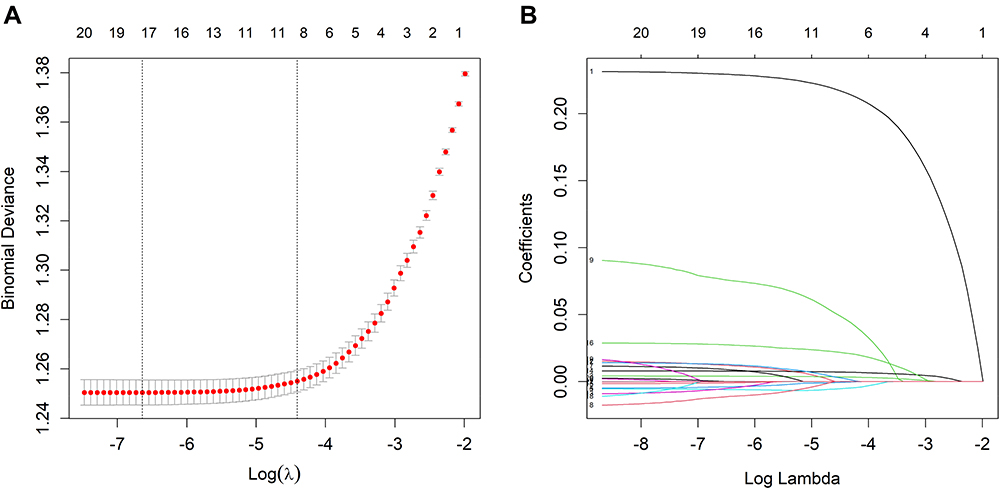 |
Figure 2 Demographic and clinical feature selection using the LASSO binary logistic regression model (figure was created by R software, “glmnet” package, version 2.0–18, https://CRAN.R-project.org/package=glmnet). Notes: (A) Optimal candidate (lambda) selection in the LASSO model used 5-fold cross validation via minimum criteria. The area under the receiver operation characteristic curve was plotted versus log (lambda). Dotted vertical lines were drawn at the optimal values by using the minimum criteria and the 1 SE of the minimum criteria; (B) LASSO coefficient pro-files of the 21 candidates. A coefficient profile plot was produced against the log (lambda) sequence. Vertical line was drawn at the value selected using 5-fold cross validation, where optimal lambda resulted in 8 candidates with nonzero coefficients. |
Candidate variables were selected by Lasso regression. Finally, the candidate predictive variables were included in multivariate logistic regression analysis. Then OR, 95% CI and P value of each candidate were calculated. Except WBC ((p>0.05), DPN, Age, NE, HDL, HbA1C, Duration of T2DM and GSP were all statistically significant (Table 2). There was no multiple collinearity among the risk factors included in the model, and the maximum variance expansion factor (VIF) was 1.395 while the lowest was 1.060. Therefore, we construct the clinical risk prediction model with these 7 statistically significant variables.
Development of a DR-Predicting Nomogram
Nomogram was established based on multiple regression (Figure 3). Each sub-type in these variables is assigned a score, DPN was 61, Age was 79, NE was 68, HDL was 57, HbA1C was 77, Duration of T2DM was 100, GSP was 27. The total score ranged from 153 to 255, and the corresponding risk rate ranged from 0.1 to 0.9. The higher the total score, the higher the risk of DR.
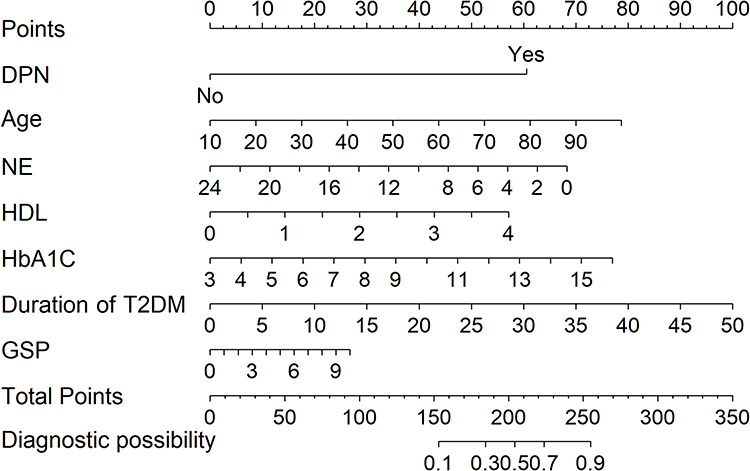 |
Figure 3 Nomogram to predict the risk of DR. Notes: To use the nomogram, an individual participants value is located on each variable axis, and a line is drawn upward to determine the number of points received for each variable value. The sum of these numbers is located on the total points axis to determine the risk of DR. |
Take an example of nomogram usage, a sample without DPN was randomly selected,47-year-old T2DM patients, the NE, HDL, HbA1C, Duration of T2DM and GSP were 3.34 mmol/L, 1.13 mmol/L,9 mmol/L, 3 years and 3.4 mmol/L, respectively. A total score of this sample is calculated to 272 (Uncorrected). Hence, the corresponding probability of DR was 12% (Figure 4A).
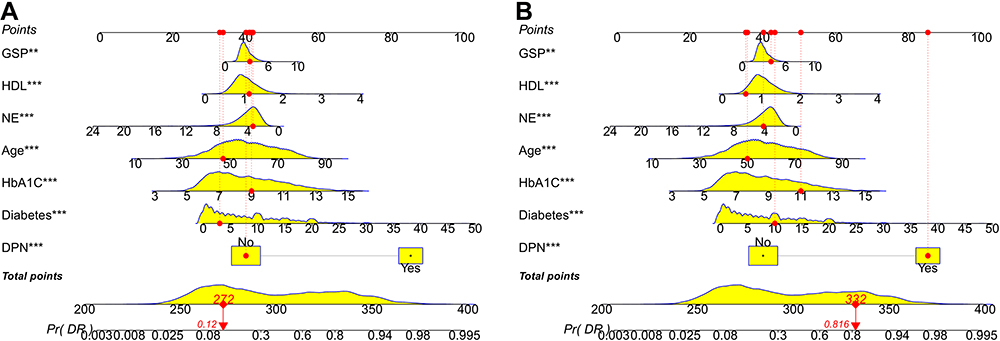 |
Figure 4 According to Nomogram’s estimate, the probability of DR risk in patient no.1020 (A) and no.2089 (B) was 0.12 and 0.816, respectively, P < 0.001. Notes: Figure a and b are the line segment dynamic nomogram, which is different from the line segment static nomogram in the paper. After optimization corrected, each variable starts with 0 (nomogram). In the line segment dynamic nomogram, it is uncorrected and reflects the score corresponding to each variable in the actual situation. Therefore, the score corresponding to each variable starts from the specific value rather than 0. Although the scores of the two are different, the prediction probability is the same. |
Another sample suffering DPN was randomly selected, 50-year-old T2DM patients, the NE, HDL, HbA1C, Duration of T2DM and GSP were 4.2 mmol/L,0.6 mmol/L,11 mmol/L,10 years and 3.96 mmol/L, respectively. A total score of this sample is 332 (Uncorrected). The corresponding probability of DR was 81.6% (Figure 4B).
Validation of Nomogram for T2DM
The model quality was evaluated from three aspects, discrimination, consistency (calibration) and clinical effectiveness. The ROC curve was drawn for the prediction effect of nomogram (Figure 5). In the development group, the AUC was 0.882 (95% CI, 0.875–0.888); according to the Youden-index (sensitivity + specificity − 1), the maximum of which was selected as the theoretical optimal diagnostic cut-off point, which was 0.528, (specificity, 0.879, sensitivity, 0.779). In the validation group, the AUC was 0.870 (95% CI, 0.856–0.881) and the theoretical optimal cut-off point was 0.487 when the Youden-index was the largest (specificity, 0.848, sensitivity: 0.804). In addition, the AUC value of the validation group was only 0.012 lower than that of the development group, indicating that the prediction model has good prediction discrimination in both groups. Meanwhile, the nomogram were subjected to bootstrap-ping validation (1000 bootstrap resamples) to calculate an optimism-corrected C-index were 0.878 and 0.867 in the development group and the validation group, respectively. In addition, in the development group and the validation group, we conducted ROC analysis to evaluate the performance of seven risk factors in DR risk prediction. As shown in Figure 5, in the prediction capacity of DR risk, the combination model is superior to the single risk factor model.
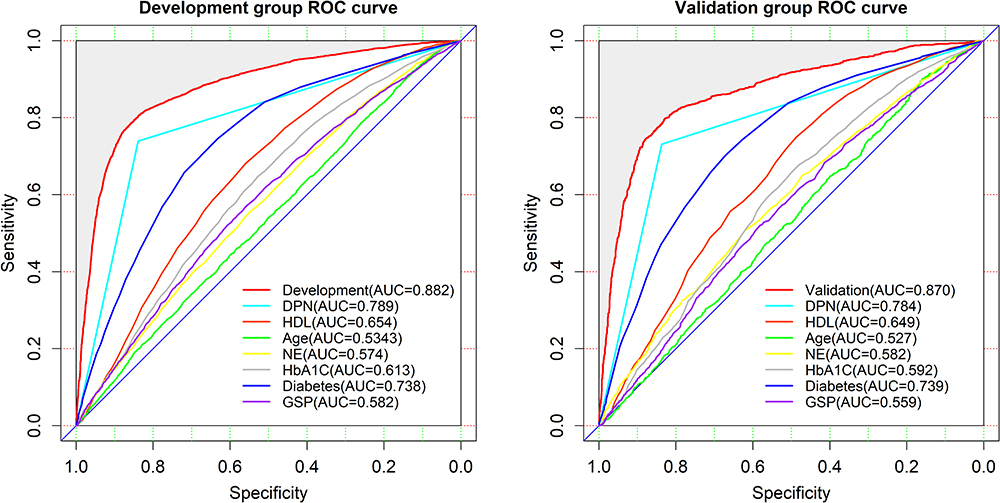 |
Figure 5 The ROC curves of the nomogram for DR risk (left, development group, right, validation group. including ROC curves of single risk factor model). Notes: In the development group, the AUCs were 0.882 (95% CI: 0.875–0.888); In the validation group, the AUCs were 0.870 (95% CI: 0.856–0.881), respectively. ROC, receiver operating characteristics curve, AUC, area under curve. |
Figure 6 depicted that in both development and validation groups, the calibration curve of nomogram model showed great consistence between the prediction values and actual values, while Hosmer-Lemeshow test showed the model was in line with observed data (P >0.05) as well.
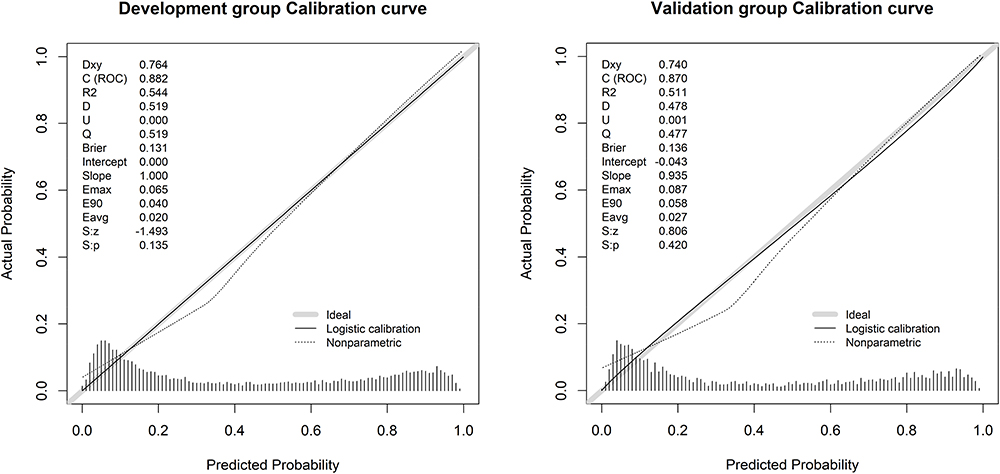 |
Figure 6 Calibration curves for the validation and development group models (left, development group, right, validation group). Notes: The diagonal dotted line represents a perfect prediction by an ideal model. The solid line represents the performance of the nomogram, of which a closer fit to the diagonal dotted line represents a better prediction. |
Results of DCA curve in development and validation groups were shown in Figure 7. The gray line represented the model. The blue line represented the net benefit when all participants had DR, while the red line represented the net benefit when no participant had DR. The area between the “red line” and “blue line” of the model curve meant the clinical validity of the model. If the gray line is above the horizontal red line and the left oblique blue line, we can think that the gray line value of this section can benefit. The DCA curve showed that using the nomogram model to predict the occurrence of DR risk had a higher net income. The nomogram model is a good assessment tool because of available selectivity threshold probability.
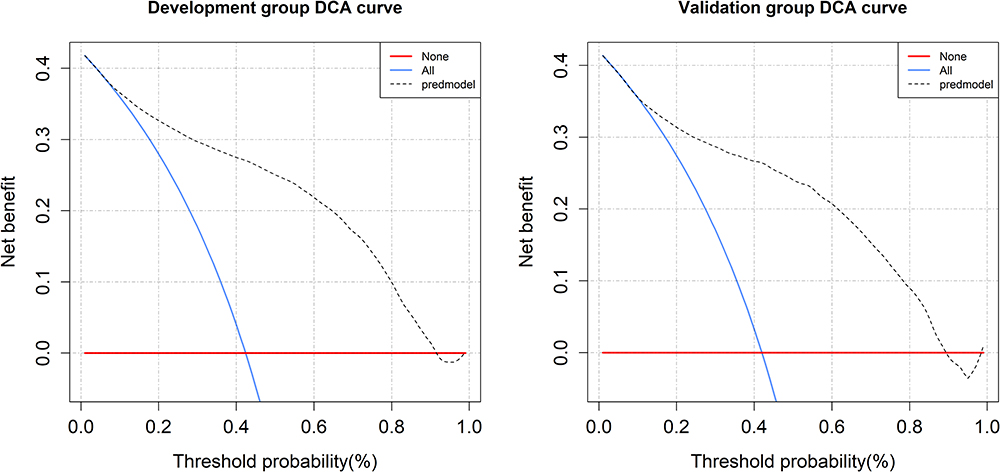 |
Figure 7 The decision curve analysis of the nomogram for DR risk (left, development group, right, validation group). Notes: The red line represents the net benefit when no participant was considered to exhibit DR, while the blue line represents the net benefit when all participants were considered to suffer from DR. The area among the model curve, “treat none line” (red line) and “treat all line” (blue line), represents the clinical usefulness of the model. The farther the model curve is to the blue and red lines, the better clinical value the nomogram holds. |
Discussion
This study is a retrospective research based on T2DM patients in Xinjiang Uygur Autonomous Region, aiming to predict the risk of DR among whom. DPN, Age, NE, HDL, HbA1C, Duration of T2DM and GSP were independent risk factors of DR. DPN, Age, HDL, HbA1C, Duration of T2DM and GSP were positively correlated with DR, having the strongest correlation with DPN, Duration of T2DM, HbA1C, while these factors were negatively correlated with NE. Original data was randomly divided into development (n=10,485) and validation (n=3495) groups. The verification results showed both of which had good risk prediction ability. Calibration chart showed that the nomogram was accurate in predicting the risk of T2DM; similarly, our decision curve analysis also proved the clinical application value of the nomogram.
DPN is one of the most common chronic complications of T2DM, which often coexists with DR in patients with T2DM. The prevalence of DPN increases with the prevalence of DR, both in parallel,30 which are consistent with the results of this study. DR and DPN are two manifestations of microvascular complications in the eye and peripheral nerves, respectively, and the pathological basis of both is related to microangiopathy, microcirculatory disorders and glucose metabolism. Both pathologies are related to microangiopathy, microcirculatory disorders and glucose metabolism disorders. The gradual thickening of the capillary basement membrane after various oxidative stresses is the common morphological basis of both.31 The strong correlation between them suggests that we should pay higher attention to DR patients in our clinical work, and we should not only pay attention to their ocular lesions, but also carefully inquire about neurological symptoms to exclude DPN, and also perform detailed ophthalmologic examinations in time for patients with autonomic dysfunction, neuralgia, limb sensory numbness and mobility disorders, so that they can be detected early and treated in time.32
Among the independent risk factors in this DR prediction model, the duration of T2DM is the factor with the greatest risk weight. Duration of T2DM is also recognized as the most important risk factor for diabetes complications. It is closely associated with the development of various macrovascular and microvascular complications of diabetes. Liu et al33 found in a 16-year cohort study of patients with T2DM that the prevalence of DR was 25% at 10 years of diabetes and increases to 50.0% at 15 years of disease progression. In the 35 epidemiological studies reported by Yau et al showed a significant increase in the prevalence of DR with increasing disease duration, with a 21.1% prevalence of DR in patients with less than 10 years of diabetes and a 76.3% prevalence of DR when the disease duration exceeded 20 years.34 The results of this study showed that the risk of developing DR in patients with diabetes mellitus of more than 15 years duration was 3.45 times higher than that in patients with disease duration less than or equal to 5 years (Table 1). As the duration of diabetes increases, the risk of DR increases significantly, which is consistent with the domestic and foreign literature.33–35 According to Calderon et al36 and Solomon,37 the blood glucose index is closely related to the severity of DR, mainly including HbA1c, HDL and GSP. The higher the HbA1C level in T2DM patients is, the higher the incidence of DR is. When HbA1C level decreased, the risk of DR also decreased, consistent with the results of the present study. In addition to glycemic indicators, some clinical studies found that earlier diabetes onset (at younger age) was associated with the occurrence of DR.38,39 Previous epidemiological studies showed an effect of age on DR. Unlike Cheung et al and Sasongko’s et al,40,41 who found a negative association between age and DR, we demonstrated that age as an independent risk factor was positively associated with DR. Older patients showed higher likelihood of DR. This difference might be explained by the fact that Cheung et al conducted their study in a Healthy population, whereas Sasongko’s study included only type 1 diabetic patients aged 12–20 years. In addition, these studies were conducted in a different ethnic group compared to our patients. Earlier it has been demonstrated42 that there were differences in retinal vascular curvature values between races.
There are several risk prediction models for DR based on different ethnic populations, and the predictors in the models vary. The main factors include age, duration of T2DM, blood pressure, urine protein, and blood glucose etc. Referring to the model developed by Liu Y et al12 the age of patients, course of disease, SBP, HbA1C, PBG and Triglyceride were incorporated into the DR risk prediction model. Results showed that the AUC was 0.661 and 0.658 for the development and validation groups, respectively (Supplementary Figure S1). Soto-Pedre et al43 developed a model based on a Spanish population to evaluate whether retinopathy endangers patients’ vision, with predictors including gender, type of diabetes, duration of diabetes, glycosylated hemoglobin, blood pressure, and grading of DR, with AUC of 0.74. Mendoza-Herrera et al44 carried out a study among a Mexican population to predict DR, with model predictors including the duration of T2DM, exercise condition, blood glucose level, systolic blood pressure, with AUC of 0.78. Cichosz et al45 constructed a risk prediction model for DR based on a white population that included glycated hemoglobin, BMI, waist circumference, age of patients, systolic blood pressure, urine protein, and urine creatinine, with AUC of 0.74. Because of the heterogeneity between races, risk prediction models based on different ethnic groups often could not be applied to the whole population and have limited predictive validity.
The capillaries of diabetic patients are more sensitive to blood glucose changes in a short period of time,46 and GSP can just reflect the average blood glucose concentration in the past 1 to 3 weeks. Studies47 have confirmed that NE played an important role in retinopathy, but there were few studies about predicting the risk of DR with GSP and NE involved. Previous studies mainly included systemic factors of diabetes and related indicators of hypertension and renal lesions, such as age, duration of T2DM, HDL, HbA1C et al. In this study, the two detection indicators of GSP and NE were incorporated into the DR risk prediction model simultaneously, finding that the area under the ROC curve of the training group was 0.882 which far exceeded the model established by Liu Y et al12 (Supplementary Figure S1). Therefore, we thought that NE and GSP played a certain role in predicting the risk of DR. However, although the data used to validate the prediction model in this study were independent of the modeling data, case selection bias might exist since the data was from the same Medical center. In the follow-up study, we plan to collaborate with other centers and use their clinical data to conduct a more extensive and in-depth external validation of the prediction model. Overall, much further work was need to build the prediction model to clinical work.
Conclusion
Diabetic retinopathy is one of the most common and serious microvascular complications of diabetes. While the clinical diagnosis of DR mainly relies on regular fundus examinations and subjective patient descriptions, once diagnosed, it is difficult to reverse. Therefore, it is necessary to search for risk factors for diabetic retinopathy. In this study, we present a nomogram model applicable to Xinjiang region in western China. With the visual visualization of nomogram model, it can help clinical workers to provide reference for the screening and early diagnosis of DR by including patient information into the risk prediction model and calculating the risk score to assess the risk of DR in patients.
Ethics Statement
The study was approved by the Medical Ethics Committee of the First Affiliated Hospital of Xinjiang Medical University (approval number, k202105-05) and followed the principles of the Declaration of Helsinki.
Author Contributions
All authors made a significant contribution to the work reported, whether that is in the conception, study design, execution, acquisition of data, analysis and interpretation, or in all these areas; took part in drafting, revising or critically reviewing the article; gave final approval of the version to be published; have agreed on the journal to which the article has been submitted; and agree to be accountable for all aspects of the work.
Funding
This study was also supported by the Natural Science Foundation of Xinjiang Uygur Autonomous Region (Grant Number, 2019D01C215).
Disclosure
The authors report no conflicts of interest in this work.
References
1. Zhu S, Triest MV, Tong M, et al. Retinal vascular tortuosity in hospitalized patients with type 2 diabetes and diabetic retinopathy in China. J Biomed Sci Eng. 2016;09:143–154. doi:10.4236/jbise.2016.910B019
2. IDF Congress. 2019, shaping the future of diabetes. Diabetes Res Clin Pract. 2019;158:107954. doi:10.1016/j.diabres.2019.107954
3. Wang JK, Ma QT, Li YQ, et al. Research progress on traditional Chinese medicine syndromes of diabetes mellitus. Biomed Pharmacother. 2019;121:109565. doi:10.1016/j.biopha.2019.109565
4. Sun P, Xu N, Li Y, et al. Destruction of the blood-retina barrier in diabetic retinopathy depends on angiotensin-converting enzyme-mediated TGF-β1/Smad signaling pathway activation. Int Immunopharmacol. 2020;85:106686. doi:10.1016/j.intimp.2020.106686
5. Zhao K, Liu J, Dong G, et al. Preliminary research on the effects and mechanisms of umbilical cord-derived mesenchymal stem cells in streptozotocin-induced diabetic retinopathy. Int J Mol Med. 2020;46(5):849–858. doi:10.3892/ijmm.2020.4708
6. Stitt AW, Curtis TM, Chen M, et al. The progress in understanding and treatment of diabetic retinopathy. Prog Retin Eye Res. 2016;51:156–186. doi:10.1016/j.preteyeres.2015.08.001
7. Knudsen LL, Lervang HH, Lundbye-Christensen S, et al. The North Jutland County diabetic Retinopathy Study, population characteristics. Br J Ophthalmol. 2006;90(11):1404–1409. doi:10.1136/bjo.2006.093393
8. Esteves JF, Kramer CK, Azevedo MJ, et al. Prevalence of diabetic retinopathy in patients with type 1 diabetes mellitus. Revista Da Associao Medica Brasilra. 2009;55(3):268–273. doi:10.1590/S0104-42302009000300017
9. Romero-Aroca P, Baget-Bernaldiz M, Fernandez-Ballart J, et al. Ten-year incidence of diabetic retinopathy and macular edema. Risk factors in a sample of people with type 1 diabetes. Diabetes Res Clin Pract. 2011;94(1):126–132. doi:10.1016/j.diabres.2011.07.004
10. Yan ZP, Ma JX. Risk factors for diabetic retinopathy in northern Chinese patients with type 2 diabetes mellitus. Int J Ophthalmol. 2016;9(8):1194–1199. doi:10.18240/ijo.2016.08.17
11. Jones CD, Greenwood RH, Misra A, et al. Incidence and progression of diabetic retinopathy during 17 years of a population-based screening program in England. Diabetes Care. 2012;35(3):592–596. doi:10.2337/dc11-0943
12. Liu Y, Yang J, Tao L, et al. Risk factors of diabetic retinopathy and sight-threatening diabetic retinopathy: across-sectional study of 13473 patients with type 2 diabetes mellitus in mainland China. BMJ Open. 2017;7(9):e016280. doi:10.1136/bmjopen-2017-016280
13. Lee R, Wong TY, Sabanayagam C. Epidemiology of diabetic retinopathy, diabetic macular edema and related vision loss. Eye Vision. 2015;2(1):17. doi:10.1186/s40662-015-0026-2
14. Zhou M, Astell-Burt T, Bi Y, et al. Geographical variation in diabetes prevalence and detection in China: multilevel spatial analysis of 98,058 adults. Diabetes Care. 2015;38(1):72–81. doi:10.2337/dc14-1100
15. Giammaria S, Vianna JR, Ohno Y, Iwase A, Chauhan BC. Nomograms for converting perimetric sensitivity from full threshold and SITA fast to SITA standard in patients with glaucoma and healthy subjects. Transl Vis Sci Technol. 2021;10(9):2. doi:10.1167/tvst.10.9.2
16. Kansara N, Landis Z, Seeger C, et al. Nittany nomogram, A method to predict refractive astigmatism after cataract surgery based on pre-operative biometry. Invest Ophthalmol Vis Sci. 2020;61(7):1678.
17. Seeger C, Kansara N, Sun A, et al. Nittany-AK calculator, A novel femtosecond laser-assisted keratotomy nomogram for the management of corneal astigmatism during cataract surgery. Invest Ophthalmol Vis Sci. 2021;62(8):955.
18. Jiang S, Fang J, Chen L, et al. Novel model predicts diabetic nephropathy in type 2 diabetes. Am J Nephrol. 2019;51(2):1–9. doi:10.1159/000505145
19. Fu R, Yang J, Wang H, et al. A nomogram for determining the disease-specific survival in invasive lobular carcinoma of the breast, A population study. Medicine. 2020;99:e22807. doi:10.1097/MD.0000000000022807
20. Xuejun L, Chunxiu G, Ying L. Characteristics and related factors of type 2 diabetes mellitus with non-alcoholic fatty liver disease in children. Chin J Diabetes Mellit. 2018;10(7):482–486.
21. Chinese Medical Association Diabetes Society. Standards of medical care for type 2 diabetes in China (2010). Chin J Front Med Sci. 2011;3(6):54–109. doi:10.3969/j.issn.1674-7372.2011.06.014
22. Mueller-Using S, Feldt T, Sarfo FS, Eberhardt KA. Factors associated with performing tuberculosis screening of HIV-positive patients in Ghana: LASSO-based predictor selection in a large public health data set. BMC Public Health. 2016;16(1):563. doi:10.1186/s12889-016-3239-y
23. Friedman JH, Hastie T, Tibshirani R. Regularization paths for generalized linear models via coordinate descent. J.Stat.Softw. 2010;33(1):1–22. doi:10.1016/j.jspi.2009.07.020
24. Iasonos A, Schrag D, Raj GV, Panageas KS. How to build and interpret a nomogram for cancer prognosis. J Clin Oncol. 2008;26(8):1364–1370. doi:10.1200/JCO.2007.12.9791
25. Silva TB, Oliveira CZ, Faria EF, et al. Development and validation of a nomogram to estimate the risk of prostate cancer in Brazil. Anticancer Res. 2015;35(5):2881–2886. doi:10.1166/jnn.2011.3547
26. Harrell FE
27. Tran PMH, Kim E, Tran LKH, et al. T1DMicro, A clinical risk calculator for type 1 diabetes related microvascular complications. Int J Environ Res Public Health. 2021;18:11094. doi:10.3390/ijerph182111094
28. Carvalho GMC, Leite TT, Libório AB. Prediction of 60-day case fatality in critically III patients receiving renal replacement therapy: external validation of a prediction model. Shock. 2017;50(2):156–161. doi:10.1097/SHK.0000000000001054
29. Fitzgerald M, Saville BR, Lewis RJ. Decision curve analysis. JAMA. 2015;313(4):409–410. doi:10.1001/jama.2015.37
30. Chang Q, Yuanbo WU. Analysis of the related risk factors of 710 type 2 diabetes in-patients with DPN. Chin J Neuroimmunol Neurol. 2015;22(5):342–346.
31. Wang Y, Chen S. The research progress of the pathogenesis and protection of diabetic retinopathy nerve injury. Chin J Ocul Fundus Dis. 2014;30(2):209–211.
32. Wei WW, Yang XF, Gu H, Liu NP. Association of diabetic retinopathy with diabetic peripheral neuropathy in type 2 diabetic patients: theBeijing Desheng Diabetic Eye Disease Study. Chin J Ophthalmol. 2017;53(7):509–513. doi:10.3760/cma.j.issn.0412-4081.2017.07.007
33. Liu YY, Wang MH, Andrew D, et al. Glycemic Exposure and blood pressure influencing progression and remission of diabetic retinopathy: a longitudinal cohort study in GoDARTS. DiabetesCare. 2013;36(12):3979–3984. doi:10.2337/dc12-2392
34. Yau JWY, Rogers SL, Kawasaki R, et al. Global prevalence and major risk factors of diabetic retinopathy. Diabetes Care. 2012;35(3):556-564. doi:10.2337/dc11-1909
35. Zhang X, Saaddine JB, Chou CF, et al. Prevalence of diabetic retinopathy in the United States, 2005–2008. JAMA. 2010;304(6):649–656. doi:10.1001/jama.2010.1111
36. Calderon GD, Juarez OH, Hernandez GE, et al. Oxidative stress and diabetic retinopathy: development and treatment. Eye. 2017;31(8):1122–1130. doi:10.1038/eye.2017.64
37. Solomon SD, Goldberg MF. ETDRS grading of diabetic retinopathy: still the gold standard? Ophthalmic Res. 2019;62(4):190–195. doi:10.1159/000501372
38. Liang C, Shi R, Zhu J, et al. Prevalence and influencing factors of diabetic retinopathy in patients with type 2 diabetes mellitus in Pudong new area of Shanghai. Chin Gen Pract. 2016;19(4):474–478.
39. Ahmed RA, Khalil SN, Ma AQ. Diabetic retinopathy and the associated risk factors in diabetes type 2 patients in Abha, SaudiArabia. J Family Community Med. 2016;23(1):18–24. doi:10.4103/2230-8229.172225
40. Cheung CY, Zheng Y, Hsu W, et al. Retinal vascular tortuosity, blood pressure, and cardiovascular risk factors. Ophthalmology. 2011;118(5):812–818. doi:10.1016/j.ophtha.2010.08.045
41. Sasongko MB, Wang JJ, Donaghue KC, et al. Alterations in retinal microvascular geometry in Young type 1 diabetes. Diabetes Care. 2010;33(6):1331–1336. doi:10.2337/dc10-0055
42. Li X, Wong WL, Cheung CY, et al. Racial differences in retinal vessel geometric characteristics: a Multiethnic Study in Healthy Asians. Invest Ophthalmol Vis Sci. 2013;54:3650–3656. doi:10.1167/iovs.12-11126
43. Soto-Pedre E, Pinies JA, Hernaez-Ortega MC. External validation of a risk assessment model to adjust the frequency of eye-screening visits in patients with diabetes mellitus. J Diabetes Complications. 2015;29(4):508–511. doi:10.1016/j.jdiacomp.2014.12.020
44. Mendoza-Herrera K, Quezada AD, Pedroza-Tobías A, et al. A diabetic retinopathy screening tool for low-income adults in Mexico. Prev Chronic Dis. 2017;14(10):E95. doi:10.5888/pcd14.170157
45. Cichosz SL, Johansen MD, Knudsen ST, et al. A classification model for predicting eye disease in newly diagnosed people with type 2 diabetes. Diabetes Res Clin Pract. 2015;108(2):210–215. doi:10.1016/j.diabres.2015.02.020
46. Dai D, Shen Y, Lu J, et al. Association between visit-to-visit variability of glycated albumin and diabetic retinopathy among patients with type 2 diabetes – a prospective cohort study. J Diabetes Complications. 2021;35:107971. doi:10.1016/j.jdiacomp.2021.107971
47. Li G, Veenstra AA, Talahalli RR, et al. Marrow-derived cells regulate the development of early diabetic retinopathy and tactile allodynia in mice. Diabetes. 2012;61(12):3294–3303. doi:10.2337/db11-1249
 © 2022 The Author(s). This work is published and licensed by Dove Medical Press Limited. The full terms of this license are available at https://www.dovepress.com/terms.php and incorporate the Creative Commons Attribution - Non Commercial (unported, v3.0) License.
By accessing the work you hereby accept the Terms. Non-commercial uses of the work are permitted without any further permission from Dove Medical Press Limited, provided the work is properly attributed. For permission for commercial use of this work, please see paragraphs 4.2 and 5 of our Terms.
© 2022 The Author(s). This work is published and licensed by Dove Medical Press Limited. The full terms of this license are available at https://www.dovepress.com/terms.php and incorporate the Creative Commons Attribution - Non Commercial (unported, v3.0) License.
By accessing the work you hereby accept the Terms. Non-commercial uses of the work are permitted without any further permission from Dove Medical Press Limited, provided the work is properly attributed. For permission for commercial use of this work, please see paragraphs 4.2 and 5 of our Terms.