")
Back to Journals » Cancer Management and Research » Volume 13
Nomogram Based on Ultrasonography and Clinical Features for Predicting Malignancy in Soft Tissue Tumors
Authors Wu M, Hu Y, Ren A, Peng X, Ma Q, Mao C, Hang J, Li A
Received 11 December 2020
Accepted for publication 9 February 2021
Published 2 March 2021 Volume 2021:13 Pages 2143—2152
DOI https://doi.org/10.2147/CMAR.S296972
Checked for plagiarism Yes
Review by Single anonymous peer review
Peer reviewer comments 4
Editor who approved publication: Dr Eileen O'Reilly
Mengjie Wu,1 Yu Hu,1 Anjing Ren,2 Xiaojing Peng,1 Qian Ma,1 Cuilian Mao,1 Jing Hang,1 Ao Li1
1Department of Ultrasound, The First Affiliated Hospital of Nanjing Medical University, Nanjing, 210029, Jiangsu, People’s Republic of China; 2Department of Oncology, The First Affiliated Hospital of Nanjing Medical University, Nanjing, 210029, Jiangsu, People’s Republic of China
Correspondence: Ao Li
The First Affiliated Hospital of Nanjing Medical University, 300, Guangzhou Road, Nanjing, 210029, Jiangsu, People’s Republic of China
Tel +86-15205159458
Email [email protected]
Purpose: The objective of this study was to establish a predictive nomogram based on ultrasound (US) and clinical features for patients with soft tissue tumors (STTs).
Patients and Methods: A total of 260 patients with STTs were enrolled in this retrospective study and were divided into a training cohort (n=200, including 110 malignant and 90 benign masses) and a validation cohort (n=60, including 30 malignant and 30 benign masses). Multivariate analysis was performed by binary logistic regression analysis to determine the significant factors predictive of malignancy. A simple nomogram was established based on these independent risk factors including US and clinical features. The predictive accuracy and discriminative ability of the nomogram were measured by the calibration curve and the concordance index (C-index).
Results: The nomogram, comprising US features (maximum diameter, margin and vascular density) and clinical features (sex, age, and duration of disease), showed a favorable performance for predicting malignancy, with a sensitivity of 88.2% and a specificity of 78.7%. The calibration curve for malignancy probability in the training cohort showed good agreement between the nomogram predictions and actual observations. The C-indexes of the training cohort and validation cohort for predicting malignancy were 0.89 (95% CI: 0.85– 0.94) and 0.83 (95% CI: 0.73– 0.94), respectively.
Conclusion: The nomogram based on US and clinical features could be a simple, intuitive and reliable tool to individually predict malignancy in patients with STTs.
Keywords: soft tissue tumors, ultrasonography, malignancy, predictive model, nomogram
Introduction
Soft tissue tumors (STTs) are fairly common and heterogeneous clinical entities.1 Their pathologic classification and nomenclature are complicated. The ratio of malignant to benign STTs has been estimated to be nearly 1:100.2 Some malignant STTs are often misdiagnosed as benign STTs owing to many overlaps in clinical and imaging manifestations among them, resulting in inadequate management, such as unplanned resections.3 To make a definite diagnosis of STTs, biopsy should be performed in suspected cases. However, routine biopsy for each entity is not practical. Thus, an optimal process for the diagnosis and management of STTs is regarded as a clinically challenging problem that needs to be addressed.
US is an imaging modality with availability, portability and low cost that has become an important complementary tool for musculoskeletal imaging.4 Patients with soft tissue masses are referred for US to confirm the exact layer, identify the boundary and margin, measure the size, estimate the vascularity and determine the relationship between the masses and surrounding tissues. With the rapid development of sonography technology, the resolution of grayscale US and the capability of color Doppler flow imaging (CDFI) to depict vascular anomalies have been greatly improved. Thus, US can provide more useful information for discerning malignant lesions from benign lesions and even for the pathological diagnoses of STTs, and it has become the first-line examination in clinical practice.5,6 To date, there have been many studies with relatively small samples addressing the accuracy of US in distinguishing benign and malignant STTs. In earlier studies, the accuracy of US for recognizing malignancy in STTs ranged from 69% to 93% by employing many US parameters, such as size, tumor margin, fascia layer, and vascular pattern.7–9
However, among the many meaningful US parameters for identifying malignancy, there is statistical inconformity in the value of each parameter. Thus, there is a great need for the development of predictive models for the differential diagnosis of benign and malignant STTs by statistically weighting the contributions of the many US parameters. And what is more, there is no unified standard or model in differentiating benign and malignant STTs similar to Thyroid Imaging Reporting And Data System (TI-RADS) or Breast Imaging Reporting And Data System (BI-RADS) which is the only point of reference in thyroid or breast imaging system.
A nomogram can give rise to a numerical probability of a clinical event, such as malignant tumor, by creating an intuitive graph of a statistical predictive model.10 It has been accepted as a reliable tool to quantify risk by incorporating and illustrating important factors for malignancy.10–12 So far, nomograms have been established in the majority of cancer types.10–13 For instance, Guo et al developed an US-based nomogram to improve the diagnostic accuracy of the identification of malignant thyroid nodules;14 Qiu et al established and validated a nomogram to predict the probability of axillary lymph node metastasis as a preoperative tool to support clinical decision-making.15 To the best of our knowledge, this study is the first attempt to develop and validate a nomogram based on US parameters as well as clinical risk factors to predict malignant STTs.
Patients and Methods
Patients and Data Acquisition
This retrospective study was carried out according to the ethical standards of the Declaration of Helsinki and was approved by the ethics committee of the First Affiliated Hospital of Nanjing Medical University. The requirement for obtaining informed consent from individual participants was waived, and the participants’ privacy and personally identifiable information were protected. From January 2018 to April 2020, a total of 429 patients with STTs who underwent both US examination and core biopsy (or open surgical biopsy) were retrospectively reviewed. All the cases came from the interventional US clinic where radiologists performed US/CEUS guided interventional procedures.
Among the 429 patients examined, 169 were excluded because the mass was too large to be evaluated by US (n=1), the histological diagnosis was known in advance (n=47) or the pathological diagnosis was unclear (n=121) in this study. Ultimately, 260 pathologically confirmed STTs were grouped into the training cohort (n=200) and validation cohort (n=60) according to the order of the examination time. A total of 200 patients, including 110 malignant and 90 benign masses diagnosed between January 1, 2018, and December 31, 2019, were included as the training cohort, and 60 patients, including 30 malignant and 30 benign masses diagnosed between January 1, 2020, and April 30, 2020, were included as the validation cohort (Figure 1). The clinical characteristics of the patients, including age, sex, duration of disease and histologic type of tumor, were obtained from the medical records.
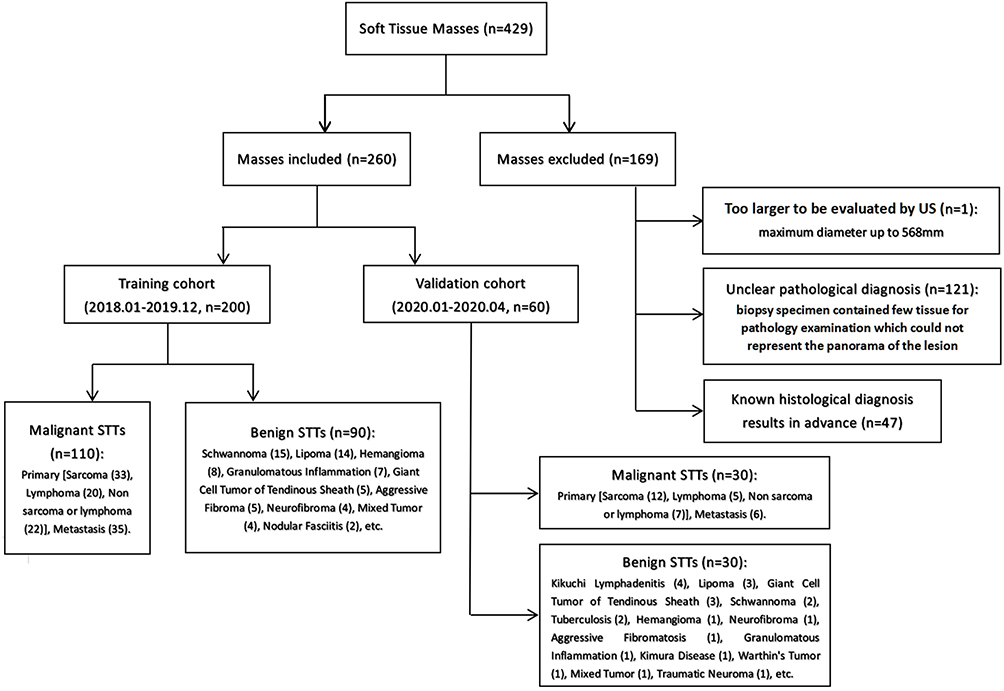 |
Figure 1 Flow diagram of the study participants. |
The malignant rate and median age of the training cohort vs validation cohort were 55.0% vs 50.0% and 55.0 years (range, 15–88 years) vs 55.5 years (range, 14–78 years), respectively, which were not significantly different. The male-to-female ratio of the training cohort and validation cohort was 1.2:1 and 1.1:1, respectively.
US Examination
All US examinations were performed by two experienced musculoskeletal radiologists. A LOGIQ E9 (GE Healthcare, Milwaukee, WI, USA) ultrasound instrument with a C1-6VN convex transducer (2–6 MHz) and ML linear transducer (6–15 MHz) was used. The ultrasound gel and light pressure on the probe for the lesion area were needed to avoid excessive compression of the mass and optimize the color flow display.
All grayscale and color Doppler flow images were reviewed by two radiologists who had 5 and 10 years of experience in musculoskeletal ultrasound. To minimize selection bias regarding diagnostic accuracy, they needed to reach an agreement on the US reports. The following characteristics were evaluated and recorded: (1) echogenicity (relative to muscle: predominantly hypoechoic, predominantly isoechoic, or predominantly hyperechoic); (2) internal content (predominantly solid (cystic portion ≤10% of the mass volume), mixed (cystic portion >10% but ≤50%), or predominantly cystic (cystic portion >50%)); (3) echotexture (homogeneous or heterogeneous); (4) shape (regular, lobulated, or irregular); (5) boundary (well defined: clear-cut and thin capsule-like; undefined: uncertain margin with respect to adjacent normal tissue; partially defined: case between the both above); (6) margin (smooth: characterized by an even, gradually curving interface; spiculate: lobulation, angulation, or intrusion of the lesion’s solid component into the surrounding tissue is present to any extent; rough: characterized by irregular and rough curving interface); (7) location (head or neck, trunk, upper limb, or lower limb); (8) layer (superficial fascia layer or deep fascia layer); (9) calcification (absent; microcalcifications: <0.5 mm; macrocalcifications: ≥0.5 mm); (10) vascular density (grade 0, I, II, or III); (11) vascular type (absent, predominantly central, predominantly peripheral, or mixed); and (12) maximum diameter. Spectral wave analysis and elastography were not routinely performed.
The lesion depth was characterized as superficial or deep relative to the investing fascia as identified on US. Superficial soft tissue masses are those that are located superficial to the investing fascia.16
Settings for CDFI are as follows: the scale level and pulse repetition frequency were decreased, the color gain was increased until color noise became apparent; radiologists adjusted the value of color gain and speed scale according to the blood flow velocity in each lesion, in order to achieve the best visual effect without overflow or interruption of blood flow signal. The pressure of the transducer on the lesion was lowered to avoid compressing the small vessels, which may cause low velocity signals to disappear.
The vascular density on CDFI was graded according to the semiquantitative method of Adler et al as follows:17 (1) grade 0, no obvious blood flow in the mass; (2) grade I, only minimal blood flow, such as 1 to 2 punctate or rod-shaped blood flows in the mass; (3) grade II, moderate vascularity, such as 3 to 4 punctate blood flows or an important blood vessel that can be detected in the mass; and (4) grade III, marked vascularity, such as more than 4 blood vessels or vessels interwoven into a network.
Biopsy
A 16-G needle was used in the US/CEUS-guided biopsy. After identifying the needle tip was in the mass, operator pulled the trigger, took 3–4 pieces of tissue and sent them to the department of pathology for examination.
Pathology Examination
The samples were submitted to the department of pathology. After being fixed in formalin, embedded in paraffin, and stained with HE, these specimens were taken for routine histopathological examination and some of them even for immunohistochemistry. All specimens were reviewed according to ESMO guidelines18 by two pathologists who were experts in sarcoma in order to confirm the diagnosis. Each case with uncertain biopsy results would be recommended for surgery.
Statistical Analysis
Descriptive statistics are shown as the median and range for continuous variables and as the number of participants for categorical variables. Continuous variables of age, duration of disease and maximum diameter of STTs were transformed into categorical variables based on cutoff values before modeling. The cutoff values were evaluated using receiver operating characteristic (ROC) analyses. Categorical variables were compared using the chi-square test. Variables that achieved significance in the univariate analysis were entered into the multivariable analysis via the binary logistic regression model.
Statistical analyses to identify independent risk factors for malignancy were performed by SPSS software, version 23.0 (IBM Corporation, Armonk, NY). A P value <0.05 was considered statistically significant.
Construction of the Nomogram
In accordance with the results of the multivariable analysis, a simple nomogram of clinical and US characteristics was established by R software (Windows version 3.6.1) with the rms package.
Calibration and Validation of the Nomogram
Calibration of the nomogram for predicting malignancy was performed by comparing the predicted probability with the observed probability after bias correction. The model performance for predicting malignancy was assessed by calculating the concordance index (C-index).19 The larger the C-index, the more accurate was the prediction.20 The value of the C-index ranges from 0.5 to 1.0, with 0.5 representing a random chance and 1.0 representing a perfect ability to correctly differentiate the outcome with the model.
Afterward, a validation cohort was used for external validation. Bootstraps with 1000 resample were used for these activities.
Results
Clinical and US Characteristics of the Patients
Overall, the distributions of the following variables in the validation cohort were basically the same as those in the training cohort, with slight differences among the 15 features: sex, age, duration of disease, maximum diameter, location, fascia layer, shape, boundary, margin, echogenicity, echotexture, internal content, calcification, vascular density and type. The details of the respective numbers with US and the clinical features of the training and validation cohorts are listed in Tables 1 and 2.
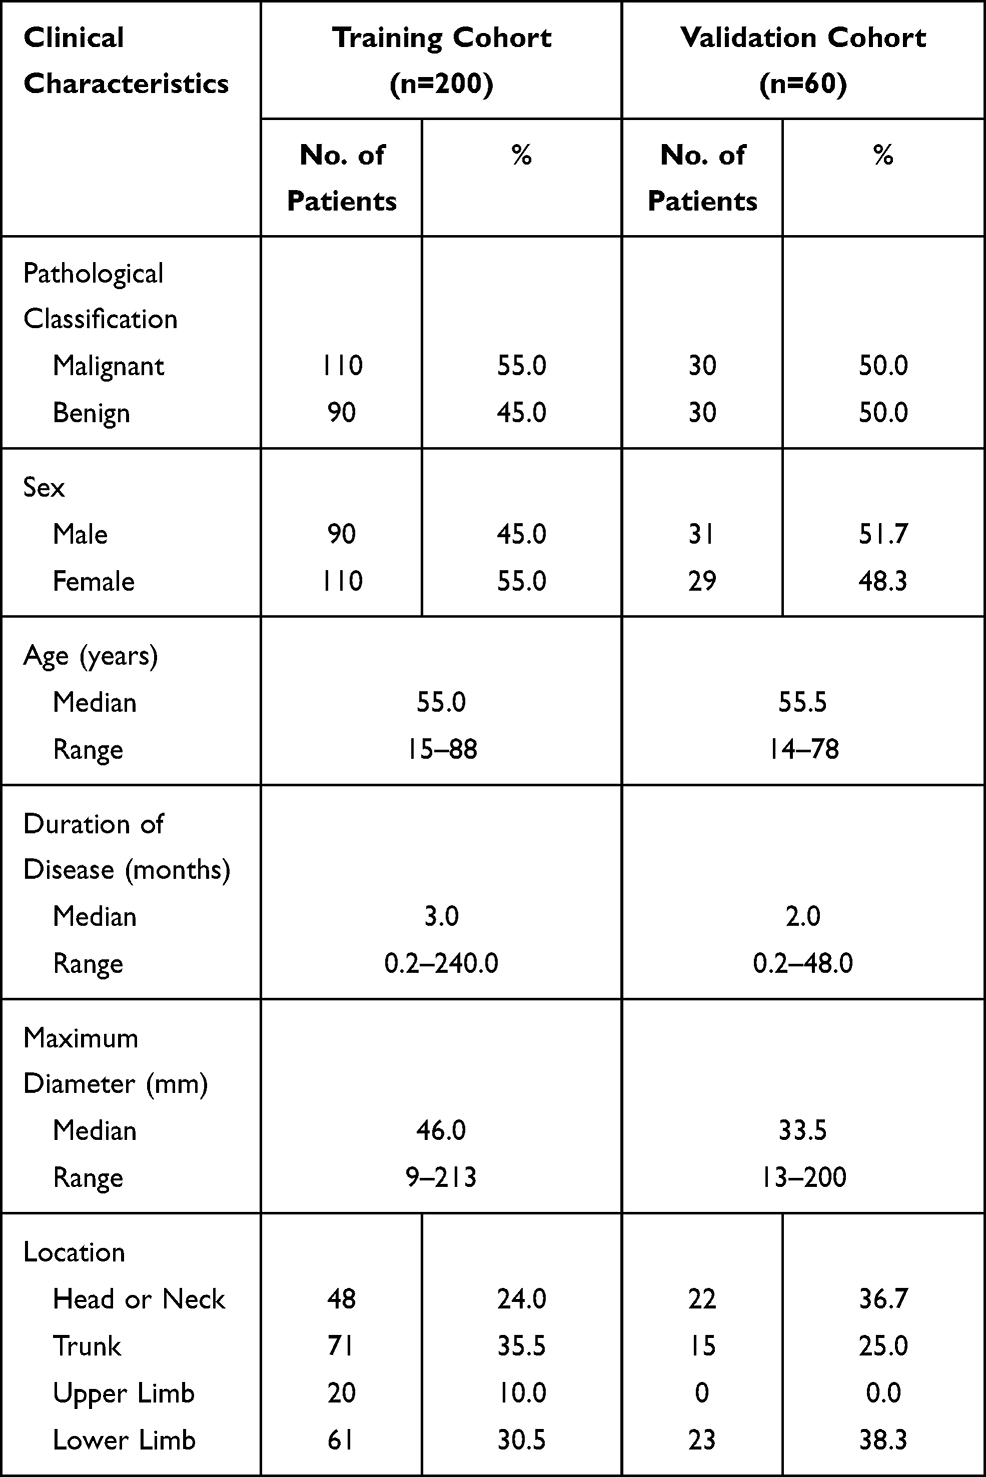 |
Table 1 Clinical Features of Patients with STTs |
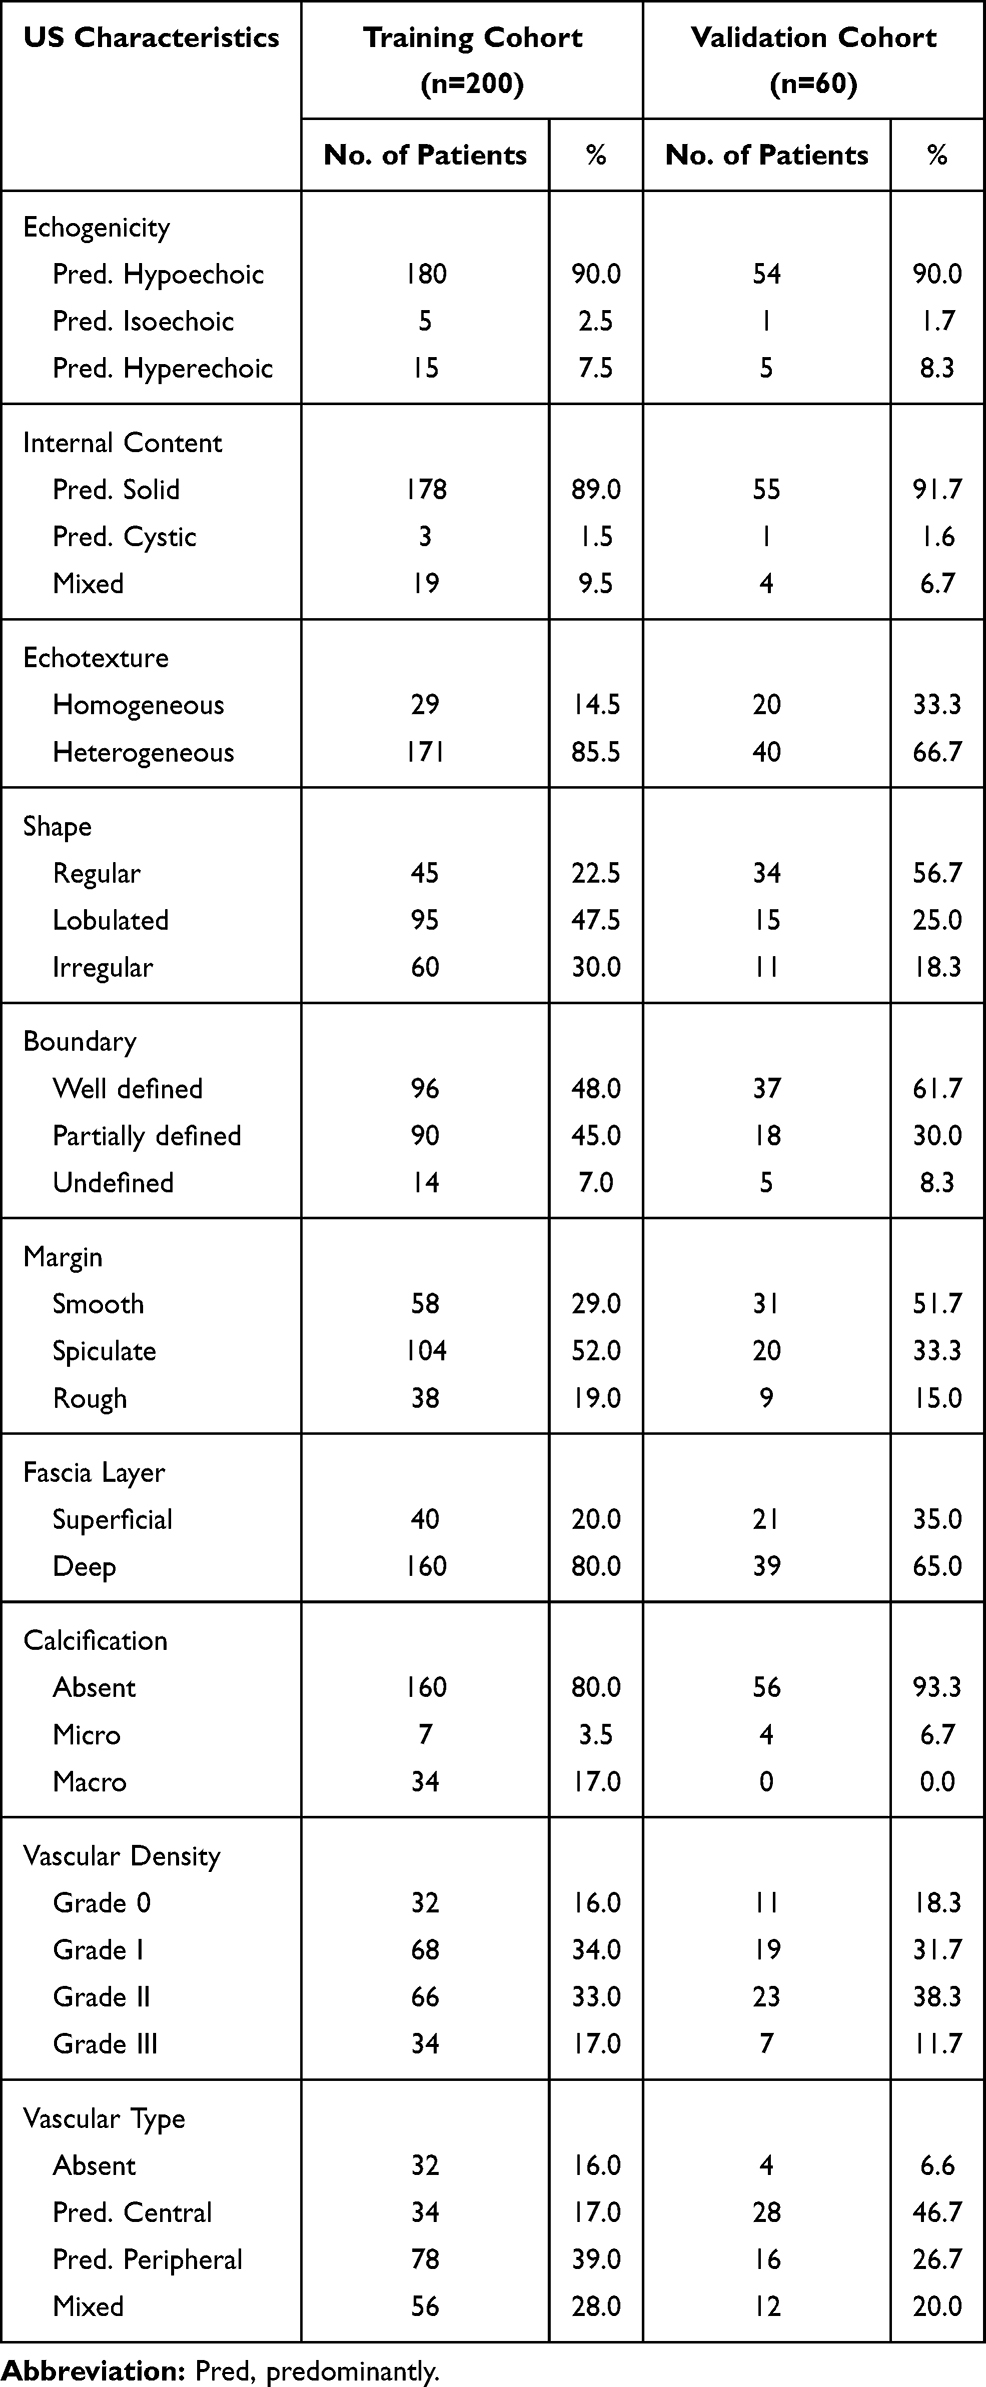 |
Table 2 US Features of Patients with STTs |
The cutoff values for age, maximum diameter and duration of disease were 62.5 years, 58.5 mm and 11 months, respectively.
Diagnostic Efficacy of Clinical Features Combined with US Parameters vs US Parameters Alone
Binary logistic regression analysis was performed for predicting malignancy in STTs based on clinical features combined with US parameters and based on US parameters alone. The forest plot showed that sex (OR=0.387, p=0.024), age (OR=4.607, p=0.002), duration of disease (OR=0.293, p=0.012), maximum diameter (OR=3.430, p=0.006), margin (OR=3.364, p=0.012), and vascular density (OR=2.849, p=0.000) were independent risk factors of malignancy prediction in STTs in the former study (Figure 2A); we re-evaluated all cases using the US parameters alone, which indicated that maximum diameter (OR=3.010, p=0.007), margin (OR=4.090, p=0.001), and vascular density (OR=2.879, p=0.000) were independent risk factors of malignancy prediction in STTs (Figure 2B).
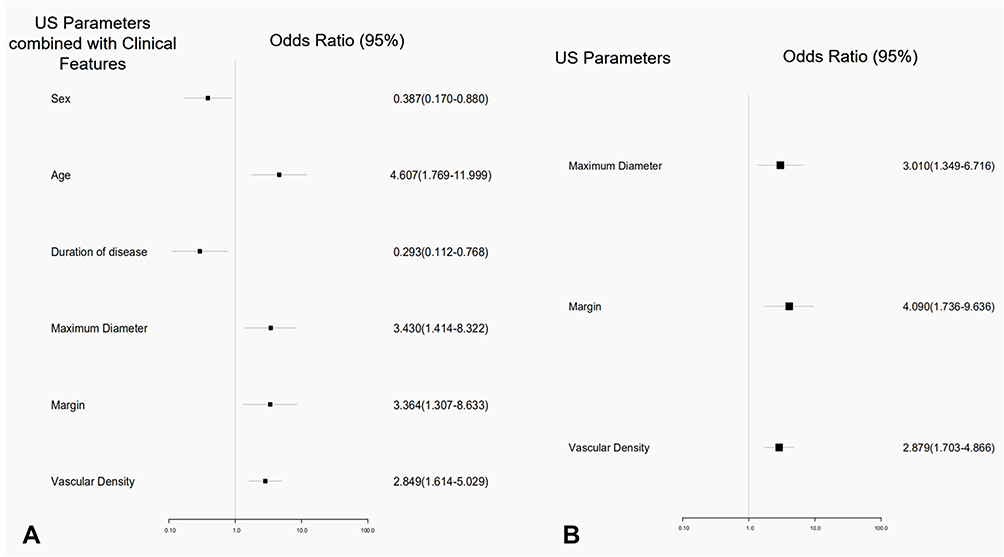 |
Figure 2 Independent risk factors for malignancy of predictive models in forest plots of multivariate analyses. (A) US parameters combined with clinical features predictive model. (B) US parameters alone predictive model. |
The ROC curves of the clinical features combined with US parameters predictive model and US parameters alone predictive model in the training cohort were plotted as shown in Figure 3, and the AUC was 0.896 (95% CI: 0.851–0.941) and 0.851 (95% CI: 0.798–0.903), respectively. This result suggested that the predictive model which clinical features combined with US parameters was more accurate and useful for determining the malignancy of STTs.
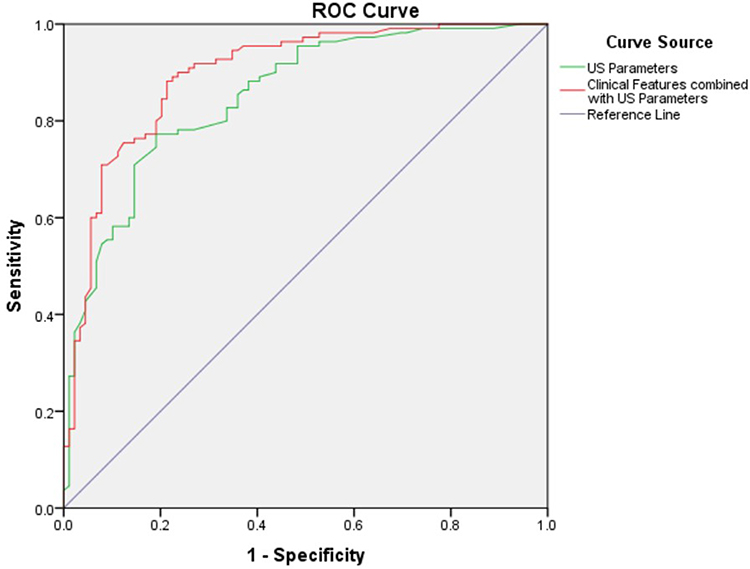 |
Figure 3 The ROC curves of the clinical features combined with US parameters predictive model (red line) and US parameters alone predictive model (green line). The AUC was 0.896 (95% CI: 0.851–0.941) and 0.851 (95% CI: 0.798–0.903), respectively. |
Establishment of the Nomogram for Malignancy
With the logistic regression analysis of the predictive model which clinical features combined with US parameters, the independent risk factors for malignant STTs were integrated into a nomogram. With this nomogram, a patient is assigned a score on the points axis for each variable. After adding the total score, the numerical value on the total points axis can be located. Then, we can draw a straight line downward to the risk axis to determine the estimated probability of malignancy (Figure 4).
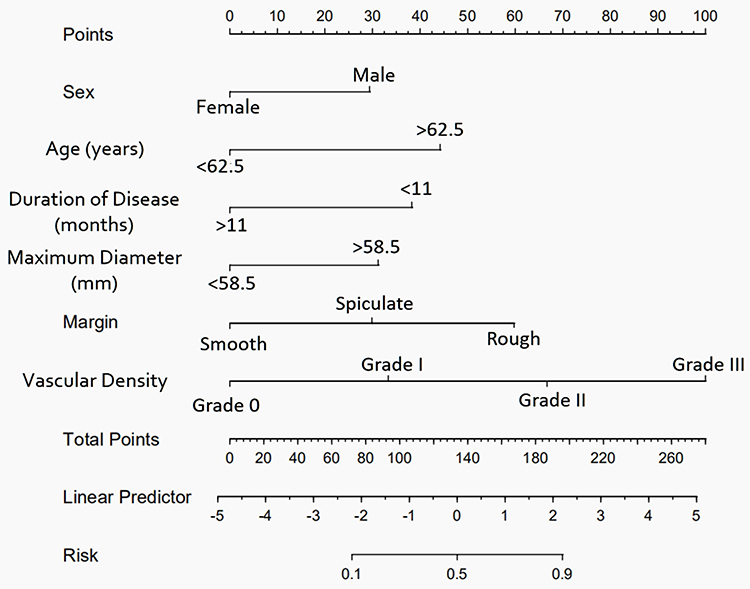 |
Figure 4 The nomogram of the predictive model for malignancy in patients with STTs. To use this nomogram, an individual patient’s value is located on each variable axis, and a line is drawn upward to determine the number of points received for each variable value. The sum of these numbers is located on the total points axis, and a line is drawn downward to the Risk axis to determine the likelihood of malignancy. |
Calibration and Validation of the Nomogram
The calibration curves displayed excellent agreement between the prediction and actual observation in the training cohort (Figure 5A) and acceptable agreement in the validation cohort (Figure 5B).
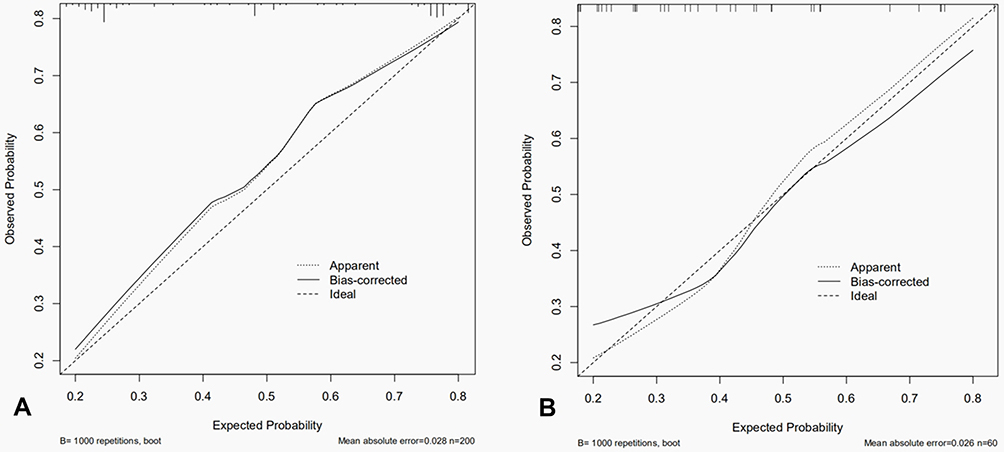 |
Figure 5 The calibration curve of the nomogram for predicting malignancy. (A) Training cohort. (B) Validation cohort. The nomogram prediction of malignancy is plotted on the X-axis, and the actual observation is plotted on the Y-axis. Solid and dotted lines in calibration curves correspond to calibrating-predictive (bias-corrected) and predictive (apparent) values. Dashed lines correspond to standard (ideal) values. |
The C-index of the established nomogram for malignancy prediction was 0.89 (95% CI: 0.85–0.94) in the training cohort and 0.83 (95% CI: 0.73–0.94) in the validation cohort.
Typical Examples of US Presentations of Benign and Malignant STTs (see Figures S1 and S2).
Discussion
The pathological classification of STTs is complex, and the imaging manifestations vary, which makes qualitative diagnosis especially difficult. Many physicians consider core biopsy to be a simple, low-risk procedure with a diagnostic accuracy ranging from 80.7% to 96.9% for STTs.21,22 Some specialists even suggest that biopsy should be performed promptly in patients with a high risk of malignancy.23,24 However, conducting biopsy examination in each patient is not practical, and it may induce some complications. Thus, how to screen high-risk patients for biopsy with a simple method is still a serious problem that needs to be solved.
US has a good resolution with soft tissues and can provide information on lesion size, location and depth, as well as the relationship of the lesion with surrounding tissues. In recent years, with the wide application of US in STTs and prolific experience accumulated by doctors, the diagnostic accuracy of US in the assessment of STTs has been significantly improved.8,25 To the best of our knowledge, despite several formerly reported predictive models for malignant STTs according to US findings, no nomogram based on US features has been established. Thus, in this work, we developed a simple and intuitive nomogram integrating US and clinical characteristics to predict the malignant rate of patients with STTs. This predictive model contained more cases and fewer variables, so it is reliable, easy to carry out and generalizable and has a relatively high accuracy. We expect the nomogram to be able to make individualized predictions of the malignant rate, screen out more patients with malignancy, reduce unnecessary biopsies and help patients and surgeons make better decisions in the clinical diagnosis and treatment process.
The training cohort and validation cohort were obtained from the interventional US clinic. These patients who came here for consultation were generally the cases that had been discussed beforehand in orthopaedic clinic or general surgery clinic by the surgeons but had no preliminary diagnosis, which represented the complexity of the cases. If the possibility of malignancy could not be completely ruled out either by two or more radiologists with more than five years of working experience in our interventional US clinic, then the patients should be recommended to perform biopsy or surgery and they were always well prepared in the mind to undergo them.
Figure 3 indicates that the predictive model in which clinical features combined with US parameters is more useful for determining the malignancy of STTs, and the diagnostic efficacy has improved by combining clinical factors. So we established a nomogram using the clinical features combined with US parameters in this study.
The nomogram showed that the independent risk factors for malignant STTs included vascular density, margin, maximum diameter, duration of disease, age and sex. The vast majority of these findings were generally similar to those of previous studies,7,25,26 which reported risk factors including rough margin, maximum diameter, deep fascial layer, heterogeneous echotexture, and abundant vascularization.
Notably, from this nomogram, we could see that Grade III vascular density made the largest contribution to the malignancy prediction, followed by rough margin. Nagano et al27 found that when type III (hypervascular with multiple peripheral poles) and type IV (hypervascular with internal vessels) vascularity of Giovagnorio’s criteria28 were taken as markers of malignancy, the specificity reached up to 91.0%. Morii et al25 also reported that type III/IV vascularity (Giovagnorio’s criteria) was associated with a high risk of malignant STTs. In our study, grade II/III vascular density with the Adler criteria was significantly associated with malignancy. Nagano and Morii classified the intratumoural blood flow according to Giovagnorio’s criteria, while in our study, the Adler criteria were applied. The former criteria include vascular density and vascular type, while the latter only includes vascular density. In terms of vascular density, type III/IV of Giovagnorio’s criteria are the same as grade II/III of the Adler criteria.
For the margin of the tumor, we agreed with Morii et al25 and Oebisu et al7 who suggested that an ill-defined margin of STT was considered malignant.
In this nomogram, malignant STTs showed obvious male predominance, which was consistent with the findings of De Marchi et al.26 Largest diameter of the tumor ≥50 mm is a universally used parameter for malignant STTs.7,18,29 Our results also supported this view and obtained a cutoff point of 58.5 mm.
The parameter of deep fascia layer has been frequently mentioned for predicting malignancy in STTs.29–31 Previous studies such as those of Datir et al32 and Alexander et al33 showed that the percentage of malignant STTs in the superficial fascia layer was only 19.0% and 3.7%, respectively. However, the layer was not incorporated into this nomogram. De Marchi et al also found that malignant STTs had no correlation with deep fascia layer.29 To determine the reason, we analyzed the final pathological results of benign STTs (Figure 1) and found that in the top five common diseases (ie, schwannoma, lipoma, hemangioma, granulomatous inflammation, and giant cell tumor of tendon sheath), 75.5% (37/49) were located in the deep fascia layer. Therefore, it seemed to be related to the background of sample selection.
Nomogram validation is essential to avoid overfitting of the model and determine its generalizability.34 The calibration curves of this study show that the nomogram prediction is consistent with the actual observation for malignant STTs, which indicates the repeatability and reliability of the established nomogram. The discrimination was revealed and the prediction was supported by the significantly high C-index of the established nomogram in the training cohort (0.89, 95% CI: 0.85–0.94); in the external validation cohort, the discriminative ability was slightly reduced with the C-index of 0.83 (95% CI: 0.73–0.94). We speculate that the sample size could be the main contributor to this difference; another reason might be that some different pathological types of STTs were included in the validation cohort, whereas such types were not included in the training cohort.
Nevertheless, there are several limitations in this study. First, the heterogeneity of STTs is the main reason, and various patients with benign lesions may be missed because they might not like to undergo core biopsy or open surgical biopsy. Second, the nomogram does not incorporate other US variables, such as blood flow velocity, resistance index, elastography, CEUS, and so on. Last, the US reporting criteria of this study only represent the local level, and the nomogram has not been tested in samples from other regions, so its authenticity and true effectiveness need more verification. Further efforts on multicenter, prospective data collection and patient follow-up, wider geographic recruitment, and the incorporation of more clinical and US factors are needed in the future.
Conclusion
US features (maximum diameter, margin and vascular density) and clinical features (sex, age, duration of disease) were independent risk factors for malignant STTs. This nomogram based on these US and clinical characteristics has good accuracy in predicting the malignant rate of individual patients with STT, and it is worthy of being developed and generalized.
Acknowledgments
We would like to thank Dr. Yuanyi Zheng for serving as readers for our study. This work was supported by the National Natural Science Foundation of China [grant number 81401427].
Disclosure
The authors report no conflicts of interest in this work.
References
1. Chiou HJ, Chou YH, Chiu SY, et al. Differentiation of benign and malignant superficial soft-tissue masses using grayscale and color doppler ultrasonography. J Chin Med Assoc. 2009;72(6):307–315. doi:10.1016/S1726-4901(09)70377-6
2. Jo VY, Doyle LA. Refinements in sarcoma classification in the current 2013 World Health Organization classification of tumours of soft tissue and bone. Surg Oncol Clin North Am. 2016;25:621–643. doi:10.1016/j.soc.2016.05.001
3. Morii T, Aoyagi T, Tajima T, Yoshiyama A, Ichimura S, Mochizuki K. Unplanned resection of a soft tissue sarcoma: clinical characteristics and impact on oncological and functional outcomes. J Orthop Sci. 2015;20(2):373–379. doi:10.1007/s00776-014-0689-x
4. Nazarian LN, Top T. 10 reasons musculoskeletal sonography is an important complementary or alternative technique to MRI. Am J Roentgenol. 2008;190:1621–1626. doi:10.2214/AJR.07.3385
5. McNally EG. The development and clinical applications of musculoskeletal ultrasound. Skeletal Radiol. 2011;40(9):1223–1231. doi:10.1007/s00256-011-1220-5
6. Badea R, Crian M, Lupor M, Fodor L. Diagnosis and characterization of cutaneous tumors using combined ultrasonographic procedures (conventional and high resolution ultrasonography). Med Ultrason. 2010;12(4):317–322.
7. Oebisu N, Hoshi M, Ieguchi M, et al. Contrast-enhanced color Doppler ultrasonography increases diagnostic accuracy for soft tissue tumors. Oncol Rep. 2014;32(4):1654–1660. doi:10.3892/or.2014.3378
8. Hung EHY, Griffith JF, Yip SWY, et al. Accuracy of ultrasound in the characterization of superficial soft tissue tumors: a prospective study. Skeletal Radiol. 2020;49(6):883–892. doi:10.1007/s00256-019-03365-z
9. Ozturk M, Selcuk MB, Polat AV, Ozbalci AB, Baris YS. The diagnostic value of ultrasound and shear wave elastography in the differentiation of benign and malignant soft tissue tumors. Skeletal Radiol. 2020;49(11):1795–1805. doi:10.1007/s00256-020-03492-y
10. Jung W, Park T, Kim Y, et al. Validation of a nomogram to predict the risk of cancer in patients with intraductal papillary mucinous neoplasm and main duct dilatation of 10 mm or less. Br J Surg. 2019;106(13):1829–1836. doi:10.1002/bjs.11293
11. Zheng H, Tang H, Wang H, et al. Nomogram to predict lymph node metastasis in patients with early oesophageal squamous cell carcinoma. Br J Surg. 2018;105(11):1464–1470. doi:10.1002/bjs.10882
12. Chen L, Zhang JX, Meng LC, Lai YS, Huang WY. A new ultrasound nomogram for differentiating benign and malignant thyroid nodules. Clin Endocrinol (Oxf). 2019;90(2):351–359. doi:10.1111/cen.13898
13. Wang HL, Lai JG, Li J, et al. Does establishing a preoperative nomogram including ultrasonographic findings help predict the likelihood of malignancy in patients with microcalcifications? Cancer Imaging. 2019;19(1):46. doi:10.1186/s40644-019-0229-1
14. Guo BL, Ouyang FS, Ouyang LZ, et al. Development and validation of an ultrasound-based nomogram to improve the diagnostic accuracy for malignant thyroid nodules. Eur Radiol. 2019;29(3):1518–1526. doi:10.1007/s00330-018-5715-5
15. Qiu SQ, Zeng HC, Zhang F, et al. A nomogram to predict the probability of axillary lymph node metastasis in early breast cancer patients with positive axillary ultrasound. Sci Rep. 2016;6:21196. doi:10.1038/srep21196
16. Taljanovic MS, Gimber LH, Klauser AS, Porrino JA, Chadaz TS, Omar IM. Ultrasound in the evaluation of musculoskeletal soft-tissue masses. Semin Roentgenol. 2017;52(4):241–254. doi:10.1053/j.ro.2017.08.002
17. Adler DD, Carson PL, Rubin JM, Quinn-Reid D. Doppler ultrasound color flow imaging in the study of breast cancer: preliminary findings. Ultrasound Med Biol. 1990;16(6):553–559. doi:10.1016/0301-5629(90)90020-d
18. Casali PG, Jost L, Sleijfer S, Verweij J, Blay JY. Soft tissue sarcomas: ESMO clinical recommendations for diagnosis, treatment and follow-up. Ann Oncol. 2009;20(4):132–136. doi:10.1093/annonc/mdp153
19. Frank E, Harrell JR. Regression Modeling Strategies: With Applications to Linear Models, Logistic Regression, and Survival Analysis. New York: Springer; 2001.
20. Huitzil-Melendez FD, Capanu M, O’Reilly EM, et al. Advanced hepatocellular carcinoma: which staging systems best predict prognosis? J Clin Oncol. 2010;28:2889–2895. doi:10.1200/JCO.2009.25.9895
21. Kasraeian S, Allison DC, Ahlmann ER, Fedenko AN, Menendez LR. A comparison of fine-needle aspiration, core biopsy, and surgical biopsy in the diagnosis of extremity soft tissue masses. Clin Orthop Relat Res. 2010;468(11):2992–3002. doi:10.1007/s11999-010-1401-x
22. Colletti SM, Tranesh GA, Whetsell CR, Chambers LN, Nassar A. High diagnostic accuracy of core needle biopsy of soft tissue tumors: an institutional experience. Diagn Cytopathol. 2016;44(4):291–298. doi:10.1002/dc.23440
23. Endo M, Setsu N, Fujiwara T, et al. Diagnosis and management of subcutaneous soft tissue sarcoma. Curr Treat Options Oncol. 2019;20(7):54. doi:10.1007/s11864-019-0656-z
24. Casali PG, Abecassis N, Aro HT, et al. Soft tissue and visceral sarcomas: ESMO-EURACAN clinical practice guidelines for diagnosis, treatment and follow-up. Ann Oncol. 2018;29:51–67. doi:10.1093/annonc/mdy096
25. Morii T, Kishino T, Shimamori N, et al. Differential diagnosis between benign and malignant soft tissue tumors utilizing ultrasound parameters. J Med Ultrason. 2018;45(1):113–119. doi:10.1007/s10396-017-0796-3
26. De Marchi A, Prever EBD, Cavallo F, et al. Perfusion pattern and time of vascularisation with CEUS increase accuracy in differentiating between benign and malignant tumours in 216 musculoskeletal soft tissue masses. Eur J Radiol. 2015;84:142–150. doi:10.1016/j.ejrad.2014.10.002
27. Nagano S, Yahiro Y, Yokouchi M, et al. Doppler ultrasound for diagnosis of soft tissue sarcoma: efficacy of ultrasound-based screening score. Radiol Oncol. 2015;49(2):135–140. doi:10.1515/raon-2015-0011
28. Giovagnorio F, Andreoli C, De Cicco ML. Color Doppler sonography of focal lesions of the skin and subcutaneous tissue. J Ultrasound Med. 1999;18(2):89–93. doi:10.7863/jum.1999.18.2.89
29. Grimer R, Judson I, Peake D, Seddon B. Guidelines for the management of soft tissue sarcomas. Sarcoma. 2010;2010:506182. doi:10.1155/2010/506182
30. Rimondi E, Benassi MS, Bazzocchi A, et al. Translational research in diagnosis and management of soft tissue tumours. Cancer Imaging. 2016;16(1):13. doi:10.1186/s40644-016-0071-7
31. Cutts FA, Piana R. The management of soft tissue sarcomas. Rev Surg. 2012;10(1):25–32.
32. Datir A, James S, Ali K, Lee J, Ahmad M, Saifuddin A. MRI of soft-tissue masses: the relationship between lesion size, depth, and diagnosis. Clin Radiol. 2008;63(4):373–380. doi:10.1016/j.crad.2007.08.016
33. Alexander L, Siegfried P, Michaela P, Djurdjevic T, Gruber H. Perfusion pattern of musculoskeletal masses using contrast-enhanced ultrasound: a helpful tool for characterisation? Eur Radiol. 2012;22(8):1803–1811. doi:10.1007/s00330-012-2407-4
34. Iasonos A, Schrag D, Raj GV, Panageas KS. How to build and interpret a nomogram for cancer prognosis. J Clin Oncol. 2008;26(8):1364–1370. doi:10.1200/JCO.2007.12.9791
 © 2021 The Author(s). This work is published and licensed by Dove Medical Press Limited. The full terms of this license are available at https://www.dovepress.com/terms.php and incorporate the Creative Commons Attribution - Non Commercial (unported, v3.0) License.
By accessing the work you hereby accept the Terms. Non-commercial uses of the work are permitted without any further permission from Dove Medical Press Limited, provided the work is properly attributed. For permission for commercial use of this work, please see paragraphs 4.2 and 5 of our Terms.
© 2021 The Author(s). This work is published and licensed by Dove Medical Press Limited. The full terms of this license are available at https://www.dovepress.com/terms.php and incorporate the Creative Commons Attribution - Non Commercial (unported, v3.0) License.
By accessing the work you hereby accept the Terms. Non-commercial uses of the work are permitted without any further permission from Dove Medical Press Limited, provided the work is properly attributed. For permission for commercial use of this work, please see paragraphs 4.2 and 5 of our Terms.