")
Back to Journals » Cancer Management and Research » Volume 13
No Detection of Pseudocapsule of Tumor-Parenchyma Interface on Multidetector Computed Tomography (MDCT) Images: Clinical Significance and Histological Reflections in Renal Cell Carcinoma
Authors Xi W, Tan Q, Hou Y, Hu X, Wang H, Liu L, Xia Y, Bai Q, Wang J, Zhou J, Guo J
Received 22 April 2021
Accepted for publication 7 June 2021
Published 6 July 2021 Volume 2021:13 Pages 5403—5411
DOI https://doi.org/10.2147/CMAR.S315379
Checked for plagiarism Yes
Review by Single anonymous peer review
Peer reviewer comments 2
Editor who approved publication: Dr Sanjeev K. Srivastava
Wei Xi,1,* Qinxuan Tan,2,* Yingyong Hou,3,* Xiaoyi Hu,1 Hang Wang,1 Li Liu,1 Yu Xia,1 Qi Bai,1 Jiajun Wang,1 Jianjun Zhou,2 Jianming Guo1
1Department of Urology, Zhongshan Hospital, Fudan University, Shanghai, 200032, People’s Republic of China; 2Department of Radiology, Zhongshan Hospital, Fudan University, Shanghai, 200032, People’s Republic of China; 3Department of Pathology, Zhongshan Hospital, Fudan University, Shanghai, 200032, People’s Republic of China
*These authors contributed equally to this work
Correspondence: Jianming Guo
Department of Urology, Zhongshan Hospital, Fudan University, Shanghai, 200032, People’s Republic of China
Email [email protected]
Jianjun Zhou
Department of Radiology, Zhongshan Hospital, Fudan University, Shanghai, 200032, People’s Republic of China
Email [email protected]
Objective: Pseudocapsule (PS) of tumor-parenchyma interface (TPI) can be detected by MDCT (ctPS) in renal cell carcinoma (RCC) with exceptions. We aim to study the prognostic implications and histological reflections of no detection of ctPS in RCC.
Patients and Methods: A total of 210 RCC patients who had MDCT examination and received nephrectomy in our institution were included in the analysis. Absence or presence of ctPS was recognized, and its associations with overall survival (OS) and progression-free survival (PFS), pathological PS (pPS) and vasculature were studied.
Results: A total of 172 (81.9%) patients were recognized to have a ctPS and 38 (18.1%) had no detection of it. They had comparable histology, stage, grade, and necrosis. Patients without a ctPS had significantly shortened overall survival (OS, p = 0.001) and progression-free survival (PFS, p < 0.001), the significance of which persisted in multivariable analysis (OS, HR 3.104, p = 0.003; PFS, HR 3.313, p = 0.001). Nearly all tumors (34/38, 89.4%) without a ctPS actually had a pPS being detected and incompleteness of pPS was also irrelevant (p = 0.739). Compared with ctPS presence, those without a ctPS had significantly thinned pPS (0.36 vs 0.43 mm, p = 0.005). In clear-cell histology, those without a ctPS also contained increased vascular density and cross-sectional area of vessels with long diameter ≥ 200 um in the pPS layer (p = 0.005 and 0.011) and increased vascular density in the 500 um layer outside pPS (p = 0.017).
Conclusion: Absence of ctPS on MDCT significantly increases the risk of adverse clinical outcome in RCC. It is the reflection of a thinner pPS and enriched vasculature of TPI rather than absence of pPS itself.
Keywords: renal cancer, pseudocapsule, MDCT, prognosis, histological reflection
Introduction
Encapsulation is a characteristic feature in renal cell carcinoma (RCC). It is commonly considered to be a result of expansive growth of tumor. In most cases, compressed fibers together with renal capsule form the outer part of encapsulation, whose relationship with tumor defines cancer stage. The inner part, pseudocapsule (PS) of the tumor-parenchyma interface (TPI) was more focused on the surgical significance since it contributes to complete resection of tumors in surgery.1 However, approximately 0–18% of renal tumors manifested without a pathological PS (pPS).2–5 They not only had increased risk of tumor injury during operation,6 but also experienced unfavorable prognosis.7 Recognizing pPS preoperatively could give hints to surgical modalities.
Computed tomography (CT) is the most used examination in preoperative evaluation of renal cancers. It is useful in detecting perirenal or sinus fat extension, venous involvement and so on. But PS on CT (ctPS) has caused little attention in the literature with controversial conclusions. Yamasshita et al.8 in an early study found that CT was insufficient in detecting PS. On the contrary, Tsili et al.9 recently found that 31% (9/29) of RCC did not have a ctPS, which compared with pathological PS (pPS), was of relatively good overall accuracy (83%), sensitivity (83%) and specificity (80%). The discrepancy was considered to be a result of technique modality difference, in that multidetector CT (MDCT) applied in Tsili’s study with the advantage of thinner slices and efficacy of contrast medium utilization made ctPS easier to identify. However, several more issues regarding ctPS need to be further illustrated. First, if ctPS status is different among RCC, whether it is able to anticipate postoperative prognosis before surgery is of interest. Second, whether ctPS absence is a reflection of pPS absence remained unclear given the much higher proportion of ctPS absence than pPS absence. We sought to investigate these issues in the present study via a cohort from our institution.
Patients and Methods
Study Population
We retrospectively reviewed the clinical and pathological records of 264 consecutive patients who had MDCT plain and contrast-enhanced scans and underwent radical or partial nephrectomy in our institution between January 2009 and December 2012. They were all pathologically identified as clear cell, papillary or chromophobe RCC. No enucleation was performed in our institution. Patients with preoperative metastasis, multiple tumors, positive surgical margin, inadequate clinicopathological information and loss of follow-up were excluded. Finally, a total of 210 patients were taken into analysis. Clinical, electronic radiological and pathological data were collected. Cancer stage was redetermined by 2010 AJCC TNM classification10 and nuclear grade followed WHO/ISUP 2016 criteria.11 The study was officially approved by the Ethics Committee of Zhongshan Hospital, and conducted in accordance with the Declaration of Helsinki. Written informed consent was acquired from each patient on the use and publication of medical data.
Evaluation of ctPS
Partly consistent with the literature,9 the middle layer (with difference of CT value over 30 Hu to adjacent layers) of a three-layered structure at TPI was considered ctPS. No detection of it in all slides was defined as ctPS absent. Each patient was assessed by two radiologists with patient information blinded.
Evaluation of pPS and Vasculature
The histological structure of fibers of the TPI was considered to be pPS and was evaluated microscopically in three aspects: presence/absence, thickness (when PS was present) and the extent of completeness (when PS was present). The extent of completeness was classified as intact, merely invaded and penetrated as reported.1,7 Thickness was calculated as the average value of at least three random shots avoiding penetration areas. Assessment of pPS was only carried out when parenchyma was observed on the other side. In clear cell cases, we randomly selected 30 patients with a pPS (15 without a ctPS and 15 with a ctPS) and evaluated the vasculature of TPI. Paraffin-embedded tissue slides were immunohistochemically stained (anti-CD34, Abcam, ab185732, diluted to 1:100). Three areas in and surrounding pPS were evaluated: the pPS area, the outer layer area (parenchyma area within 500 um outside pPS) and the inner layer area (tumor area within 500 um outside pPS). In each area, three random shots were assessed. The density and average cross-sectional area of vessels with long diameter ≥200 um were measured (Olympus cellSens Standard).
Statistical Analysis
Overall survival (OS) and progression-free survival (PFS) were the main endpoints in survival analysis. Progression was diagnosed according to CT or MRI during follow-up. The Kaplan-Meier method and Log rank test were used to evaluate the survival discrepancy. Cox proportional model were applied to estimate hazard ratio (HR) and corresponding 95% confidence interval (CI). With chi-square test and ANOVA method, we compared ctPS absence and ctPS presence in association with clinicopathological variables. With chi-square test and Mann–Whitney test, ctPS was compared with pPS. P-values less than 0.05 were considered to be significant. Analyses were done with IBM SPSS Statistics 21.
Results
Baseline Characteristics
Baseline characteristics of the 210 patients are shown in Table 1. Generally, most patients were in localized stage (74.3%) and low grade (1+2, 65.3%). The median follow-up was 84.7 (IQR 42.7–110.6) months. PS on MDCT was identified in contrast-enhanced scans rather than plain scans (Figure 1). 172 (81.9%) presented with a ctPS, the other 38 (18.1%) cases were identified as ctPS absent. They had comparable distribution among histology, TNM stage, nuclear grade, tumor size and necrosis (Table S1).
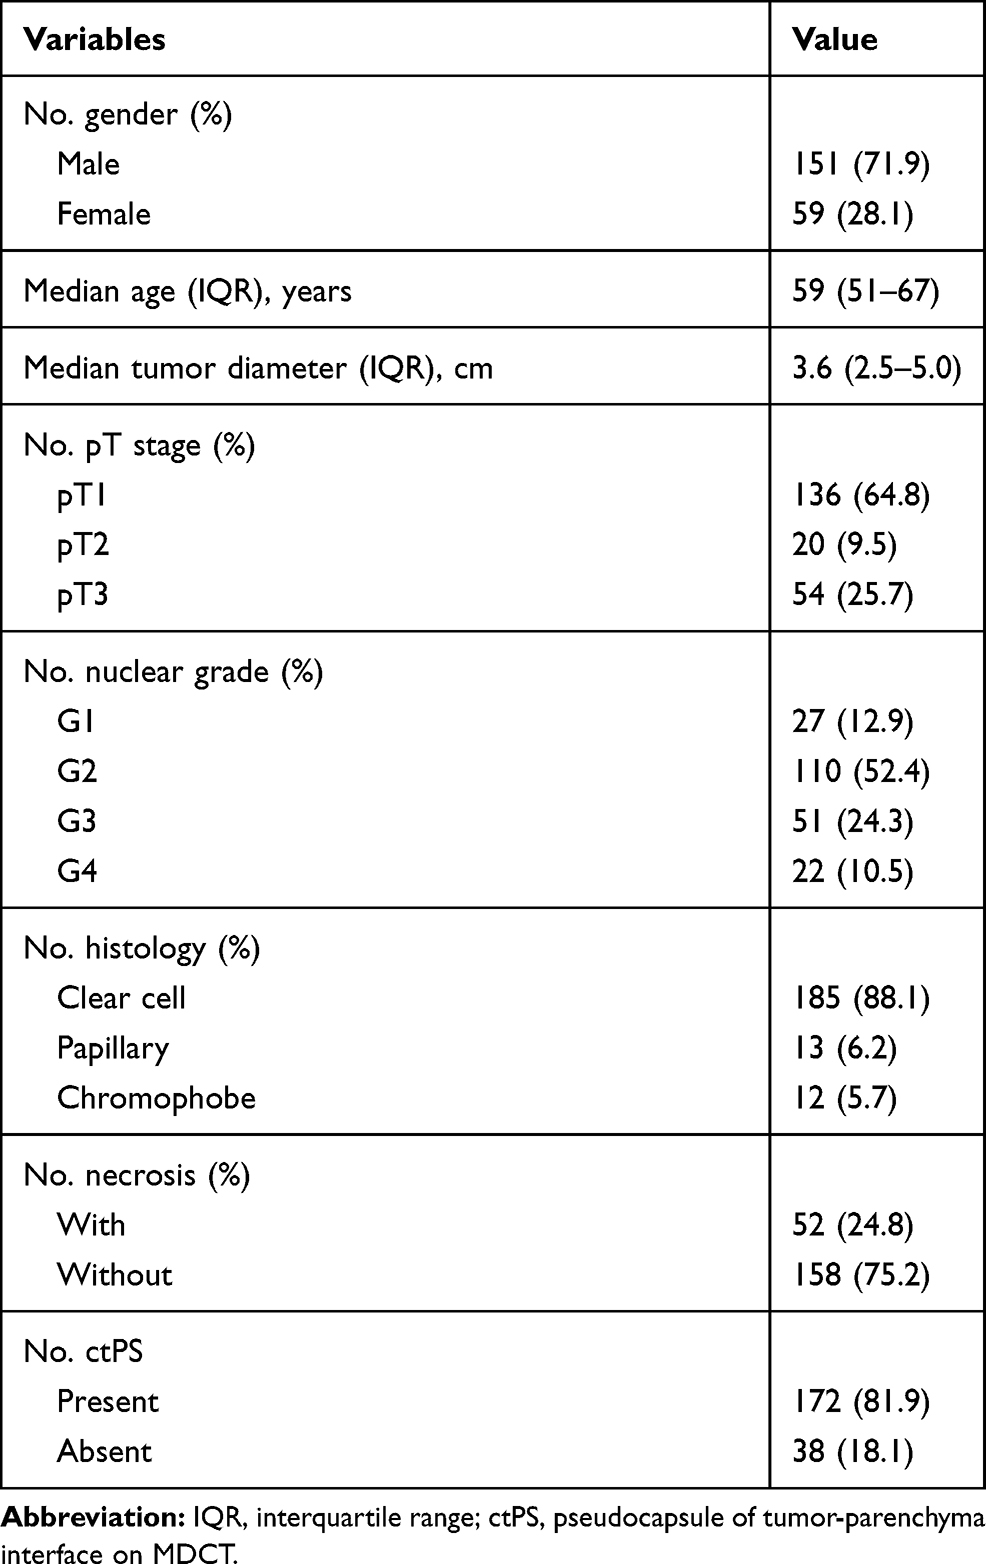 |
Table 1 Baseline Characteristics |
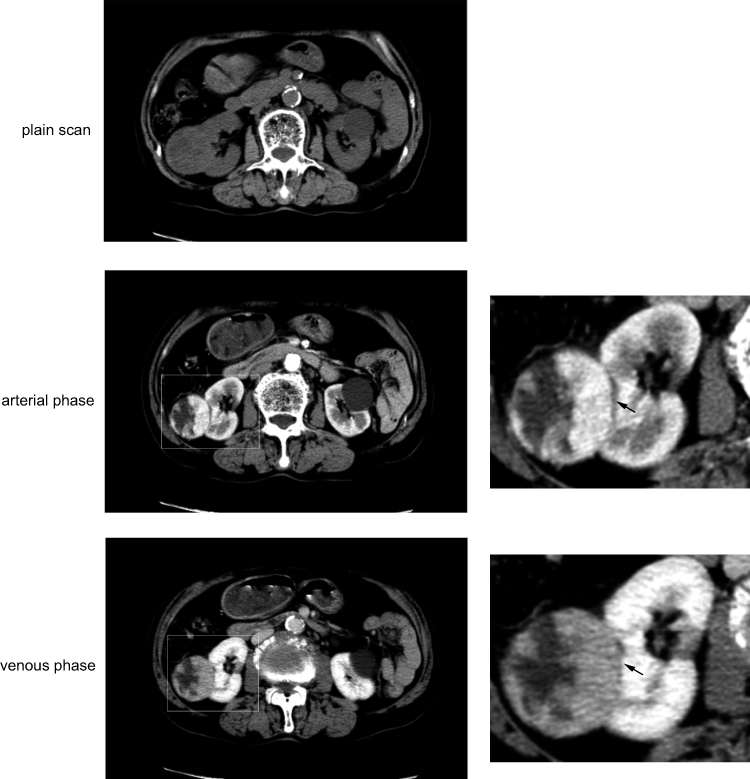 |
Figure 1 Pseudocapsule on MDCT. A 71-year old man with right renal cancer. ctPS is quite clear in arterial phase (black arrow), blurry but distinguishable in venous phase (black arrow). A simple renal cyst is also seen on the left kidney. |
Impact of ctPS on OS and PFS
Thirty-two (15.2%) patients died and 34 (16.2%) had progression during follow-up. Patients without a ctPS had significantly shortened OS (p = 0.001) and PFS (p <0.001). Eight-year OS rate was 58.4% vs 85.9% and 8-year PFS was 60.2% vs 89.5% in ctPS absent and ctPS present populations (Figure 2). Age (p = 0.002 and 0.917), TNM stage (p <0.001 and = 0.003), nuclear grade (both p <0.001) and necrosis (both p <0.001) were also significant in univariable analysis of OS and/or PFS. Histology was not associated with survival in the cohort (p = 0.699 and 0.194), which was not taken into multivariable analysis. In multivariable analysis, ctPS absence resulted in increased risk for death (HR3.104, p = 0.003) and progression (HR3.313, p = 0.001). TNM stage and nuclear grade were prognostic factors, as expected. Age was also significant for OS (Table 2). In clear cell histology, the impact of ctPS absence on OS and PFS was similar (Figure S1).
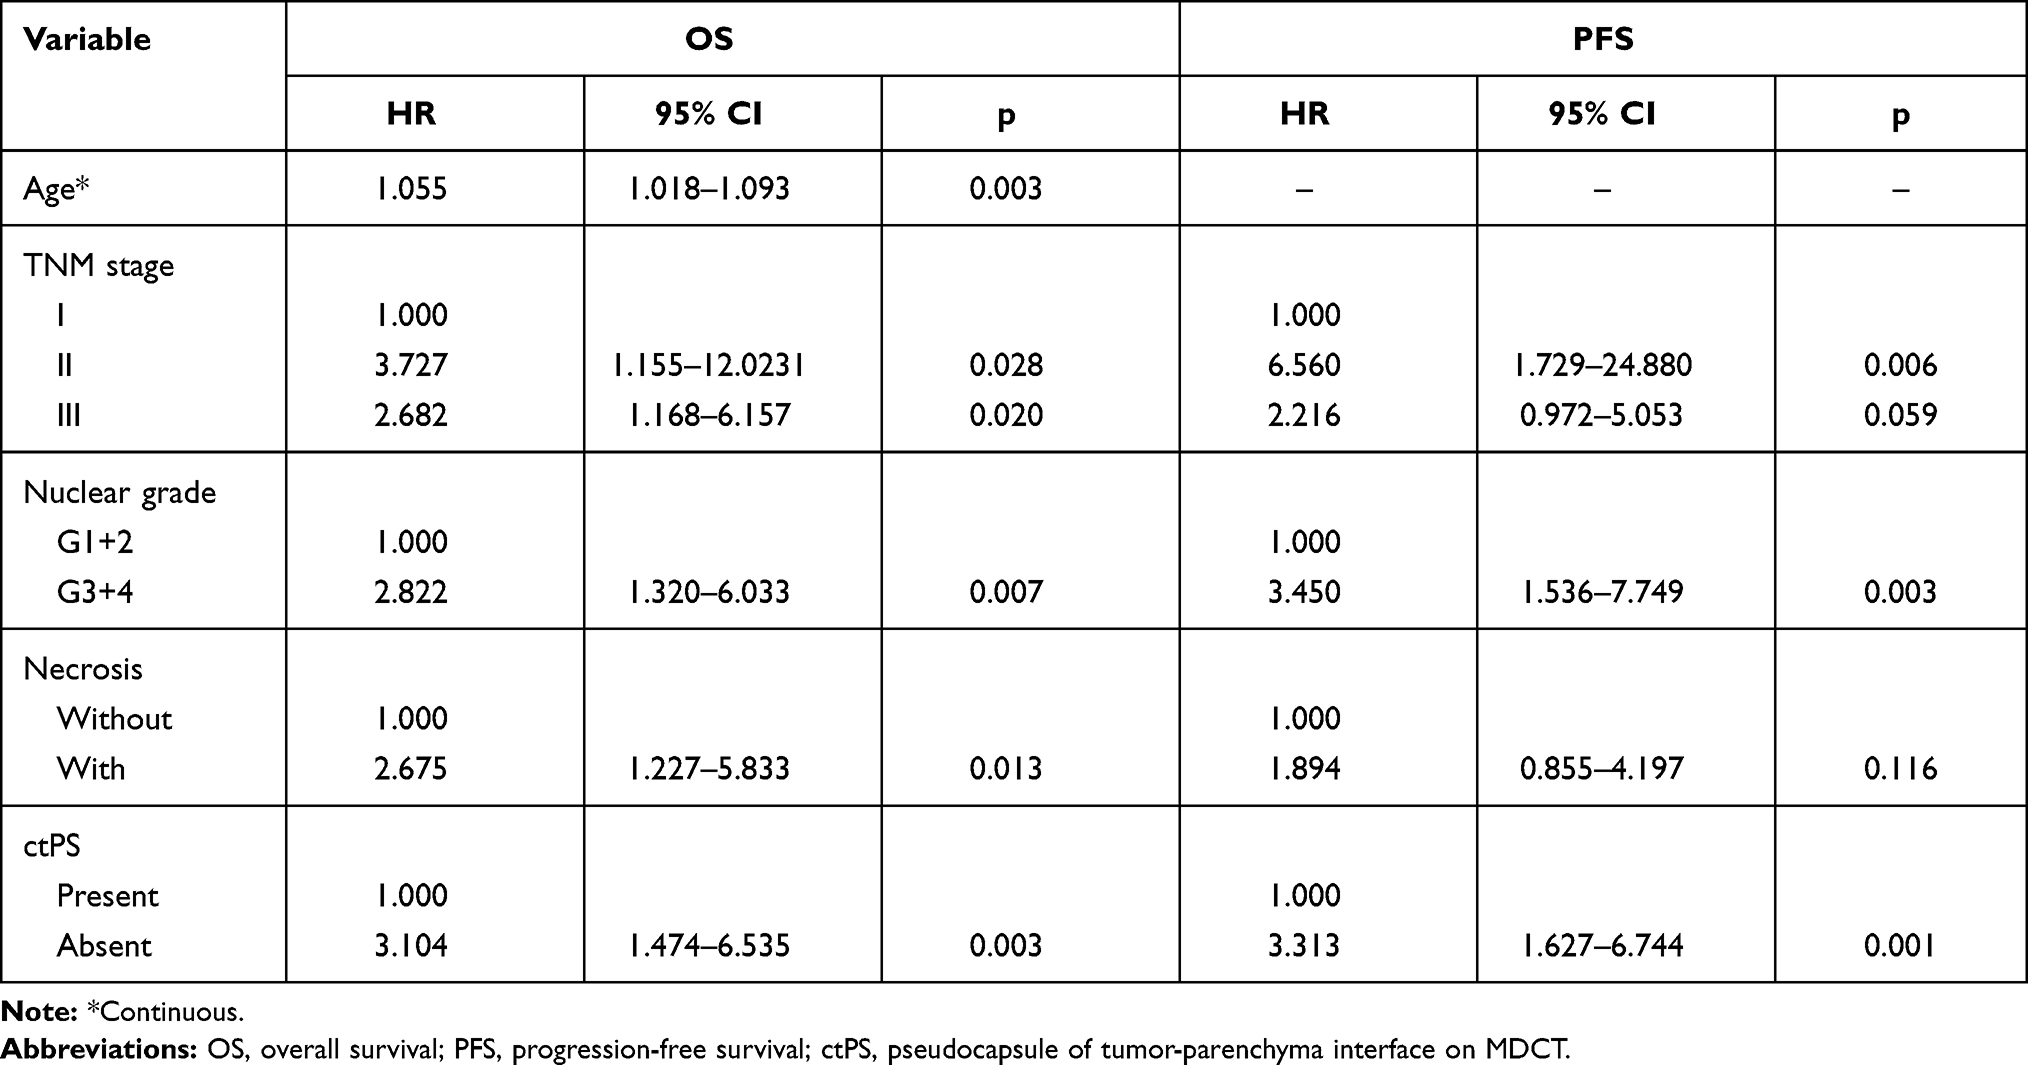 |
Table 2 Multivariable Cox Proportional Hazards Regression Analysis for OS and PFS |
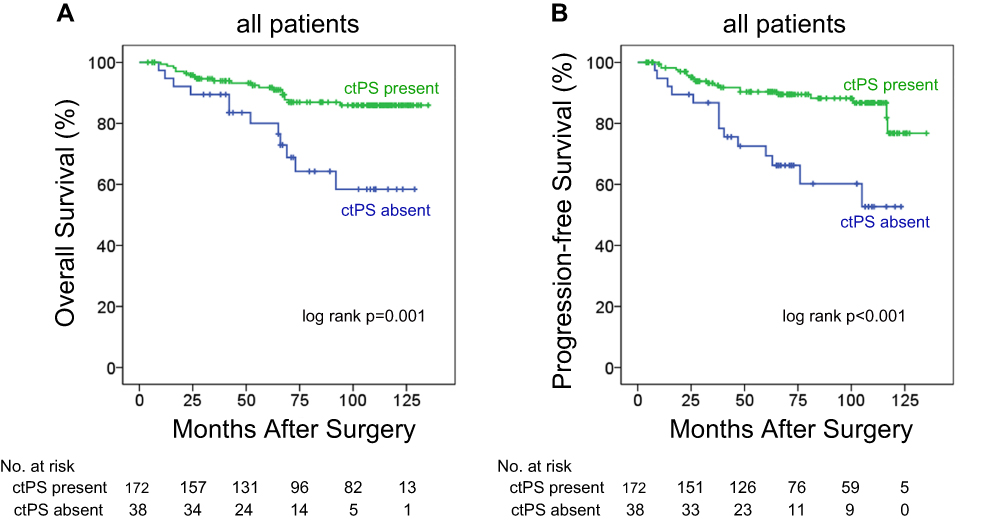 |
Figure 2 Kaplan-Meier OS (A) and PFS (B) curves. |
Histological Reflections of ctPS Absence
As shown in Table 3, the association of ctPS with pPS was studied. In those without a ctPS, 89.5% (n = 34) were detected to have a pPS, only two (5.2%) were actually of no pPS microscopically and two had unqualified assessment. We also detected no statistical association between the extent of pPS completeness and ctPS (p = 0.739). However, those without a ctPS obviously had thinner pPS compared with patients with a ctPS (0.36 vs 0.43mm, p = 0.005). We further analyzed the vasculature of the TPI, which may have an impact on CT demonstration, in 15 patients without a ctPS and 15 patients with a ctPS. They all had a pPS. Venous vessels were significantly enriched surrounding pPS (Figure 3). In clear cell RCC, those without a ctPS contained increased density and cross-sectional area of vessels with long diameters ≥ 200 um in the pPS layer (2.3/mm2 vs 1.0/mm2, p = 0.005; 34.5 kum2 vs 16.5 kum2, p = 0.011) and increased density in the outer layer (5.6/mm2 vs 3.3/mm2, p = 0.017) compared with ctPS-present tumors (Figure 4). These findings indicated that ctPS absence was not the reflection of pPS absence itself, but the reflection of a thinner pPS and increased vasculature of TPI.
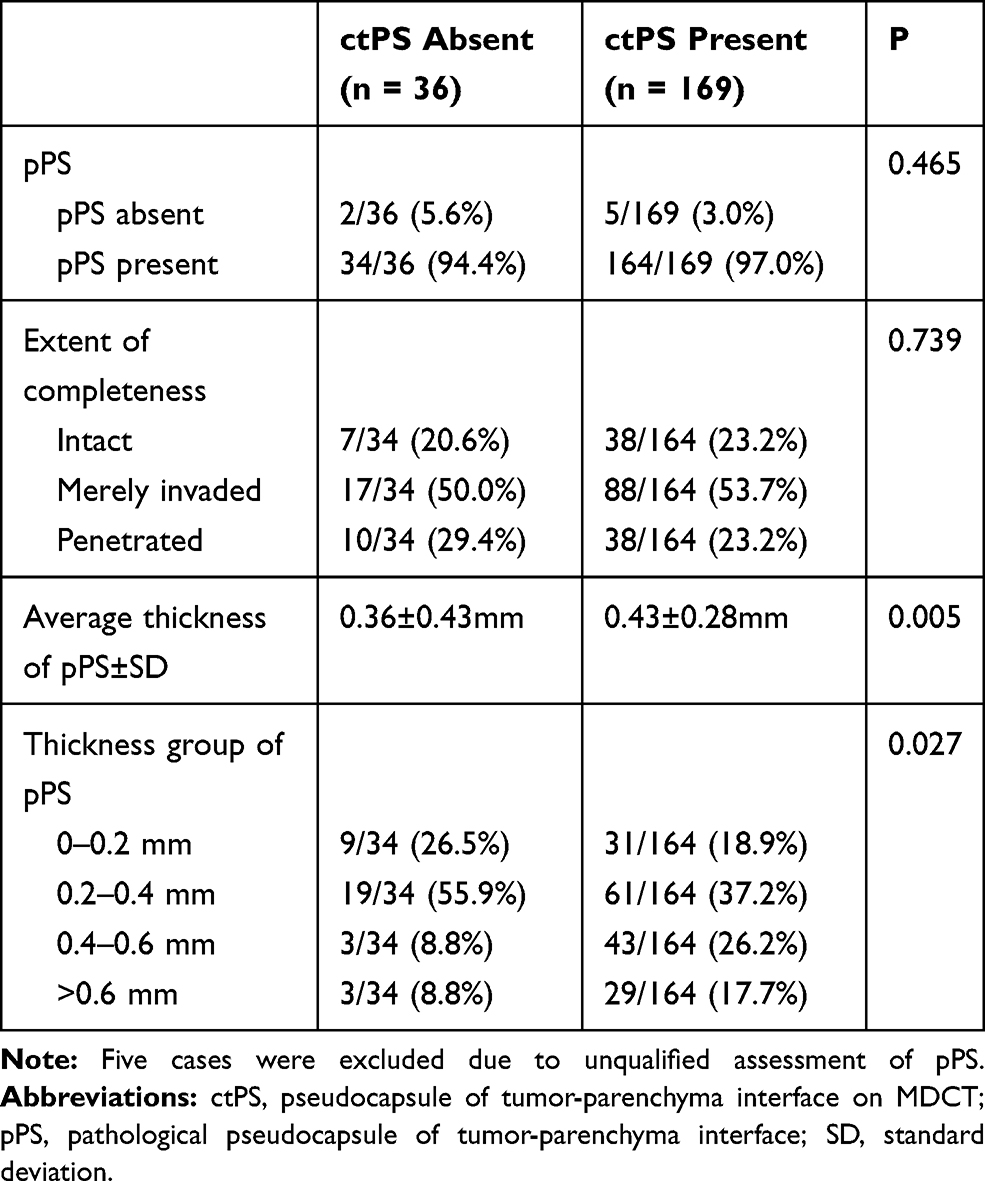 |
Table 3 Association Between ctPS and pPS |
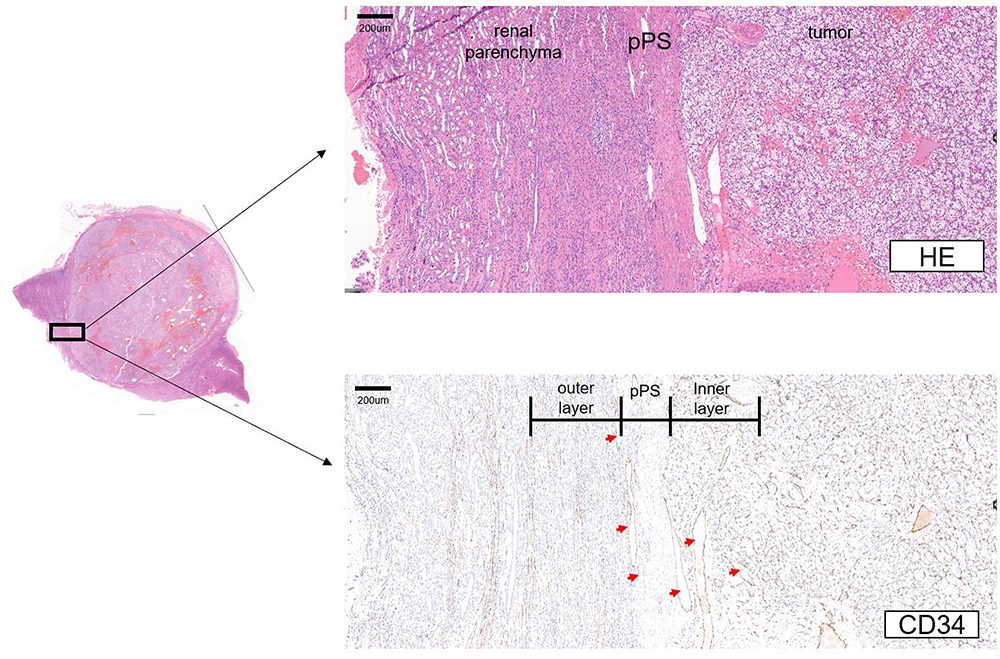 |
Figure 3 An example of vasculature at TPI. |
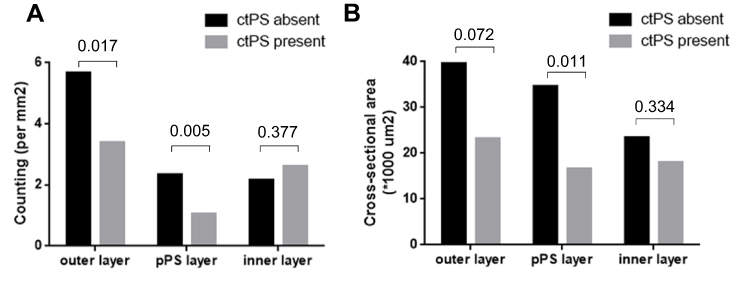 |
Figure 4 Density and cross-sectional area of vessels with long diameter ≥ 200 um in pPS layer, outer layer and inner layer. In comparison of density, p-values are indicated. |
Discussion
Radiological examination is decisive in diagnosis and preoperative assessment of renal cancer. Partly because of the texture and hardness difference between tumor and fat issues, the morphological change is noticeable when cancer invades into perirenal fat, sinus fat and pelvis. These interfaces are key points in radiological and pathological evaluation. But ctPS was not routinely evaluated because of poor capability of recognition in early research, and PS was “not visible at contrast-enhanced CT images” or had a low detection rate.8,12 In recent years, limited studies revealed an improvement of PS detection with the usage of MDCT. Tsili et al.9 in an article provided images of ctPS in lower or higher CT value in contrast to adjacent layers. The proportion was 69% (20/29). Blaschke et al.13 in hepatocellular carcinoma (HCC) detected a proportion of 78% (21/27) with similar three-layered structure recognition in provided pictures. The wide use of MDCT has enabled us to study pPS. In the present study, we applied a similar method to recognize ctPS. The proportion of ctPS presence was higher (172/210, 81.9%) than Tsili’s finding. Consistent with previous reports,9,13,14 it is hard to recognize ctPS in plain CT and nearly all ctPS were detected in contrast-enhanced slides.
Generally, ctPS has been considered to be a reflection of pPS. Tsili et al.9 in 2011 (n = 29) compared ctPS with pPS directly in renal cancer and demonstrated that CT examination enabled detection of pPS with 83% sensitivity, 80% specificity, 95% positive predictive value, and 50% negative predictive value. According to the data in the article, there is a positive association between ctPS and pPS. In the present study, the proportions of ctPS absence and pPS absence were 18.1% and 3.4%, respectively. In those without a ctPS, nearly all presented with a pPS. The sensitivity, specificity, positive predictive value, negative predictive value, and overall accuracy were 83%, 28%, 97%, 5.5%, and 81%, respectively. Despite the quite small number of pPS absence in our study (due to the low proportion), the extreme distribution could hardly result in any conclusions on pPS absence being the basis of ctPS absence. However, pPS thickness and vasculature of TPI were associated with ctPS that ctPS-absent tumors had drastically thinner pPS and enriched vessels (long diameter ≥ 200 um). In a recent study comparing ctPS and pPS, the authors found that the accuracy of ctPS is not satisfactory even with 64- or 320-detector MDCT,15 which could be explained by our results that whether there is a pPS is not the most important fundamental structure of a ctPS. The finding was interesting. On one hand, we could not judge pPS absence by MDCT before surgery because almost all those without a ctPS actually had a pPS. On the other hand, ctPS absence indicated a thinner pPS and enriched vasculature in the outer and pPS layers. Then enucleation may not be preferred because they could have increased risk of tumor injury, which certainly needs to be further studied.
There are studies in the literature demonstrating a close relationship between radiological PS and vasculature. Grazioli et al.16 indicated that in liver cancer early enhancement of PS by MRI showed a more prominent vasculature than those with enhancement in the equilibrium phase. Kousei et al.17 studied 15 cases with false-positive PS by MRI and found that prominent sinusoids at peritumor areas could be one of the reasons for false-positive detection. In a study by Ouyang et al.18 involving 12 ctPS-present patients and 32 ctPS-absent patients, the authors demonstrated that tumors without a ctPS had increased number, area, diameter and perimeter of microvessels with lumen in contrast to ctPS-present tumors. Vessels with lumen were considered microvessels in Ouyang’s study, whereas we directly defined them with the definition of small veins and focused more on TPI.
PS has been paid little attention regarding the prognostic significance in RCC. Approximately 0–18% were lack of pPS.2–5 We previously in a large cohort (n = 1307) found that pPS absence significantly resulted in increased risk of death and progression.7 In the present study, we for the first time demonstrated that although ctPS absence was not a reflection of pPS absence itself, it was also independently and adversely associated with prognosis. Therefore, both pathological and radiological PS have prognostic implications in RCC. Given their cost-efficient feature, a PS-oriented model could be useful in forecasting clinical outcome of RCC.
Prognostic evaluation of kidney cancer has been much discussed. Probably because of the high heterogeneity of renal cancer, current classifications (such as TNM staging and nuclear grading systems) could not perfectly stratify risk level. Studies focusing on immunity and inflammation are notable. Selvi et al. evaluated the density of CD8+ and CD3+ tumor-infiltrating lymphocytes (TILs) and classified patients according to the immune status (immunoscore). Results showed that a favorable immunoscore (I3-4) was associated with significantly prolonged disease-free survival (DFS), PFS and OS. In the metastatic subgroup analysis, the immunoscore showed better estimation than the International Metastatic RCC Database Consortium (IMDC) model and the Memorial Sloan-Kettering Cancer Center (MSKCC) risk model for progression and OS (p < 0.001).19,20 In another cohort involving 218 mRCC patients treated with sunitinib or sorafenib, the authors evaluated CD8, CD4, Treg, PD-1, and PD-L1 expression in primary tumor tissues and found that CD8, Treg, PD-1, and stromal PD-L1 were strongly associated with OS, by which immunoscore was subsequently calculated. Multivariate analysis identified IS as an independent prognostic factor for OS (p <0.001) and PFS (p = 0.002). The novel immunoscore model provided better prediction ability for OS compared with the IMDC risk model.21 These studies provided examples on how immune status served as a prognostic tool with different definitions of immunoscore. In the present study, we focused on the radiological images of PS of TPI, whose prognostic value was also remarkable. Compared with other molecular factors, absence of PS is cost-effective and does not require additional examination, making potential usage in clinical practice more promising.
Differently from pPS, the classification of ctPS was simple in the study. From the distribution of pPS absence and different extent of completeness as well as the prognostic implications, we spontaneously regarded pPS absence as the upgrading of penetration.7 However, the classification was not suitable for ctPS. On one hand, as we mentioned before, ctPS absence was not the reflection of pPS absence but the reflection of thickness of pPS and the vasculature of TPI. Thus it is hard to simply regard ctPS absence as an elevated step after ctPS penetration. On the other hand, determining whether there was ctPS penetration was somewhat blurry. We initially tried to further classify those with a ctPS into penetrated and non-penetrated ones, which could be consistent to pPS. However, there is a big assessment discrepancy among doctors. Therefore, the classification of ctPS was a result of realistic conditions as well as logical restrictions.
MRI, especially T2-weighted MRI, is superior to CT in detecting PS.8,22 Papalia et al.23 further carefully classified PS on MRI (mriPS) into four categories: presence of PS (MRI-Cap 0), presence of a clearly identifiable PS (MRI-Cap 1), focally interrupted PS (MRI-Cap 2), and clearly interrupted and infiltrated PS (MRI-Cap 3), and compared them with pPS classifications (i-Cap). A concordance between MRI-Cap and i-Cap was found in 50/58 (86%) cases, and only 8/58 (14%) lesions were misevaluated by MRI. Therefore, studying the associations of mriPS with pPS, surgical events (e.g. positive margin) and prognosis is of potential application.
Limitations of this study include the retrospective and single institution design with limited sample size. Patients in our institution come from all over the nation. Many were diagnosed by CT in other hospitals and came with printed CT films. They did not have preoperative electronic CT scans archived in our institution. It restricted the number of enrolled patients, although the annual operation volume in our hospital was large. In addition, we did not study the vasculature of TPI in non-clear cell RCC because of limited cases in ctPS present and ctPS absent patients.
In conclusion, the present study demonstrated that ctPS absence significantly increases the risk of adverse clinical outcome in RCC. It is the reflection of a thinner pPS and enriched vasculature of TPI rather than pPS absence itself.
Conclusions
Absence of ctPS significantly increases the risk of adverse clinical outcome in RCC. It is the reflection of a thinner pPS and enriched vasculature of TPI rather than absence of pPS itself.
Acknowledgments
This study was funded by grants from National Natural Science Foundation of China (81772696, 81472376, 81702496, 81702497, 81702805), Shanghai Sailing Program (19YF1408000), Shanghai Anticancer Association EYAS PROJECT (SACA-CY1B11) and Fujian Guided projects of science and technology (2019D025). All these study sponsors have no roles in the study design, in the collection, analysis, and interpretation of data.
Author Contributions
All authors made a significant contribution to the work reported, whether that is in the conception, study design, execution, acquisition of data, analysis and interpretation, or in all these areas; took part in drafting, revising or critically reviewing the article; gave final approval of the version to be published; have agreed on the journal to which the article has been submitted; and agree to be accountable for all aspects of the work.
Disclosure
The authors report no conflicts of interest for this work.
References
1. Minervini A, Di Cristofano C, Lapini A, et al. Histopathologic analysis of peritumoral pseudocapsule and surgical margin status after tumor enucleation for renal cell carcinoma. Eur Urol. 2009;55(6):1410–1418.
2. Jacob JM, Williamson SR, Gondim DD, et al. Characteristics of the peritumoral pseudocapsule vary predictably with histologic subtype of T1 renal neoplasms. Urology. 2015;86(5):956–961. doi:10.1016/j.urology.2015.06.015
3. Azhar RA, de Castro Abreu AL, Broxham E, et al. Histological analysis of the kidney tumor-parenchyma interface. J Urol. 2015;193(2):415–422. doi:10.1016/j.juro.2014.08.010
4. Kim M, Choi WS, Jeong CW, et al. Differences in peritumoral pseudocapsule characteristics according to clinicopathological factors in clinical T1a renal tumors. Int J Clin Exp Pathol. 2015;8(9):11323–11331.
5. Cho S, Lee JH, Jeon SH, et al. A prospective, multicenter analysis of pseudocapsule characteristics: do all stages of renal cell carcinoma have complete pseudocapsules? Urol Oncol. 2017;35(6):370–378.
6. Ito H, Makiyama K, Kawahara T, et al. Impact of accidental tumor incision during laparoscopic partial nephrectomy on the oncologic and clinical outcomes. Clin Genitourin Cancer. 2016;14(4):e291–297. doi:10.1016/j.clgc.2015.11.013
7. Xi W, Wang J, Liu L, et al. Evaluation of tumor pseudocapsule status and its prognostic significance in renal cell carcinoma. J Urol. 2018;199(4):915–920. doi:10.1016/j.juro.2017.10.043
8. Yamashita Y, Honda S, Nishiharu T, Urata J, Takahashi M. Detection of pseudocapsule of renal cell carcinoma with MR imaging and CT. AJR Am J Roentgenol. 1996;166(5):1151–1155. doi:10.2214/ajr.166.5.8615260
9. Tsili AC, Argyropoulou MI, Gousia A, et al. Renal cell carcinoma: value of multiphase MDCT with multiplanar reformations in the detection of pseudocapsule. AJR Am J Roentgenol. 2012;199(2):379–386. doi:10.2214/AJR.11.7747
10. Edge SB, Compton CC. The American Joint Committee on cancer: the 7th edition of the AJCC cancer staging manual and the future of TNM. Ann Surg Oncol. 2010;17(6):1471–1474. doi:10.1245/s10434-010-0985-4
11. Delahunt B, Eble JN, Egevad L, et al. Grading of renal cell carcinoma. Histopathology. 2019;74:4–17. doi:10.1111/his.13735
12. Takahashi S, Ueda J, Furukawa T, et al. Renal cell carcinoma: preoperative assessment for enucleative surgery with angiography, CT, and MRI. J Comput Assist Tomogr. 1996;20(6):863–870. doi:10.1097/00004728-199611000-00001
13. Blaschke EM, Rao VL, Xiong L, et al. Multiphase multi-detector row computed tomography imaging characteristics of large (>5 cm) focal hepatocellular carcinoma. J Comput Assist Tomogr. 2016;40(3):493–497. doi:10.1097/RCT.0000000000000379
14. O’Connor SD, Silverman SG, Cochon LR, Khorasani RK. Renal cancer at unenhanced CT: imaging features, detection rates, and outcomes. Abdom Radiol. 2018;43(7):1756–1763. doi:10.1007/s00261-017-1376-0
15. Toguchi M, Takagi T, Ogawa Y, et al. Detection of a peritumoral pseudocapsule in patients with renal cell carcinoma undergoing robot-assisted partial nephrectomy using enhanced MDCT. Sci Rep. 2021;11(1):2245. doi:10.1038/s41598-021-81922-0
16. Grazioli L, Olivetti L, Fugazzola C, et al. The pseudocapsule in hepatocellular carcinoma: correlation between dynamic MR imaging and pathology. Eur Radiol. 1999;9(1):62–67. doi:10.1007/s003300050629
17. Kousei I, Yoshimitsu K, Nishihara Y, et al. Hepatocellular carcinoma with a pseudocapsule on gadolinium-enhanced MR images: correlation with histopathologic findings. Radiology. 2009;250(2):435–443. doi:10.1148/radiol.2501071702
18. Ouyang AM, Wei ZL, Su XY, et al. Relative computed tomography (CT) enhancement value for the assessment of microvascular architecture in renal cell carcinoma. Med Sci Mon. 2017;23:3706–3714. doi:10.12659/MSM.902957
19. Selvi I, Demirci U, Bozdogan N, Basar H. The prognostic effect of immunoscore in patients with clear cell renal cell carcinoma: preliminary results. Int Urol Nephrol. 2020;52(1):21–34. doi:10.1007/s11255-019-02285-0
20. Selvi I, Demirci U, Bozdogan N, Basar H. Does immunoscore have a significant effect on survival for non-clear cell renal cell carcinoma as well as clear cell renal cell carcinoma? Int Urol Nephrol. 2021;53(6):1135–1138. doi:10.1007/s11255-020-02766-7
21. Yao JX, Chen X, Xi W, et al. Immunoscore system for predicting clinical outcome of metastatic renal cell carcinoma patients treated with tyrosine kinase inhibitors. J Cancer. 2018;9(22):4099–4107. doi:10.7150/jca.27408
22. Roy C
23. Papalia R, Panebianco V, Mastroianni R, et al. Accuracy of magnetic resonance imaging to identify pseudocapsule invasion in renal tumors. World J Urol. 2019.
 © 2021 The Author(s). This work is published and licensed by Dove Medical Press Limited. The full terms of this license are available at https://www.dovepress.com/terms.php and incorporate the Creative Commons Attribution - Non Commercial (unported, v3.0) License.
By accessing the work you hereby accept the Terms. Non-commercial uses of the work are permitted without any further permission from Dove Medical Press Limited, provided the work is properly attributed. For permission for commercial use of this work, please see paragraphs 4.2 and 5 of our Terms.
© 2021 The Author(s). This work is published and licensed by Dove Medical Press Limited. The full terms of this license are available at https://www.dovepress.com/terms.php and incorporate the Creative Commons Attribution - Non Commercial (unported, v3.0) License.
By accessing the work you hereby accept the Terms. Non-commercial uses of the work are permitted without any further permission from Dove Medical Press Limited, provided the work is properly attributed. For permission for commercial use of this work, please see paragraphs 4.2 and 5 of our Terms.