")
Back to Journals » Therapeutics and Clinical Risk Management » Volume 16
Neutrophil–Lymphocyte Ratio (NLR) for Predicting Clinical Outcomes in Patients with Coronary Artery Disease and Type 2 Diabetes Mellitus: A Propensity Score Matching Analysis
Received 3 January 2020
Accepted for publication 3 April 2020
Published 19 May 2020 Volume 2020:16 Pages 437—443
DOI https://doi.org/10.2147/TCRM.S244623
Checked for plagiarism Yes
Review by Single anonymous peer review
Peer reviewer comments 2
Editor who approved publication: Dr Deyun Wang
Shang Qiao, Wen Gao, Shujun Guo
Department of Cardiology, Bayan Nur Hospital of the Nei Monggol Autonomous Region, Bayan Nur City 015000, People’s Republic of China
Correspondence: Shujun Guo
Department of Cardiology, Bayan Nur Hospital of the Nei Monggol Autonomous Region, Bayan Nur Hospital, No. 98 Wulanbuhe Road, Linhe District, Bayan Nur City 015000, People’s Republic of China
Email [email protected]
Background: Cardiovascular diseases (CVD) combined with Type 2 diabetes mellitus (T2DM) frequently occurred. In this study, we aimed at exploring the prognostic significance of blood neutrophil–lymphocyte ratio (NLR) in these types of patients.
Patients and Methods: Between June 30, 2010 and August 30, 2017, 1454 patients with CVD were enrolled in this study. Kaplan and Meier methodology was used for survival analysis. We also used propensity score matching (PSM) to further compare survival in patients with or without T2DM.
Results: Among all patients, we applied ROC curve analysis to stratify all patients into two different groups including NLR > 2.5 (n=432) and NLR≤ 2.5 (n=1022) groups. After that, we further performed survival analysis between different groups. We found that patients with NLR ≤ 2.5 had significantly favorable OS compared with the overall survival in patients with NLR > 2.5. We further built the PSM using 242 pairs of patients who have CVD and with or without T2DM. After adjusting for competing risk factors, we performed Cox proportional hazards models to identify the independent prognostic factors in multivariable adjustment. We found that NLR ≤ 2.5 (HR: 2.576, 95% CI: 1.241– 4.583, P =0.001) and extent of coronary artery disease (HR: 2.432, 95% CI: 1.189– 4.392, P =0.005) remained independent predictors of OS.
Conclusion: In conclusion, we have established an PSM model and found that a high NLR value was an independent prognostic factor for survival, predicting in patients with both CAD and T2DM. The NLR value would be a valuable biomarker to evaluate the outcomes of patients and give them opportunities for choosing alternative therapies.
Keywords: neutrophil–lymphocyte ratio, NLR, cardiovascular diseases, CVD, type 2 diabetes mellitus, T2DM
Introduction
Cardiovascular diseases (CVD) are considered the leading causes of all mortality worldwide in these decades.1,2 It is estimated that 17.7 million people died of CVD in 2015 all over the world, and coronary artery disease (CAD) and stroke were the major causes.3 Type 2 diabetes mellitus (T2DM) is increasing and patients subjected to T2DM have at least a two-fold increased risk for coronary artery disease, stroke, peripheral arterial disease, cardiomyopathy and heart failure.4–7 Although the risk of coronary events can be reduced by aggressive management of co-existing risk factors and prophylactic treatments, risk stratification and prognostication in patients both CAD and T2DM are important so that individuals at high risks can be accurately targeted for prevention.8–10
The inflammatory response plays an important role in the pathogenesis of atherosclerosis and closely associated with the progression of atherosclerosis. Neutrophil to lymphocyte ratio (NLR) has been found to be associated with glucose control in type 2 diabetes mellitus (T2DM) in recent literature.11 It is also useful in the differentiation of thyroid nodules,12 in thyroiditis,13 in heart failure,14 in ulcerative colitis,15 and in alcoholic hepatitis.16 The inflammatory mediators that secreted by neutrophils can cause vascular wall degeneration.17–19 Conversely, the inflammatory mediators that secreted by lymphocytes have an anti-atherosclerotic response and regulate the inflammatory process. Therefore, the neutrophil to lymphocyte ratio (NLR) has the potential to be a valuable inflammatory biomarker and could be a predictor of prognosis for patients with CAD.
Chronic inflammation plays an important role in the pathogenesis of diabetes, its development and complications.20–22 In particular, leukocytes are the leading factor in the process of vascular wall degeneration in patients with diabetes, participate in the evolution of atherosclerosis, participate in the instability and rupture of plaques, and lead to thrombotic events. In addition, there is growing concern about leukocyte subtypes, especially neutrophil-to-lymphocyte ratio (NLR), which is a cheap and convenient way to identify inflammatory parameters and may be more accurate than absolute blood cell counts. NLR could be a vascular risk indicator for CVD.23–25 However, so far, there are not many reports evaluating the relationship between diabetes and NLR and its effect on CAD in patients with diabetes, which is the purpose of this study. In the present study, we evaluated the prognostic value of NLR in patients with both CAD and T2DM. Moreover, we also analyzed the relationship between the NLR and other clinical characteristics.
Patients and Methods
Patients and Study Design
This study consisted of 1454 consecutive patients with CAD identified retrospectively from June 30, 2010 to August 30, 2017. The study was approved by the Regional Ethical Review Board for Bayan Nur Hospital of the Nei Monggol Autonomous Region. Patients were treated according to the Declaration of Helsinki’s ethical principles for medical research involving human subjects. All patients provided an informed written consent prior to study entry. In brief, patients with known hepatobiliary disease, alcohol abuse, acute infection, cardiogenic shock or a known malignancy were excluded. Patients are also excluded if they have a malignancy, a severe, uncontrolled medical condition, or a mental illness that limits their ability to comply with research requirements.
Pretreatment Evaluation
Each patient has a medical history and physical examination results. Each patient also had an electrocardiogram, abdomen and pelvis (and chest, if needed), serum chemistry and CBC, and urinalysis.
Coronary Angiography
Coronary angiography was routinely performed using a digital system (AXIOM Artis dTC from Siemens Medical Solutions, Ireland, Germany), using Judkins technology and 6-Fr left and right heart catheters. Quantitative coronary angiography (QCA) is performed using an automated edge detection system (Quant Cor-QCA and ACOM, Siemens), as described elsewhere. The measurement parameters were the minimum lumen diameter, reference diameter, percent stenosis, and lesion length. Significant coronary artery disease is defined as having at least one coronary artery stenosis >50%, while severe coronary artery disease is defined as three-vessel disease and/or left main disease. In the case of patients who have previously received percutaneous coronary intervention (PCI), the treated blood vessels are considered a major disease even if no restenosis is observed. In previous heart bypass patients, autologous arteries and grafts were considered when assessing the degree of arterial disease (the number of diseased blood vessels).
T2DM Diagnosis
The following criteria are required for the diagnosis of type 2 diabetes: 1) determine the diagnostic criteria for diabetes, that is, the patient is receiving active treatment with insulin or oral hypoglycemic drugs; 2) according to the World Health Organization Diabetes Standard, regarding fasting blood glucose abnormalities (≥126 mg/dL Or ≥7.0 mmol/L) or glucose tolerance test (≥200 mg/dL or ≥11.1 mmol/L) hospital records. A patient is diagnosed with arterial hypertension if they are receiving active treatment with antihypertensive drugs or at least twice with systolic blood pressure ≥140 mmHg or diastolic blood pressure >90 mmHg.
Study Outcome and Follow-Up
The primary endpoint measure was all-cause mortality at 5 years of follow-up. The secondary endpoint is the complications associated with CAD and T2DM. Cardiac mortality, non-fatal myocardial infarction and stroke were also assessed. Heart death is defined according to academic research association standards. Myocardial infarction is detected by an electrocardiogram (new abnormal Q waves appearing in ≥2 adjacent limb leads or ≥2 adjacent anterior cardiac leads) or enzymatically (recording an increase in creatine kinase myocardial band activity >2 times) (>3 times within 48 hours after PCI) diagnostic, in the presence of clinical symptoms) standard. Stroke is defined as an acute neurological event with a duration of ≥24 hours, with focal signs and symptoms, and there is no evidence to support another interpretation. The diagnosis of stroke requires confirmation by computed tomography, magnetic resonance imaging, or pathology.
The post-discharge follow-up plan includes telephone follow-ups of 1 month, 6 months, 1 year, and each year thereafter to determine the status of life and the occurrence of cardiovascular events. Death information was obtained through hospital records, death certificates, and telephone contact with the patient’s relatives or referring doctor. Contact insurance companies and address registries. Follow-up data was collected by medical staff who did not know the patient’s clinical or laboratory information.
Statistical Methods
Continuous variables were expressed as mean ± SD (standard deviation) and compared using a two-tailed unpaired Student’s t test; the cut-off value of NLR was identified by the area under ROC curve (AUC).26 Kaplan and Meier methodology was used to perform the survival analysis.27 The Greenwood formula was used for the standard deviation. A Cox proportional hazards regression approach28 was chosen for the evaluation of OS as the primary end-point. Potential prognostic variables were analyzed both univariately with one factor taken at a time, and then in a multivariate model combining all factors. All statistical evaluations were carried out using SPSS software (Statistical Package for the Social Science, version 15.0, SPSS Inc, Chicago, IL).
Results
Patients’ Characteristics
One thousand four hundred and fifty-four patients with CAD were separated into two groups (Figure 1): patients with T2DM group (N = 628, 43.2%) and patients without T2DM group (N = 826, 56.8%). Meanwhile, patients were divided into NLR >2.5 group (N = 432, 29.7%) and NLR ≤2.5 group (N = 1022, 70.3%) according to the routine examination at admission. The comparisons of patients’ characteristics are illustrated in Table 1. Patient characteristics significantly differed between the two groups (p <0.05), including body mass index (kg/m2), clinical presentation, smoking status, C-reactive protein (mg/L), GGT (U/L), serum creatinine (mg/dL), estimated GFR (mL/min) and T2DM. After Propensity Score Matching analysis (PSM), there was no significant difference between the two groups. The comparison of the two groups is shown in Table 2.
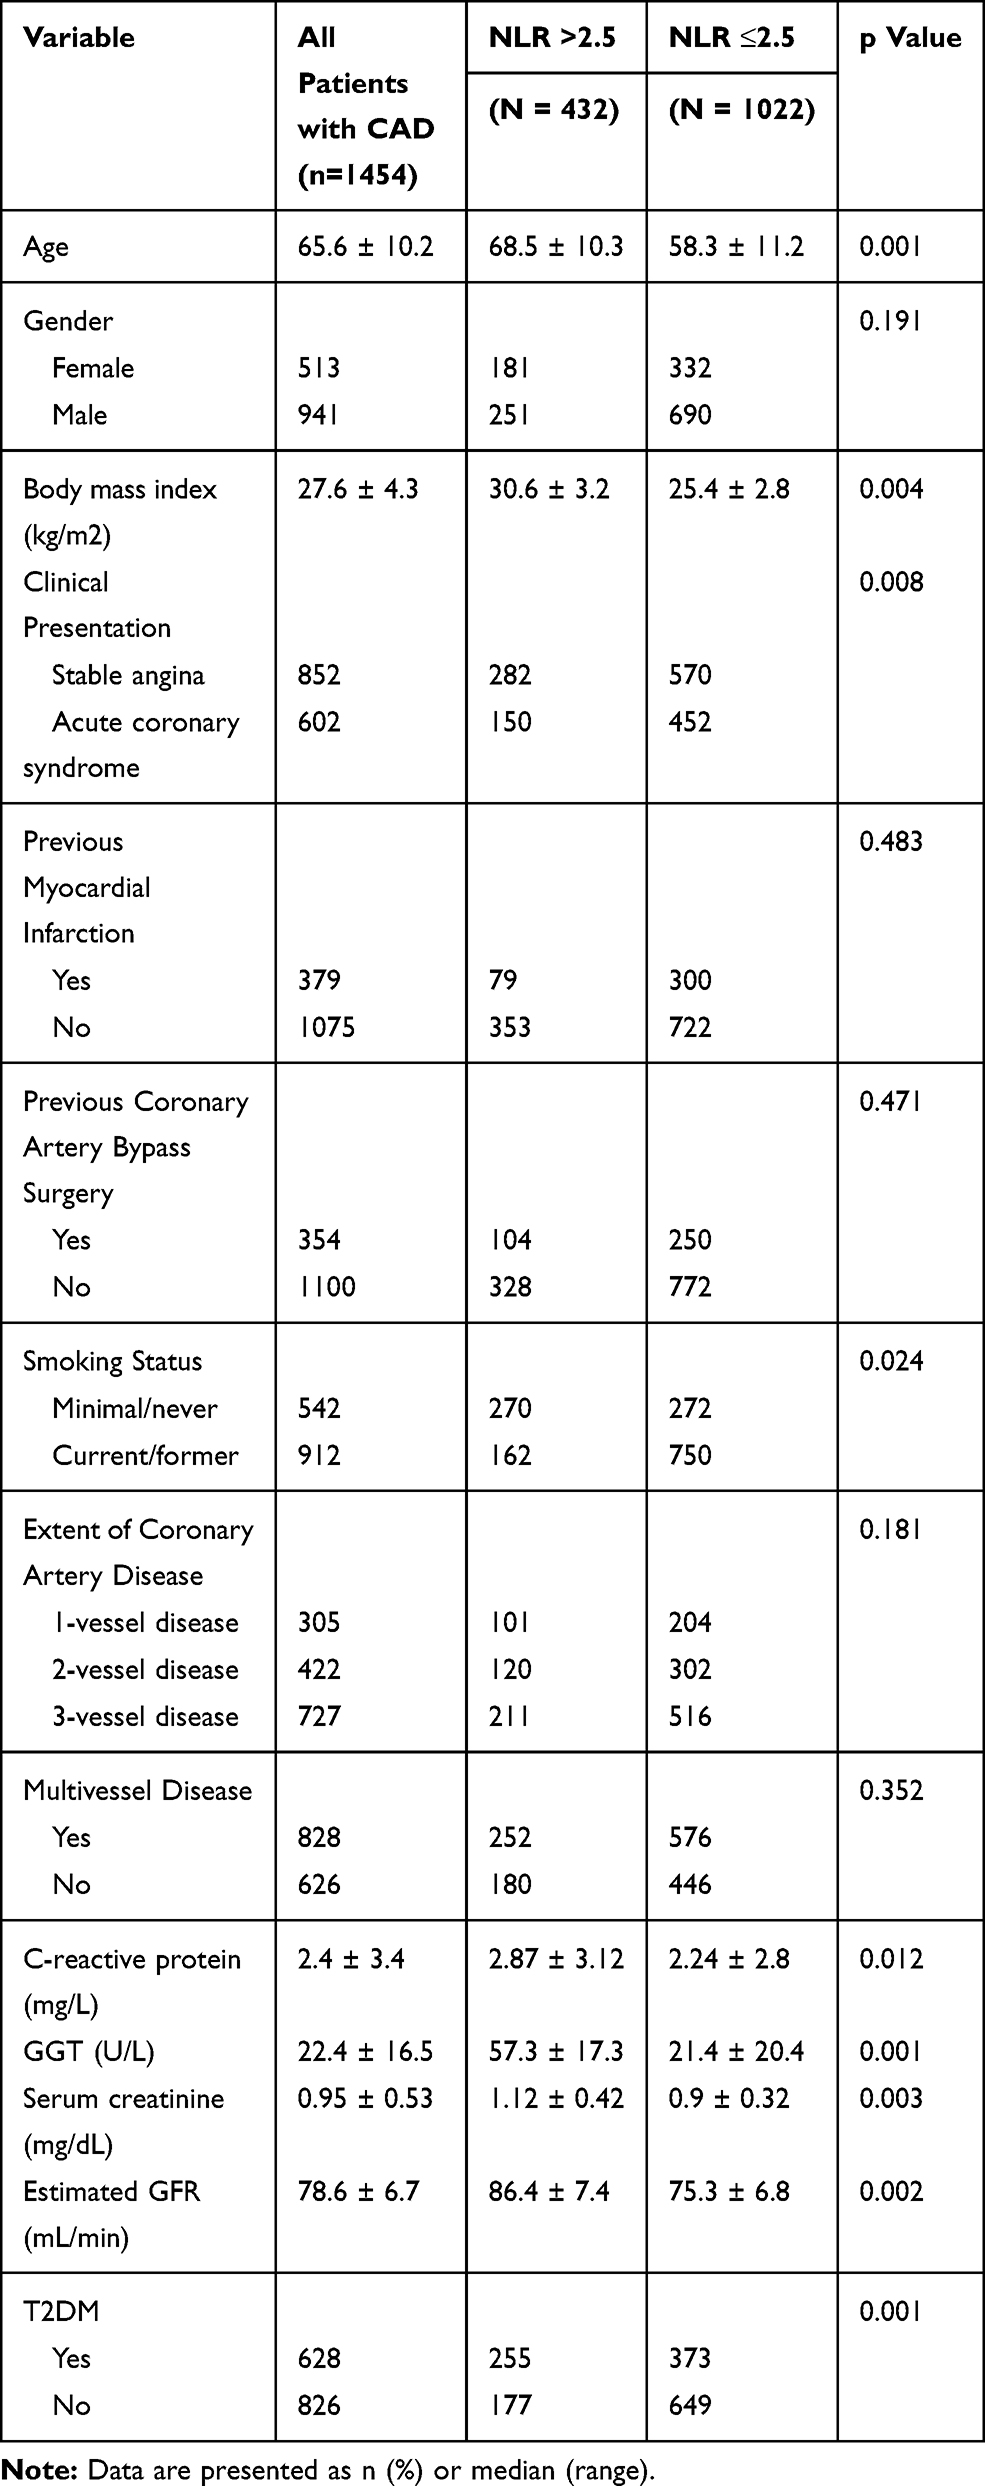 |
Table 1 Demographics and Baseline Characteristics of Patients |
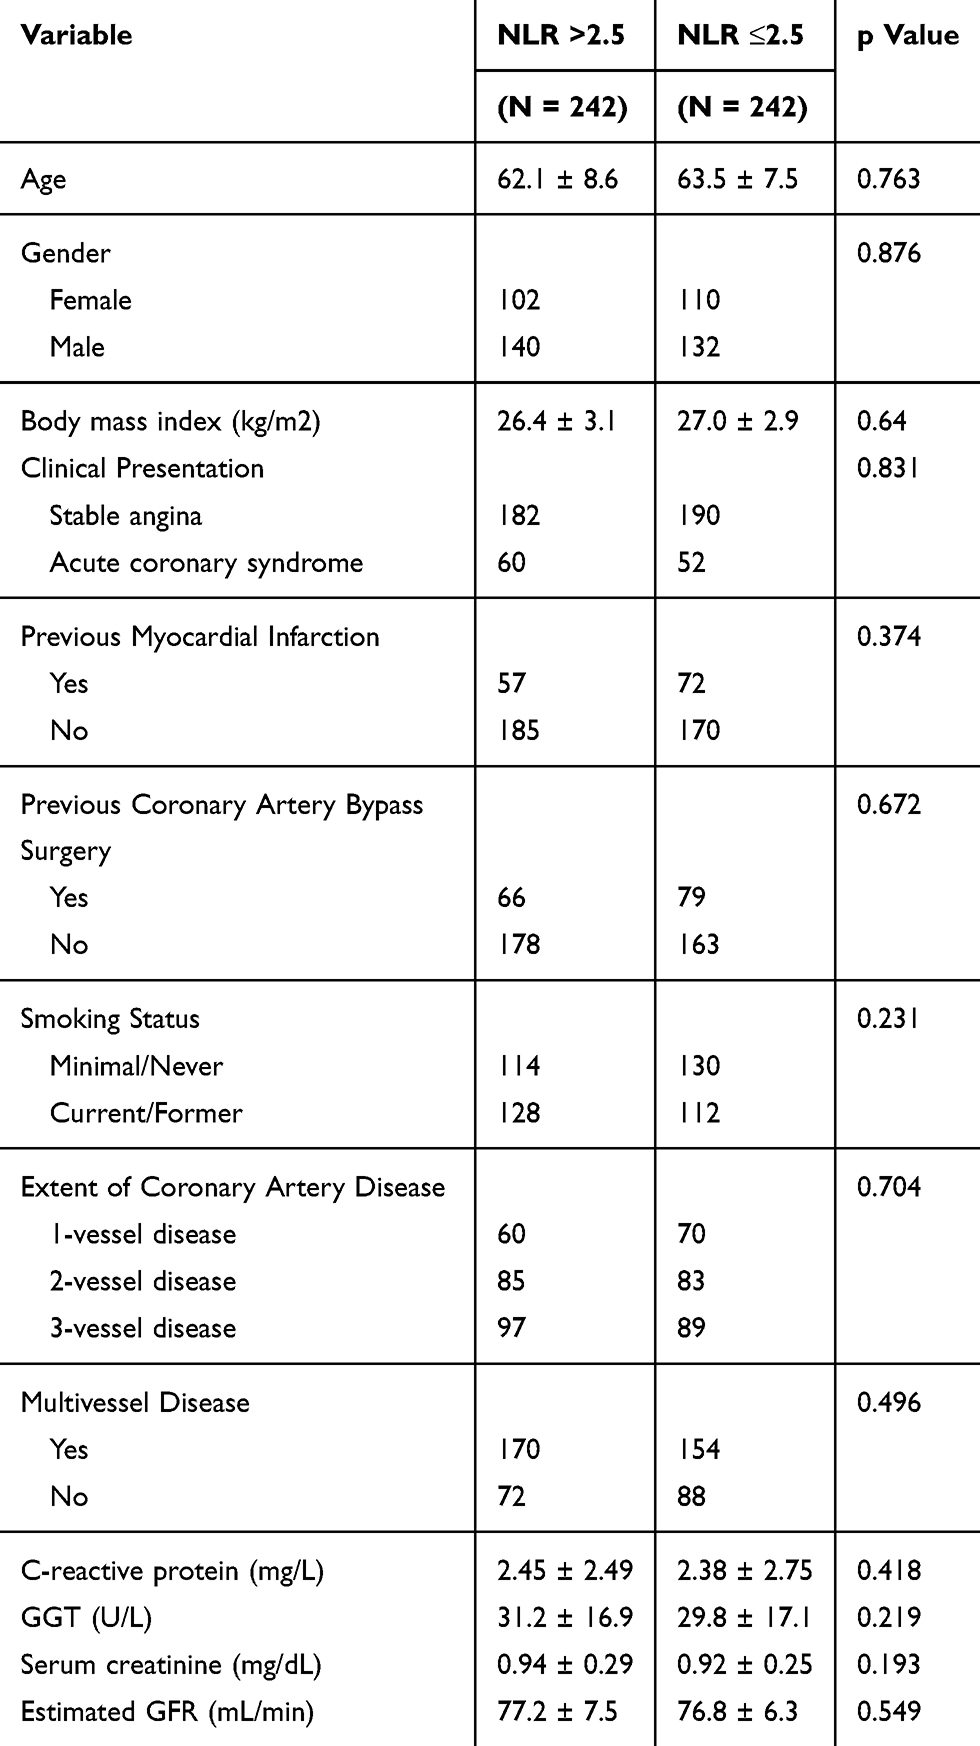 |
Table 2 Patients’ Characteristics After Propensity Score Matching |
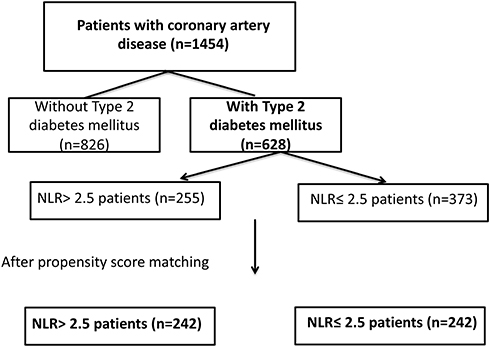 |
Figure 1 Study flow chart. |
Survival Analysis of Patients with CAD with Respect to NLR
In this study, we performed ROC analysis to confirm 2.5 as the cut-off value of NLR according to the overall survival of patients with CAD. After then, we performed survival analysis to identify the factors associated with prognosis of patients with CAD. After propensity score matching, a total of 242 pairs of patients with both CAD and T2DM were selected. Comparisons of matched group are demonstrated in Table 2. No statistical significance was shown between the two groups (P >0.05). Before propensity matching, there was no significant association of NLR with an increased risk of OS (HR: 1.121, 95% CI: 0.954–1.452, p=0.187, Figure 2A) in our study. After propensity matching, there was a significant association of NLR with an increased risk of OS (HR 1.804, 95% CI 1.437–3.201, p=0.001, Figure 2B).
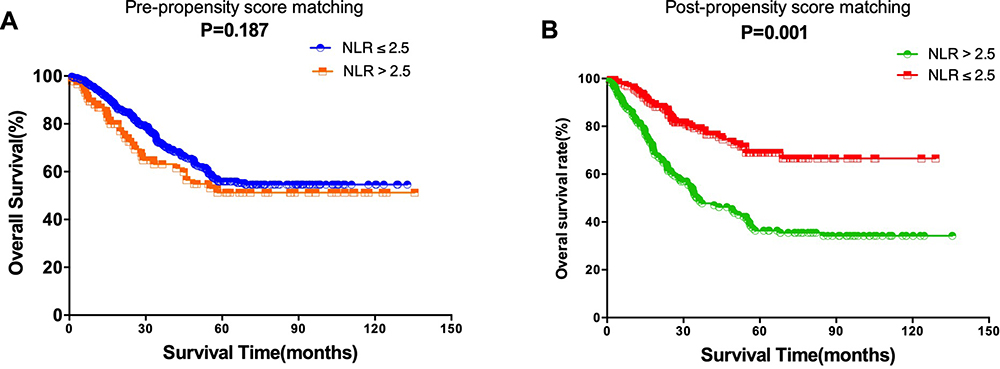 |
Figure 2 (A) Overall survival (OS) for different groups divided by NLR before propensity score matching (p=0.187); (B) Overall survival (OS) for different groups divided by NLR after propensity score matching (p=0.001). |
Predictors Associated with Clinical Outcomes
After adjusting for competing for risk factors, a multivariable analysis showed that NLR ≤2.5 (HR: 2.576, 95% CI: 1.241–4.583, P =0.001) and extent of coronary artery disease (HR: 2.432, 95% CI: 1.189–4.392, P =0.005) remained independent predictors of OS. The details are shown in Figure 3.
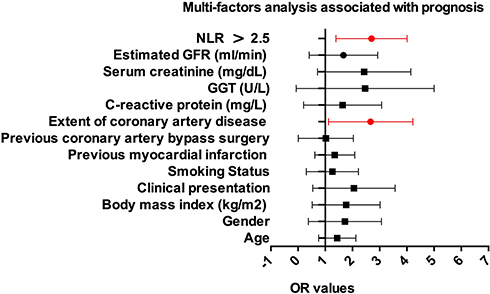 |
Figure 3 Cox proportional hazards models were used to quantify the prognostic significance of risk factors after multivariable adjustment. |
Discussion
Previous results demonstrated that systemic inflammation biomarkers and mortality are strengthened when both CAD and T2DM were presented.29–31 The current study confirms the results of previous studies and further supports the link between NLR and CAD and total mortality in patients with diabetes. Considering the association between systemic inflammation and cardiovascular risk factors, the observed association between systemic inflammation and mortality can be explained by the presence of cardiovascular risk factors. Cardiovascular risk factors are more likely to increase in NLR. Neutrophil to lymphocyte ratio (NLR) has been found to be associated with glucose control in type 2 diabetes mellitus (T2DM) in recent literature.11 It is also useful in the differentiation of thyroid nodules,12 in thyroiditis,13 in heart failure,14 in ulcerative colitis,15 and in alcoholic hepatitis.16 This article details a new method for pairing using propensity scores in a retrospective cohort study, comparing the efficacy of patients with coronary heart disease and type 2 diabetes with an NLR> 2.5 group to the usual NLR ≤2.5 group. Propensity scores provide a statistically and logically more effective way to register for retrospective cohort studies than alternative study designs.32,33 Propensity score analysis is a statistical method that was introduced in 1983 and applied to various clinical researches. Propensity score analysis can effectively adjust for confounders in a retrospective observational study, thus facilitating comparability between patient groups.34–37 Although still infrequently used in cardiac research studies, propensity score analysis is increasingly applied in clinical research. The purpose of this article was to provide a step-by-step nonmathematical conceptual guide to propensity score analysis from a cardiac research point of view with particular emphasis on propensity score matching.
This study demonstrates that an NLR assessment based on pre-treatment whole blood counts can independently predict survival in patients with coronary heart disease and type 2 diabetes. This result is consistent with previously published literature showing that patients with type 2 diabetes have high NLR and poor prognosis.38,39 Yet, the cutoff value of the NLR is inconsistent in these above studies, which reduces its clinical applicability, we think the impact of the NLR has been explored as a continuous explanatory variable and it is affected by the patients' baselines and therapeutic approaches. Therefore, we explored the pretreatment value of 2.5 as the most appropriate cut-off value, not only taking into account statistical sensitivity and specificity, but also considering clinical significance. Our data indicate that, after matching for propensity scores, the median OS of patients in the NLR >2.5 group was much shorter than in patients in the NLR≤2.5 group. The neutrophil–lymphocyte ratio (NLR) is considered to be one of the signs of a systemic inflammatory response and is of great value in predicting the prognosis of various diseases.40–42 Clearly, the challenge remains to identify reliable, cost-effective biomarkers to determine which patients are most likely to continue to develop several diseases.
In summary, high NLR values can independently predict low survival rates for patients with coronary heart disease and type 2 diabetes. NLR can help physicians assess a patient’s prognosis and select alternative therapies for patients with high NLR values.
Disclosure
The authors who have taken part in this study declared that they have nothing to disclose regarding funding or conflict of interest with respect to this manuscript.
References
1. Rajabi M, Mansourian A, Pilesjo P, Astrom DO, Cederin K, Sundquist K. Exploring spatial patterns of cardiovascular disease in Sweden between 2000 and 2010. Scand J Public Health. 2018;46:647–658. doi:10.1177/1403494818780845
2. Rodriguez A, Pajukanta P. Genomics and systems biology approaches in the study of lipid disorders. Rev Invest Clin. 2018;70:217–223. doi:10.24875/RIC.18002576
3. Bowry AD, Lewey J, Dugani SB, Choudhry NK. The burden of cardiovascular disease in low- and middle-income countries: epidemiology and management. Can J Cardiol. 2015;31:1151–1159. doi:10.1016/j.cjca.2015.06.028
4. Ren YC, Liu Y, Sun XZ, et al. Prevalence and relationship of hypertriglyceridaemic-waist phenotype and type 2 diabetes mellitus among a rural adult Chinese population. Public Health Nutr. 2019;1–6.
5. Lascar N, Brown J, Pattison H, Barnett AH, Bailey CJ, Bellary S. Type 2 diabetes in adolescents and young adults. Lancet Diabetes Endocrinol. 2018;6:69–80. doi:10.1016/S2213-8587(17)30186-9
6. Katsiki N, Purrello F, Tsioufis C, Mikhailidis DP. Cardiovascular disease prevention strategies for type 2 diabetes mellitus. Expert Opin Pharmacother. 2017;18:1243–1260. doi:10.1080/14656566.2017.1351946
7. Geiker NRW, Larsen ML, Dyerberg J, Stender S, Astrup A. Egg consumption, cardiovascular diseases and type 2 diabetes. Eur J Clin Nutr. 2018;72:44–56. doi:10.1038/ejcn.2017.153
8. Martin-Timon I, Sevillano-Collantes C, Segura-Galindo A, Del Canizo-Gomez FJ. Type 2 diabetes and cardiovascular disease: have all risk factors the same strength? World J Diabetes. 2014;5:444–470. doi:10.4239/wjd.v5.i4.444
9. A joint editorial statement by the American Diabetes Association; The National Heart, Lung, and Blood Institute; The Juvenile Diabetes Foundation International; The National Institute of Diabetes and Digestive and Kidney Diseases; and The American Heart Association. Diabetes mellitus: a major risk factor for cardiovascular disease. Circulation. 1999;100:1132–1133. doi:10.1161/01.cir.100.10.1132
10. Bravo PE, Psaty BM, Di Carli MF, Branch KR. Identification of coronary heart disease in asymptomatic individuals with diabetes mellitus: to screen or not to screen. Colomb Med (Cali). 2015;46:41–46.
11. Duman TT, Aktas G, Atak BM, Kocak MZ, Erkus E, Savli H. Neutrophil to lymphocyte ratio as an indicative of diabetic control level in type 2 diabetes mellitus. Afr Health Sci. 2019;19:1602–1606. doi:10.4314/ahs.v19i1.35
12. Sit M, Aktas G, Erkol H, Yaman S, Keyif F, Savli H. Neutrophil to lymphocyte ratio is useful in differentiation of Malign and Benign thyroid nodules. P R Health Sci J. 2019;38:60–63.
13. Aktas G, Sit M, Dikbas O, et al. Elevated neutrophil-to-lymphocyte ratio in the diagnosis of Hashimoto’s thyroiditis. Rev Assoc Med Bras. 2017;63:1065–1068. doi:10.1590/1806-9282.63.12.1065
14. Cho JH, Cho HJ, Lee HY, et al. Neutrophil-lymphocyte ratio in patients with acute heart failure predicts in-hospital and long-term mortality. J Clin Med. 2020;9. doi:10.3390/jcm9020557
15. Posul E, Yilmaz B, Aktas G, Kurt M. Does neutrophil-to-lymphocyte ratio predict active ulcerative colitis? Wien Klin Wochenschr. 2015;127:262–265. doi:10.1007/s00508-014-0683-5
16. Abu Omar Y, Randhawa T, Attar B, et al. Prognostic value of neutrophil-lymphocyte ratio in patients with severe alcoholic hepatitis. Cureus. 2019;11:e6141.
17. Forget P, Khalifa C, Defour JP, Latinne D, Van Pel MC, De Kock M. What is the normal value of the neutrophil-to-lymphocyte ratio? BMC Res Notes. 2017;10:12. doi:10.1186/s13104-016-2335-5
18. Ethier JL, Desautels D, Templeton A, Shah PS, Amir E. Prognostic role of neutrophil-to-lymphocyte ratio in breast cancer: a systematic review and meta-analysis. Breast Cancer Res. 2017;19:2. doi:10.1186/s13058-016-0794-1
19. Templeton AJ, McNamara MG, Seruga B, et al. Prognostic role of neutrophil-to-lymphocyte ratio in solid tumors: a systematic review and meta-analysis. J Natl Cancer Inst. 2014;106:dju124. doi:10.1093/jnci/dju124
20. Xu T, Weng Z, Pei C, et al. The relationship between neutrophil-to-lymphocyte ratio and diabetic peripheral neuropathy in type 2 diabetes mellitus. Medicine (Baltimore). 2017;96:e8289. doi:10.1097/MD.0000000000008289
21. Liu S, Zheng H, Zhu X, et al. Neutrophil-to-lymphocyte ratio is associated with diabetic peripheral neuropathy in type 2 diabetes patients. Diabetes Res Clin Pract. 2017;130:90–97. doi:10.1016/j.diabres.2017.05.008
22. Li X, Shen J, Lu Z, Chen M, Fang X, Wang G. High neutrophil-to-lymphocyte ratio is associated with increased carotid artery intima-media thickness in type 2 diabetes. J Diabetes Investig. 2017;8:101–107. doi:10.1111/jdi.12541
23. Liu N, Sheng J, Pan T, Wang Y. Neutrophil to lymphocyte ratio and platelet to lymphocyte ratio are associated with lower extremity vascular lesions in Chinese patients with type 2 diabetes. Clin Lab. 2019;65.
24. Ye T, Yang Y, Wang K, et al. [Neutrophil to lymphocyte ratio as a predictor for type 2 diabetes mellitus in patients with chronic obstructive pulmonary disease: a cohort study of 404 cases]. Nan Fang Yi Ke Da Xue Xue Bao. 2017;37:1308–1314. Chinese.
25. Yilmaz H, Ucan B, Sayki M, et al. Usefulness of the neutrophil-to-lymphocyte ratio to prediction of type 2 diabetes mellitus in morbid obesity. Diabetes Metab Syndr. 2015;9:299–304. doi:10.1016/j.dsx.2014.04.009
26. Hanley JA. Receiver operating characteristic (ROC) methodology: the state of the art. Crit Rev Diagn Imaging. 1989;29:307–335.
27. Kaplan EL, Meier P. Nonparametric estimations from incomplete observations. J Am Stat Assoc. 1958;53:457–481. doi:10.1080/01621459.1958.10501452
28. Cox DR. Regression models and life-tables. J Royal Stat Soc B. 1972;34:187–220.
29. Malik M, Suboc TM, Tyagi S, et al. Lactobacillus plantarum 299v supplementation improves vascular endothelial function and reduces inflammatory biomarkers in men with stable coronary artery disease. Circ Res. 2018;123:1091–1102. doi:10.1161/CIRCRESAHA.118.313565
30. Tani S, Nagao K, Hirayama A. Association of systemic inflammation with the serum apolipoprotein A-1 level: a cross-sectional pilot study. J Cardiol. 2016;68:168–177. doi:10.1016/j.jjcc.2015.08.016
31. Rein P, Saely CH, Silbernagel G, et al. Systemic inflammation is higher in peripheral artery disease than in stable coronary artery disease. Atherosclerosis. 2015;239:299–303. doi:10.1016/j.atherosclerosis.2015.01.021
32. Johnson ES, Dickerson JF, Vollmer WM, et al. The feasibility of matching on a propensity score for acupuncture in a prospective cohort study of patients with chronic pain. BMC Med Res Methodol. 2017;17:42. doi:10.1186/s12874-017-0318-4
33. Baek S, Park SH, Won E, Park YR, Kim HJ. Propensity score matching: a conceptual review for radiology researchers. Korean J Radiol. 2015;16:286–296. doi:10.3348/kjr.2015.16.2.286
34. Penning de Vries BBL, Groenwold RHH. Cautionary note: propensity score matching does not account for bias due to censoring. Nephrol Dial Transplant. 2018;33:914–916. doi:10.1093/ndt/gfx198
35. Duhamel A, Labreuche J, Gronnier C, Mariette C. Statistical tools for propensity score matching. Ann Surg. 2017;265:E79–e80. doi:10.1097/SLA.0000000000001312
36. Desai RJ, Rothman KJ, Bateman BT, Hernandez-Diaz S, Huybrechts KF. A propensity-score-based fine stratification approach for confounding adjustment when exposure is infrequent. Epidemiology. 2017;28:249–257. doi:10.1097/EDE.0000000000000595
37. Andrade C. Propensity score matching in nonrandomized studies: a concept simply explained using antidepressant treatment during pregnancy as an example. J Clin Psychiatry. 2017;78:e162–e165. doi:10.4088/JCP.17f11446
38. Lin GN, Peng JW, Liu PP, Liu DY, Xiao JJ, Chen XQ. Elevated neutrophil-to-lymphocyte ratio predicts poor outcome in patients with advanced non-small-cell lung cancer receiving first-line gefitinib or erlotinib treatment. Asia Pac J Clin Oncol. 2017;13:e189–e194. doi:10.1111/ajco.12273
39. Go SI, Lee A, Lee US, et al. Clinical significance of the neutrophil-lymphocyte ratio in venous thromboembolism patients with lung cancer. Lung Cancer. 2014;84:79–85. doi:10.1016/j.lungcan.2014.01.014
40. He W, Yin C, Guo G, et al. Initial neutrophil lymphocyte ratio is superior to platelet lymphocyte ratio as an adverse prognostic and predictive factor in metastatic colorectal cancer. Med Oncol. 2013;30:439. doi:10.1007/s12032-012-0439-x
41. Kobayashi N, Usui S, Kikuchi S, et al. Preoperative lymphocyte count is an independent prognostic factor in node-negative non-small cell lung cancer. Lung Cancer. 2012;75:223–227. doi:10.1016/j.lungcan.2011.06.009
42. Jung MR, Park YK, Jeong O, et al. Elevated preoperative neutrophil to lymphocyte ratio predicts poor survival following resection in late stage gastric cancer. J Surg Oncol. 2011;104:504–510. doi:10.1002/jso.21986
 © 2020 The Author(s). This work is published and licensed by Dove Medical Press Limited. The full terms of this license are available at https://www.dovepress.com/terms.php and incorporate the Creative Commons Attribution - Non Commercial (unported, v3.0) License.
By accessing the work you hereby accept the Terms. Non-commercial uses of the work are permitted without any further permission from Dove Medical Press Limited, provided the work is properly attributed. For permission for commercial use of this work, please see paragraphs 4.2 and 5 of our Terms.
© 2020 The Author(s). This work is published and licensed by Dove Medical Press Limited. The full terms of this license are available at https://www.dovepress.com/terms.php and incorporate the Creative Commons Attribution - Non Commercial (unported, v3.0) License.
By accessing the work you hereby accept the Terms. Non-commercial uses of the work are permitted without any further permission from Dove Medical Press Limited, provided the work is properly attributed. For permission for commercial use of this work, please see paragraphs 4.2 and 5 of our Terms.