")
Back to Journals » Neuropsychiatric Disease and Treatment » Volume 16
Neuropsychological Comparison Between Patients with Social Anxiety and Healthy Controls: Weak Central Coherence and Visual Scanning Deficit
Authors Okawa S, Hamatani S , Hayashi Y, Arai H, Nihei M, Yoshida T, Takahashi J, Shimizu E, Hirano Y
Received 25 September 2020
Accepted for publication 31 October 2020
Published 25 November 2020 Volume 2020:16 Pages 2849—2855
DOI https://doi.org/10.2147/NDT.S283950
Checked for plagiarism Yes
Review by Single anonymous peer review
Peer reviewer comments 3
Editor who approved publication: Dr Taro Kishi
Sho Okawa,1– 3 Sayo Hamatani,2,4 Yuta Hayashi,5,6 Honami Arai,2,7 Masato Nihei,2,4 Tokiko Yoshida,2 Jumpei Takahashi,1,2 Eiji Shimizu,2,3 Yoshiyuki Hirano1,2
1United Graduate School of Child Development, Osaka University, Suita, Osaka 565-0871, Japan; 2Research Center of Child Mental Development, Chiba University, Chiba-shi, Chiba 260-8670, Japan; 3Department of Cognitive Behavioral Physiology, Chiba University, Chiba-shi, Chiba 260-8670, Japan; 4Japan Society for the Promotion of Science, Chiyoda-ku, Tokyo 102-0083, Japan; 5Department of Nursing, Graduate School of Health Sciences, Kobe University, Suma-ku, Kobe 654-0142, Japan; 6Graduate School of Medicine and Veterinary Medicine, University of Miyazaki, Miyazaki 889-1692, Japan; 7Faculty of Human Sciences, Tsukuba University, Bunkyo City, Tokyo 112-0012, Japan
Correspondence: Yoshiyuki Hirano
Research Center of Child Mental Development, Chiba University, 1-8-1, Inohana, Chuo Ward, Chiba-shi, Chiba 260-8670, Japan
Tel +81-43-226-2975
Fax +81-43-226-8588
Email [email protected]
Introduction: Although deficits in neuropsychological functioning have been reported in social anxiety disorder (SAD), studies focusing on neuropsychological dysfunction in SAD are limited, and the evidence is still lacking. The purpose of this study was to examine the deficits in neuropsychological functioning in patients with SAD by comparing SAD patients and a healthy control (HC) group.
Materials and Methods: A total of 72 participants (20 in the SAD group and 52 in the HC group) were assessed with neuropsychological tests, consisting of the Rey Complex Figure Test (RCFT) to measure central coherence and the Trail Making Test A and B (TMT-A; TMT-B) to measure visual scanning and executive functioning.
Results: Analysis of covariance with depressive symptoms as a covariate revealed that central coherence (RCFT) and visual scanning (TMT-A) were significantly lower in the SAD group than in the HC group. No difference was found in executive functioning (TMT-B) when the effect of visual scanning was considered.
Discussion: Our findings suggest that SAD patients have weak central coherence and deficits in visual scanning compared to healthy controls. The clinical implications of these neuropsychological functioning deficits in SAD patients are discussed.
Keywords: social anxiety disorder, neuropsychological functioning, central coherence, visual scanning, executive functioning
Introduction
Social anxiety disorder (SAD) is characterized by a marked and persistent fear of social situations.1 SAD is one of the most common anxiety disorders, with a lifetime prevalence rate of 10.7%.2 For SAD, cognitive behavioral therapy (CBT) and pharmacotherapy are the first-line treatments.3 However, approximately 40−60% of patients fail to respond to pharmacotherapy.4,5 Although CBT is effective for those patients, the remission rate of SAD is 40.1% post-treatment, indicating there is still room for improvement.6,7 Some CBT techniques for SAD are derived from cognitive psychology (eg, attentional bias modification), and the cognitive process plays an important role in treatment.8 Thus, to improve treatment effects for SAD patients, it is necessary to understand the cognitive factors specific to SAD patients.
A previous systematic review of 30 studies examining neuropsychological testing in general suggested that SAD is related to neuropsychological dysfunction.9 However, only 6 out of those 30 studies primarily focused on neuropsychological functioning, while the others focused on cognitive bias. Hence, evidence regarding neuropsychological dysfunction in SAD patients is still lacking.9 One neuropsychological test widely used in SAD research is the Trail Making Test (TMT). The TMT is composed of two parts: the TMT-A measures visual scanning, and the TMT-B measures executive function. Comparisons of TMT-A results between SAD patients and healthy controls (HC) in several studies indicated that SAD patients have a deficit in visual scanning.10,11 Therefore, the evidence for visual scanning deficits in SAD patients is solid. In contrast, results for the TMT-B varied in these studies. Specifically, Fujii et al11 reported no difference between SAD patients and healthy individuals, while Cohen et al10 reported a significant difference between SAD patients and HCs. However, although inconsistencies regarding executive function deficits among SAD patients exist, a more discernable pattern can emerge by considering specific cognitive domains.
Another neuropsychological function previously examined in SAD research is central coherence, as measured by the Rey Complex Figure Test (RCFT). Weak central coherence indicates a tendency to focus on detailed information, with difficulties in switching one’s attention to global information.12 This processing bias leads to an inability to integrate information within the proper context.13 A few studies have examined the relationship between SAD and RCFT performance; however, each study used a different scoring system, and no study found a relationship between SAD and the RCFT.14–16 For example, one study compared 41 individuals with anxiety disorders and 27 individuals with no mental health disorders by using precision and the location of each part in the figures as outcome variables,14 while another study that compared 25 individuals who met SAD criteria and 25 individuals who did not meet any psychiatric criteria used the RCFT to examine participants’ ability to reproduce the figures.15 No studies have directly measured central coherence, which consist of both the order index (drawing a global or local element first) and style index (degree of coherency in drawing).17 Thus, whether SAD patients have deficits in central coherence is still unknown.
Neuropsychological dysfunction in anxiety disorders can be explained by the attentional control theory (ACT).18 ACT assumes a bidirectional influence from attentional control to anxiety, and from anxiety to attentional control. A high level of anxiety impairs the efficiency of neuropsychological functioning, and poor neuropsychological functioning can be a risk factor for anxiety.18 A meta-analysis of 58 studies found that participants with high anxiety levels tended to have greater attentional control deficits, compared to those with low anxiety levels, with a medium effect size (Hedges’ g = −0.58).19 Thus, on the basis of ACT, it could be assumed that SAD patients have deficits in neuropsychological functioning.
The purpose of the present study was to examine neuropsychological dysfunction in SAD by comparing patients with SAD and an HC group. Our first hypothesis was that the SAD group would have lower central coherence than the HC group. Previous studies failed to find a difference in RCFT results between SAD and HC groups; however, they did not use the central coherence index (CCI) as an outcome measure.14–16 Therefore, we used the CCI to measure RCFT outcomes in this study. The second hypothesis was that SAD patients would show deficits in visual scanning and executive function, compared with HCs. Although several studies reported that SAD patients have low visual scanning ability, findings on the differences in executive function between SAD patients and HCs have been inconsistent.10,11 Since the findings regarding neuropsychological dysfunction in SAD patients also tend to be inconsistent across studies, adding more data to current literature in the field would be beneficial for increasing understanding of the role of neuropsychological dysfunction in SAD.
Materials and Methods
Participants
This study collected data from 72 participants, who were divided into SAD and HC groups. The SAD group, included 20 participants (13 male, 7 female), with an age range of 15 to 46 years (mean = 27.2, SD = 9.24). Patients with SAD were recruited through referrals from Chiba University Hospital. All patients in the SAD group were diagnosed by a psychiatrist using the Mini-International Neuropsychiatric Interview for the DSM-IV-TR or DSM-5. Exclusion criteria for the SAD group were: (1) any organic central nervous system disorder, (2) psychosis, (3) intellectual disability, (4) high risk of suicide, (5) substance abuse or dependence, or (6) unstable medical condition. Participants in the HC group were recruited through posters displayed at Chiba University and a participant recruitment website. Participants were excluded from the HC group if they had a history of mental health disorders. The HC group included 52 participants (35 male, 17 female), with an age range of 19 to 69 years (mean = 26.96, SD = 10.21).
Ethical approval was obtained from the Ethics Committee of Chiba University (study number 2120). Written informed consent was obtained from each participant and, a parent provided informed consent for any participant under the legal age of majority. This study was conducted in accordance with the Declaration of Helsinki.
Measures
Liebowitz Social Anxiety Scale
We used the Liebowitz Social Anxiety Scale (LSAS)20 to evaluate social anxiety symptoms. The LSAS contains 24 items for rating fear and 24 for avoidance, and each item is rated on a 4-point scale. The Japanese version of the LSAS21 has been shown to have excellent internal consistency reliability (α = 0.95) and convergent validity.21,22 Higher scores reflect higher levels of social anxiety symptoms.
Beck Depression Inventory-II
Since prior studies suggested that depressive symptoms are related to neuropsychological functioning,9 we used the Beck Depression Inventory-II (BDI-II) to evaluate depressive symptoms.23 The BDI-II consists of 21 items, and each item is rated on a 4-point scale. The Japanese version of the BDI-II has demonstrated good internal consistency reliability (Cronbach’s α = 0.87) and convergent validity.24 Higher scores reflect more severe levels of depression.
Rey Complex Figure Test
The RCFT25 is a neuropsychological task that measures central coherence.26 Participants were asked to copy a figure on a blank piece of paper using a pencil or on a tablet with a tap pencil. For the RCFT, those who participated before March 2019 used paper, while all those who participated after April 2019 used a tablet. The administration of the RCFT to all participants was video recorded to allow other researchers to score the test or confirm the scoring. The style index, order index, and CCI were calculated.17 The style index measures whether the drawing process is fragmented or coherent, while the order index measures whether the participants prefer global or detailed elements. The CCI, which measures central coherence, is calculated from the style index and the order index. This scoring system has been used in several previous studies.27,28 A higher score reflects higher global processing.
Trail Making Test
The TMT29 consists of two parts: the TMT-A and TMT-B. Participants were asked to draw lines to connect randomly located numbers from 1 to 26 in the TMT-A. In the TMT-B, participants were required to connect the randomly located numbers and hiragana (Japanese syllabary) alternately (eg, 1-あ-2-い).30 Scores for both the TMT-A and TMT-B are the amount of time required to connect all the characters. The TMT-A measures visual scanning and psychomotor speed, whereas the TMT-B measures executive function. We also calculated the difference between the TMT-A and TMT-B (B-A) as well as the ratio of the two parts (B/A) to adjust the effects of motor speed and visual scanning ability in executive function. The test-retest reliability for the TMT-A and TMT-B was confirmed in a previous study.31 A longer time required to complete the task indicates poorer performance.
Statistical Analyses
All analyses were conducted using Stata 16 (Stata Corp, College Station). Two missing values for the SAD group in the TMT-A and TMT-B were omitted from the analyses. We first examined differences in demographic and clinical measures between groups by using a series of chi-square tests and independent two-sample t-tests. We then compared neurocognitive performance using analysis of covariance (ANCOVA). Outcomes of each neuropsychological test were entered as the dependent variable, and the BDI-II was included as a covariate. Effect sizes were evaluated using eta-squared (η2) and were interpreted to be small (0.01), medium (0.06), or large (0.14).32
Results
The means and standard deviations (SD) for demographic data and each measurement in the SAD and HC groups are shown in Table 1. There were no significant differences in demographic data between groups (gender: χ2 (1) = 0.035, p = 0.852; age: t (70) = 0.091, p = 0.928; education: t (61) = −1.80, p = 0.078). We found significant differences in LSAS (t (70) = 9.84, p < 0.001) and BDI-II (t (70) = 5.04, p < 0.001) scores. Although some prior studies suggested that depressive symptoms are related to neuropsychological functioning,9 we found no association between depressive symptoms and any measures of neuropsychological functioning in both the SAD (p = 0.342 to 0.946) and HC groups (p = 0.180 to 0.761), based on Pearson’s correlation analysis. However, the difference in depressive symptoms between groups may have affected the neuropsychological performance results. Thus, we set the BDI-II as a covariate in the ANCOVA to examine the differences in neuropsychological test scores between groups.
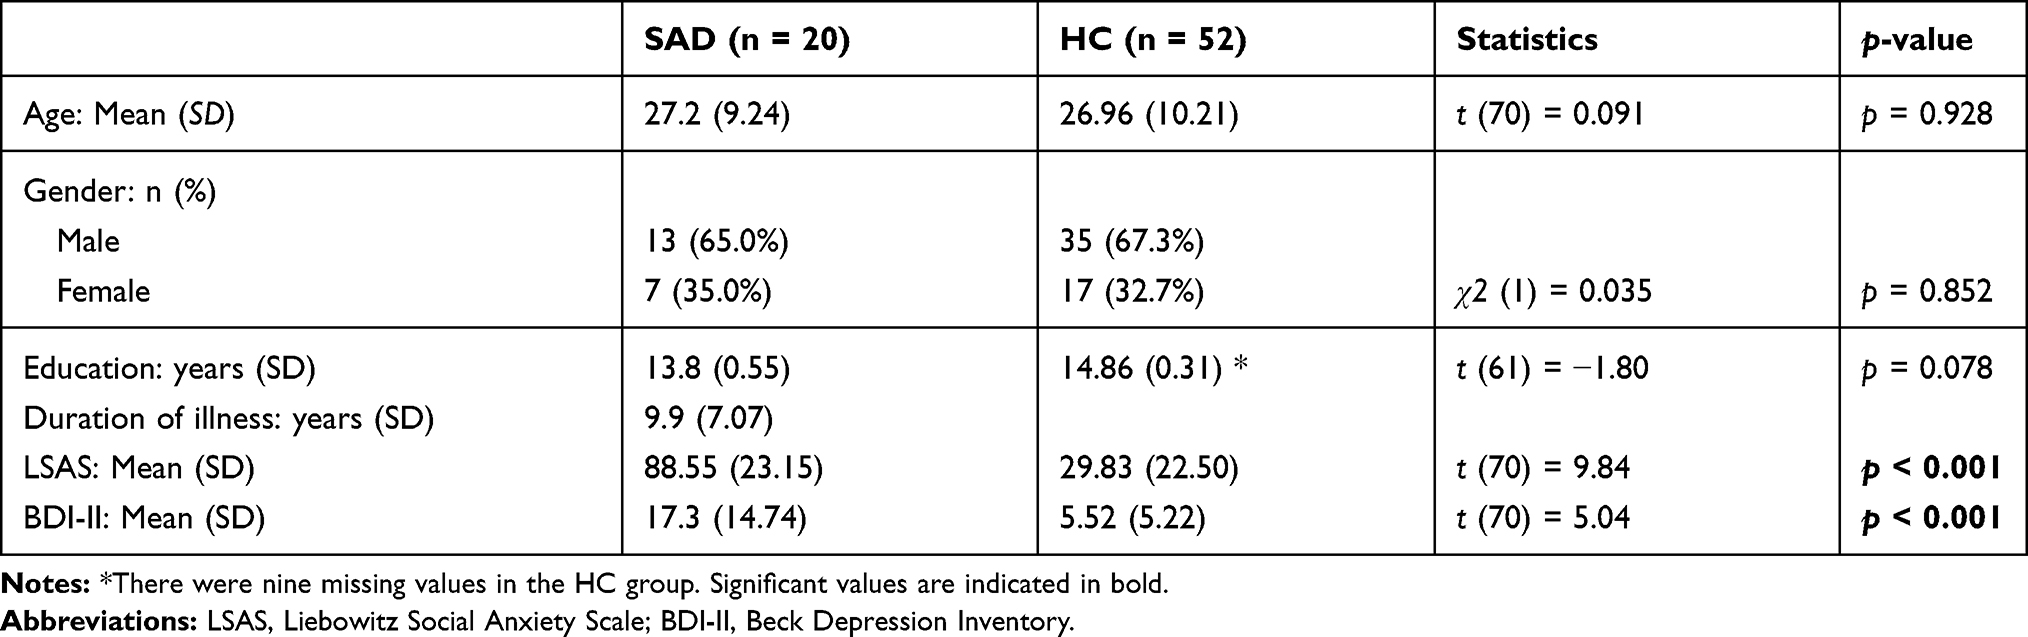 |
Table 1 Demographic Data and Clinical Measures |
Table 2 presents the neuropsychological test scores for the SAD and HC groups and the ANCOVA results. The SAD group showed poorer global processing than the HC group (CCI: F (1, 46) = 4.35, p < 0.05, η2 = 0.086) after controlling for BDI-II scores. We also found significant differences in the TMT-A (F (1, 45) = 29.47, p <0.001, η2 = 0.395) and TMT-B (F (1, 45) = 13.39, p < 0.001, η2 = 0.229) results between groups after controlling for BDI-II scores. However, no significant differences were found in style index, order index, B-A, and B/A results between the SAD and HC groups (effect size range: η2 = 0.000 to 0.069).
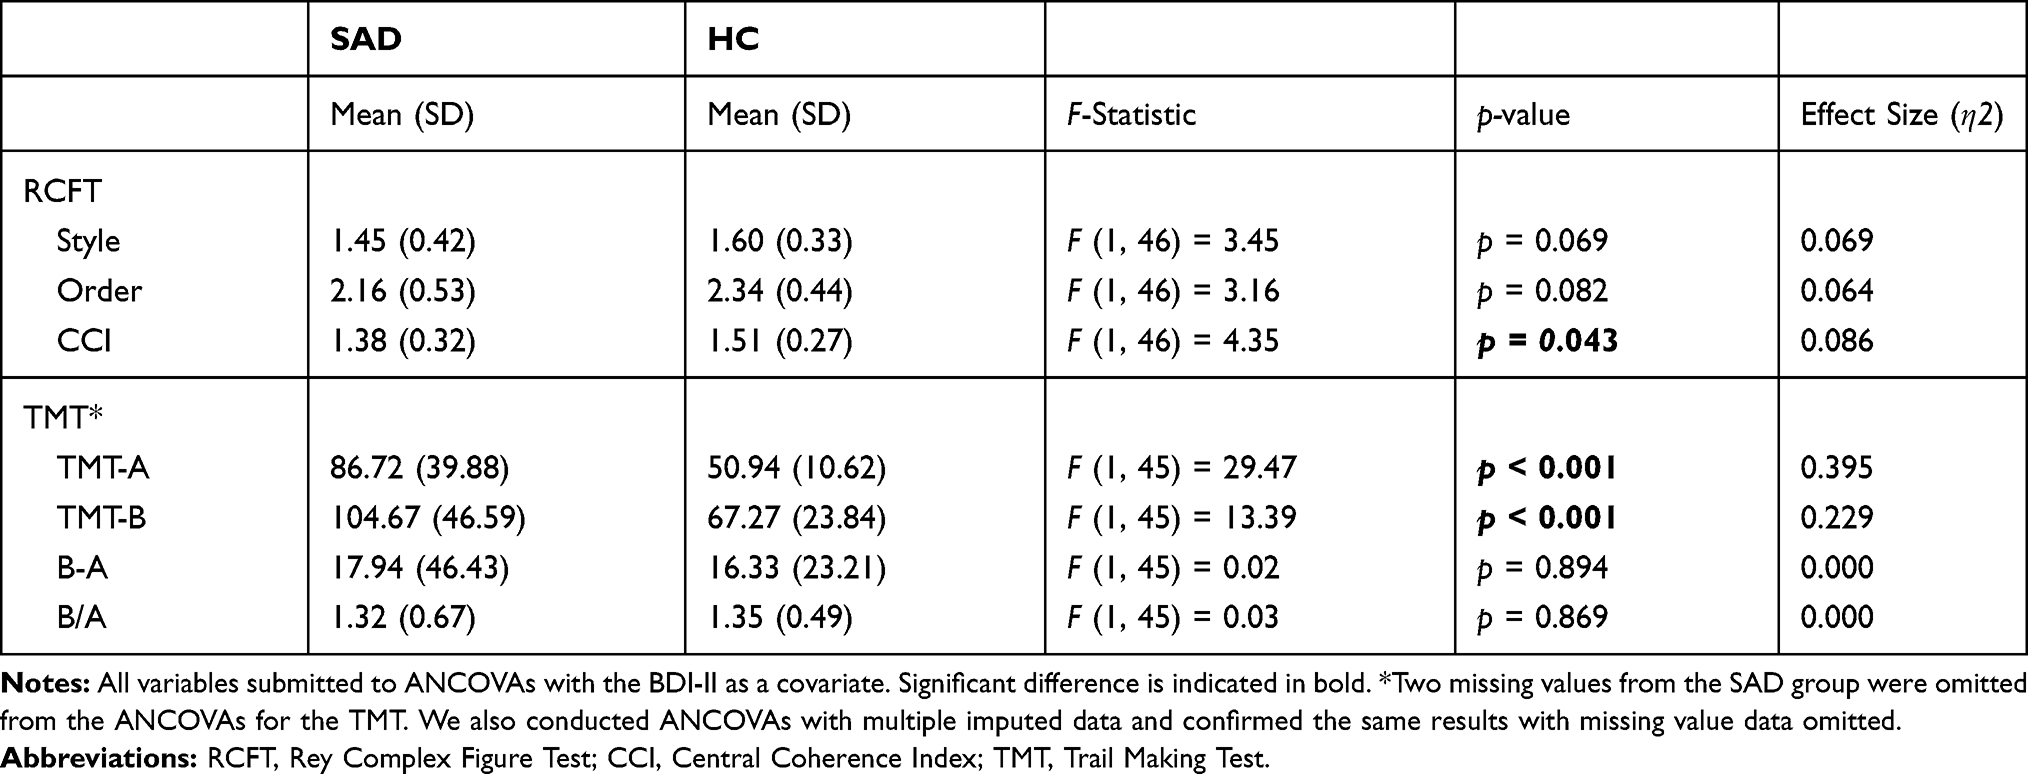 |
Table 2 Group Differences in Neuropsychological Functioning |
Discussion
The present study aimed to examine differences in neuropsychological functioning between patients with SAD and healthy individuals. We found central coherence and visual scanning were lower in SAD patients than in the HC group. The two groups also differed significantly in TMT-B results; however, this significant difference disappeared when controlling for the effect of visual scanning. To our knowledge, this is the first study to examine weak central coherence in SAD using a direct measurement of central coherence.
The first hypothesis (ie, the SAD group would have lower central coherence than the HC group) was confirmed. The ANCOVA results with the BDI-II as a covariate indicated that SAD patients had lower RCFT performance compared to HCs. This result was inconsistent with the findings of a prior study.14–16 The inconsistency can be explained by the use of different outcome measures. In this study, we used the CCI, which directly assess central coherence ability, whereas other studies used outcome measures such as precision and the location of each part of a figure to measure visuoconstructive skill using RCFT.14 From our results, it can be assumed that SAD patients tend to focus on details rather than global information. The weak central coherence in SAD patients can potentially be explained based on ACT.18 Patients with SAD might have experienced difficulties in concentrating on the task at hand,33 thus resulting in weak central coherence. Another explanation could be that weak central coherence is an individual trait caused the development of SAD. Weak central coherence in SAD is broadly consistent with previous studies from the view of mental health disorders in general. For example, a previous study found weak central coherence in patients with treatment-refractory obsessive compulsive symptoms.34 Thus, it can be inferred that SAD patients have difficulties in the process of integrating information; however, further research is needed to identify the causal mechanism of weak central coherence.
Our second hypothesis (ie, SAD patients would have deficits in visual scanning and executive function) was partially confirmed. There were significant differences in the time for both the TMT-A and TMT-B between the SAD and HC groups. Although the results of the TMT-A and TMT-B were inconsistent in previous studies,10,11 the present study supported the significant difference in the time for the TMT-A and TMT-B between groups. However, the difference in the TMT-B became nonsignificant when the effect of the TMT-A was considered (B-A and B/A). It can be suggested that the significant difference in the TMT-B was due to the effects of visual scanning and psychomotor speed. Therefore, it is likely that there are deficits in visual scanning and psychomotor speed in SAD, even when the effect of depression is controlled. However, executive function deficits were not found in SAD patients in the current study.
Our findings are relevant to the treatment of SAD patients. The present study suggests that SAD patients have weak central coherence and deficits in visual scanning and psychomotor speed. From our results, it can be inferred that neuropsychological functioning may be related to the maintenance factor of SAD. SAD symptoms are maintained through attentional bias, and there is a possibility that neuropsychological functioning underlies attentional bias. For example, weak central coherence in SAD may be related to hypervigilance to threats, which leads to information being inaccurately integrated.35 Attentional bias modification is a technique often used in CBT, and thorough understanding of the function of attention is needed to enhance the therapeutic effect.8 Our finding that weak central coherence and visual scanning deficit in SAD offers a new direction for research to support SAD patients. Further research focusing on central coherence and visual scanning may contribute to clarifying the mechanism by which CBT affects SAD to improve therapeutic effects.
Limitations
There were several limitations to this study. The sample size was small in the SAD group. As a small sample size limits the generalizability of the findings, further studies with larger sample sizes are warranted. Another limitation was that, although this study suggested that the maintenance factor of SAD may be affected by weak central coherence, we did not measure maintenance factors, such as interpretation bias or attentional bias. Therefore, future research examining the relationship between central coherence and maintenance factors of SAD is necessary. Furthermore, as the study design was cross-sectional, longitudinal research is warranted to study the causality of deficits in neuropsychological functioning and SAD.
Conclusion
Despite the limitations, this study offers valuable information about neuropsychological function deficits in SAD patients. It can be suggested that SAD patients have weak central coherence, visual scanning, and psychomotor speed, compared to healthy individuals. Thus, our results shed some light on the aspect of neuropsychological functioning in SAD.
Acknowledgments
We are grateful to all participants in this study. We also thank the staff at the Cognitive Behavioral Therapy Center of Chiba University Hospital. This work was supported by AMED (grant number JP20dm0307002) awarded to E. S. and JSPS KAKENHI (grant number 19K03309) awarded to Y. H. The funders had no role in study design, data collection and analysis, decision to publish, or preparation of the manuscript.
Disclosure
The authors report no conflicts of interest in this work.
References
1. American Psychiatric Association. Diagnostic and Statistical Manual of Mental Disorders.
2. Kessler RC, Petukhova M, Sampson NA, Zaslavsky AM, Wittchen HU. Twelve-month and lifetime prevalence and lifetime morbid risk of anxiety and mood disorders in the United States. Int J Methods Psychiatr Res. 2012;21(3):169–184. doi:10.1002/mpr.1359
3. National Institute for Health and Care Excellence. Social anxiety disorder: recognition, assessment and treatment. (Clinical guideline 159); 2013. Available from: https://www.nice.org.uk/guidance/cg159.
4. Liebowitz MR, Gelenberg AJ, Munjack D. Venlafaxine extended release vs placebo and paroxetine in social anxiety disorder. Arch Gen Psychiatry. 2005;62(2):190–198. doi:10.1001/archpsyc.62.2.190
5. Van Ameringen MA, Lane RM, Walker JR, et al. Sertraline treatment of generalized social phobia: a 20-week, double-blind, placebo-controlled study. Am J Psychiatry. 2001;158:275–281. doi:10.1176/appi.ajp.158.2.275
6. Springer KS, Levy HC, Tolin DF. Remission in CBT for adult anxiety disorders: a meta-analysis. Clin Psychol Rev. 2018;61:1–8. doi:10.1016/j.cpr.2018.03.002
7. Yoshinaga N, Matsuki S, Niitsu T, et al. Cognitive behavioral therapy for patients with social anxiety disorder who remain symptomatic following antidepressant treatment: a randomized, assessor-blinded, controlled trial. Psychother Psychosom. 2016;85(4):208–217. doi:10.1159/000444221
8. Heeren A, Mogoase C, Philippot P, McMally RJ. Attention bias modification for social anxiety: a systematic review and meta-analysis. Clin Psychol Rev. 2015;40:76–90. doi:10.1016/j.cpr.2015.06.001
9. O’Toole MS, Pedersen AD. A systematic review of neuropsychological performance in social anxiety disorder. Nord J Psychiatry. 2011;65(3):147–161. doi:10.3109/08039488.2011.565801
10. Cohen LJ, Hollander E, DeCaria CM, et al. Specificity of neuropsychological impairment in obsessive-compulsive disorder: a comparison with social phobic and normal control subjects. J Neuropsychiatry Clin Neurosci. 1996;8(1):82–85. doi:10.1176/jnp.8.1.82
11. Fujii Y, Kitagawa N, Shimizu Y, et al. Severity of generalized social anxiety disorder correlates with low executive functioning. Neurosci Lett. 2013;543:42–46. doi:10.1016/j.neulet.2013.02.059
12. Happé F, Frith U. The weak coherence account: detail-focused cognitive style in autism spectrum disorders. J Autism Dev Disord. 2006;36:5–25. doi:10.1007/s10803-005-0039-0
13. Milne E, Szczerbinski M. Global and local perceptual style, field-independence, and central coherence: an attempt at concept validation. Adv Cogn Psychol. 2009;5:1–26. doi:10.2478/v10053-008-0062-8
14. Jarros RB, Salum GA, Silva CTB, et al. Attention, memory, visuoconstructive, and executive task performance in adolescents with anxiety disorders: a case-control community study. Trends Psychiatry Psychother. 2017;39(1):5–11. doi:10.1590/2237-6089-2016-0032
15. Sutterby SR, Bedwell JS. Lack of neuropsychological deficits in generalized social phobia. PLoS One. 2012;7(8):e42675. doi:10.1371/journal.pone.0042675
16. O’Toole MS, Pedersen AD, Hougaard E, Rosenberg NK. Neuropsychological test performance in social anxiety disorder. Nord J Psychiatry. 2015;69(6):444–452. doi:10.3109/08039488.2014.997288
17. Lang K, Roberts M, Harrison A, et al. Central coherence in eating disorders: a synthesis of studies using the rey osterrieth complex figure test. PLoS One. 2016;11(11):e0165467. doi:10.1371/journal.pone.0165467
18. Eysenck MW, Derakshan N. New perspectives in attentional control theory. Pers Individ Dif. 2011;50(7):955–960. doi:10.1016/j.paid.2010.08.019
19. Shi R, Sharpe L, Abbott M. A meta-analysis of the relationship between anxiety and attentional control. Clin Psychol Rev. 2019;72:101754. doi:10.1016/j.cpr.2019.101754
20. Liebowitz MR. Social phobia. Mod Probl Pharmacopsychiatry. 1987;22:141–173. doi:10.1159/000414022
21. Asakura S, Inoue S, Sasaki F, et al. Reliability and validity of the Japanese version of the liebowitz social anxiety scale. Seishin Igaku. 2002;44(10):1077–1084.
22. Okajima I, Kanai Y, Chen J, Sakano Y. Factor structure of the Japanese version of Liebowitz Social Anxiety Scale (LSAS): a confirmatory factor analysis. Seishin Igaku. 2007;49:829–835.
23. Beck AT, Steer RA, Brown GK. Manual for the Beck Depression Inventory.
24. Kojima M, Furukawa TA, Takahashi H, Kawai M, Nagaya T, Tokudome S. Cross-cultural validation of the beck depression inventory-II in Japan. Psychiatry Res. 2002;110(3):291–299. doi:10.1016/S0165-1781(02)00106-3
25. Rey A. The psychological examination in cases of traumatic encephalopathy. Problems. Arch Psychol (Geneve). 1941;28:215–285.
26. Booth RDL. Local-Global Processing and Cognitive Style in Autism Spectrum Disorders and Typical Development. [Unpublished Doctoral Dissertation]. King’s College London: Institute of Psychiatry; 2006.
27. Aloi M, Rania M, Caroleo M, et al. Decision making, central coherence and set-shifting: a comparison between binge eating disorder, anorexia nervosa and healthy controls. BMC Psychiatry. 2015;15(1):6. doi:10.1186/s12888-015-0395-z
28. Hamatani S, Tomotake M, Takeda T, et al. Impaired central coherence in patients with anorexia nervosa. Psychiatry Res. 2018;259:77–80. doi:10.1016/j.psychres.2017.09.086
29. Reitan RM. Validity of the trail making test as an indicator of organic brain damage. Percept Mot Skills. 1958;8(3):271–276. doi:10.2466/pms.1958.8.3.271
30. Hashimoto R, Meguro K, Lee E, Kasai M, Ishii H, Yamaguchi S. Effect of age and education on the trail making test and determination of normative data for Japanese elderly people: the Tajiri project. Psychiatry Clin Neurosci. 2006;60(4):422–428. doi:10.1111/j.1440-1819.2006.01526.x
31. Abe M, Suzuki K, Okada K, Miura R, Fujii T, Etsurou M. Trail making test, verbal fluency, Wisconsin card sorting test (Keio version). No to Shinkei. 2004;57:567–574.
32. Cohen J. Statistical Power Analysis for the Behavioral Sciences.
33. Moore HTA, Gómez-Ariza CJ, Garcia-Lopez L. Stopping the past from intruding the present: social anxiety disorder and proactive interference. Psychiatry Res. 2016;24:284–289. doi:10.1016/j.psychres.2016.02.053
34. Dinn WM, Aycicegi-Dinn A, Göral F, Darkal O, Yildirim EA, Hacioglu M. Treatment-resistant obsessive-compulsive disorder: neurocognitive and clinical correlates. Procedia Soc Behav Sci. 2016;217:1189–1198. doi:10.1016/j.sbspro.2016.02.144
35. Wieser MJ, Hambach A, Weymar M. Neurophysiological correlates of attentional bias for emotional faces in socially anxious individuals − evidence from a visual search task and N2pc. Biol Psychol. 2018;132:192–201. doi:10.1016/j.biopsycho.2018.01.004
 © 2020 The Author(s). This work is published and licensed by Dove Medical Press Limited. The full terms of this license are available at https://www.dovepress.com/terms.php and incorporate the Creative Commons Attribution - Non Commercial (unported, v3.0) License.
By accessing the work you hereby accept the Terms. Non-commercial uses of the work are permitted without any further permission from Dove Medical Press Limited, provided the work is properly attributed. For permission for commercial use of this work, please see paragraphs 4.2 and 5 of our Terms.
© 2020 The Author(s). This work is published and licensed by Dove Medical Press Limited. The full terms of this license are available at https://www.dovepress.com/terms.php and incorporate the Creative Commons Attribution - Non Commercial (unported, v3.0) License.
By accessing the work you hereby accept the Terms. Non-commercial uses of the work are permitted without any further permission from Dove Medical Press Limited, provided the work is properly attributed. For permission for commercial use of this work, please see paragraphs 4.2 and 5 of our Terms.