")
Back to Journals » Clinical Interventions in Aging » Volume 11
Neurocognitive testing and cochlear implantation: insights into performance in older adults
Authors Cosetti M, Pinkston J, Flores J, Friedmann D, Jones C, Roland, Jr J, Waltzman S
Received 10 November 2015
Accepted for publication 11 February 2016
Published 12 May 2016 Volume 2016:11 Pages 603—613
DOI https://doi.org/10.2147/CIA.S100255
Checked for plagiarism Yes
Review by Single anonymous peer review
Peer reviewer comments 2
Editor who approved publication: Dr Richard Walker
Maura K Cosetti,1,2 James B Pinkston,3 Jose M Flores,4 David R Friedmann,5 Callie B Jones,3 J Thomas Roland Jr,5,6 Susan B Waltzman5
1Department of Otolaryngology – Head and Neck Surgery, 2Department of Neurosurgery, 3Department of Neurology, Louisiana State University Health Sciences Center, Shreveport, LA, 4Department of Epidemiology, Johns Hopkins Bloomberg School of Public Health, Baltimore, MA, 5Department of Otolaryngology, 6Department of Neurosurgery, New York University School of Medicine, New York, NY, USA
Objective: The aim of this case series was to assess the impact of auditory rehabilitation with cochlear implantation on the cognitive function of elderly patients over time.
Design: This is a longitudinal case series of prospective data assessing neurocognitive function and speech perception in an elderly cohort pre- and post-implantation.
Setting: University cochlear implant center.
Participants: The patients were post-lingually deafened elderly female (mean, 73.6 years; SD, 5.82; range, 67–81 years) cochlear implant recipients (n=7).
Measurements: A neurocognitive battery of 20 tests assessing intellectual function, learning, short- and long-term memory, verbal fluency, attention, mental flexibility, and processing speed was performed prior to and 2–4.1 years (mean, 3.7) after cochlear implant (CI). Speech perception testing using Consonant–Nucleus–Consonant words was performed prior to implantation and at regular intervals postoperatively. Individual and aggregate differences in cognitive function pre- and post-CI were estimated. Logistic regression with cluster adjustment was used to estimate the association (%improvement or %decline) between speech understanding and years from implantation at 1 year, 2 years, and 3 years post-CI.
Results: Improvements after CI were observed in 14 (70%) of all subtests administered. Declines occurred in five (25%) subtests. In 55 individual tests (43%), post-CI performance improved compared to a patient’s own performance before implantation. Of these, nine (45%) showed moderate or pronounced improvement. Overall, improvements were largest in the verbal and memory domains. Logistic regression demonstrated a significant relationship between speech perception and cognitive function over time. Five neurocognitive tests were predictive of improved speech perception following implantation.
Conclusion: Comprehensive neurocognitive testing of elderly women demonstrated areas of improvement in cognitive function and auditory perception following cochlear implantation. Multiple neurocognitive tests were strongly associated with current speech perception measures. While these data shed light on the complex relationship between hearing and cognition by showing that CI may slow the expected age-related cognitive decline, further research is needed to examine the impact of hearing rehabilitation on cognitive decline.
Keywords: cognitive function, cognitive impairment, dementia, aging, hearing loss, cochlear implant, neuropsychological testing
Introduction
Aging of the US population has broad implications for both dementia and hearing loss. Data suggest that the number of individuals with Alzheimer’s disease would triple in the next 40 years with 13.5 million Americans affected in 2050. At that time, more than half of them would be aged 85 years or older.1 Estimates of hearing loss are similarly remarkable: current estimates suggest that two-thirds of US adults aged 70 years and older have hearing loss and predictions suggest that the global burden of hearing loss would approach 1.2 billion in 2050.2 While long recognized as independent age-related phenomena, recent research investigating the relationship between hearing loss and cognitive decline suggests that they may be more than covariants.2–8 In their prospective study of nearly 2,000 older adults, Lin et al found hearing loss among older adults to be an independent predictor of incident cognitive decline. They also reported a 40% accelerated rate of cognitive decline in individuals with hearing loss compared to those with normal hearing.3 Their data also suggested a linear relationship between severity of hearing loss and rate of cognitive decline in which individuals with severe hearing loss were at five times greater risk of cognitive decline compared to normal hearing individuals.
Three overarching theories have emerged to explain the complex relationship between cognitive decline and hearing loss, specifically the “common cause,” “cascade,” and “cognitive load” hypotheses. In the “common cause,” hearing loss and cognitive decline are postulated to be the result of common, neurodegenerative changes in the aging brain. The cascade hypothesis suggests that auditory deprivation may affect cognition directly, via impoverished input, or indirectly through a decrease in socialization known to occur in those with hearing loss. Finally, the cognitive load theory proposes that the compensatory mental effort required to maintain cognitive function in the setting of hearing loss diverts or monopolizes cognitive resources, resulting in an apparent decline. Research in this area is actively accumulating, and at present it is not yet clear which, if any, of these theories can account for the complexity of interaction between auditory function and cognition.
If, in fact, the relationship between hearing loss and cognitive decline is casual and relative, rehabilitation of hearing loss may have the potential to impact cognitive decline in elderly patients. Early data suggest that interventions for hearing loss may impact cognition and, more specifically, slow the cognitive decline associated with aging. Studies examining the effect of hearing aid amplification on cognition in older adults have shown promising, if somewhat conflicting, results.9 For individuals with severe-to-profound hearing loss who do not benefit from conventional amplification, cochlear implantation may be considered. Unlike a hearing aid, a cochlear implant (CI) provides direct electrical stimulation to the auditory nerve through a surgically placed, intra-cochlear electrode and has been shown to be safe and effective with significant, widespread benefits in both speech understanding and quality of life in the elderly population.10–13
This study examines the impact of cochlear implantation on the cognitive function of elderly patients over time. Our objective was to assess the long-term impact of cochlear implantation on various neurocognitive domains, including intellectual function, short- and long-term memory, verbal fluency, attention, learning, mental flexibility, and motor-based processing speed. The relationship between cognitive function and speech perception was also investigated.
Methods
Patients
Patients ≥65 years of age who underwent comprehensive neurocognitive test battery prior to cochlear implantation between August 2010 and August 2012 were identified (n=27). Excluded patients included patients with known neurologic disease, including dementia, cerebrovascular disease, or any process known to impair cognitive function. Patients who had moved from the study center (n=8), were lost to follow-up (n=2), or were unable to return for post-CI neurocognitive testing (n=10) were excluded. This study was approved by the Institutional Review Board of New York University School of Medicine/Langone Medical Center (approval#: S13-00165). Informed consent was obtained from all patients in line with the IRB which allowed either a written or a phone consent.
A total of seven patients aged 67–81 years (mean, 73.6 years) underwent comprehensive neurocognitive test battery prior to and between 2 years and 4 years (mean, 3.7 years) after CI and are included in the analyses. Participant characteristics are detailed in Table 1. All patients were female, post-lingually deafened due to bilateral progressive sensorineural hearing loss (SNHL), had normal cochlear anatomy (as assessed radiologically by computed tomography of the temporal bone), and had uncomplicated surgery with full insertion of the electrode array. Average length of severe-profound hearing loss prior to CI was 29 years (8–53 years). The mean age of the sample at the time of CI was 73.6 years (SD, 5.60; range, 67–81), and the length of follow-up ranged from 2 years to 4.1 years (mean, 3.7). Most women were widowed (42.8%) and all had attended college or had Masters level or higher degrees. The most prevalent preoperative morbidity was thyroid disease, present in six patients (85.7%), and a history of cancer, present in four patients (57.1%). Six women (85.7%) received implants manufactured by Cochlear Americas (only a single patient received her implant manufactured by Advanced Bionics). Only one patient received a left ear implant, with the remaining undergoing right ear CI (Table 1).
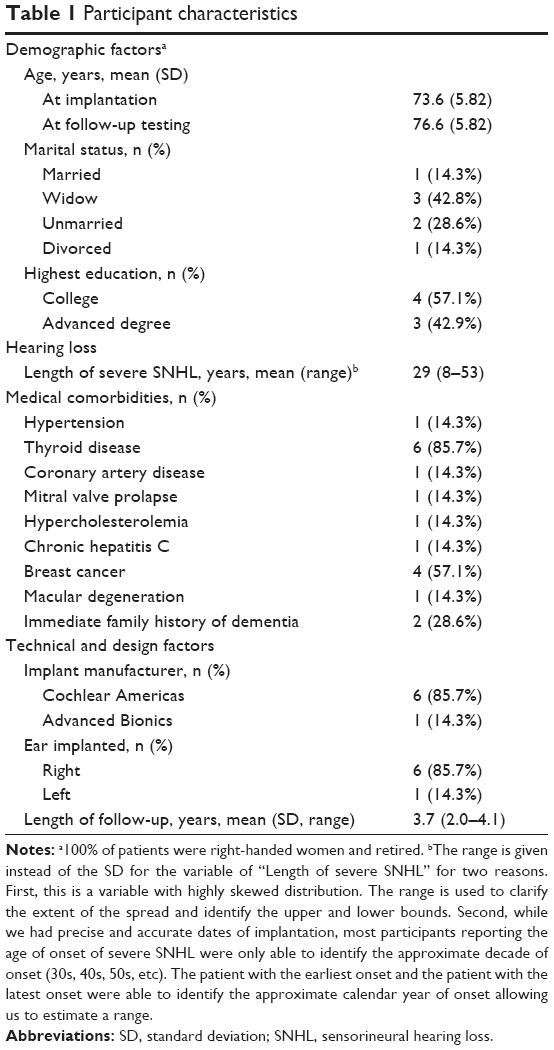 | Table 1 Participant characteristics |
Neurocognitive test battery
The neurocognitive test battery consisted of six widely available assessment tools appropriate for the measurement of cognitive function in the elderly population. These tests included the Test of Premorbid Functioning (TOPF), the Wechsler Abbreviated Scale of Intelligence (WASI), Trail Making Test (TMT), the Controlled Oral Word Association Tests, Boston Naming Test (BNT), and the Repeatable Battery for the Assessment of Neuropsychological Functioning (RBANS).14–17 Each of these tests includes a variety of subtests across various domains including intelligence quotient (IQ), short- and long-term memory, verbal fluency, attention, learning, mental flexibility, and motor-based processing speed (Table S1). Test administration and scoring were performed by trained neuropsychometrists both pre- and post-CI. Each session (before and after CI) lasted between 3 hours and 4 hours. Preoperatively, test instructions were given in oral and written format to avoid misunderstanding due to hearing loss. Postoperatively, testing was performed in the typical listening environment for that patient (unilateral CI ± contralateral hearing aid).
Test results were categorized on a 13-point ordinal continuum (−6 to 0 to +6) using standardized age-based population norms. Ordinal score rankings were as follows: −6 (impaired), −5 (impaired–borderline), −4 (borderline), −3 (borderline–low average), −2 (low average), −1 (low average–average), 0 (average), 1 (average–high average), 2 (high average), 3 (high average–superior), 4 (superior), 5 (superior–very superior), and 6 (very superior). This qualitative scale is well recognized in neuropsychological testing from its basis in the Wechsler IQ.
A total of 128 individual differences were successfully measured: each of seven participants completed 20 cognitive subtests before and after CI. Twelve differences were unable to be estimated due to missing data in the pre- or post-CI visits. The 12 missing data points were spread across all patients and subtests. Overall, the missing data rate for the calculated differences was <10% (12/128).
Speech perception assessment
All patients underwent preoperative audiometric testing to determine CI candidacy and postoperative testing at regular intervals (3 months, 6 months, 12 months, and yearly thereafter, with additional visits as needed) to monitor the progress. All testing was performed in a soundproof booth (Industrial Acoustics Company, New York, NY, USA) by a CI audiologist. Preoperative testing was performed with bilateral hearing aids in ear and bilaterally (after verification of optimal hearing aid fitting), and postoperative testing was performed in the CI-only and bimodal condition (unilateral CI and contralateral hearing aid). Speech perception was assessed using the Consonant–Nucleus–Consonant word (CNCw) test in the standard fashion using recorded materials presented at 60 dB sound pressure level. The CNCw test consists of ten lists each containing 50 monosyllabic words and measures speech recognition as a percentage of words repeated correctly.18
Statistical methods
Data management and analyses were performed using STATA/SE Version 13 (StataCorp LP, College Station, TX, USA). Continuous variables are presented as mean (SD and/or range). For one variable “Length of severe SNHL”, the range but not the SD is provided. First, this is a variable with a highly skewed distribution. The range is used to estimate the extent of the spread and identify the upper and lower bounds of SNHL onset. Second, while we had precise and accurate dates of cochlear implantation, most participants reporting the age of onset of severe SNHL were only able to identify the approximate decade of onset (30s, 40s, 50s, etc). This introduces a level of imprecision that makes it difficult to interpret any estimates of the SD. The patient with the earliest onset and the patient with the latest onset were able to identify the approximate calendar year of onset allowing us to estimate a less biased range. Categorical variables are presented as the number (%) of patients, unless otherwise specified. The analysis consists of a case-series analysis of the differences in cognitive performance post vs pre CI (Table 2), a qualitative study of trends (Table 3), a breakdown of the components where each improvement and decline in performance occurred (Table 4), and a regression analysis to produce inferential statistics between the 24 individual subtests and speech perception at 1 year, 2 years, and 3 years post CI (Table 5). Each table is self-standing and includes applicable definitions.
 | Table 2 Case series analysis of differences before and after cochlear implantation |
 | Table 3 Summary of differences in performance-based graduated improvement comparing qualitative scores before and after cochlear implantation |
 | Table 4 Specific domains where improvement (↑), decline (↓), or no change (↔) in cognitive performance were observed |
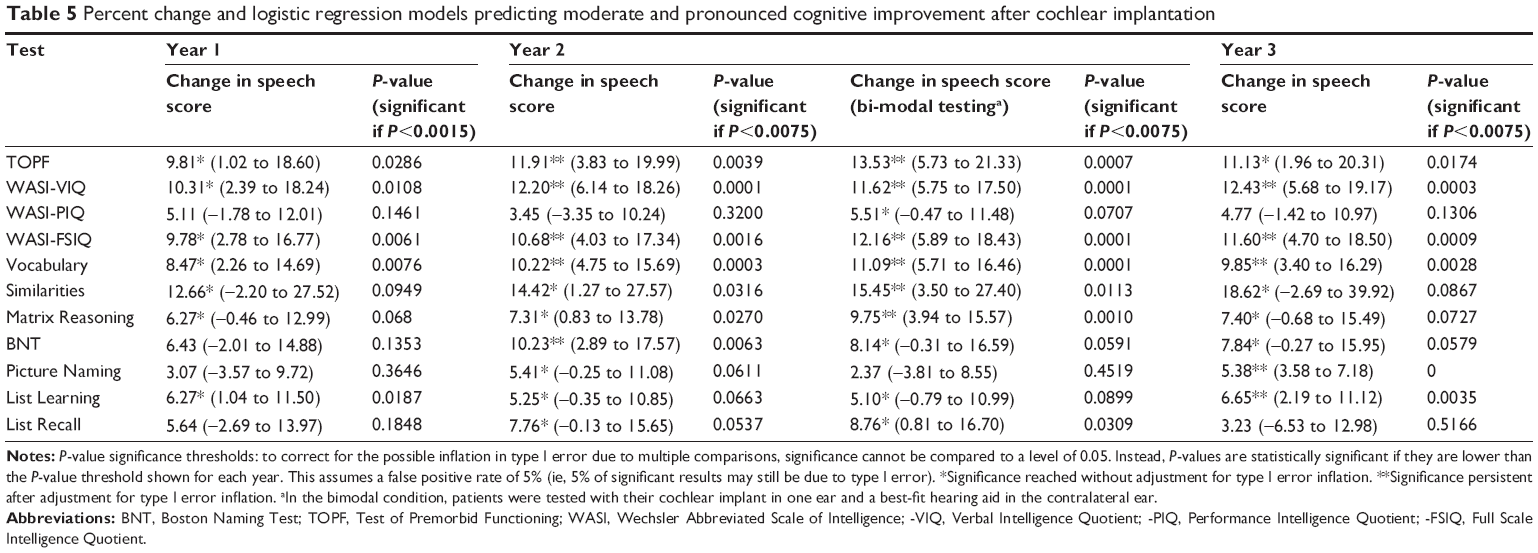 | Table 5 Percent change and logistic regression models predicting moderate and pronounced cognitive improvement after cochlear implantation |
Regression analysis
Cognitive tests that showed improvement after implantation were used to predict post-CI speech perception at years 1, 2, and 3 using multivariable logistic regression. The models were estimated via generalized estimating equations that account for within-subject correlation, as the same individual was tested multiple times. P-value significance thresholds were calculated to correct for possible inflations in type I error due to multiple comparisons. In such cases, significance cannot be compared to an alpha level of 0.05. Instead, P-values are statistically significant if they are lower than the P-value critical threshold, which are lower than alpha. This still assumes a false-positive rate of 5% (ie, even after correction, 5% of significant results may still be due to type I error).
Definitions of individual vs sample improvement and decline in performance
Individual differences refer to differences between post vs pre CI within a single patient. Improvement in score was defined as any positive difference, and decline was defined as any negative difference within a single test:
Δ individual = Post-CI score − Pre-CI score | (1) |
Likewise, average differences refer to post- vs pre-CI comparisons in the sample within a single test:
Δ samlpe = Aggregate post-CI score − Aggregate pre-CI score | (2) |
Qualitative categorization
The magnitude of the differences from Equations 1 and 2 were categorized as minimal, moderate, and pronounced improvement using the following definitions. Minimal improvement was defined as 0 units < Δ <1 unit, moderate improvement as 1 unit ≤ Δ <2 units, and pronounced improvement Δ =2-unit improvement or better. Likewise, minimal decline in performance was defined as −1 unit < Δ <0 units, moderate decline as −2 units < Δ ≤−1 unit, and pronounced decline Δ =2-unit decline or worse. No change in performance was represented by 0 (Δ =0).
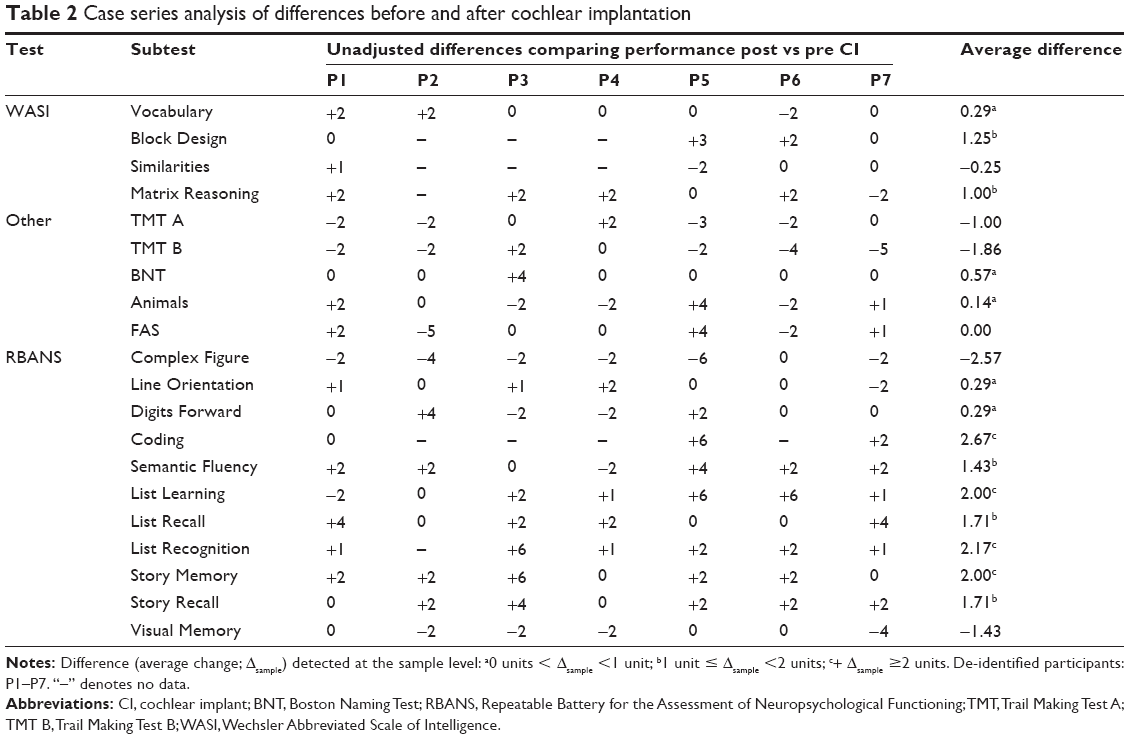
Table 2 describes unadjusted differences (Δ) in performance in 20 cognitive subtests administered before and after CI. As described earlier, calculated differences can represent improvement (Δ >0), decline (Δ <0), or no change (Δ =0) between baseline scores and postimplant performance. Two types of differences, specifically individual (Δ individual) and sample (Δ sample) are reported in Table 2. Individual differences are depicted under each participant and compare the change in score for a single patient in a single subtest, while the average difference (last column) compares the change in score of the entire sample in a single subtest.
Results
Change in cognitive performance over time
At the sample level, improvements were observed in 14 (70%) subtests administered: Vocabulary, Block Design, Matrix Reasoning, BNT, Animals, Line Orientation, Digits Forward, Coding, Semantic Fluency, List Learning, List Recall, List Recognition, Story Memory, and Story Recall (Table 2). The sample performance declined in five (25%) subtests (Similarities, TMT A and B, Complex Figure, and Visual Memory) and was unchanged in a single (5%) subtest (FAS). At the sample level, the mean difference in score after CI was +0.52 units (SD =1.43; range, −2.57 to 2.67; Table 2).
Individual differences are summarized in Figure 1. In 55 instances (43%), post-CI performance improved compared to a patient’s own performance before implantation. No change in individual performance was observed in 41 subtests (32%), while a decline in performance was measured in 32 subtests (25%) (Figure 1).
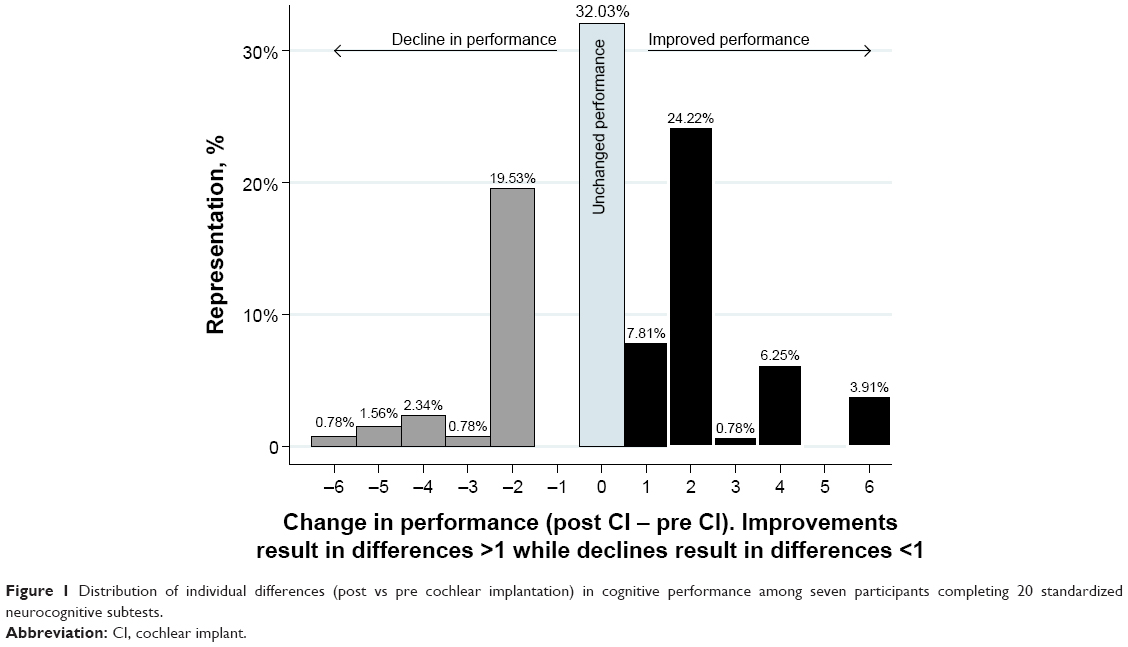 | Figure 1 Distribution of individual differences (post vs pre cochlear implantation) in cognitive performance among seven participants completing 20 standardized neurocognitive subtests. |
Magnitude of change
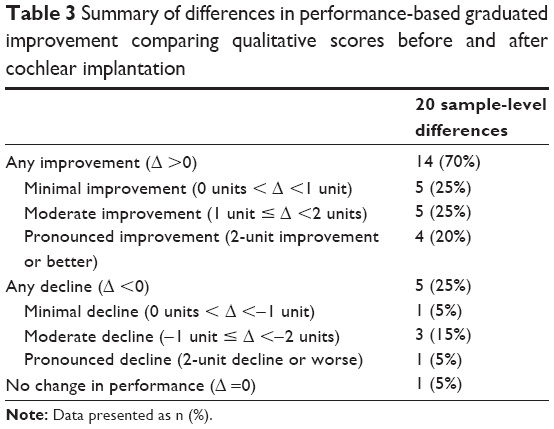
Table 3 depicts a qualitative analysis to grade the magnitude of post- vs pre-CI difference in neurocognitive score. Seven categories were constructed based on the magnitude of post- vs pre-CI difference in score (Δ sample describes instances where no change was observed and instances where there were minimal, moderate, pronounced changes). Among all 20 subtests, five (25%) subtests showed minimal improvements in post-CI performance, specifically Vocabulary, BNT, Animals, Digits Forward, and Line Orientation. Five subtests (25%) showed moderate improvements (Semantic Fluency, List Recall, Story Recall, Matrix Reasoning, and Block Design) and four (20%) showed pronounced improvements (List Learning, List Recognition, Story Memory, and Coding). There was a decline in performance in five subtests (25%): one (5%) with minimal decline (Similarities), three subtests (15%) with moderate declines (TMT A and B), and one subtest (5%) showed pronounced decline (Complex Figure). A single subtest (FAS) showed no change in performance between pre- and post-CI scores (Table 3).
Domain-specific changes
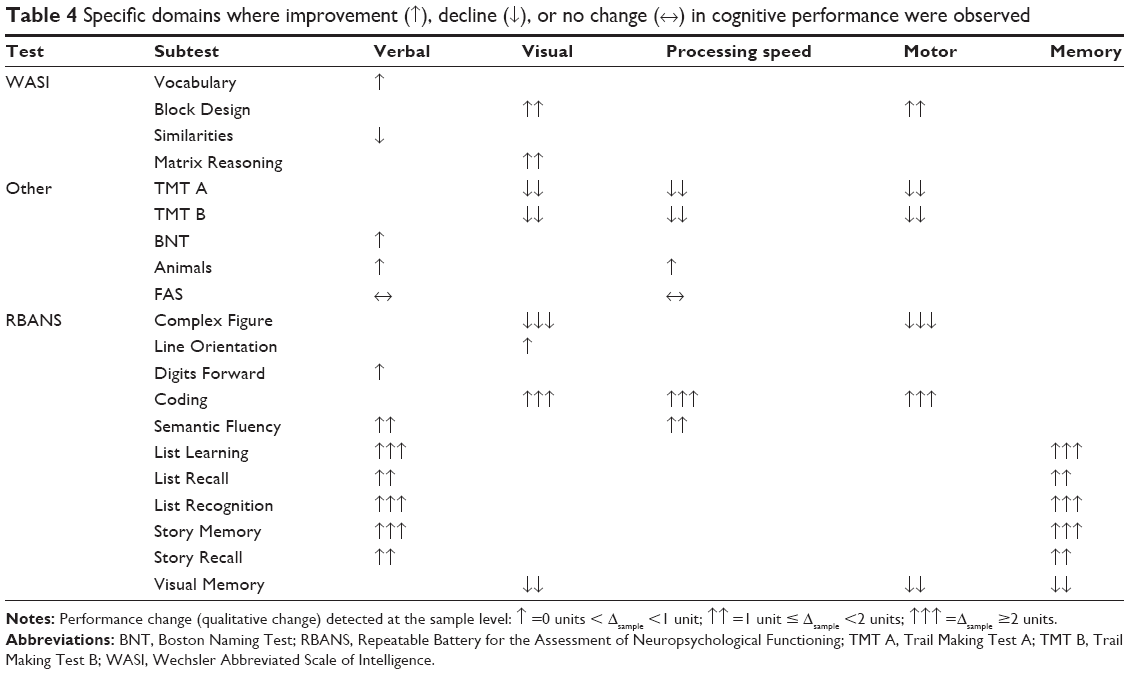
In Table 4, categorical changes in performance are further subdivided into five domains: 1) verbal, 2) visual, 3) motor, 4) memory, and 5) processing speed. Minimal improvement (0 units < Δ <1 unit) was observed in subtests containing components related to verbal function (Vocabulary, BNT, Animals, and Digits Forward subtests), visual functions (Line Orientation), and processing speed (Animals subtest). Moderate improvement (1 unit ≤ Δ <2 units) was observed in subtests consisted of subcomponents related to visual function (Block Design and Matrix Reasoning subtests), motor functions (Block Design subtest), verbal functions (Semantic Fluency, List Recall, and Story Recall subtests), processing speed (Semantic Fluency), and memory (List Recall and Story Recall subtests); pronounced improvement (Δ =2-unit improvement or better): pronounced improvements were noted in subtests measuring of subcomponents related to visual function (Coding subtest), motor functions (Coding subtest), verbal functions (List Learning, List Recognition, and Story Memory subtests), processing speed (Coding subtest), and memory (List Learning, List Recognition, and Story Memory subtests).
Minimal decline in performance (−1 unit < Δ <0 units) was observed only in the Similarities subtests, which measures verbal function. Moderate decline (−2 units < Δ ≤−1 unit) was noted in three subtests related to visual–motor functions (TMT A, TMT B, and Visual Memory subtest). The TMT A and TMT B subtests also assess the processing speed. Pronounced decline (Δ =2-unit decline) in performance was observed in single subtest (Complex Figure), a test that assesses visual–motor function. Only the FAS subtest showed no change in performance (Table 4).
Cognitive function and speech perception
Table 5 shows tests significantly associated with speech perception (CNCw) at years 1, 2, and 3. P-values are adjusted for multiple comparisons within each year post CI and for the lack of independence between tests (ie, the WASI tests are related and might measure similar constructs). Year 2 includes estimates in the CI-only condition as well the bimodal condition. Before correction for type I error rate inflation, seven tests were associated with speech perception scores at year 1 post CI (TOPF, WASI-VerbalIQ [-VIQ], WASI-Performance IQ [-PIQ]; WASI-Full Scale IQ [-FSIQ], Vocabulary, Similarities, Matrix Reasoning, BNT, Picture Naming, List Learning, and List Recall). However, after correction, these scores were no longer significantly associated with speech perception scores at 1 year. Five tests were significantly associated with improvements in speech perception at year 2, even after correction for type I error inflation (TOPF ↑11.91% [3.83–19.99], WASI-VIQ: ↑12.20% [6.14–18.26], WASI-FSIQ: ↑10.68% [4.03–17.34], Vocabulary: ↑10.22% [4.75–15.69], and BNT: ↑10.23% [2.89–17.57]). Of these five tests, only the BNT test was no longer associated with speech perception improvements in the bimodal condition at year 2. Furthermore, the Similarities test and the Matrix Reasoning test were significantly associated with improved speech understanding in the bimodal condition. At year 3 post CI, five tests were associated with improved speech scores (WASI-VIQ: ↑12.43% [5.68–19.17], WASI-FIQ: ↑11.60% [4.70–18.50], Vocabulary: ↑9.85% [3.40–16.29], Picture Naming: ↑5.38% [3.58–7.18], and List Learning: ↑6.65% [2.19–11.12]). Three tests were consistently associated with improved speech perception in year 2 (in both bimodal and CI-only condition) and year 3 after CI (WASI-VIQ, WASI-FSIQ, and the Vocabulary tests).
Discussion
This study documents longitudinal cognitive function of elderly CI patients using a comprehensive neurocognitive test battery and demonstrates improvement in cognitive function across a variety of domains over time. Longitudinal improvement in cognitive function in elderly patients is rarely documented.19,20 Prior data support stability of neurocognitive testing in normal hearing, noncognitively impaired adults over time. Thaler et al documented no change in baseline RBANS testing in 298 community-dwelling elderly adults over a 2-year period.20 More recently, Cooley et al demonstrated longitudinal stability in RBANS score over 4 years in healthy adults over the age of 50 years.19 Our results suggest that it is possible that the improvement (in some cases of large magnitude) across domains and subtests reflects the impact of cochlear implantation.
The relationship between hearing loss and age-related cognitive decline, while incompletely understood, has been well documented in recent studies. As reviewed earlier, Lin et al and other groups have found the rate of cognitive decline to be linearly associated with the severity of hearing loss.2–8 This study suggests that cochlear implantation, a safe and effective intervention for severe-profound hearing loss, may have the potential to mitigate age-related cognitive decline.
To date, few studies have investigated the impact of cochlear implantation on cognition and only one of these (Mosnier et al) included currently available, modern CI technology. Our data are in agreement with that study by Mosnier et al which examined the cognitive function of 94 elderly CI patients 1 year following implantation.21 Using six cognitive tests (including the Mini-Mental State Exam), they found that 81% of patients with abnormal baseline scores (n=37) demonstrated a significant improvement at 1 year postoperatively. In addition, the majority of patients with the best preoperative cognitive scores demonstrated stable cognitive function at 12 months after CI.
Underlying mechanisms for cognitive improvement following cochlear implantation may be mediated by neural plasticity, a complex phenomenon for which significant evidence exists in elderly CI recipients. Clinically, this may be represented by ongoing improvements in speech perception following implantation. On a cellular and cortical level, animal and human data demonstrate change in neural response patterns and cortical organization of the central auditory system following peripheral electrical stimulation with a CI.22,23 Anatomic data gleaned from imaging studies shows evidence of cortical reorganization following cochlear implantation, primarily in the primary and secondary auditory cortex.24,25 In some studies, the degree of brain plasticity was directly associated with the level of speech understanding following implantation.
In both the current study and the study by Mosnier et al,21 both cognitive function and speech perception demonstrated improvement following CI. While the clinical significance of improved speech perception following cochlear implantation is well established, the clinical significance of cognitive improvement demonstrated in the current and prior study has not been thoroughly studied. At the present time, prior studies have not successfully established a clear understanding of the relationship between statistical and clinical significance in this context. Because prior data demonstrate long-term stability of neurocognitive test results, we have chosen to interpret any improvement in test results over time as clinically significant. This is supported by related results demonstrating that improvement in cognitive function is predictive of improved speech perception, thereby importing a framework of clinical significance to these gains. However, this is an area where future research will be needed to validate the meaning or clinical relevance of these incremental changes in neurocognitive test results.
Patients in the current study did not participate in a formal auditory training as part of an aural, post-CI rehabilitation program, as in the study by Mosnier et al.21 Existing data in the non-hearing impaired elderly population suggest that cognitive training or mental exercises may improve intellectual function and flexibility.26,27 However, this phenomenon cannot account for the improvement seen in our subjects. Additionally, available neuropsychological data suggest that the impact of “practice effects” (ie, improved performance due to practice or experience with the test) is minimal, if any, after 1 year.19,20 Given the length of follow-up was 2 years or greater for the current subjects, this is an unlikely explanation for the improvement in our study.
As discussed earlier, the robust nature of our cognitive battery allowed the analysis of domain-specific changes (Table 4). This characterization was based on the “primary domain” of test and, as noted in the descriptions (Table S1) there is some overlap between tests. While both improvement and decline were noted in all domains, our analysis found improvement generally clustered in the domains of verbal function and memory. This is supported by the results of Mosnier et al21 as well as data from pediatric implant recipients. In deaf children, aural rehabilitation with CI has shown to improve comprehension, concentration, sequential processing, and working memory.28
TMT A and TMT B are motor-based tasks that measure visual scanning, speeded processing and multitasking. These are the only tests that are included in both the current study and the study by Mosnier et al.21 In contrast to the current study, Mosnier et al demonstrated a significant improvement on these tests with 42 patients having abnormal baseline scores to 13 patients remaining abnormal at 12 months after CI.21 Our study had mixed results on this test: four of seven patients had a decline in TMT performance, while three had improvement or stability. Our inability to find a trend in performance on this task may be explained by our small sample size or by the involvement of motor function. While improvement was focused on domains related to verbal function and memory, tests with poorest performance all shared the domains of motor and visual function. Tests in the current study that relied on motor function (ie, required writing/drawing using the upper extremity function of the dominant hand) demonstrated a decline in performance over time. More than half of women in this study had a history of breast cancer, and it is possible that either the disease or its treatment could have affected their upper extremity motor function. While only one patient had known glaucoma, perhaps undiagnosed ophthalmologic disease or visual decline could have impacted performance on tests of visual–spatial function. A larger sample would allow greater understanding of these trends.
CI candidacy assessment in elderly patients is multifactorial and includes a detailed assessment of audiologic and speech perception in the best-aided condition, radiologic assessment of cochleovestibular anatomy, and a comprehensive medical assessment. Initial concerns for speech perception outcomes in elderly CI recipients were built on anatomic and cellular data showing neuronal loss and degenerative processes in the central and peripheral auditory systems that could negatively bias CI performance. Lack of perioperative complications and post-CI speech perception results in the current study add to the amassing body of literature supporting the safety and efficacy of CI in an elderly population and further demonstrate that older adults derive significant and widespread benefit from CI over time, despite aging.
Our analysis found a strong relationship between cognitive function and speech perception outcomes with multiple neurocognitive subtests predictive of improved performance over time. Postoperative variability in speech understanding is well documented, but incompletely understood. The data suggest that the additional granularity provided by comprehensive neurocognitive testing may provide greater insight into issues of speech understanding in the elderly population. Further research is needed to better understand and characterize the complex relationship between cognition and cochlear implantation.
This study is notably limited by a small sample size, missing data, and lack of normative scores in a hearing impaired population. Additionally, there is a lack of standardized assessment of mood. Depression is an established risk factor for mild cognitive impairment and dementia, and therefore it is possible that the cognitive change documented in the current study reflects an indirect effect of CI on mood.29 Further studies on the complex interplay of these factors are needed to better understand the widespread impact of CI in the elderly.
Conclusion
At present, it is estimated that 25% of individuals aged 65–75 years and up to 80% of those above 75 years of age experience hearing loss with up to 10% of these individuals experiencing hearing loss too severe for adequate rehabilitation with conventional hearing aids. As the proportion of the population in this age group continues to grow (due to improved overall longevity as well as other demographic trends such as the aging baby boomers), both the individual and public health burden of hearing loss and declining cognitive function/dementia will continue to grow in scope and importance. This study documented improvement in cognitive function over time in elderly CI recipients. Currently, there is no well-recognized treatment for cognitive decline or dementia and, as such, CI may represent an important opportunity for intervention. These results shed light on the complex relationship between hearing and cognition and may have implications for neural plasticity in this population. Further research is needed to examine the potential of hearing restoration on cognitive decline and dementia.
Disclosure
JTR is a member of the surgical advisory board for Cochlear Americas and Advanced Bionics. He does not receive compensation for this position. The other authors report no conflicts of interest in this work.
References
Hebert LE, Weuve J, Scherr PA, Evans DA. Alzheimer disease in the United States (2010–2050) estimated using the 2010 census. Neurology. 2013;80:1778–1783. | ||
Lin FR, Metter EJ, O’Brien RJ, Resnick SM, Zonderman AB, Ferrucci L. Hearing loss and incident dementia. Arch Neurol. 2011;68:214–220. | ||
Lin FR, Yaffe K, Xia J, et al; Health ABC Study Group. Hearing loss and cognitive decline in older adults. JAMA Intern Med. 2013;173:293–299. | ||
Valentijn SA, van Boxtel MP, van Hooren SA, et al. Change in sensory functioning predicts change in cognitive functioning: results from a 6-year follow-up in the maastricht aging study. J Am Geriatr Soc. 2005;53:374–380. | ||
Kiely KM, Gopinath B, Mitchell P, Luszcz M, Anstey KJ. Cognitive, health, and sociodemographic predictors of longitudinal decline in hearing acuity among older adults. J Gerontol A Biol Sci Med Sci. 2012;67:997–1003. | ||
Baltes PB, Lindenberger U. Emergence of a powerful connection between sensory and cognitive functions across the adult life span: a new window to the study of cognitive aging? Psychol Aging. 1997;12:12–21. | ||
Uhlmann RF, Larson EB, Rees TS, Koepsell TD, Duckert LG. Relationship of hearing impairment to dementia and cognitive dysfunction in older adults. JAMA. 1989;261:1916–1919. | ||
Gallacher J, Ilubaera V, Ben-Shlomo Y, et al. Auditory threshold, phonologic demand, and incident dementia. Neurology. 2012;79:1583–1590. | ||
Kalluri S, Humes LE. Hearing technology and cognition. Am J Audiol. 2012;21:338–343. | ||
Eshraghi AA, Rodriguez M, Balkany TJ, et al. Cochlear implant surgery in patients more than seventy-nine years old. Laryngoscope. 2009;119:1180–1183. | ||
Budenz CL, Cosetti MK, Coelho DH, et al. The effects of cochlear implantation on speech perception in older adults. J Am Geriatr Soc. 2011;59:446–453. | ||
Vermeire K, Brokx JP, Wuyts FL, Cochet E, Hofkens A, Van de Heyning PH. Quality-of-life benefit from cochlear implantation in the elderly. Otol Neurotol. 2005;26:188–195. | ||
Olze H, Grabel S, Forster U, et al. Elderly patients benefit from cochlear implantation regarding auditory rehabilitation, quality of life, tinnitus, and stress. Laryngoscope. 2012;122:196–203. | ||
Corporation WP. WASI-III. Technical Manual. San Antonia, TX: Harcourt and Brace; 1997. | ||
Christopher R. Repeatable Battery for the Assessment of Neuropsychological Status (RBANS). San Antonio, TX: The Psychological Corporation; 1998. | ||
Tombaugh TN. Trail making test A and B: normative data stratified by age and education. Arch Clin Neuropsychol. 2004;19:203–214. | ||
Spreen OSE. A Compendium of Neuropsychological Tests. New York, NY: University Press; 1998. | ||
Petersen G, Lehiste I. Revised CNC lists for auditory speech tests. J Speech Hear Disord. 1962;27:62–70. | ||
Cooley SA, Heaps JM, Bolzenius JD, et al. Longitudinal change in performance on the montreal cognitive assessment in older adults. Clin Neuropsychol. 2015;29:824–835. | ||
Thaler NS, O’Rourke JJ, Scott JG, Duff K, Mold J, Adams RL. Longitudinal stability of RBANS profiles in a geriatric community-dwelling sample. Clin Neuropsychol. 2014;28:269–280. | ||
Mosnier I, Bebear JP, Marx M, et al. Improvement of cognitive function after cochlear implantation in elderly patients. JAMA Otolaryngol Head Neck Surg. 2015;141:442–450. | ||
Fallon JB, Irvine DR, Shepherd RK. Cochlear implants and brain plasticity. Hear Res. 2008;238:110–117. | ||
Anderson S, Kraus N. Auditory training: Evidence for neural plasticity in older adults. SIG 6, Perspectives on Hearing and Hearing Disorders: Research and Diagnostics. 2013;17:37–57. | ||
Petersen B, Gjedde A, Wallentin M, Vuust P. Cortical plasticity after cochlear implantation. Neural Plast. 2013;2013:318521. | ||
Lee JS, Lee DS, Oh SH, et al. PET evidence of neuroplasticity in adult auditory cortex of postlingual deafness. J Nucl Med. 2003;44:1435–1439. | ||
Garcia-Casal JA, Loizeau A, Csipke E, Franco-Martin M, Perea-Bartolome MV, Orrell M. Computer-based cognitive interventions for people living with dementia: a systematic literature review and meta-analysis. Aging Ment Health. 2016;25:1–14. | ||
Lampit A, Hallock H, Valenzuela M. Computerized cognitive training in cognitively healthy older adults: a systematic review and meta-analysis of effect modifiers. PLoS Med. 2014;11:e1001756. | ||
Shin MS, Kim SK, Kim SS, Park MH, Kim CS, Oh SH. Comparison of cognitive function in deaf children between before and after cochlear implant. Ear Hear. 2007;28:22S–28S. | ||
Dawes P, Emsley R, Cruickshanks KJ, et al. Hearing loss and cognition: the role of hearing AIDS, social isolation and depression. PLoS One. 2015;10:e0119616. |
Supplementary material
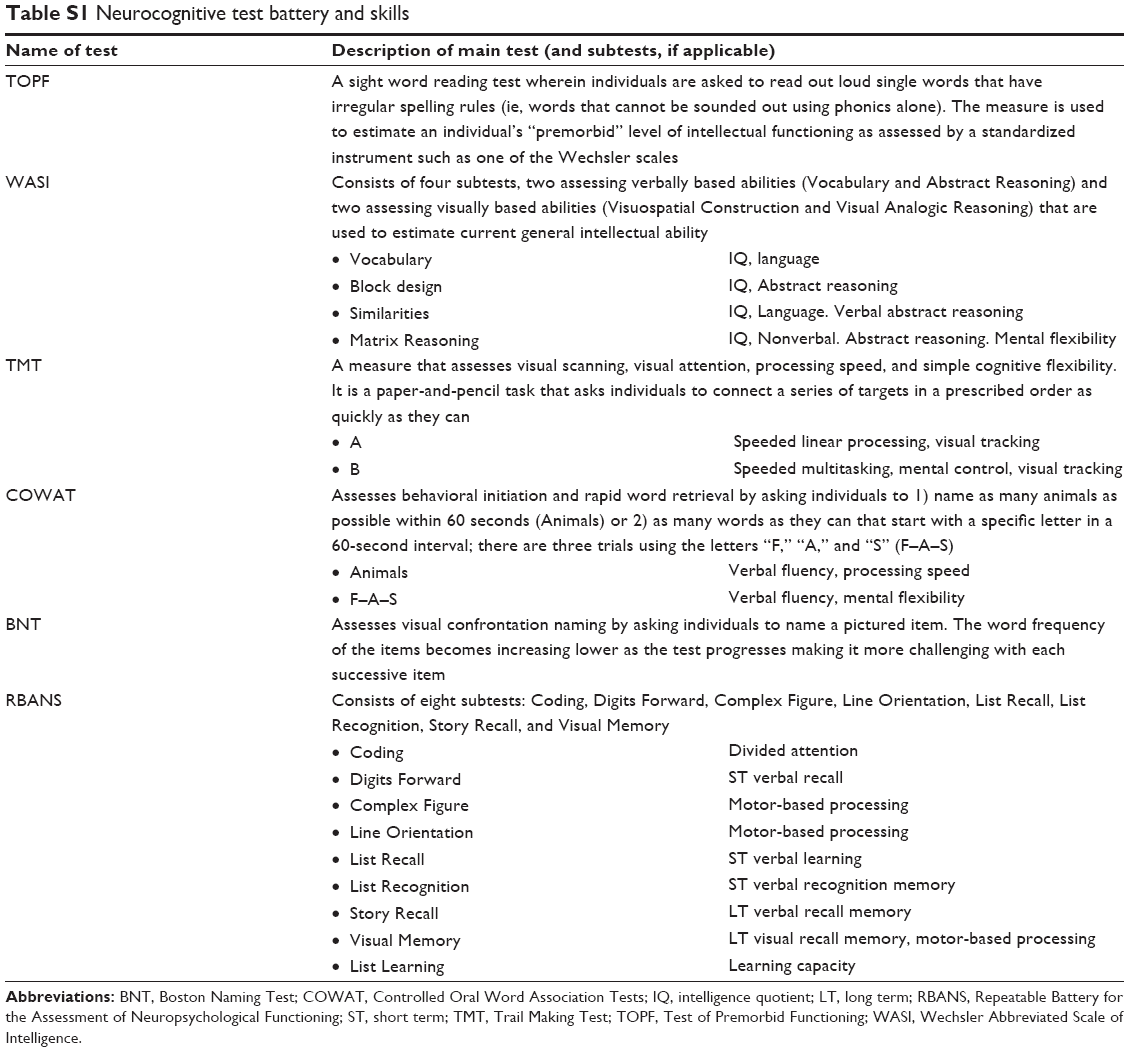 | Table S1 Neurocognitive test battery and skills |
 © 2016 The Author(s). This work is published and licensed by Dove Medical Press Limited. The full terms of this license are available at https://www.dovepress.com/terms.php and incorporate the Creative Commons Attribution - Non Commercial (unported, v3.0) License.
By accessing the work you hereby accept the Terms. Non-commercial uses of the work are permitted without any further permission from Dove Medical Press Limited, provided the work is properly attributed. For permission for commercial use of this work, please see paragraphs 4.2 and 5 of our Terms.
© 2016 The Author(s). This work is published and licensed by Dove Medical Press Limited. The full terms of this license are available at https://www.dovepress.com/terms.php and incorporate the Creative Commons Attribution - Non Commercial (unported, v3.0) License.
By accessing the work you hereby accept the Terms. Non-commercial uses of the work are permitted without any further permission from Dove Medical Press Limited, provided the work is properly attributed. For permission for commercial use of this work, please see paragraphs 4.2 and 5 of our Terms.