")
Back to Journals » Clinical Ophthalmology » Volume 13
Neural network and logistic regression diagnostic prediction models for giant cell arteritis: development and validation
Authors Ing EB , Miller NR, Nguyen A, Su W , Bursztyn LLCD, Poole M , Kansal V , Toren A , Albreiki D, Mouhanna JG, Muladzanov A, Bernier M , Gans M, Lee D, Wendel C, Sheldon C, Shields M, Bellan L , Lee-Wing M , Mohadjer Y, Nijhawan N, Tyndel F, Sundaram ANE, ten Hove MW, Chen JJ, Rodriguez AR, Hu A, Khalidi N , Ing R , Wong SWK, Torun N
Received 5 November 2018
Accepted for publication 17 January 2019
Published 21 February 2019 Volume 2019:13 Pages 421—430
DOI https://doi.org/10.2147/OPTH.S193460
Checked for plagiarism Yes
Review by Single anonymous peer review
Peer reviewer comments 2
Editor who approved publication: Dr Scott Fraser
Edsel B Ing,1 Neil R Miller,2 Angeline Nguyen,2 Wanhua Su,3 Lulu LCD Bursztyn,4 Meredith Poole,5 Vinay Kansal,6 Andrew Toren,7 Dana Albreki,8 Jack G Mouhanna,9 Alla Muladzanov,10 Mikaël Bernier,11 Mark Gans,10 Dongho Lee,12 Colten Wendel,13 Claire Sheldon,13 Marc Shields,14 Lorne Bellan,15 Matthew Lee-Wing,15 Yasaman Mohadjer,16 Navdeep Nijhawan,1 Felix Tyndel,17 Arun NE Sundaram,17 Martin W ten Hove,18 John J Chen,19 Amadeo R Rodriguez,20 Angela Hu,21 Nader Khalidi,21 Royce Ing,22 Samuel WK Wong,23 Nurhan Torun24
1Ophthalmology, University of Toronto, Toronto, ON, Canada; 2Ophthalmology, Johns Hopkins University, Baltimore, MD, USA; 3Statistics, MacEwan University, Edmonton, AB, Canada; 4Ophthalmology, Western University, London, ON, Canada; 5Queens University, Kingston, ON, Canada; 6Ophthalmology, University of Saskatchewan, Saskatoon, SK, Canada; 7Laval University, Quebec, QC, Canada; 8Ophthalmology, University of Ottawa, Ottawa, ON, Canada; 9University of Ottawa, Ottawa, ON, Canada; 10Ophthalmology, McGill University, Montreal, QC, Canada; 11University of Sherbrooke, QC, Canada; 12University of British Columbia, Vancouver, BC, Canada; 13Ophthalmology, University of British Columbia, Vancouver, BC, Canada; 14Ophthalmology, University of Virginia, Fisherville, VA, USA; 15Ophthalmology, University of Manitoba, Winnipeg, MB, Canada; 16Ophthalmology, Eye Institute of West Florida, Tampa, FL, USA; 17Neurology, University of Toronto, Toronto, ON, Canada; 18Ophthalmology, Queens University, Toronto, ON, Canada; 19Ophthalmology & Neurology, Mayo Clinic, Rochester, MN, USA; 20Ophthalmology, McMaster University, Hamilton, ON, Canada; 21Rheumatology, McMaster University, Hamilton, ON, Canada; 22Undergraduate Science, Ryerson University, Toronto, ON, Canada; 23Statistics, University of Waterloo, Waterloo, ON, Canada; 24Ophthalmology, Harvard University, Boston, MA, USA
Purpose: To develop and validate neural network (NN) vs logistic regression (LR) diagnostic prediction models in patients with suspected giant cell arteritis (GCA). Design: Multicenter retrospective chart review.
Methods: An audit of consecutive patients undergoing temporal artery biopsy (TABx) for suspected GCA was conducted at 14 international medical centers. The outcome variable was biopsy-proven GCA. The predictor variables were age, gender, headache, clinical temporal artery abnormality, jaw claudication, vision loss, diplopia, erythrocyte sedimentation rate, C-reactive protein, and platelet level. The data were divided into three groups to train, validate, and test the models. The NN model with the lowest false-negative rate was chosen. Internal and external validations were performed.
Results: Of 1,833 patients who underwent TABx, there was complete information on 1,201 patients, 300 (25%) of whom had a positive TABx. On multivariable LR age, platelets, jaw claudication, vision loss, log C-reactive protein, log erythrocyte sedimentation rate, headache, and clinical temporal artery abnormality were statistically significant predictors of a positive TABx (P≤0.05). The area under the receiver operating characteristic curve/Hosmer–Lemeshow P for LR was 0.867 (95% CI, 0.794, 0.917)/0.119 vs NN 0.860 (95% CI, 0.786, 0.911)/0.805, with no statistically significant difference of the area under the curves (P=0.316). The misclassification rate/false-negative rate of LR was 20.6%/47.5% vs 18.1%/30.5% for NN. Missing data analysis did not change the results.
Conclusion: Statistical models can aid in the triage of patients with suspected GCA. Misclassification remains a concern, but cutoff values for 95% and 99% sensitivities are provided (https://goo.gl/THCnuU).
Keywords: giant cell arteritis, temporal artery biopsy, neural network, logistic regression, prediction models, ophthalmology, rheumatology
Introduction
Giant cell arteritis (GCA) is the most common primary vasculitis in the elderly and can cause blindness or occasionally have life-threatening consequences.1 Although the diagnosis of GCA is initially based on clinical manifestations and usually confirmed by temporal artery biopsy (TABx), at times it can be difficult to diagnose because of GCA’s protean manifestations and systemically occult presentation.2 In addition, whereas the reference standard for the diagnosis of GCA is a positive TABx, this is an invasive procedure. Also, the primary treatment of GCA, systemic glucocorticoids, has many potential complications. As such, the decision to perform TABx and initiate glucocorticoids can be difficult when there are multiple risk factors of varying importance.
Meehl’s disturbing little book, Clinical Versus Statistical Prediction,3 showed that statistical models can outperform clinical experts. Humans are prone to making biased predictions based on heuristic methods and may have difficulty synthesizing the cumulative risk of, and interactions among, multiple predictor variables.4 Properly formulated regression equations usually surpass human experts because the mathematical algorithms can better calculate the appropriate weights that should be placed on individual predictor variables.5 Although no prediction rule can be substituted for a TABx, it is advantageous to have an objective, accurate prediction model, based on commonly used clinical criteria, to estimate the risk of GCA prior to TABx.
Logistic regression (LR), and artificial neural networks or neural networks (NN) are two of the most commonly used clinical prediction models for data classification. LR is the most widely applied prediction model for binary classification. The coefficients from this parametric method show the association of the input variables with the outcome and can suggest a causal inference. NN are processing algorithms modeled after the neural connections of the brain. Just as neuronal connections can be bolstered or decreased through repeated activation, NN can perform an analogous process through mathematical weighting to activate pathways that connect with the desired output. NN is a semi-parametric “black box” method that shares some similarities with LR but has a hidden layer(s) that makes it difficult to delineate the relationship between a predictor variable and the outcome. The advantages of NN compared with LR include the ability to detect automatically complex nonlinear relationships between predictor and outcome variables, and to implicitly discern interactions among independent variables.6
There are many risk prediction models for GCA,7–11 but few have sufficient size or design to meet the guidelines for transparent reporting of a multivariable prediction model for individual diagnosis (TRIPOD).12 Our group recently published a 10-factor multivariable LR rule7 in a cohort of 530 subjects. This LR model had fair discrimination and calibration but an 18% misclassification rate and a false-negative (FN) rate of 54%. FN errors are least desirable in a GCA prediction model due to the potential risks of vision loss (VL) and aortitis.
A sample size calculation for NN is difficult to accurately accomplish, but typically NN perform well with only large datasets,13 and may require thousands of examples for a nonlinear algorithm.14 After developing a prediction rule, an additional test set (holdout set) of patients is required for external validation. The aim of this study was to gather a large set of patients with suspected GCA from multiple centers and develop LR and NN models and externally validate them. We chose the NN model with the lowest FN rate. On review of the Pubmed, Embase, and Google Scholar databases in September 2018, using the search terms “giant cell arteritis” and “neural networks”, there is only one previous NN prediction model for GCA. This was intended for the classification rather than diagnosis of GCA and analyzed an exclusive database of known vasculitis patients.15
Methods
This study was approved by the Michael Garron Hospital Research Ethics Board and by the Institutional Review Boards from each contributing center, and was compliant with the Declaration of Helsinki. Patient consent was not required by the ethics boards as there was no patient randomization, there was no allocation to treatment groups, there were no new treatments, and because the study involved no more than record analysis. The chart review was not blinded.
A retrospective chart audit of consecutive adult patients who had TABx for suspected GCA was conducted at 14 secondary and tertiary care medical centers in Canada (Toronto, ON; Kingston, ON; London, ON; Ottawa, ON; Hamilton, ON; Montreal, QC; Winnipeg, MB; Vancouver, BC), the United States (Baltimore, MD; Boston, MA; Rochester, MN; Fisherville, VA; and Tampa, FL), and Zurich, Switzerland.16
Our outcome variable for this study was biopsy-proven GCA, ie, the pathologic diagnosis from TABx was considered the final diagnosis. Indeterminate TABx were regarded as negative TABx. Healed arteritis was considered a positive TABx if glucocorticoid improved the patient’s symptoms, and long-term steroid treatment was prescribed (see Supplementary material).
The predictor variables were chosen from clinical judgment and the literature.7 The predictor variables were age, gender, new onset headache (HA), clinical temporal artery abnormality (TAabn), jaw claudication (JC), permanent retinal, optic nerve or visual pathway ischemic VL, diplopia, pre-steroid erythrocyte sedimentation rate (ESR), pre-steroid C-reactive protein (CRP) divided by the upper limit of normal (for vasculitis) for each lab, and pre-steroid platelet level. For this study, we did not consider transient VL without fundus abnormality as VL.
The dose and duration of glucocorticoid treatment prior to TABx was recorded, as was the length of the biopsy. Because our end point was biopsy-proven GCA, subjects who did not have TABx within 2 weeks of glucocorticoid initiation were excluded. TABx may remain positive for 2–6 weeks after commencement of treatment17 but the 2-week cutoff was chosen to minimize the chances of FN pathology, and because the histologic findings of GCA may begin to alter only after 4 days of glucocorticoid treatment.18 Bloodwork values that were not obtained prior to glucocorticoid initiation were not used for analysis, but patients were still considered for the missing data analysis (MDA). In patients who had bilateral TABx, the sum of the biopsy lengths was recorded as the biopsy length.
From our original study,7 polymyalgia rheumatica (PMR) was not included as a predictor variable as it can be a nonspecific clinical manifestation, with overlapping age and acute phase response characteristics with GCA. The distinction of PMR from osteoarthritis flare can be difficult. Reports of joint X-rays were not uniformly available in this study.7 Also, rotator cuff injury and fibromyalgia may have overlapping clinical features with PMR.
Race/ethnicity was excluded as a study variable because it can be difficult to define and is an indeterminate proxy for genetic similarity. Many scholars view racial identity as primarily a social construct and one that can misdirect the categorization of participants in biomedical research.19 In addition, many of our charts did not identify ethnicity or race. Furthermore, using the internal biologic effect of an individual study participant’s self-reported race/ethnicity is thought to have low potential validity in observational research.20
Our minimum required sample size was 600 patients, to allow for 100 events and 200 nonevents in each of the development and validation sets, as recommended for external validation of LR prediction rules.21 A formal sample size calculation for an NN is exceedingly difficult to make. Our aim was to acquire at least 1,000 subjects for an NN, to facilitate the development training, validation, and test (holdout) sets. Internal validation and geographic external validation were performed.
The individual patient was the unit of analysis for the statistical models. Statistical evaluations were performed using Stata 15.1 (StataCorp LLC, College Station, TX, USA), JMP Pro13.2 (JMP SAS Institute, Marlow, Buckinghamshire, UK), and R 3.5.0 (R Foundation for Statistical Computing, 2018, Vienna, Austria). An α=0.05 was used for statistical significance.
The continuous variables were graphed. Histogram of the CRP and ESR data showed a right skew distribution (see Supplementary material). A logarithmic transform was used to normalize the CRP and ESR and improve the LR model. In the NN, the program’s “transform covariates” option was selected.
The NN was designed in JMP Pro 13.2 with a single hidden layer and the hyperbolic tangent activation function (Figure 1). The number of nodes in the hidden layer was determined from a preliminary analysis of the minimum root mean square error (RMSE)22 of models with one to nine nodes in the hidden layer; four nodes provided the lowest RMSE. To fit the NN, we transformed covariates, used the absolute penalty method, and performed 20 tours. Continuous variables were transformed using the Johnson distribution to minimize the negative effects of outliers or highly skewed distributions. The absolute penalty method further decreased the chance of overfitting and was chosen over the squared penalty method because our previous LR analysis7 had showed that the ten input variables had unequal predictive ability. The 20 tours or runs mitigate the issue with local minimums.23 The NN analysis with one hidden layer, four hidden units, transformed covariates, and squared penalty method was run 25 times. The NN with the least number of FNs was chosen as the final model.
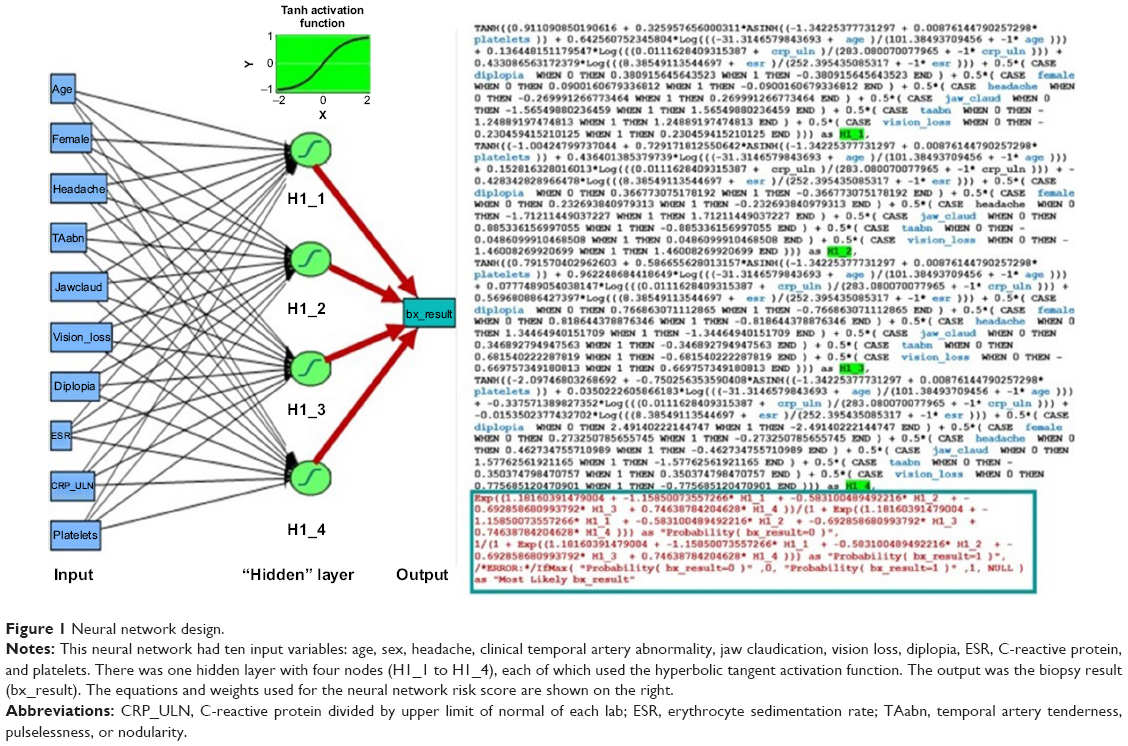 | Figure 1 Neural network design. |
Internal validation using tenfold cross validation was performed. For the LR, the c-statistic was averaged for each fold with bootstrapping of the cross-validated area under the curve.24 Tenfold cross validation was also performed for the NN using JMP Pro for internal validation with a random seed of zero.
The LR was performed with the same data partitioning as the NN model. Model performance was reported for discrimination, calibration, and clinical utility. Receiver operating characteristic curves (ROC) analysis and c-statistic was performed in JMP Pro to determine the discrimination of each model. Calibration was performed with the Hosmer–Lemeshow test and calibration plots using Stata. Overall performance measures were reported using the Brier score and generalized R2. The clinical utility of the models was determined with decision curve analysis (DCA).
MDA was performed with the “informative missing” option in JMP Pro for LR and NN using mean imputation for continuous effects. For categorical effects, the missing value was coded as a separate level of the effect. Multiple imputation (MI) with chained equations with 30 imputations was performed using Stata for the LR and R for the NN. Stata does not perform NN analysis.
Results
We retrieved the records of 1,833 patients who underwent TABx at the 14 centers, 465 (25%) of whom had biopsy-proven GCA. The dates of the TABx at the various centers ranged from January 2006 to June 2018. There was information for complete-case analysis (CCA) in 1,201 patients, 300 (25%) of whom had a positive TABx and 901 (75%) of whom had a negative TABx.
The characteristics of the patients with negative vs positive TABx are shown in Table 1. Patients with positive TABx were older, had more temporal artery tenderness/pulselessness/nodularity, JC, VL, and higher levels of ESR, CRP, and platelets (all P<0.001).
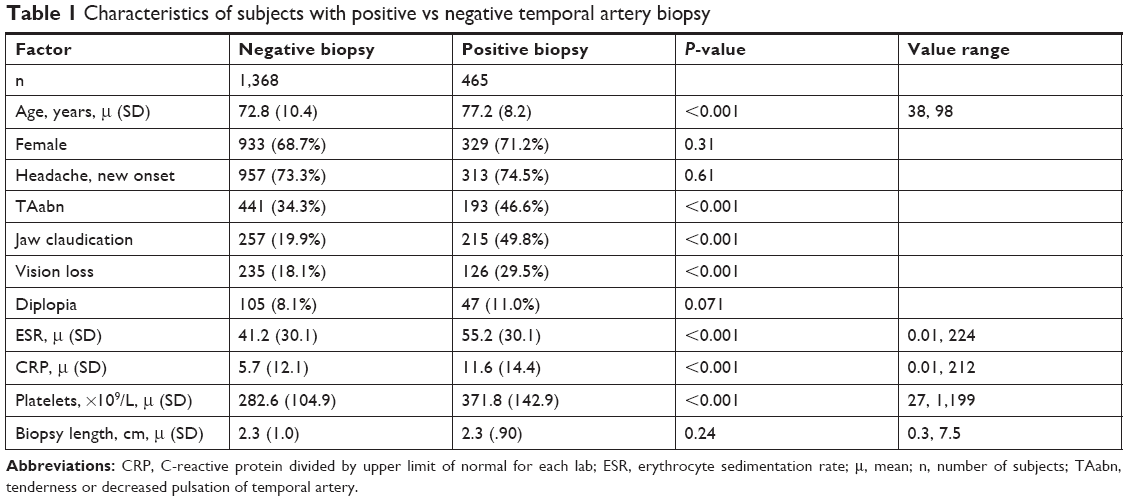 | Table 1 Characteristics of subjects with positive vs negative temporal artery biopsy |
In 1,501/1,833 (82%) of subjects, the biopsy length was readily available. The average length was 2.25 cm (±0.95) in the 1,142 subjects with a negative TABx, and 2.32 cm (±0.90) in the 359 with a positive TABx, with no statistically significant difference (P=0.24). Of the 1,105 subjects who had information on unilateral vs bilateral biopsy, 437 (40%) had a bilateral TABx. The proportion of positive TABx in the unilateral biopsy group was 162/667 (24.3%), and that in the bilateral biopsy group was 109/437 (24.9%), which was not a statistically significant difference (P=0.80).
Thirty-one patients (1.7% of all the patients) were diagnosed as having healed arteritis on pathology, and were included for analysis because the abnormal TABx result confirmed the clinical impression of GCA.
In 681 charts, the referral source was documented; 319 (46.8%) originated from internal medicine or primary care physicians.
There were 361 patients with ischemic VL; in 171 (47.3%), further details of fundoscopy and the ophthalmic history were available (Table 2). Of these 171 patients, 59 had biopsy-proven GCA and 112 did not. In the 59 patients with biopsy-proven GCA, 49 (83%) had anterior ischemic optic neuropathy (AION) and 4 (7%) subjects had bilateral AION; the average age of these patients was 77.9 years and 59% were female. Of the 112 patients with negative TABx, 64 (57%) were deemed to have non-arteritic AION (NAION), and there were no cases of bilateral simultaneous AION. The average age of this group was 74.1 years, and 61% were female. Six patients (10%) in the TABx-positive group had central retinal artery occlusion. Twenty-six patients (23%) in the biopsy-negative group had a retinal arterial occlusion, 23 central, 1 hemi-retinal, and 2 branch.
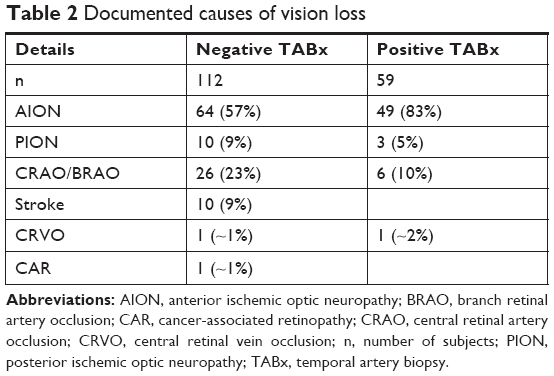 | Table 2 Documented causes of vision loss |
Normal serology (the combination of ESR <50 mm/hour, plus CRP and platelets at or below their upper limit of normal) was seen in 30 of the 300 subjects with complete information and biopsy-proven GCA. Six of these “seronegative” GCA patients (6/30=20%) were diagnosed as healed arteritis.
To facilitate geographic external validation, the data were allocated into a training set and validation set which together comprised 81.4% of our data (2,122 patients), and a test (holdout) set with 18.6% of the data (315 subjects). The allocation of the datasets is shown in Table A of the Supplementary material.
The LR model had no model misspecification and no multicollinearity, with mean variance inflation factor 1.17, and the variance inflation factors for ESR, CRP, and platelets were 1.42, 1.54, and 1.18, respectively (see Supplementary material). Multivariable LR showed that platelets, age, JC, VL, log CRP, logESR, TAabn, and HA were statistically significant predictors of biopsy-proven GCA (see Table 3).
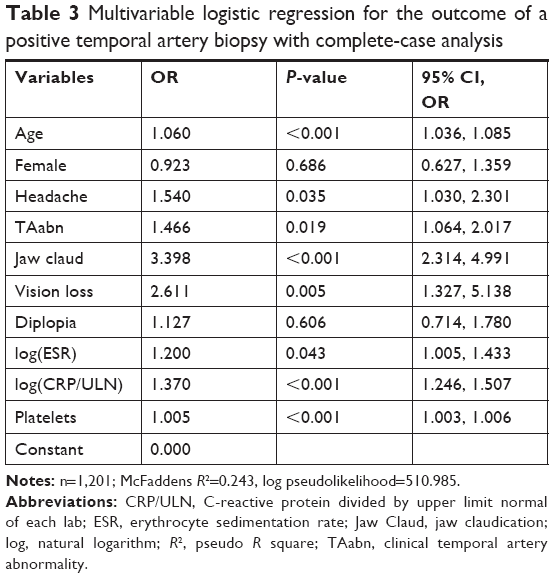 | Table 3 Multivariable logistic regression for the outcome of a positive temporal artery biopsy with complete-case analysis |
Internal validation of the LR model with tenfold cross validation and bootstrap was consistent with good predictive performance with an area under the receiving operating characteristic (AUROC) of 0.806 (95% CI, 0.777, 0.836). Internal validation of the NN model with tenfold cross validation, with one hidden layer and four nodes, with transform covariates with absolute penalty method showed an AUROC of 0.8505 (95% CI 0.8234, 0.8740; see Supplementary material).
External validation was performed on the holdout set and the results are shown in Table 4. The NN had higher sensitivity and accuracy than the LR, with a 17% lower FN rate. On Hosmer–Lemeshow testing, the calibrations of the LR (P=0.119) and NN (P=0.805) models were acceptable. The discrimination of the LR and NN models was good at 0.867 (0.794, 0.917) and 0.860 (0.786, 0.911), respectively. The area under the curve (AUC) difference was 0.007 higher for the LR than the NN, but not statistically significant on comparison of the ROC curves (P=0.317; see Figure 2). The misclassification rate of LR was 20.6% vs 18.1% for NN. There were 47.5% FNs with LR, and 30.5% with NN.
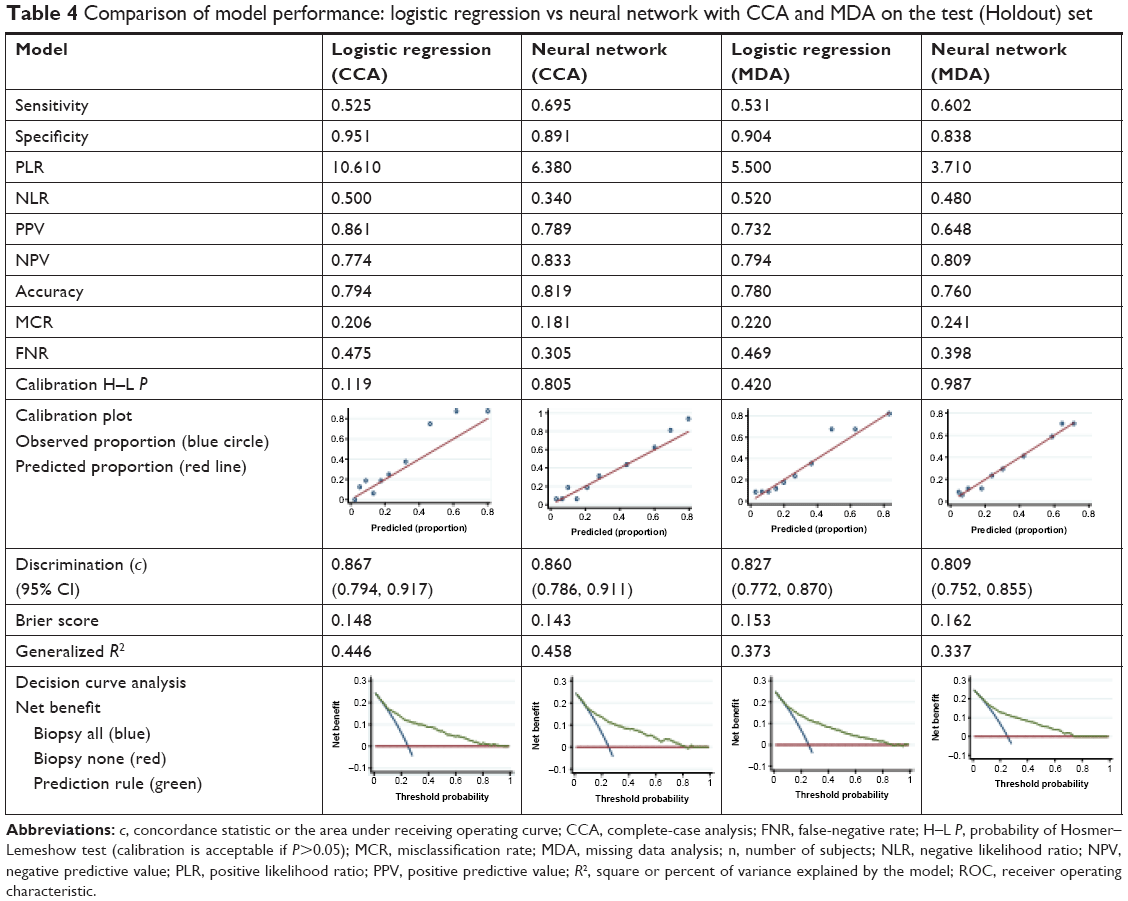 | Table 4 Comparison of model performance: logistic regression vs neural network with CCA and MDA on the test (Holdout) set |
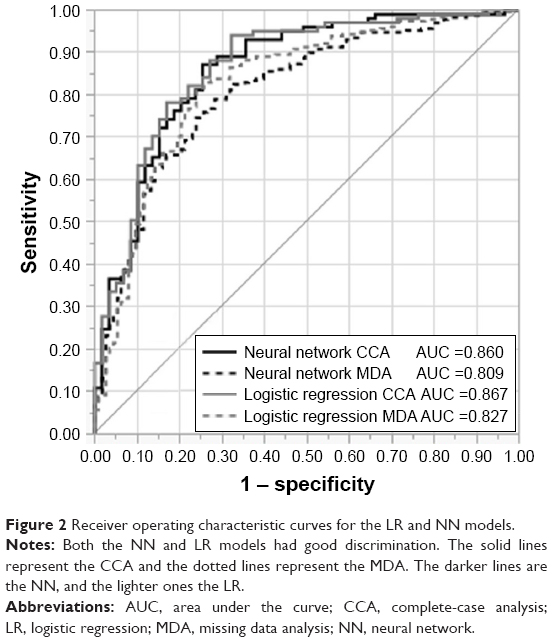 | Figure 2 Receiver operating characteristic curves for the LR and NN models. |
DCA uses a net benefit approach that incorporates clinical consequences to determine whether basing clinical decisions on a model would do more good than harm.25 With DCA, the strategy with the highest net benefit at a particular threshold probability has the highest clinical value.25 The threshold probability (Pt) on the x-axis is the probability where the expected benefit of performing TABx is equal to the expected benefit of avoiding TABx. For our DCA, we assumed there was no harm in performing a TABx, although it is invasive with risks of facial nerve palsy, infection, and bleeding. TABx is also time-consuming, and incurs a moderate expense. DCA (see Table 4) showed that both the LR and NN models had clinical utility for a wide range of threshold probabilities (Pt). Both models were equivalent or better than a “biopsy-all strategy” for all Pt, and superior to a “biopsy none” strategy up to Pt<0.81.
The comparative risk scores for CCA of the LR and NN models in subjects with positive vs negative TABx are shown in Figure 3. The interquartile range of the negative biopsy group is <0.5, but there are still some high scoring outliers that contribute to the false positives. In the positive biopsy group, the subjects with scores <0.5 are the FNs, and much of the interquartile range involves the FN region. However, the median score of the NN in the positive biopsy group is higher than its LR counterpart, reflecting the greater sensitivity of the NN vs LR model. Using the LR coefficients and NN weights from JMP Pro, an online spreadsheet calculator for the prediction models was made (https://goo.gl/THCnuU). A list of high-, medium-, and low-risk clinical scenarios for GCA and their risk score profiles are shown in Table B of the Supplementary material.
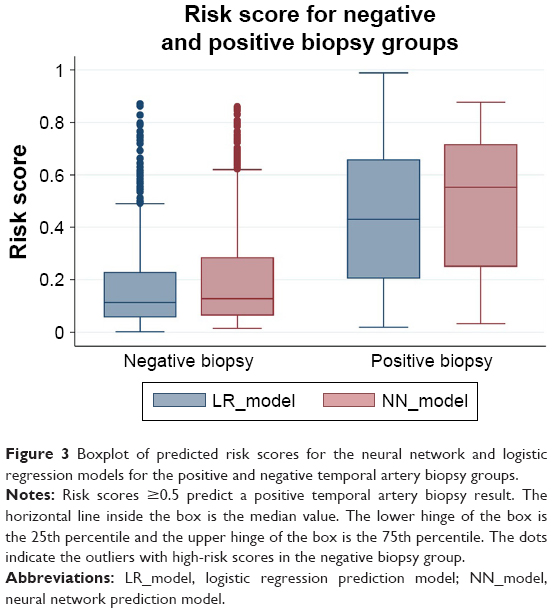 | Figure 3 Boxplot of predicted risk scores for the neural network and logistic regression models for the positive and negative temporal artery biopsy groups. |
The probability cut point for a predicted positive result defaults at 0.5 in the models, but the sensitivity can be improved by adjusting the cutoff score. Table C of the Supplementary material shows the risk score cut points required to achieve sensitivities of 99%, 95%, and 90%, and the associated change in specificity.
The missing data pattern is shown in the Supplementary material. Overall, 66% of the charts had data for CCA. The most common cause for missing data was unavailability of one or more of the bloodwork values, which accounted for 59% of the missing data.
As expected, the AUROC from MDA was less robust than from CCA, with an AUC decrement of 0.051 for NN and 0.040 for LR (see Figure 2). The ROC for both missing data models remained good with NNMDA at 0.809 (95% CI, 0.752, 0.855) and LRMDA at 0.827 (95% CI, 0.772, 0.870). The accuracy of the MDA models decreased by 1.4% for the LRMDA and 5.9% for the NNMDA. The other performance characteristics of the models with missing data are shown in Table 4. The LRMDA showed that JC, platelets, age, VL, log CRP, HA, and TAabn remained statistically significant at the P=0.05 level which was similar to the LRCCA (see Supplementary material).
MI with 30 imputations was performed for the LR model using the nonpartitioned dataset. The non-log transformed covariates did not show substantive differences from CCA. Age, TAabn, JC, VL, and ESR retained statistical significance after MI with P<0.05, but HA did not (PCCA=0.041 → PMI=0.414). CRP became statistically significant after MI analysis. (PCCA=0.060 → PMI=0.049). Gender and diplopia were not statistically significant predictors before or after MI.
MI was performed for the NN using R (see Supplementary material). For NNMDA, this revealed AUROC 0.838 (95% CI 0.791, 0.884) with misclassification rate 20.5% and FN rate 47.8%. Comparing the NNCCA and NNMDA models, the misclassification rates were comparable but the FN rate was higher in the NNMDA model. We were unable to compare changes in the relationship of the predictor variables to outcome in the “black box” of NN.
Discussion
LR and artificial NNs are two of the most commonly employed statistical prediction models for clinical risk estimation. LR is a parametric method in which coefficients and intercepts are explicable, and is best applied to “linearly separable” classes. NN is a semiparametric “black box” method the multiple weights from which are difficult to interpret. The advantages of NN over LR include the ability to implicitly detect complex nonlinear relationships between dependent and independent variables and the ability to detect all possible interactions between predictor variables.6 One prior article explored NN for GCA, but this was developed from a database of 807 patients all known to have vasculitis, and of whom 214 had the diagnosis of GCA.15 The authors of this article used their NN to classify GCA versus other vasculitides, and not for the diagnosis in individual patients. Their NN required the result of the TABx, had no external validation, assigned missing data a value of zero, did not examine CRP or platelets, did not maintain age or bloodwork values as continuous variables, did not consider VL (one of the most feared complications of GCA), and used a database almost half the size of that in our study.
The strengths of this study include its size, generalizability, external validation, compliance with TRIPOD guidelines, the prediction of GCA risk prior to TABx, combined application of clinical predictors such as VL plus bloodwork, maintenance of continuous variables, online calculator for the LR and NN models, the consistency of our utility rate and biopsy lengths with the published literature, and performance on DCA.
Our study is the largest diagnostic multivariable prediction rule for biopsy-proven GCA. We exceeded the 10 events per predictor variable suggested for LR, by more than fourfold. Our model complies with the TRIPOD guidelines with an analysis of missing data and external validation. Missing data analyses including MI did not suggest significant difference from our CCA. Our combined validation and holdout sets, derived from multiple centers had 177 events and 475 nonevents, exceeded the minimum sample size recommendations for external validation.21,26
The results of this multicenter study are generalizable to patients with suspected GCA who have no ocular symptoms as 79% of the subjects in our database had neither VL nor diplopia. Also, in the 681 patients (37% of total n) with an identified referral source, 46% of the patients originated from rheumatology, internal medicine, primary care, or other non-eye care practitioners.
Unlike some other algorithms,8,15 our model predicts the risk of GCA prior to TABx. Some prediction models only examine serology or neglect critical factors such as VL.9 This study emphasizes the advantages of both clinical and bloodwork variables.
To optimize statistical power, age and bloodwork values were maintained as continuous variables. Much information is lost when continuous variables are dichotomized.27 Many other prediction rules dichotomize a platelet level of ≥400 × 109/L as abnormal, rendering a platelet level of 399 × 109/L as “normal”, even though this portends a higher risk for GCA than a platelet level of 150 × 109/L. In this study, the average platelet level for the positive TABx group was 372 × 109/L (±143), which is below the commonly used cutoff for thrombocytosis.
The seemingly small odds ratios associated with continuous variables such as age and bloodwork should not be misconstrued as contributing less to the risk score than binary variables with a larger odds ratio. Age has an odds ratio of 1.06, and platelets 1.005. For every one-unit increase in age, there is a 6% increase in the odds of a positive TABx; for each unit increase in platelets, the odds of a positive TABx increases 0.5%. This concept is better visualized on a nomogram.28
Some prediction models for TABx require extensive calculations, eg, multiple likelihood ratios.11 Our user-friendly model has an online spreadsheet to calculate the risk score for the LR and NN models (https://goo.gl/THCnuU).
In this study, we find that the NN had a higher sensitivity and accuracy than the LR in predicting biopsy-proven GCA, with a substantially lower FN rate. Our models had a good internal validity on cross-validation tests, and our TABx data also support the reliability of our conclusions. The positive yield of TABx (utility rate) in this study was 25.4%, consistent with the 25% (95% CI 21, 27) median utility rate from a systematic review of the TABx literature29 and other studies.30 Although skip lesions on TABx may bias the results, our average biopsy length was 2.3 cm, which exceeds the 0.5–1.5 cm optimum length thresholds recommended by large TABx pathology series.31–33 Although the European League Against Rheumatism (EULAR) Vasculitis Study Group guidelines do not recommend routine bilateral TABx,34 the rate of discordant TABx has been reported from 3% to 12.7%.35,36 The utility rate of our unilateral (60% of our cases with 24.2% positive yield) vs bilateral TABx (40% of our cases with 24.9% positive yield) showed no statistically significant difference and likely did not influence our findings.
DCA allows the determination of net benefit by incorporating the relative consequences of false positives and negatives in order to evaluate the potential clinical usefulness of the model.37 On DCA, our prediction model is better than “biopsy all” or “biopsy none” strategies for a useful and large range of decision cut points. This prediction model may support a decision to forego TABx in frail, infirm patients with very high Pt. However, given the many side effects of long-term glucocorticoids, many clinicians would still advocate confirmatory TABx.
The weaknesses of this study include its retrospective nature (see discussion in our initial article7), misclassification error, and confinement to biopsy-proven GCA. TABx is the reference standard for the diagnosis of GCA,38 but GCA remains a clinical diagnosis. Although classification criteria for GCA exist, diagnostic criteria confirmed by large studies are pending. The NN and LR models are subject to misclassification error because of the overlapping symptoms and signs that GCA shares with other diseases, including primary HA syndrome, other autoimmune diseases,39 infection, polymyalgia, fibromyalgia, amyloidosis,40 herpes zoster,41 and NAION.10 In addition, we did not document the final diagnoses of the patients from the 14 centers, and we did not consider variables such as PMR and race for reasons outlined in the “Methods” section. Although there were missing data in 34% of the subjects (predominantly bloodwork results), MI analysis supported the results of the complete case analysis.
TABx has long been regarded as the reference standard test for GCA. However, the most recent EULAR recommendations suggest color doppler ultrasound or magnetic resonance imaging as the lead investigation for cranial GCA, in centers with imaging expertise.42 Our prediction model can be used in conjunction with imaging and emerging tests such as HLA-DRB1*04/genetic tests,43 dynamic contour tonometry of the eye44 or possibly wide-field, swept source optical coherence tomography angiography of the eye in making patient decisions for steroid initiation and TABx. In the future, larger datasets incorporating the aforementioned variables may further enhance the NN performance.
We acknowledge that many other statistical models can be applied to GCA. (Random forest decision tree provided limited discrimination in our group of patients, see Supplementary material.) Although Lee et al found that a support vector machine (SVM) algorithm accurately predicted GCA,45 we did not find SVM to be superior to LR.46 Compared with LR, NN is a “black box” technique because the intermediate hidden layer(s) do not provide a direct route from the input variables to the output. The NN had 17% fewer FNs than LR. Given the morbidity of possible blindness, FN errors were more objectionable than false-positive predictions which might lead to unnecessary TABx.
Conclusion
Both the NN and LR prediction models had good discrimination, but the NN model had fewer FNs. Prediction models aid in the objective triage of patients with suspected GCA and can improve the diagnostic yield of TABx, but they are not a substitute for TABx. No prediction model is infallible and misclassification is an ongoing concern, especially in a disease such as GCA with protean clinical manifestations and occasional occult presentation.
Disclosure
The authors report no conflicts of interest in this work.
References
Aouba A, Gonzalez Chiappe S, Eb M, et al. Mortality causes and trends associated with giant cell arteritis: analysis of the French national death certificate database (1980–2011). Rheumatology. 2018;57(6):1047–1055. | ||
Hayreh SS, Podhajsky PA, Zimmerman B. Occult giant cell arteritis: ocular manifestations. Am J Ophthalmol. 1998;125(4):521–526. | ||
Meehl P. Clinical Versus Statistical Prediction: A Theoretical Analysis and a Review of the Evidence. Minneapolis, MN: University of Minnesota Press; 1954. | ||
Ayer T, Chhatwal J, Alagoz O, Kahn CE, Woods RW, Burnside ES. Informatics in radiology: comparison of logistic regression and artificial neural network models in breast cancer risk estimation. Radiographics. 2010;30(1):13–22. | ||
Ayres I. Experts versus equations. Super Crunchers. Toronto, Canada: Bantam Books; 2007:103–128. | ||
Tu JV. Advantages and disadvantages of using artificial neural networks versus logistic regression for predicting medical outcomes. J Clin Epidemiol. 1996;49(11):1225–1231. | ||
Ing EB, Lahaie Luna G, Toren A, et al. Multivariable prediction model for suspected giant cell arteritis: development and validation. Clin Ophthalmol. 2017;11:2031–2042. | ||
González-López JJ, González-Moraleja J, Rebolleda G, Muñoz-Negrete FJ. A calculator for temporal artery biopsy result prediction in giant cell arteritis suspects. Eur J Intern Med. 2014;25(8):e98–e100. | ||
Weis E, Toren A, Jordan D, Patel V, Gilberg S. Development of a predictive model for temporal artery biopsies. Can J Ophthalmol. 2017;52(6):599–605. | ||
El-Dairi MA, Chang L, Proia AD, Cummings TJ, Stinnett SS, Bhatti MT. Diagnostic algorithm for patients with suspected giant cell arteritis. J Neuroophthalmol. 2015;35(3):246–253. | ||
Niederkohr RD, Levin LA. Management of the patient with suspected temporal arteritis a decision-analytic approach. Ophthalmology. 2005;112(5):744–756. | ||
Reitsma JB, Collins GS, Collins GS, Altman DG, Moons KG. Transparent reporting of a multivariable prediction model for individual prognosis or diagnosis (TRIPOD): the TRIPOD statement. BMJ. 2015;162(1):55–63. | ||
Grayson J, Gardner S, Stephens ML. Building Better Models with JMP pro. Cary, NC: SAS Institute; 2015. | ||
Brownlee J. Machine learning mastery; 2017. Available from: https://machinelearningmastery.com/much-training-data-required-machine-learning/. Accessed September 8, 2018. | ||
Astion ML, Wener MH, Thomas RG, Hunder GG, Bloch DA. Application of neural networks to the classification of giant cell arteritis. Arthritis Rheum. 1994;37(5):760–770. | ||
Knecht PB, Bachmann LM, Thiel MA, Landau K, Kaufmann C. Ocular pulse amplitude as a diagnostic adjunct in giant cell arteritis. Eye. 2015;29(7):860–866. | ||
Dasgupta B, Borg FA, Hassan N, et al. BSR and BHPR guidelines for the management of giant cell arteritis. Rheumatology. 2010;49(8):1594–1597. | ||
Font RL, Prabhakaran VC. Histological parameters helpful in recognising steroid-treated temporal arteritis: an analysis of 35 cases. Br J Ophthalmol. 2007;91(2):204–209. | ||
Caulfield T, Fullerton SM, Ali-Khan SE, et al. Race and ancestry in biomedical research: exploring the challenges. Genome Med. 2009;1(1):8. | ||
Kaufman JS, Cooper RS. Commentary: considerations for use of racial/ethnic classification in etiologic research. Am J Epidemiol. 2001;154(4):291–298. | ||
Vergouwe Y, Steyerberg EW, Eijkemans MJ, Habbema JD. Substantial effective sample sizes were required for external validation studies of predictive logistic regression models. J Clin Epidemiol. 2005;58(5):475–483. | ||
Fuqua D. What’s the bottom line? How to compare models. Duke Fuqua school of business; 2007. Available from: https://faculty.fuqua.duke.edu/~rnau/Decision411_2007/compare.htm. Accessed September 4, 2018. | ||
Lavery R. An Introduction to Neural Nets: An Animated Guide. 2016. Available from: https://www.lexjansen.com/nesug/nesug13/37_Final_Paper.pdf. Accessed September 1, 2018. | ||
Luque-Fernandez MA, Maringe C, Nelson P. CVAUROC: Stata module to compute cross-validated area under the curve for ROC analysis after predictive modelling for binary outcomes; 2017. Available from: https://www.researchgate.net/publication/316232933_CVAUROC_Stata_module_to_compute_Cross-validated_Area_Under_the_Curve_for_ROC_Analysis_after_Predictive_Modelling_for_Binary_Outcomes. Accessed September 1, 2018. | ||
Vickers AJ, van Calster B, Steyerberg EW. Net benefit approaches to the evaluation of prediction models, molecular markers, and diagnostic tests. BMJ. 2016;352(i6):i6. | ||
Collins GS, Ogundimu EO, Altman DG. Sample size considerations for the external validation of a multivariable prognostic model: a resampling study. Stat Med. 2016;35(2):214–226. | ||
Altman DG, Royston P. The cost of dichotomising continuous variables. BMJ. 2006;332(7549):1080. | ||
Ing EB, Ing R. The use of a nomogram to visually interpret a logistic regression prediction model for giant cell arteritis. Neuroophthalmology. 2018;42(5):284–286. | ||
Ing EB, Wang DN, Kirubarajan A, et al. Systematic review of the yield of temporal artery biopsy for suspected giant cell arteritis. Neuroophthalmology. 2018;43(1):18–25. | ||
Ing EB, Lahaie Luna G, Pagnoux C, et al. The incidence of giant cell arteritis in Ontario, Canada. Can J Ophthalmol. In press. 2018. | ||
Mahr A, Saba M, Kambouchner M, et al. Temporal artery biopsy for diagnosing giant cell arteritis: the longer, the better? Ann Rheum Dis. 2006;65(6):826–828. | ||
Ypsilantis E, Courtney ED, Chopra N, et al. Importance of specimen length during temporal artery biopsy. Br J Surg. 2011;98(11):1556–1560. | ||
Oh LJ, Wong E, Gill AJ, McCluskey P, Smith JEH. Value of temporal artery biopsy length in diagnosing giant cell arteritis. ANZ J Surg. 2018;88(3):191–195. | ||
Mukhtyar C, Guillevin L, Cid MC, et al. EULAR recommendations for the management of large vessel vasculitis. Ann Rheum Dis. 2009;68(3):318–323. | ||
Breuer GS, Nesher G, Nesher R. Rate of discordant findings in bilateral temporal artery biopsy to diagnose giant cell arteritis. J Rheumatol. 2009;36(4):794–796. | ||
Boyev LR, Miller NR, Green WR. Efficacy of unilateral versus bilateral temporal artery biopsies for the diagnosis of giant cell arteritis. Am J Ophthalmol. 1999;128(2):211–215. | ||
Van Calster B, Vickers AJ. Calibration of risk prediction models. Med Decis Making. 2015;35(2):162–169. | ||
Frohman L, Wong AB, Matheos K, Leon-Alvarado LG, Danesh-Meyer HV. New developments in giant cell arteritis. Surv Ophthalmol. 2016;61(4):400–421. | ||
Ong Tone S, Godra A, Ing E. Polyangiitis overlap syndrome with granulomatosis with polyangiitis (Wegener’s) and giant cell arteritis. Can J Ophthalmol. 2013;48(1):e6–e8. | ||
Ing EB, Woolf IZ, Younge BR, Bjornsson J, Leavitt JA. Systemic amyloidosis with temporal artery involvement mimicking temporal arteritis. Ophthalmic Surg Lasers. 1997;28(4):328–331. | ||
Ing EB, Ing R, Liu X, et al. Does herpes zoster predispose to giant cell arteritis: a geo-epidemiologic study. Clin Ophthalmol. 2018;12:113–118. | ||
Dejaco C, Ramiro S, Duftner C, et al. EULAR recommendations for the use of imaging in large vessel vasculitis in clinical practice. Ann Rheum Dis. 2018;77(5):636–643. | ||
Carmona FD, Gonzalez-Gay MA, Martin J. Genetic component of giant cell arteritis. Rheumatology. 2014;53(1):6–18. | ||
Ing E, Pagnoux C, Tyndel F, et al. Lower ocular pulse amplitude with dynamic contour tonometry is associated with biopsy-proven giant cell arteritis. Can J Ophthalmol. 2018;53(3):215–221. | ||
Lee M, De Smit E, Wong Ten Yuen A, Sarossy M. The use of statistical modeling to predict temporal artery biopsy outcome from presenting symptoms and laboratory results. Acta Ophthalmologica. 2014;92:s253. | ||
Ing E, Su W, Schonlau M, Torun N. Comparison of support vector machines and logistic regression to predict temporal artery biopsy outcomes. Can J Ophthalmol. 2018. |
 © 2019 The Author(s). This work is published and licensed by Dove Medical Press Limited. The full terms of this license are available at https://www.dovepress.com/terms.php and incorporate the Creative Commons Attribution - Non Commercial (unported, v3.0) License.
By accessing the work you hereby accept the Terms. Non-commercial uses of the work are permitted without any further permission from Dove Medical Press Limited, provided the work is properly attributed. For permission for commercial use of this work, please see paragraphs 4.2 and 5 of our Terms.
© 2019 The Author(s). This work is published and licensed by Dove Medical Press Limited. The full terms of this license are available at https://www.dovepress.com/terms.php and incorporate the Creative Commons Attribution - Non Commercial (unported, v3.0) License.
By accessing the work you hereby accept the Terms. Non-commercial uses of the work are permitted without any further permission from Dove Medical Press Limited, provided the work is properly attributed. For permission for commercial use of this work, please see paragraphs 4.2 and 5 of our Terms.