")
Back to Journals » Cancer Management and Research » Volume 11
NETO2 promotes pancreatic cancer cell proliferation, invasion and migration via activation of the STAT3 signaling pathway
Authors Li YX, Zhang YP, Liu JS
Received 5 February 2019
Accepted for publication 15 April 2019
Published 6 June 2019 Volume 2019:11 Pages 5147—5156
DOI https://doi.org/10.2147/CMAR.S204260
Checked for plagiarism Yes
Review by Single anonymous peer review
Peer reviewer comments 2
Editor who approved publication: Dr Chien-Feng Li
Yaxiong Li,* Yongping Zhang,* Jiansheng Liu
Department of General Surgery, First Hospital of Shanxi Medical University, Taiyuan, 030001, Shanxi, People’s Republic of China
*These authors contributed equally to this work
Purpose: The biological functions of neuropilin and tolloid-like 2 (NETO2) in the progression of pancreatic cancer remained unexplored. We aimed to investigate the biological roles and underlying molecular mechanisms of NETO2 in pancreatic cancer.
Materials and methods: Thirty paired pancreatic tumor tissue samples and corresponding nontumor tissues were obtained from 30 pancreatic cancer patients who did not receive preoperative chemotherapy or radiotherapy. The changes in multiple cellular functions associated with tumor progression were assessed after NETO2 knockdown/overexpression in pancreatic cancer cell lines. Additionally, a mouse-xenograft model was developed to verify the in vitro results.
Results: NETO2 was upregulated in pancreatic tumor tissues. Elevated expression of NETO2 was not only associated with an advanced tumor stage, but was also a prediction of poor prognosis for pancreatic cancer patients. Knockdown of NETO2 in pancreatic cancer cell lines arrested the cell cycle and inhibited cell proliferation, colony formation, invasion, and migration; in contrast, overexpression of NETO2 had an opposite effect on all of these parameters. A STAT3 specific inhibitor, cryptotanshinone, reversed the tumor-promoting effects induced by NETO2 overexpression in pancreatic cancer. Western blot analysis showed that invasion and migration were closely related to epithelial–mesenchymal transition, and that the STAT3 signaling pathway was involved in NETO2-mediated oncogenic transformation in pancreatic cancer cells. Furthermore, NETO2 knockdown significantly inhibited the growth of pancreatic tumor xenografts in nude mice.
Conclusion: NETO2 has an important role in the progression and metastasis of pancreatic cancer and could serve as a novel candidate for targeted therapy of pancreatic cancer.
Keywords: pancreatic cancer, NETO2, proliferation, metastasis, STAT3
Introduction
Pancreatic cancer is a deadly malignancy with a current overall 5-year survival rate of 8%, and the major reason for its dismal survival rate has been ascribed to its early metastasis and delayed diagnosis.1 Surgical resection, which is regarded as the only curative treatment, is not applicable for over 80% of patients in which the disease is locally advanced or metastasized.2 For these patients, standard chemotherapy regimens—including gemcitabine-based combination chemotherapy and FOLFIRINOX chemotherapy—cannot significantly prolong survival.3,4 A major reason for this lack of treatment efficacy is that the molecular mechanisms of pancreatic cancer carcinogenesis and metastasis remain unclear. Therefore, it is crucial to elucidate these molecular mechanisms and to identify early diagnostic biomarkers and potential therapeutic targets for pancreatic cancer.
Neuropilin and tolloid-like 2 (NETO2) gene, located on chromosome 16, encodes a single-pass transmembrane protein.5,6 Initial studies have mainly focused on its biological functions in neural-specific processes.7 However, subsequent reports have revealed that the expression of NETO2 is also found in several non-neural tissues, and recent studies have further indicated that NETO2 expression is associated with various cancers such as renal, lung, colon, cervical and colorectal cancer.8,9 In particular, a clinical study of the relationship between dysregulation of NETO2 expression and colorectal cancer progression has suggested that NETO2 upregulation is associated with poor prognosis and may function as a potential biomarker of advanced carcinoma progression.10 However, the expression pattern and biological roles of NETO2 in pancreatic cancer remain unexplored.
The present study investigated NETO2 expression in the tumor tissues and adjacent nontumor tissues of pancreatic cancer patients and assessed the correlation between NETO2 expression and clinical consequences. Furthermore, we explored the biological functions of NETO2 in proliferation, invasion, and migration of pancreatic cancer cells and their underlying molecular mechanisms.
Materials and methods
Tissue samples
This study was approved by the Ethics Committee of the First Hospital of Shanxi Medical University, and written informed consent was provided by all patients for the clinical-research use of their tumor tissues. Thirty paired pancreatic tumor tissue samples and corresponding adjacent nontumor tissues were obtained from 30 pancreatic cancer patients who did not receive preoperative chemotherapy or radiotherapy at the First Hospital of Shanxi Medical University (Taiyuan, China). The fresh tumor tissue samples and corresponding nontumor tissue samples were stored at −80 °C within 15 mins of harvesting, until further real-time quantitative PCR (qPCR) analysis.
Cell culture and reagents
Human pancreatic cancer cell lines—including PANC-1, Capan-1, AsPC-1, PATU 8988, and MIA PaCa-2—were purchased from the Shanghai Institutes for Biological Sciences (Shanghai, China). PANC-1, PATU 8988, and MIA PaCa-2 were maintained in high-glucose DMEM (Gibco, Waltham, MA, USA) supplemented with 10% FBS (Gibco) and 1% antibiotics (100 μg/mL streptomycin and 100 U/mL penicillin G); AsPC-1 was maintained in RPMI-1640 (Gibco) supplemented with 10% FBS (Gibco) and 1% antibiotics (100 μg/mL streptomycin and 100 U/mL penicillin G); Capan-1 was maintained in high-glucose DMEM (Gibco) supplemented with 15% FBS (Gibco) and 1% antibiotics (100 μg/mL streptomycin and 100 U/mL penicillin G). All cell lines were cultured at 37°C in a humidified incubator containing 5% CO2.
Cryptotanshinone (Cat. No. S2285), a potent STAT3 inhibitor, was purchased from Selleck, and incubated with PATU 8988 and MIA PaCa-2 at 5.8 μM for 24 hrs.
Cell transfection
Full-length NETO2 cDNA (GenBank accession number NM_001201477.1) was subcloned into an expression vector (pcDNA3.1/+) using the primer sequences 5’-AGCTGCTCCACGTCAAAGAA-3’ and 5’-GCTCCC-GAGAGCTCGAA-3’. Then, a NETO2 overexpression plasmid and control vector (ie an empty pcDNA3.1/+ plasmid) was transfected into MIA PaCa-2 and PATU 8988 cells. The NETO2 expression level was examined by western blot.
The sequences of the siRNA specifically targeting NETO2 and its negative control (NC) were 5′-GCAGGAGUAUUUGAACAAA-3′ and 5ʹ-TTCTC-CGAACGTGTCACGT-3ʹ, respectively. A lentivirus-NETO2-shRNA (lv-shNETO2) that expressed NETO2-siRNA and a lentivirus-NC-shRNA (lv-shNC) that expressed NC-siRNA were purchased from Genechem (Shanghai, China). These lentiviruses—which contained puromycin resistance and a green-fluorescent protein reporter gene—were then stably transfected into PANC-1 and Capan-1 cells over 48 hrs at a multiplicity of infection of 50. These transfected cells were selected by puromycin (2 μg/mL) for 3 days and were used in subsequent experiments.
Quantitative real-time PCR
Total RNA was extracted from tissue samples and cultured cells using TRIzol reagent (Invitrogen, Waltham, MA, USA). Then, a reverse transcription reagent kit (TaKaRa, Dalian, China) was used to synthesize the cDNA. Quantitative real-time PCR was performed to amplify the target genes and measure their expression with glyceraldehyde 3-phosphate dehydrogenase (GAPDH) as an internal loading control. The SYBR-Green method was used according to the manufacturer’s instructions for this process and the results were analyzed with the 2−ΔΔCT method described previously.11
Western blot analysis
Cells were lysed in RIPA buffer (Beyotime, Shanghai, China) with a phosphatase inhibitor cocktail and protease inhibitor. After measuring the concentration of the extracted proteins with a BCA Protein Assay kit (Beyotime), equal amounts of protein were separated by SDS-PAGE and then transferred to polyvinylidene difluoride membranes. Membranes were then blocked with 5% skim milk. After 1 hr of blocking, the membranes were incubated at 4°C overnight with the following primary antibodies: anti-NETO2 (1:200; Abcam), anti-N-cadherin (1:1,000; CST), anti-E-cadherin (1:1,000; CST), anti-vimentin (1:1,000; CST), STAT3 (1:1,000; CST), phospho-STAT3 (p-STAT3) (Tyr705) (1:1,000; CST), Cyclin D1 (1:1,000; CST) and the internal control anti-GAPDH (1:5,000; Abways). After being washed in TBST three times, the membranes were incubated for 1 hr at room temperature with a secondary antibody (goat anti-mouse/anti-rabbit IgG-HRP; 1:2,000, Abcam). The bands were visualized with a chemiluminescent substrate enhanced chemiluminescence kit according to the manufacturer’s instruction.
Cell proliferation assay
Cell proliferation was quantitatively analyzed by cell counting kit-8 (CCK8) assay (Dojindo, Japan) according to the manufacturer’s instructions. The OD was detected at the wavelength of 450 nm using a microplate reader (TEK,Bio- Saxony, USA).
Colony formation assay
The same number of transfected and non-transfected cells were separately seeded at a density of 500 cells/well into 6-well plates. The cells were subsequently cultured on the plates for 2–3 weeks. Then, the cell colonies (>50 cells/colony) were counted and photographed after crystal violet staining.
Cell cycle analysis
Cells were seeded and cultured in 6-well plates. Forty-eight hours after transfection, the cells were collected and then fixed with chilled 70% ethanol at 4°C for 12 hrs. Subsequently, the cells were stained with propidium iodide (Sigma-Aldrich, St Louis, MO, USA) at room temperature in the dark for 30 min and then analyzed by flow cytometry (BD Biosciences, San Jose, CA, USA).
Cell invasion and migration assays
Cell invasion and migration capability were evaluated using transwell chambers (pore size of 8 µm; Corning Incorporated, Corning, NY, USA) with Matrigel and without Matrigel, respectively. The same number of differently treated cells were separately resuspended in 200 μL of serum-free DMEM and then plated in the upper chambers (PANC-1, 2×10⁴; Capan-1, 5×10⁴; PATU 8988, 3×10⁴; and MIA PaCa-2, 3.5×10⁴). The lower chambers were loaded with 600 μL of DMEM/10% FBS media. After incubation for 24 hrs (migration assay) or 48 hrs (invasion assay), the cells were fixed with 4% paraformaldehyde and then stained with 0.1% crystal violet. Five random visual fields at 100× magnification were selected for quantification of penetrated cells in each well.
Mouse xenograft model
A suspension of PANC-1 (5×10⁶) cells transfected with lv-shNETO2 or lv-shNC were injected into the right flank of 4- to 6-week-old male BALB/c nude mice (Slac, Shanghai, China) which were cared for under standard conditions in accordance with the guidelines of First Hospital of Shanxi Medical University Ethics Committee. Tumor volume was calculated every week by measuring the tumor width and length and then employing the equation: V=4π/3× (width/2)2 × (length/2). After 30 days, the mice were sacrificed and the tumors were collected and weighed. In this study, all animal experiments were approved by the First Hospital of Shanxi Medical University Ethics Committee.
Immunohistochemical staining
After collection and weighing, the xenograft tumors were immediately fixed in 10% formalin. Subsequently, the tumors were embedded in paraffin and cut into 5-mm sections with the following steps. Briefly, these sections were incubated with the anti-Ki67 primary antibody (1:400; Abcam) at 4°C overnight and a goat anti-rabbit-peroxidase-conjugated secondary antibody (1:1,000; Santa Cruz Biotechnology Inc., Dallas, TX, USA) at room temperature for 1 hr, successively. Then, a DAB Substrate Kit (Maxin) was used for the following immunohistochemical staining according to the manufacturer’s instructions and staining results were observed and imaged through a light microscope.
Statistical analysis
All experiments were conducted three times and statistical analyses were performed using GraphPad Prism 5 (GraphPad Software, Inc., La Jolla, CA, USA) and SPSS 19.0 software (SPSS Inc., Chicago, IL, USA). Quantified values are expressed as the mean ± SD. χ2 tests and independent Student’s t-tests were used to evaluate the effects of NETO2 on pancreatic cancer cell lines. Survival analysis was performed with Kaplan-Meier analysis. P<0.05 (*P<0.05, **P<0.01, ***P<0.001) was considered to represent statistical significance.
Results
NETO2 is upregulated in pancreatic tumor tissues and correlates with poor survival
To determine the expression pattern of NETO2 in pancreatic tumor tissues, we conducted real-time qPCR analysis to compare the relative mRNA levels of NETO2 in 30 pairs of matched pancreatic tumor tissue samples. NETO2 was significantly upregulated in pancreatic tumor tissues compared with that of adjacent nontumor tissues (Figure 1A and B). Furthermore, these pancreatic tumor tissue samples were divided into three groups (stage I, stage II and stage III-IV) according to the current American Joint Committee on Cancer (AJCC) staging system. The results of real-time qPCR analysis showed that mRNA levels of NETO2 in later-stage groups were significantly higher than those in lower stage groups (Figure 1C). This correlation suggested that NETO2 may be closely linked with pancreatic cancer progression and development. In addition, we divided these pancreatic tumor samples into two groups according to the expression of NETO2 (ie, high/low NETO2 expression groups) by setting the median NETO2 expression level as the cutoff point. Kaplan-Meier analysis showed that higher NETO2 expression was correlated with worse overall survival (Figure 1D). These clinical data suggest that NETO2 is upregulated in pancreatic cancer and that this upregulation is associated with an advanced tumor stage and poor prognosis.
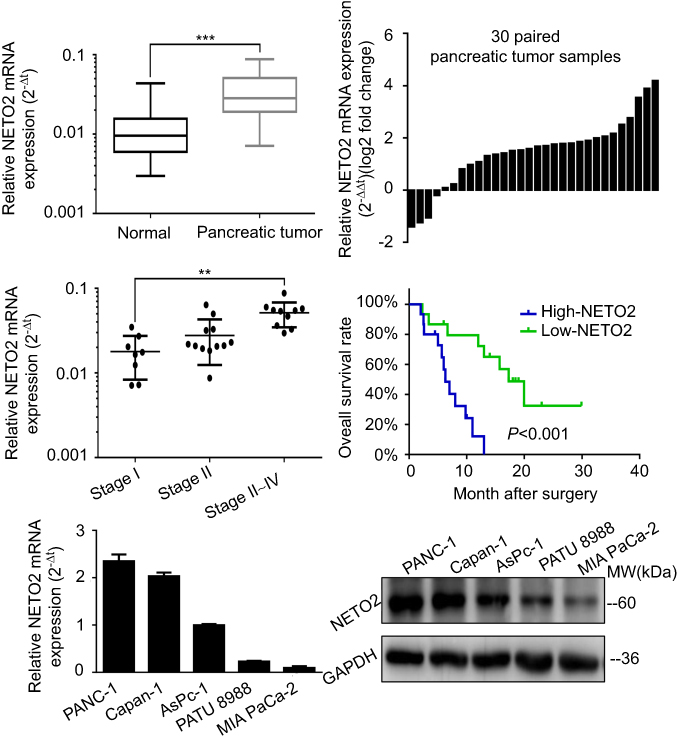 | Figure 1 NETO2 expression and its significance in pancreatic tumor tissues and cell lines.Notes: (A) Relative NETO2 mRNA levels in 30 pancreatic tumor tissue samples and adjacent nontumor tissues. ***P<0.001. (B) Comparison of NETO2 mRNA levels between pancreatic tumor tissues and their corresponding adjacent nontumor tissues. (C) Relative NETO2 mRNA levels in three different cancer stages of pancreatic tumor samples. **P<0.01. (D) Kaplan-Meier overall survival curve of pancreatic cancer patients with high (n=15) and low (n=15) NETO2 mRNA levels. ***P<0.001. (E) Relative NETO2 mRNA levels in five pancreatic cancer cell lines. (F) Relative NETO2 protein levels in five pancreatic cancer cell lines. |
Different NETO2 expression levels in various pancreatic cancer cell lines
To explore the biological function of NETO2 in pancreatic cancer cells, we first conducted real-time qPCR and western blot assays to assess NETO2 expression levels in five pancreatic cell lines (Figure 1E and F). The results showed that NETO2 was differentially expressed both at mRNA and protein levels. Specifically, PANC-1 and Capan-1 cells expressed higher levels of NETO2 compared with those in MIA PaCa-2 and PATU 8988 cells. Thus, for further functional experimentation, we selected PANC-1 and Capan-1 cell lines to construct knockdown models and MIA PaCa-2 and PATU 8988 cell lines to construct overexpression models. NETO2 expression was determined by using western blot analysis (Figure 2A and B).
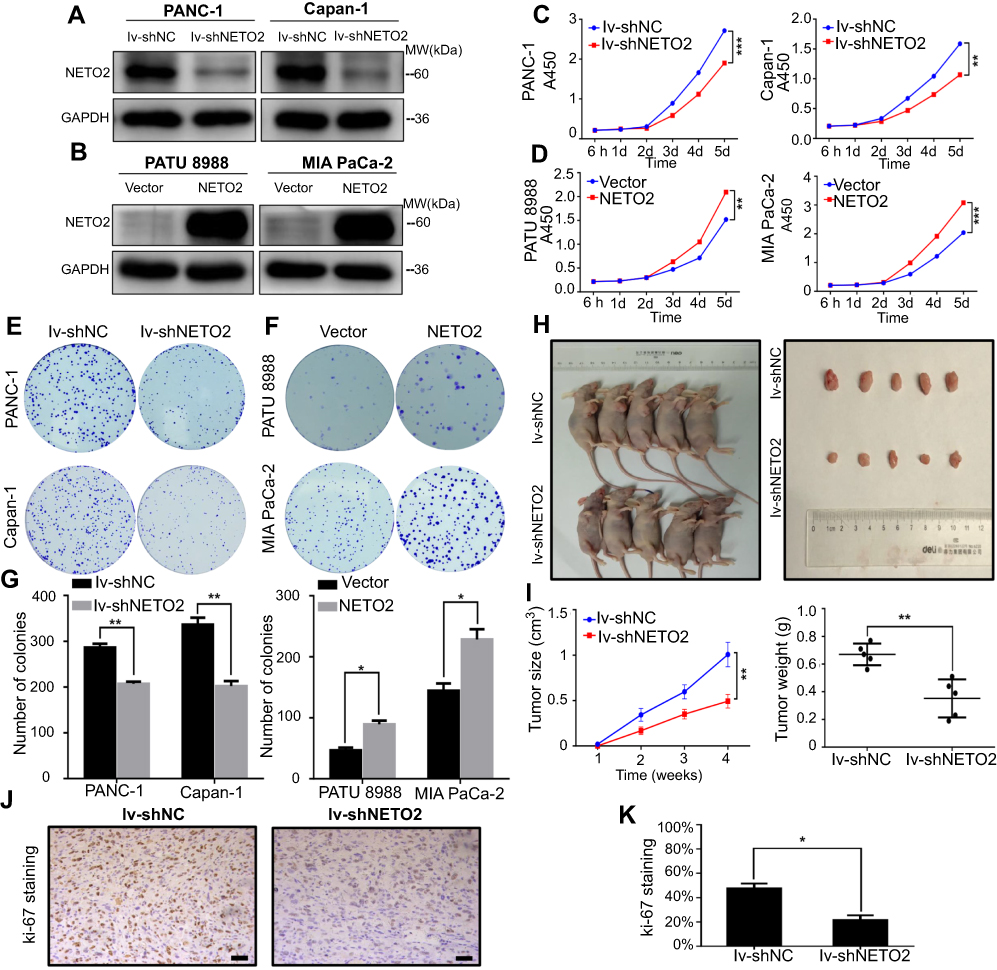 | Figure 2 Effect of NETO2 knockdown and overexpression on the proliferation of pancreatic cancer cells. Notes: (A and B) Relative NETO2 protein levels in PANC-1 and Capan-1 cells infected with lv-shNETO2/lv-shNC. (A) Relative NETO2 protein levels in PATU 8988 and MIA PaCa-2 cells transfected with control or NETO2-expressing plasmid (B). GAPDH served as the internal control. (C and D) Cell proliferation was assessed after NETO2 knockdown (C) and overexpression (D) in pancreatic cancer cell lines with CCK8 assays. **P<0.01, ***P<0.001. (E and F) Colony-formation capability was assessed in pancreatic cancer cell lines with NETO2 knockdown (E) or overexpression (F). (G) The number of colonies was counted; scale bar = 100 μm. *P<0.05, **P<0.01. (H) Representative results after a mouse were injected with differentially treated PANC-1 cells (infected with lv-shNETO2/lv-shNC) and the corresponding tumors. (I) Tumor size and weight were analyzed quantitatively. **P<0.01. (J and K) IHC analysis of Ki-67 expression in xenograft tumors; scale bar = 100 μm. *P<0.05. Abbreviations: lv, lentivirus; NC, negative control; IHC, immunohistochemistry; CCK8, cell counting kit-8. |
NETO2 enhances proliferative capability of pancreatic cancer cells in vitro
CCK8 and colony formation assays were performed to assess the effects of NETO2 in pancreatic cancer cells. As CCK8 assays showed, NETO2 knockdown restrained the proliferation of PANC-1 and Capan-1 cells (Figure 2C). Similarly, we obtained the same results from colony assays in that the number of colonies was significantly reduced after NETO2 knockdown (Figure 2E and G). In contrast, NETO2 overexpression in MIA PaCa-2 and PATU 8988 cells displayed the opposite pattern in that cell proliferation and the number of colonies were significantly increased (Figure 2D, F and G). These results demonstrate that NETO2 expression enhances the proliferative capability of pancreatic cancer cells.
NETO2 knockdown suppresses pancreatic tumor growth in vivo
We then explored the effects of NETO2 on tumor growth. Compared with the NC group, tumor volume and weight were significantly reduced in the NETO2-knockdown group (Figure 2H and I). Immunohistochemical staining also showed that the expression of the cell proliferation marker, Ki-67, in the NETO2-knockdown group was lower than in the NC group (Figure 2J and K). These results suggested that NETO2 may play an important role in pancreatic tumor growth in vivo.
NETO2 promotes pancreatic cancer cell invasion and migration by regulation of the epithelial–mesenchymal transition
In order to explore the role of NETO2 in changes to pancreatic tumor aggressiveness, we performed invasion and migration transwell assays. Since the expression level of NETO2 also influenced cell proliferation, we first conducted statistical analysis of the 24/48 hr CCK8 data to evaluate the effect of cell proliferation on the results. The result showed that there were no statistical differences in the cell proliferation level between different treatment groups after cells were cultured for 24 h/48 h, which meant that the differences of penetrated cell number between different treatment groups were due to cell migration (24 hr)/invasion (48 hr) rather than cell proliferation. As shown in Figure 3A, NETO2 knockdown remarkably impaired the invasive and migratory capacities of PANC-1 and Capan-1 cells. Corresponding to the above results, NETO2 overexpression increased the invasiveness and migratory capacities of MIA PaCa-2 and PATU 8988 cells (Figure 3B). Given that tumor cell invasion and migration is usually associated with epithelial–mesenchymal transition (EMT), we assessed the expression of EMT-associated markers by western blot analysis. As shown in Figure 3C, NETO2 knockdown in PANC-1 and Capan-1 cells increased E-cadherin expression, but reduced the expression of N-cadherin and vimentin. Remarkably, NETO2 overexpression in MIA PaCa-2 and PATU 8988 cells caused the opposite results. Such findings suggest that NETO2 promotes pancreatic cancer cell invasion and migration by regulation of EMT.
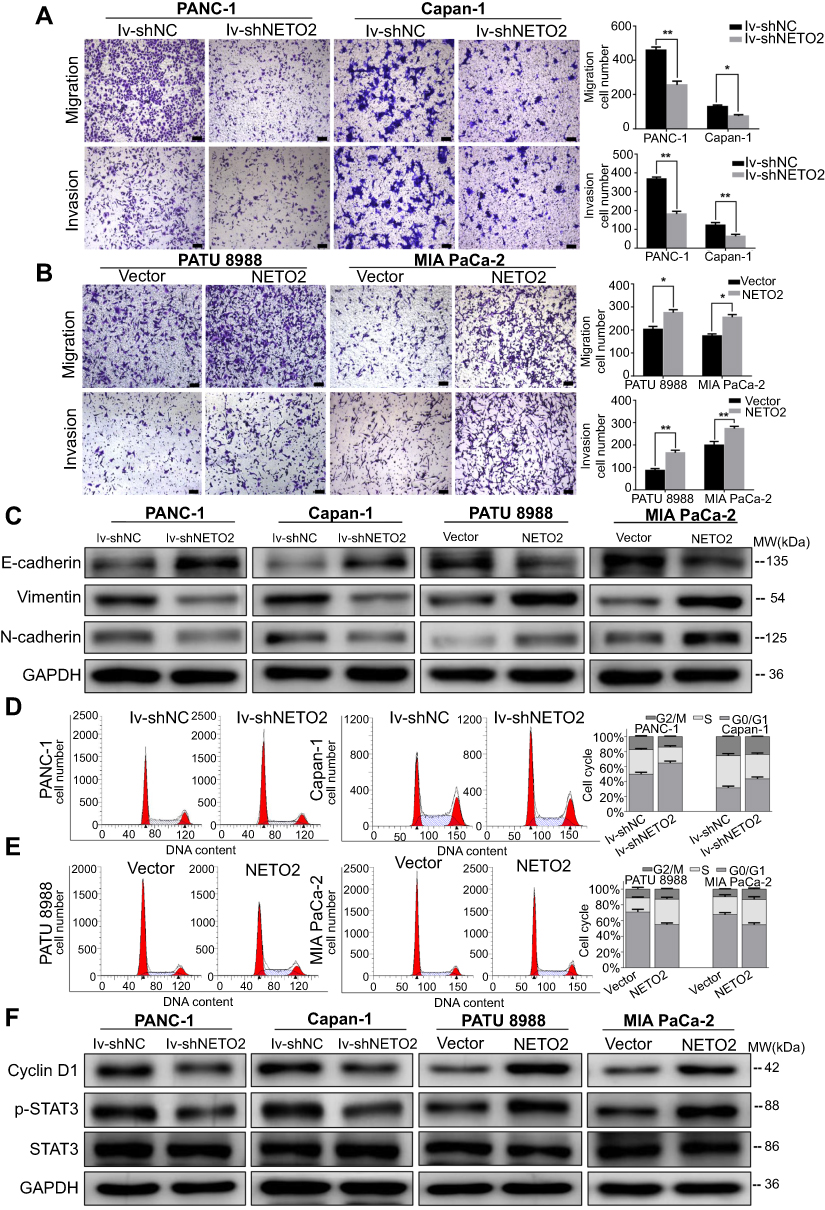 | Figure 3 Effects of NETO2 knockdown and overexpression on migration, invasion and cell cycle progression of pancreatic cancer cells.Notes: (A and B) Migration and invasion analysis of pancreatic cancer cell lines with NETO2 knockdown (A) or overexpression (B). Scale bar =100 μm. *P<0.05, **P<0.01. (C) Western blot analysis of E-cadherin, vimentin and N-cadherin. GAPDH was used as a loading control. (D and E) Cell cycle analysis of pancreatic cancer cell lines with the NETO2 knockdown (D) or overexpression (E). The x-axis represents the cell cycle distribution, and the y-axis represents the cell number. (F) Western blot analysis of Cyclin D1, p-STAT3, STAT3. GAPDH was used as a loading control. Abbreviations: lv, lentivirus; NC, negative control. |
NETO2 accelerates cell cycle progression of pancreatic cancer
We investigated the effects of NETO2 on cell cycle progression to further explore the promoting function of NETO2 on cell proliferation. NETO2 knockdown, both in PANC-1 and Capan-1 cells, led to more cells remaining in G1 phase because the cell cycle transition from G1 to S phase was blocked, thus inhibiting cell proliferation (Figure 3D). In contrast, NETO2 overexpression in MIA PaCa-2 and PATU 8988 cells induced the converse effect (Figure 3E).
Furthermore, we examined the expression level of Cyclin D1, a key cell cycle regulating protein. As shown in Figure 3F, we found that Cyclin D1 expression levels in NETO2-knockdown cells were lower than that in NC cells. Additionally, NETO2-overexpressed cells had higher expression levels of Cyclin D1 protein than that in NC cells. Taken together, these results demonstrate that NETO2 accelerates the cell cycle progression of pancreatic cancer.
NETO2 regulates the STAT3 signaling pathway in pancreatic cancer cells
To further elucidate the underlying mechanism of NETO2 in pancreatic cancer cells, we compared the expressions of several cell proliferation-associated genes upstream of Cyclin D1 by western blot analysis. We found that NETO2 knockdown decreased the phosphorylation of STAT3, while NETO2 overexpression increased STAT3 activation (Figure 3F). Thus, we speculated that NETO2 might be associated with the STAT3 signaling pathway in pancreatic cancer cells. The STAT3 inhibitor cryptotanshinone was used for further exploration. As shown in Figure 4A and B, cryptotanshinone blocked NETO2-mediated cell invasion and migration in these cancer cells. Likewise, CCK8 assays and cell cycle analysis revealed that cryptotanshinone treatment inhibited NETO2-mediated cell proliferation in MIA PaCa-2 and PATU 8988 cells (Figure 4C and D). Consistently, western blot analysis showed that cryptotanshinone reversed the effects of NETO2 overexpression on the expression of Cyclin D1, E-cadherin, vimentin, N-cadherin, and p-STAT3 (Figure 4E). These results suggest that NETO2 enhances the capabilities of proliferation, invasion and migration of pancreatic cancer cells by activation of the STAT3 pathway.
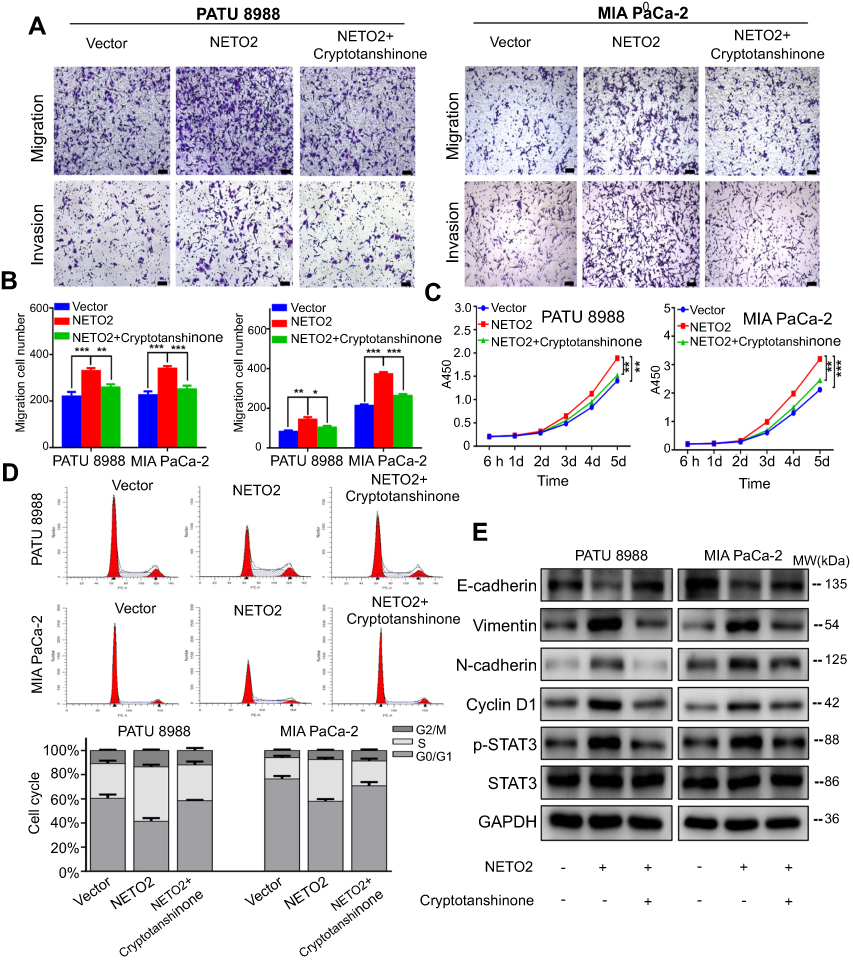 | Figure 4 Suppression of STAT3 phosphorylation antagonizes NETO2-mediated pancreatic cancer cell proliferation, invasion and migration. Notes: (A and B) Invasion and migration assays for NETO2-overexpressed pancreatic cancer cells with or without 5.8 μM cryptotanshinone treatment. Scale bar = 100 μm. *P<0.05, **P<0.01, ***P<0.001. (C) CCK8 assay for NETO2-overexpressed pancreatic cancer cells with or without 5.8 μM cryptotanshinone treatment. **P<0.01, ***P<0.001. (D) Cell cycle analysis of NETO2-overexpressed pancreatic cancer cells with or without 5.8 μM cryptotanshinone treatment. The x-axis represents the cell cycle distribution, and the y-axis represents the cell number. (E) Western blot analysis of E-cadherin, vimentin, N-cadherin, Cyclin D1, p-STAT3, and STAT3 for NETO2-overexpressed pancreatic cancer cells with or without 5.8 μM crytotanshinone treatment. GAPDH was used as a loading control. Abbreviations: lv, lentivirus; NC, negative control; CCK8, cell counting kit-8. |
Discussion
Previous studies of NETO2 have mainly focused on its neurobiological aspects. Nevertheless, the association between elevated expression of NETO2 and malignant tumor transformation has been subsequently revealed for many types of tumors. In the present study, we found that NETO2 was upregulated in pancreatic cancer tissues compared with adjacent nontumor tissues. Moreover, the elevated expression of NETO2 was associated with an advanced tumor stage of pancreatic cancer patients and indicated poor prognosis. These results are in line with previous studies that have indicated that increased NETO2 expression can be detected in various cancers and may contribute to early diagnosis.8–10 Therefore, NETO2 could serve as a potential therapeutic target in pancreatic cancer and may be useful for diagnosis and prognosis.
STAT3, a member of the STAT family, has been identified as a critical transcription factor in the malignant transformation of many types of tumors.12–14 Upstream stimuli activate the STAT3 signaling pathway through promotion of STAT3 phosphorylation. The increased phosphorylation at Tyr 705 of STAT3 induces the interaction of the SH2 domain and phosphotyrosine, thereby causing STAT3 dimerization and the following translocation to the nucleus. Once within the nucleus, dimerized STAT3 regulates the expression of target genes related to proliferation and metastasis, such as Cyclin D1.15,16 In the present study, we demonstrated that NETO2 knockdown induced G0/G1 phase cell cycle arrest and thus inhibited pancreatic cancer cell proliferation by reducing the phosphorylation of STAT3 and subsequently attenuating the expression of Cyclin D1.
The EMT process has been demonstrated to be required for invasion and metastasis in many types of human cancers.17–19 In the EMT process, which is also considered to be regulated by many signaling pathways, including the STAT3 signaling pathway,20 epithelial cells lose their epithelial properties, such as decreased expression of epithelial markers (eg, E-cadherin), and gain mesenchymal phenotypes, such as increased expression of mesenchymal markers (eg, vimentin, N-cadherin).21,22 In the present study, we found that NETO2 participates in the regulation of EMT through the STAT3 signaling pathway which alters the expression of these EMT-related proteins. It should be noted that a previous study indicated there was no significant correlation between the mRNA expression levels of NETO2 gene and EMT-related genes in colorectal cancer tissues.8 The possible reasons for this discrepancy include the following: (1) the effects of NETO2 on EMT vary between cancer types; (2) non-tumor cells in tumor tissues may interfere with real-time qPCR analysis of EMT-related genes at the mRNA level; and (3) a different selection of samples may have a different impact on the results. To summarize, we argue that NETO2 upregulation drives the process of EMT by activating the STAT3 signaling pathway and hence promotes invasion and migration of pancreatic cancer cells. Our research further demonstrated that NETO2-mediated oncogenic function in pancreatic cancer cells could be reversed by cryptotanshinone (a STAT3-specific inhibitor) via inhibition of STAT3 phosphorylation. Furthermore, we found that NETO2 knockdown could significantly inhibit tumor growth in vivo in nude mice.
Conclusion
NETO2 acts as an oncogenic gene in pancreatic cancer by activating the STAT3 signaling pathway. The detection of NETO2 expression may provide help for early diagnosis and prognosis of pancreatic cancer. We also argue that NETO2 could serve as a novel candidate for targeted therapy of pancreatic cancer.
Acknowledgments
We are grateful to Prof. Liu Yingbin and his research group for their generous help in providing experimental guidance. We also thank Dr. Hu Yunping and Dr. Song Xiaoling for editing the revised manuscript.
Disclosure
The authors report no conflicts of interest in this work.
References
1. Siegel RL, Miller KD, Jemal A. Cancer statistics, 2018. CA Cancer J Clin. 2018;68(1):7–30. doi:10.3322/caac.21442
2. Teague A, Lim KH, Wang-Gillam A. Advanced pancreatic adenocarcinoma: a review of current treatment strategies and developing therapies. Ther Adv Med Oncol. 2015;7(2):68–84. doi:10.1177/1758834014564775
3. Cid-Arregui A, Juarez V. Perspectives in the treatment of pancreatic adenocarcinoma. World J Gastroenterol. 2015;21(31):9297–9316. doi:10.3748/wjg.v21.i31.9297
4. Mian OY, Ram AN, Tuli R, et al. Management options in locally advanced pancreatic cancer. Curr Oncol Rep. 2014;16(6):388–482. doi:10.1007/s11912-014-0388-y
5. Finelli P, Sirchia SM, Masciadri M, et al. Juxtaposition of heterochromatic and euchromatic regions by chromosomal translocation mediates a heterochromatic long-range position effect associated with a severe neurological phenotype. Mol Cytogenet. 2012;5(1):16. doi:10.1186/1755-8166-5-16
6. Stohr H. A novel gene encoding a putative transmembrane protein with two extracellular CUB domains and a low-density lipoprotein class A module: isolation of alternatively spliced isoforms in retina and brain. Gene. 2002;286(2):223–231. doi:10.1016/S0378-1119(02)00438-9
7. Ivakine EA, Acton BA, Mahadevan V, et al. Neto2 is a KCC2 interacting protein required for neuronal Cl- regulation in hippocampal neurons. Proc National Acad Sci. 2013;110(9):3561–3566. doi:10.1073/pnas.1212907110
8. Fedorova MS, Snezhkina AV, Pudova EA, et al. Upregulation of NETO2 gene in colorectal cancer. BMC Genet. 2017;18(S1):117. doi:10.1186/s12863-017-0581-8
9. Niu O, Sadritdinova AF, Snezhkina AV, et al. [Increase in NETO2 gene expression is a potential molecular genetic marker in renal and lung cancers]. Genetika. 2012;48(5):506–512. doi:10.1134/S1022795412050171
10. Hu L, Chen HY, Cai J, et al. Upregulation of NETO2 expression correlates with tumor progression and poor prognosis in colorectal carcinoma. BMC Cancer. 2015;15(1):1006. doi:10.1186/s12885-015-2018-y
11. Xiaoling S, Minghui Z, Fahong Z, et al. ZFX promotes proliferation and metastasis of pancreatic cancer cells via the MAPK pathway. Cell Physiol Biochem. 2018;48(1):274–284. doi:10.1159/000491727
12. Banerjee K, Resat H. Constitutive activation of STAT3 in breast cancer cells: a review. Int J Cancer. 2016;138(11):2570–2578. doi:10.1002/ijc.29923
13. Fukuda A, Wang S, Morris JP
14. Surana R. Targeting the STAT3 signaling pathway in cancer: role of synthetic and natural inhibitors. Biochim Biophys Acta. 2014;1845(2):136–154. doi:10.1016/j.bbcan.2013.12.005
15. Yu H, Jove R. The STATs of cancer–new molecular targets come of age. Nat Rev Cancer. 2004;4:97–105. doi:10.1038/nrc1275
16. Zhang Z, Duan Q, Zhao H, et al. Gemcitabine treatment promotes pancreatic cancer stemness through the Nox/ROS/NF-κB/STAT3 signaling cascade. Cancer Lett. 2016;382(1):53–63. doi:10.1016/j.canlet.2016.08.023
17. Hu YP, Wu ZB, Jiang L, et al. STYK1 promotes cancer cell proliferation and malignant transformation by activating PI3K-AKT pathway in gallbladder carcinoma. Int J Biochem Cell Biol. 2018;97:16–27. doi:10.1016/j.biocel.2018.01.016
18. Jin, YJ, Li F, Zheng C, et al. NEDD9 promotes lung cancer metastasis through epithelial- mesenchymal transition. Int J Cancer. 2014;134(10):2294–2304. doi:10.1002/ijc.28568
19. Bethany S, Neil B. Role of EMT in metastasis and therapy resistance. J Clin Med. 2016;5(2):17. doi:10.3390/jcm5020017
20. Liu RY, Liu RY, Zeng Y, et al. JAK/STAT3 signaling is required for TGF-β-induced epithelial-mesenchymal transition in lung cancer cells. Int J Oncol. 2014;44(5):1643–1651. doi:10.3892/ijo.2014.2310
21. Pavelic SK, Sedic M, Bosnjak H, et al. Metastasis: new perspectives on an old problem. Mol Cancer. 2011;10:22. doi:10.1186/1476-4598-10-22
22. Lee JM, Dedhar S, Thompson KEW. The epithelial-mesenchymal transition: new insights in signaling, development, and disease. J Cell Biol. 2006;172(7):973–981. doi:10.1083/jcb.200601018
 © 2019 The Author(s). This work is published and licensed by Dove Medical Press Limited. The full terms of this license are available at https://www.dovepress.com/terms.php and incorporate the Creative Commons Attribution - Non Commercial (unported, v3.0) License.
By accessing the work you hereby accept the Terms. Non-commercial uses of the work are permitted without any further permission from Dove Medical Press Limited, provided the work is properly attributed. For permission for commercial use of this work, please see paragraphs 4.2 and 5 of our Terms.
© 2019 The Author(s). This work is published and licensed by Dove Medical Press Limited. The full terms of this license are available at https://www.dovepress.com/terms.php and incorporate the Creative Commons Attribution - Non Commercial (unported, v3.0) License.
By accessing the work you hereby accept the Terms. Non-commercial uses of the work are permitted without any further permission from Dove Medical Press Limited, provided the work is properly attributed. For permission for commercial use of this work, please see paragraphs 4.2 and 5 of our Terms.