")
Back to Journals » Journal of Inflammation Research » Volume 13
Negative Correlation Between Vitamin A and Positive Correlation Between Vitamin E and Inflammation Among Healthy Adults in Korea: Based on the Korea National Health and Nutrition Examination Survey (KNHANES) 2016–2018 7th Edition
Received 29 June 2020
Accepted for publication 10 September 2020
Published 29 October 2020 Volume 2020:13 Pages 799—811
DOI https://doi.org/10.2147/JIR.S265856
Checked for plagiarism Yes
Review by Single anonymous peer review
Peer reviewer comments 3
Editor who approved publication: Professor Ning Quan
Ki-Hong Hong,1 Young Lee2
1Department of Family Medicine, Nursing Hospital, Seoul Veterans Hospital, Seoul 05368, Republic of Korea; 2Veterans Medical Research Institute, Veterans Health Service Medical Center, Seoul 05368, Republic of Korea
Correspondence: Ki-Hong Hong
Department of Family Medicine, Nursing Hospital, Seoul Veterans Hospital, 53, Jinhwangdo-Ro 61-Gil, Gangdong-Gu, Seoul 05368, Republic of Korea
Tel +82-2-2225-4325
Fax +82-2-2225-1178
Email [email protected]
Purpose: Vitamins exert its effect through different isoforms. The isoform conversion phases involved are affected outside factors. Here, we investigated the correlation between serum retinol, α-tocopherol, and serum inflammatory markers using stratified data acquired from 2016 to 2018 Korea National Health and Nutrition Examination Survey (KNHANES).
Materials and Methods: This study was based on data acquired from the 7th edition (2016– 2018) of the Korea National Health and Nutrition Examination Survey, consisting of survey data on smoking and alcohol drinking, serum retinol level, serum α-tocopherol level, high-sensitivity C-reactive protein (hs-CRP), and baseline characteristics.
Results: There was a negative correlation between serum retinol and hs-CRP in alcohol drinking men. There was a negative correlation between serum retinol and hs-CRP in the alcohol-nonsmoking female group. There was a positive correlation between α-tocopherol and hs-CRP in the nonsmoking and alcohol-drinking group. There was a positive correlation between α-tocopherol and hs-CRP in the nonsmoking and alcohol-drinking female group. There was positive correlation between vitamin A and E and metabolic syndrome. The lowest vitamin A level was observed in subjects with all five metabolic syndrome criteria matched.
Conclusion: There was a negative correlation between serum retinol and hs-CRP and positive correlation between α-tocopherol and hs-CRP. Absorption and secretion of serum retinol are affected by inflammation status through retinol-binding protein. Alcohol acts as a competitive inhibitor of vitamin A oxidation through alcohol dehydrogenase and ALDH activity. Smoking causes inflammation and induces reactive oxygen species scavenging system and increases cytochrome p450 levels. These factors may have contributed to the observed findings. Metabolic syndrome subjects increased as the levels of vitamin A and vitamin E increased. Since obesity is inversely related to ALDH activity, we postulate that patients with metabolic syndrome may also have low ALDH activity, especially in the Asian population. Future studies are warranted to study the efficacy of ALDH or ALDH inducers in patients with vitamin A deficiency or metabolic syndrome.
Keywords: metabolic syndrome, retinol, α-tocopherol, smoking, drinking
Plain Language Summary
Alcohol flush is a condition that results from accumulation of acetaldehyde. It is more common in Asians. The enzyme involved in the process is ALDH (Acetaldehyde dehydrogenase). But action of this enzyme is just not confined to digesting alcohol, it is involved in numerous physiologic functions. ALDH is known to function as detoxifier in our system and is sometimes involved in processing of various nutrients essential for life. One such vitamin is vitamin A. Processing of vitamin A requires ALDH for retinol conversion to retinoic acid which is the active form in our body. Lower action of ALDH leads to lower retinoic acid level, leading to under active vitamin A. ALDH gets affected by outside factors. Sips of alcohol may induce ALDH, whereas chronic binge drinking may diminish ALDH action. Studies of alcohol show that there is a benefit from drinking alcohol, but only in small amount. We postulate that ALDH function may be the key factor in ethnic differences in disease prevalence.
Introduction
Inflammation induces numerous reactions in the human body; prolonged inflammation sometimes results in devastating conditions such as brain infarction, dementia, asthma, and myocardial infarction.1 An array of inflammatory reactions, also known as chronic inflammation, are newly recognized as risk factors for many diseases, especially those that concern vascular integrity, such as coronary artery disease.2 Several studies have suggested a correlation between serum vitamin levels and serum inflammatory markers.3 In this study, we investigated the correlation between serum retinol, α-tocopherol, and hs-CRP levels among Koreans stratified by their smoking and drinking status using data from the Korea National Health and Nutrition Examination Survey (KNHANES), 2016–2018.
Materials and Methods
This study was based on data acquired from the 7th edition (2016–2018) KNHANES. The collected data consisted of survey data on smoking and alcohol drinking, serum retinol level, serum α-tocopherol level, hs-CRP, and baseline characteristics. The data were further stratified by smoking and alcohol consumption. The study protocol was approved by the Institutional Review Board of Veterans Hospital Seoul (IRB Number 2020–06-015) and was in compliance with ethical standards.4
Study Population
Subjects aged 20 years and older were included in the KNHANES study from 2016 to 2018. Subjects who had a previous diagnosis of hypertension, dyslipidemia, cerebral infarction, osteoarthritis, rheumatoid arthritis, pulmonary tuberculosis, asthma, and diabetes were excluded from the study. Subjects who had been diagnosed with cancer of any kinds were excluded from the study. Subjects who had not answered the smoking and alcohol surveys were excluded. Subjects who had not been tested for serum retinol, serum α-tocopherol, or serum hs-CRP were excluded from the study. Figure 1 depicts the study subject selection. The final number of eligible study subjects was 3540.
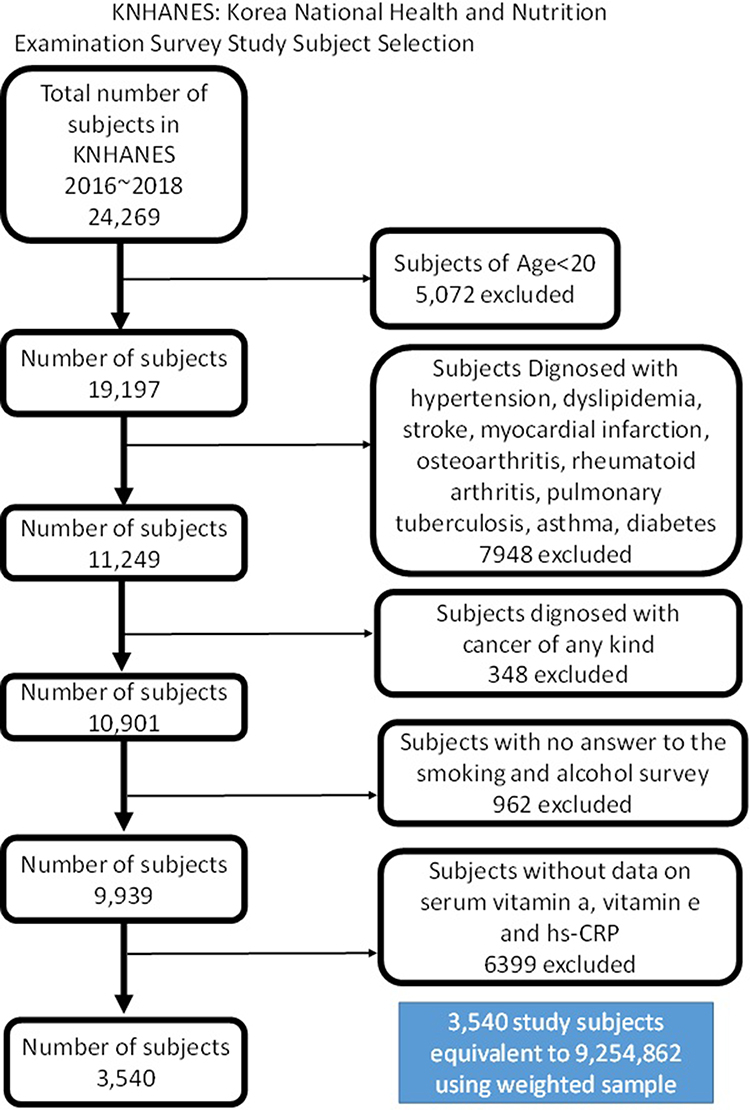 |
Figure 1 KNHANES: Korea National Health and Nutrition Examination Survey study subject selection. |
Subjects Grouped by Smoking and Alcohol Drinking
Subjects were grouped into two categories based on whether they smoked or drank alcohol. Surveys on smoking and alcohol consisted of standard questionnaires regarding the amount or frequency of usage. Smoking questionnaire included non-smoking, intermittent smoking, daily smoking, and past smoking. Those who answered yes to non-smoking were considered non-smoking individuals and those who answered yes to the other three questions were categorized as smoking individuals. Alcohol drinking questionnaire included the frequency of alcohol consumption during the past one year, never in the past one year, less than one time a month, about one time a month, two to four times a month, two to three times a week, and more than four times a week. Those who answered yes on never in the past one year were considered non-alcohol drinkers and those who answered yes on the other questions were considered alcohol drinkers. Variables were adjusted for age, sex, current smoking, frequency of drinking, mean monthly family income, BMI, hemoglobin A1c, total cholesterol, high-density lipoprotein (HDL), triglyceride, and mean systolic blood pressure.
Laboratory Measurements
Serum retinol level (mg/L) and serum α-Tocopherol level (mg/L) were measured with Agilent1200 (Agilent1200; Agilent, USA) using Chromsystems (Chromsystems; Chromsystems Instruments & Chemicals, Germany) reagents. The reference normal range for serum retinol level in adults is 0.30 mg/L–0.70 mg/L; reference normal range for α-tocopherol in adults is 5.00 mg/L–20.00 mg/L. Serum hs-CRP was measured with Cobas (Cobas; Roche, Germany) using the Cardiac C-reactive Protein Highly Sensitive kit (Cardiac C-reactive Protein Highly Sensitive; Roche, Germany). The reference normal range for hs-CRP is 0 mg/L–3 mg/L.
Statistical Analysis
Statistical analysis was performed using R software version 3.6.3 (R Foundation, Vienna, Austria). All analyses were performed with the sample weights from the KNHANES data in Phase VII (2016–2018). Data are presented as mean with SE (standard error) for continuous variables and as percentages with SE for categorical variables. Continuous variables were analyzed by independent t-test, while categorical variables were analyzed using the Rao-Scott chi-square test. Multiple linear regression was performed to evaluate the association between vitamin levels and CRP. All statistical tests were two-sided, and P-values <0.05 were considered statistically significant.
Results
General Characteristics of Study Subjects
The total percentage of smokers within the study subjects was 25.1%, smokers in the male study subjects were 40.9%, and smokers in female study subjects were 7.4%. Total percentage of alcohol drinkers were 83.6%, alcohol drinkers in male study subjects were 88.5%, and alcohol drinkers in female study subjects were 78.1%.
Table 1 shows the characteristics of the study subjects stratified by smoking status. The percentage of males and females in the non-smoker group was 41.8% and 58.2%, respectively. The percentage of males and females in the smoker group was 86.1% and 13.9%, respectively. The mean age of the non-smoker and smoker groups was 40.2 years and 39.0 years, respectively. The percentage of alcohol drinkers in the non-smoker and smoker groups was 80.0% and 94.4%, respectively, and this percentage did not differ much between genders. Total cholesterol did not differ significantly between non-smokers and smokers. BMI, hemoglobin A1c did not differ significantly between non-smokers and smokers in male and female groups separately but showed difference in the whole group. High-density lipoprotein cholesterol and triglyceride levels differed between non-smokers and smokers, 53.47 mg/dL and 47.92 mg/dL for high-density lipoprotein cholesterol levels and 118.53 mg/dL and 179.29 mg/dL for triglyceride levels, respectively. There was a mild difference in vitamin A levels between non-smokers and smokers, 0.48 mg/L and 0.58 mg/L, respectively. Significant difference was not found with vitamin E levels. The hs-CRP levels did not differ much between non-smokers and smokers in clinical levels. Since the values had skewed distribution to be compared raw, we used a logarithmic scale for hs-CRP. The logarithmic scale for hs-CRP between non-smokers and smokers was −0.51 and −0.40, respectively.
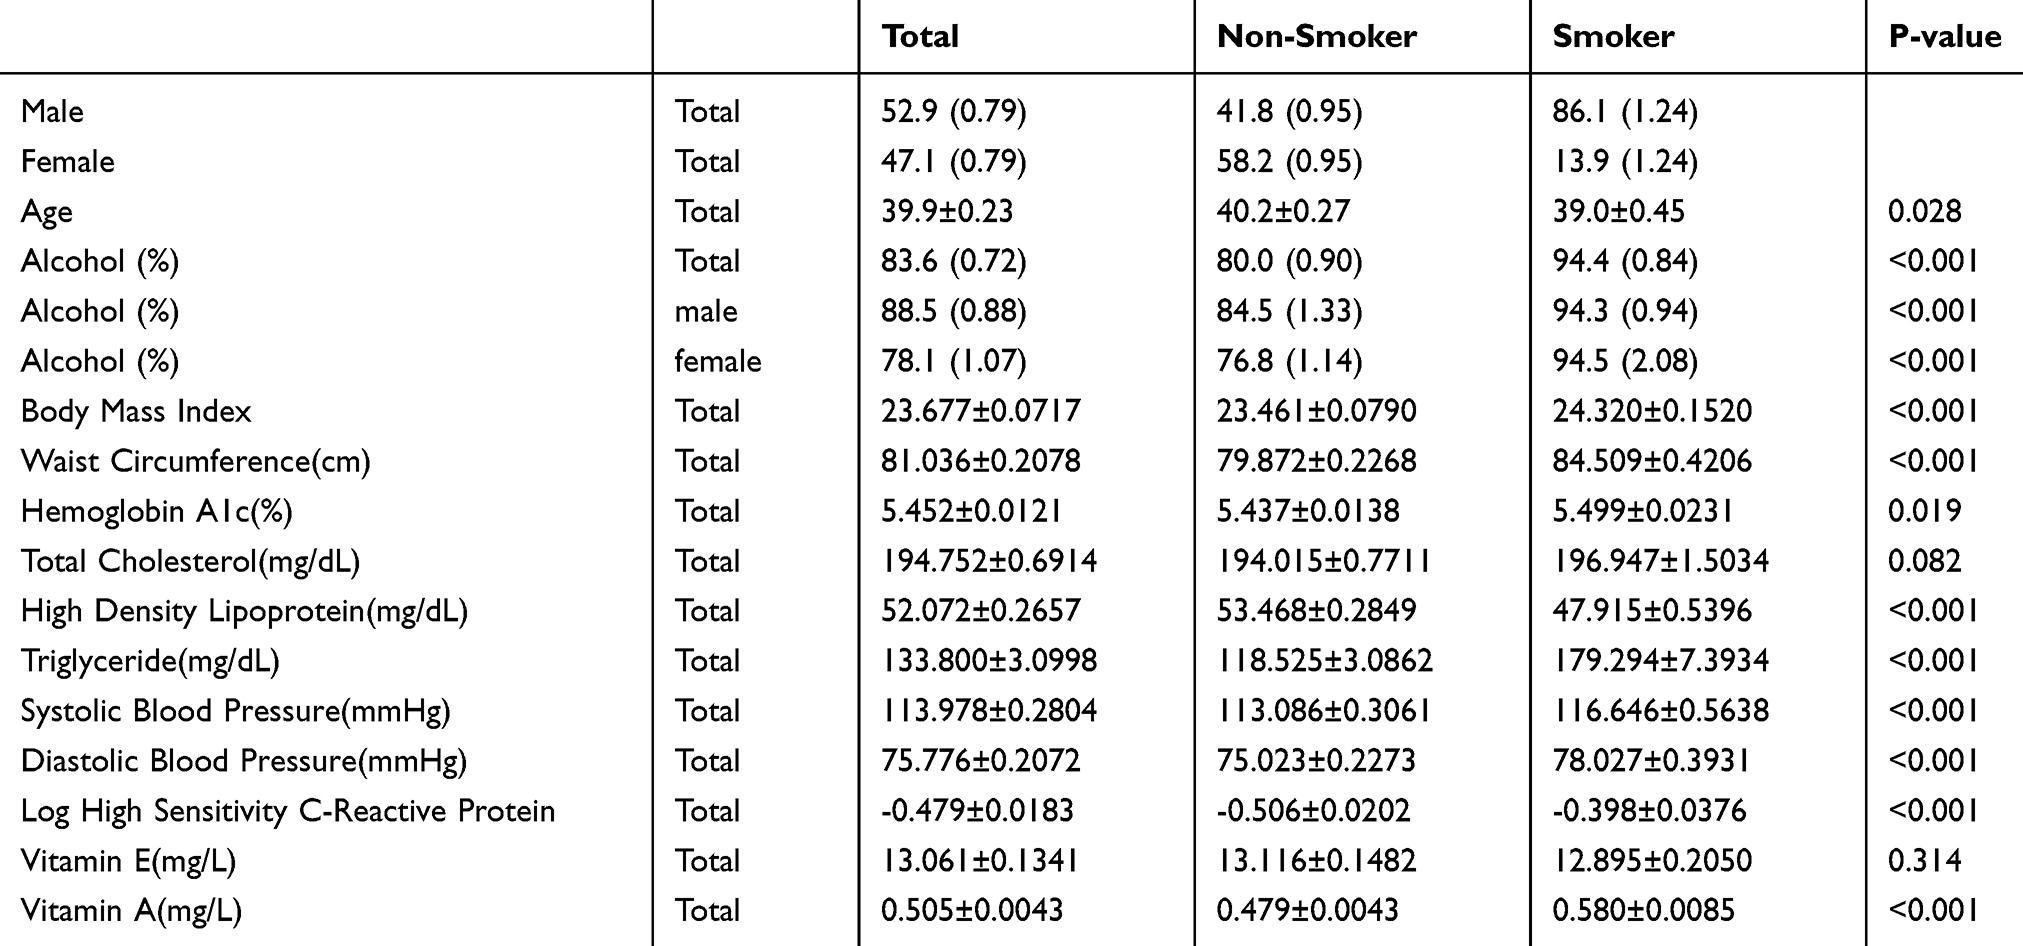 |
Table 1 Characteristics of Study Subjects Stratified by Smoking Status |
Table 2 shows the characteristics of the study subjects stratified by alcohol status. The percentages of males and females in the non-alcohol drinking group were 37.0% and 63.0%, respectively. The percentage of males and females in the alcohol drinking group was 56.0% and 44.0%, respectively. The mean age of the non-alcohol drinking and alcohol drinking groups was 44.4 years and 39.0 years, respectively. The percentage of smokers in the non-alcohol drinking and alcohol drinking groups was 8.7% and 28.4%, respectively. Male and female differences were noted in the percentage of smokers in the non-alcohol drinking and alcohol drinking groups: 20.3% and 43.6% for males, and 1.9% and 9.0% for females. BMI did not differ significantly. Hemoglobin A1c levels were slightly different between the non-alcohol drinking and alcohol drinking groups (5.53 and 5.43, respectively). Total cholesterol did not differ significantly between non-alcohol drinkers and alcohol drinkers. High density lipoproteins and triglycerides differed between non-alcohol drinkers and alcohol drinkers: 50.94 mg/dL and 52.29 mg/dL for high-density lipoproteins and 119.0 mg/dL and 136.7 mg/dL for triglycerides, respectively. There was a mild difference in serum retinol levels between non-alcohol drinkers and alcohol drinkers, 0.44 mg/L and 0.52 mg/L, respectively. No significant difference was found in α-tocopherol levels. hs-CRP levels did not differ much between non-alcohol drinkers and alcohol drinkers in clinical levels, which were compared using a logarithmic scale. The logarithmic scale for hs-CRP between non-alcohol drinkers and alcohol drinkers was −0.40 and −0.49, respectively.
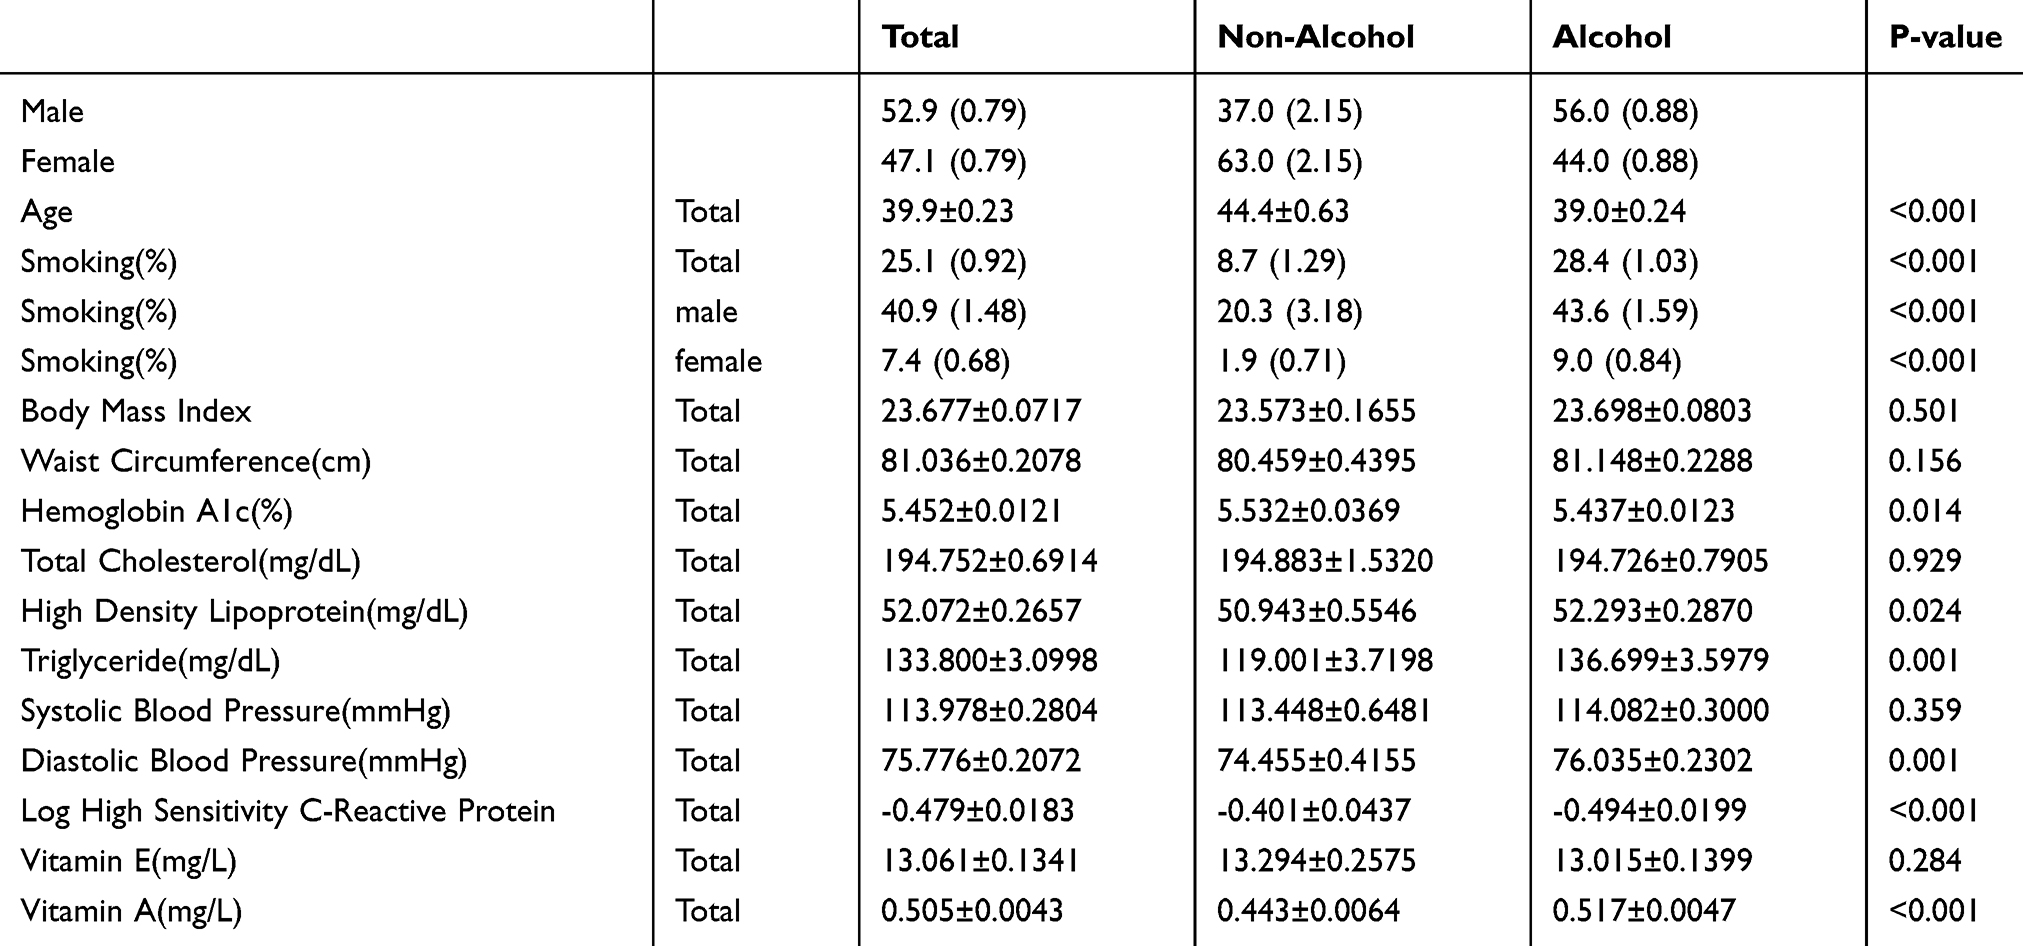 |
Table 2 Characteristics of Study Subjects Stratified by Alcohol Status |
Correlation Between Vitamins and Inflammation in Groups Stratified by Smoking, Alcohol Consumption, and Gender
There was a negative correlation between serum retinol and hs-CRP in alcohol-smoking and alcohol-non-smoking men, both adjusted and unadjusted groups with beta constant −0.51, standard error 0.20, confidence interval −0.90~-0.12, P-value 0.01, and beta constant −0.55, standard error 0.23, confidence interval −1.00~-0.10, P-value 0.02, respectively. There was a negative correlation between serum retinol and hs-CRP in alcohol-non-smoking females adjusted group with beta constant −0.49, standard error 0.18, confidence interval −0.85~-0.13, and P-value <0.01. Figure 2 depicts the correlation between log CRP and vitamin A.
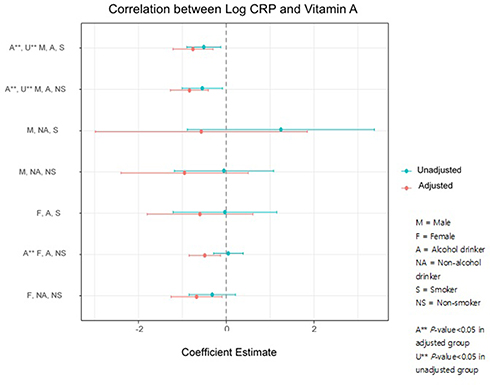 |
Figure 2 Correlation between Log CRP and Vitamin A. |
There was a positive correlation between α-tocopherol and hs-CRP in non-smoking and alcohol-drinking male and female unadjusted groups, beta constant 0.02, standard error 0.01, confidence interval 0.004 ~ 0.03, P-value<0.01, and beta constant 0.03, standard error 0.01, confidence interval 0.01 ~ 0.04, P-value<0.01, respectively. There was a positive correlation between α-tocopherol and hs-CRP in the non-smoking and alcohol-drinking female adjusted group with beta constant 0.02, standard error 0.01, confidence interval 0.01 ~ 0.03, P-value<0.01. Figure 3 depicts the correlation between log CRP and vitamin E. Table 3 shows the correlation between each metabolic profile criteria and vitamin A and vitamin E.
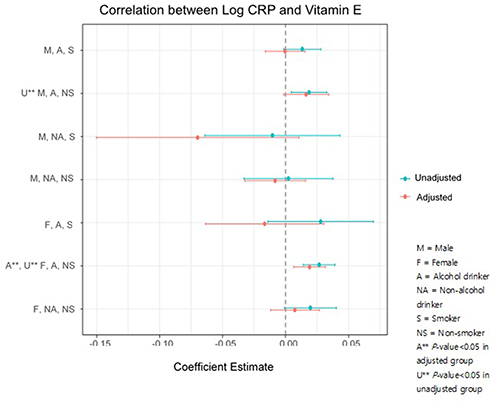 |
Figure 3 Correlation between Log CRP and Vitamin E. |
The percentages of male and female vitamin E deficient subjects who matched metabolic profile criteria were 0.00% and 0.00%, respectively. The percentage of male and female vitamin A deficient subjects who matched metabolic profile criteria were 10.03% and 3.12%, respectively. The percentage of male and female vitamin E sufficient subjects who matched the metabolic profile criteria were 15.65% and 7.58%, respectively. The percentage of male and female vitamin A sufficient subjects who matched metabolic profile criteria were 15.46% and 9.18%, respectively. The percentage of male and female vitamin E over-sufficient subjects who matched metabolic profile criteria were 41.91% and 24.06%, respectively. The percentage of male and female vitamin A over-sufficient subjects who matched metabolic profile criteria were 27.45% and 16.73%, respectively. These results are summarized in Table 4–7. The highest percentage of metabolic syndrome criteria matched/whole group in both males and females were observed in the vitamin A and E over-sufficient group. The numbers of matched metabolic criteria increased as vitamin A and E levels increased. However, there was an exception when all five metabolic syndrome criteria were matched in the vitamin A analysis: female serum vitamin A level was the lowest among all six groups of metabolic syndrome profiles matched from 0 to 5.
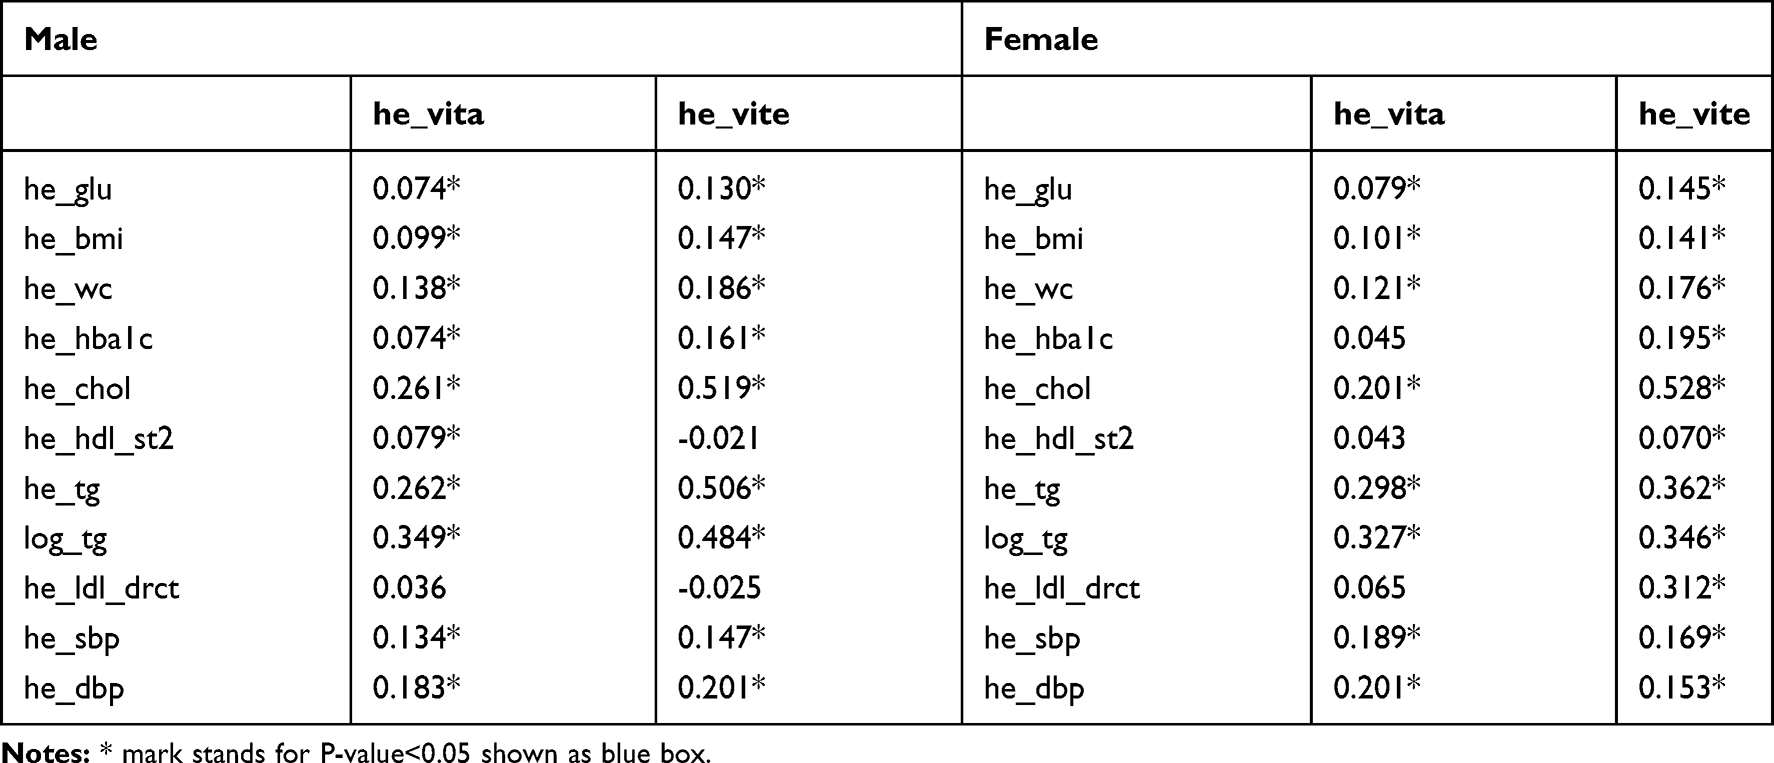 |
Table 3 Correlation Between Metabolic Syndrome Profiles and Serum α-Tocopherol Levels and Serum Retinol Levels |
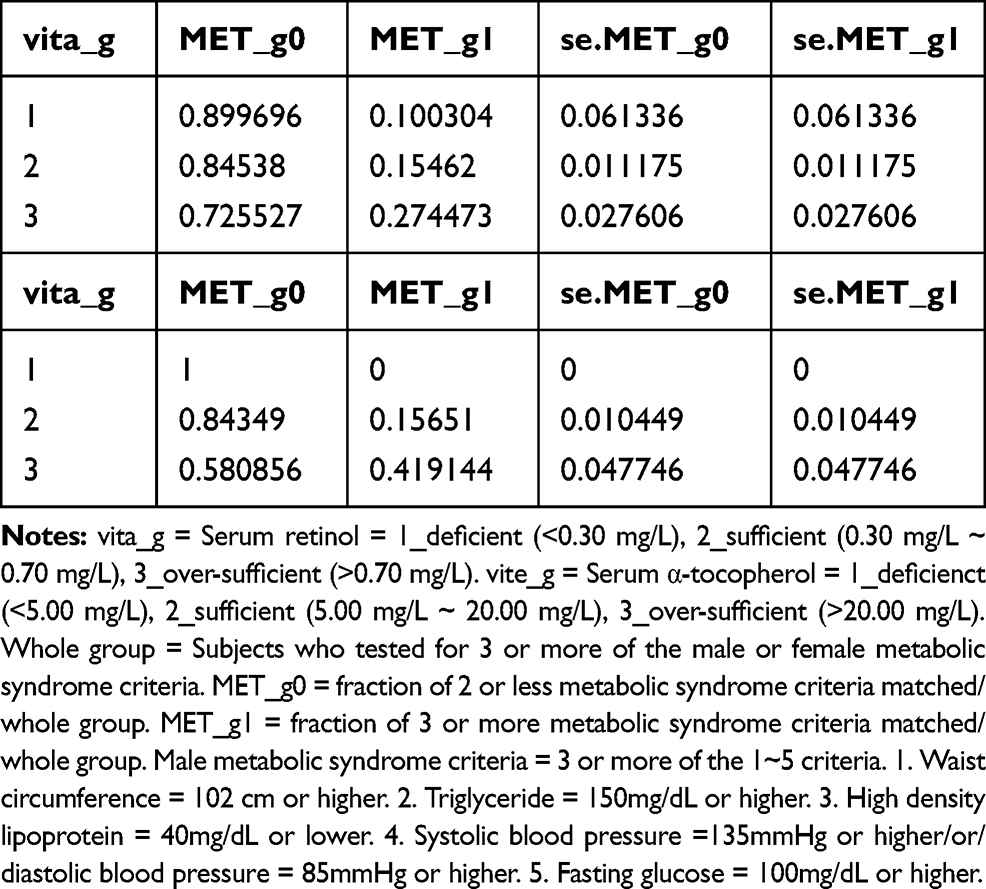 |
Table 4 Male Group Vitamin A and E and Metabolic Syndrome |
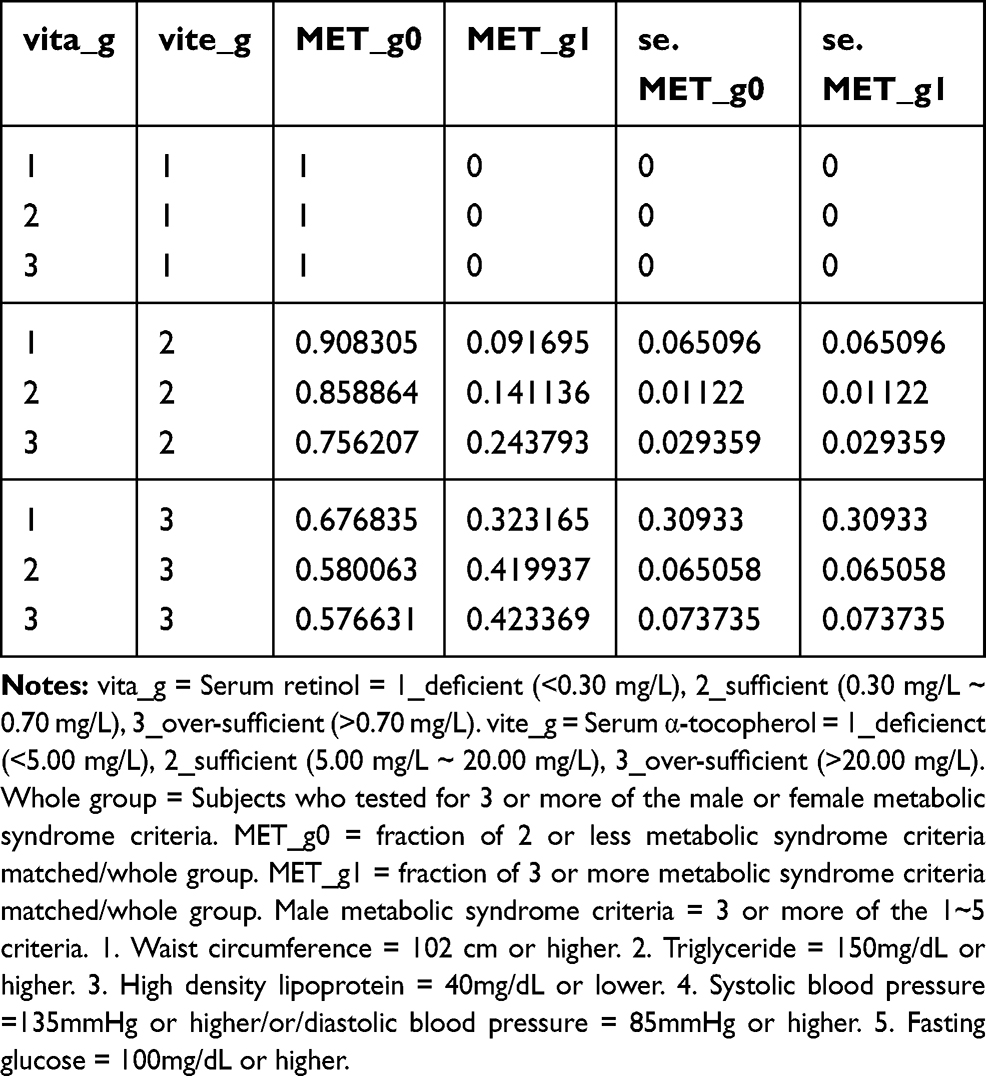 |
Table 5 Male Group Vitamin A and E Matched and Metabolic Syndrome |
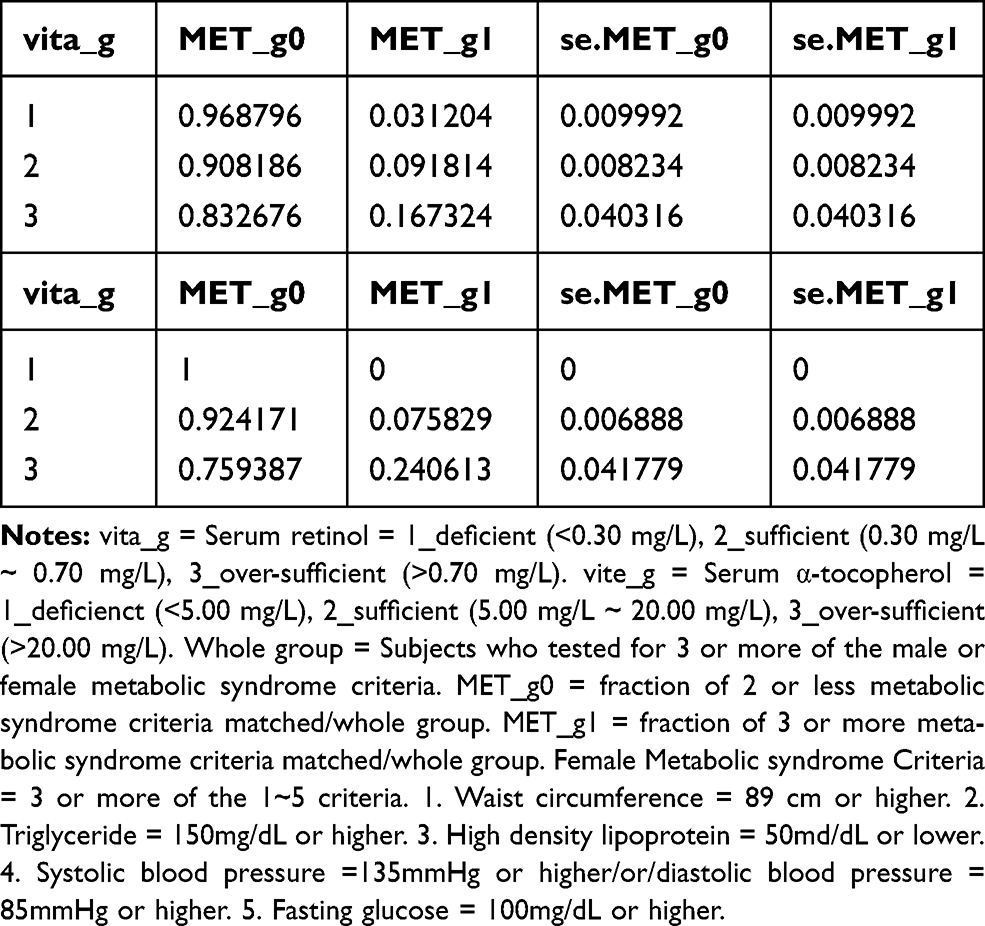 |
Table 6 Female Group Vitamin A and E and Metabolic Syndrome |
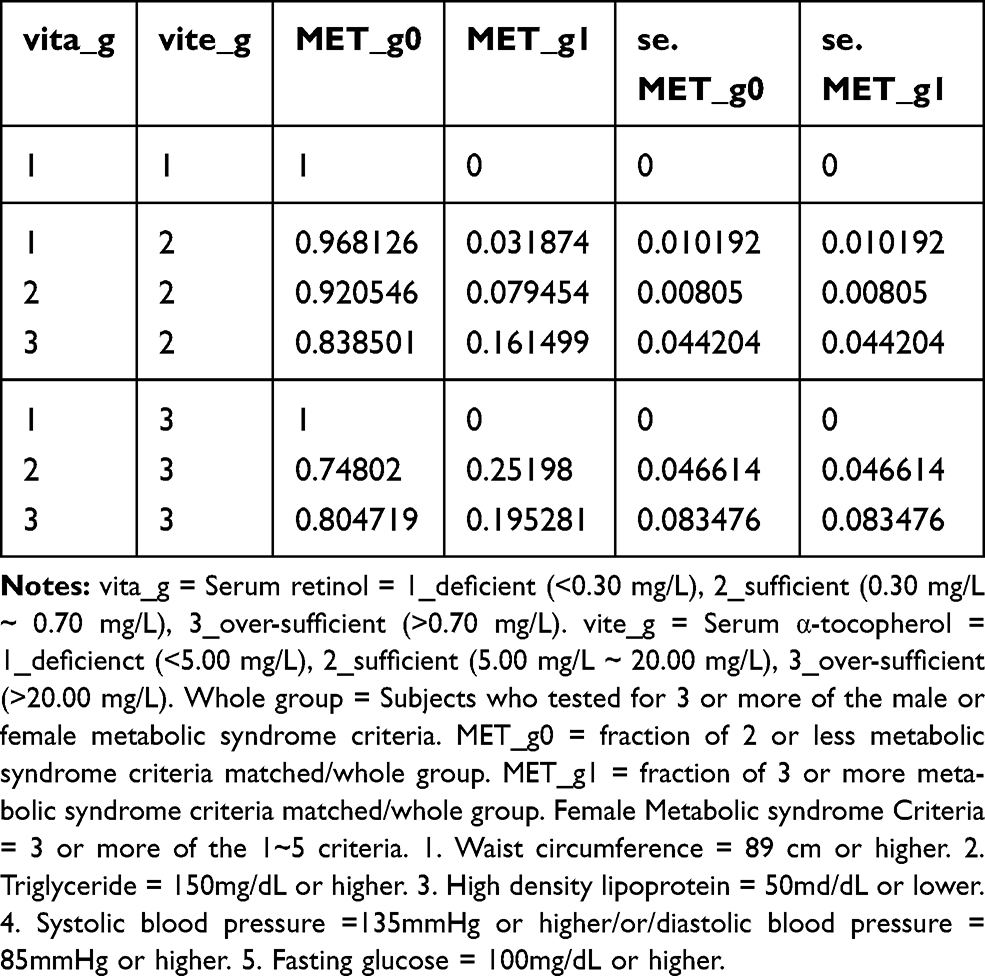 |
Table 7 Female Group Vitamin A and E Matched and Metabolic Syndrome |
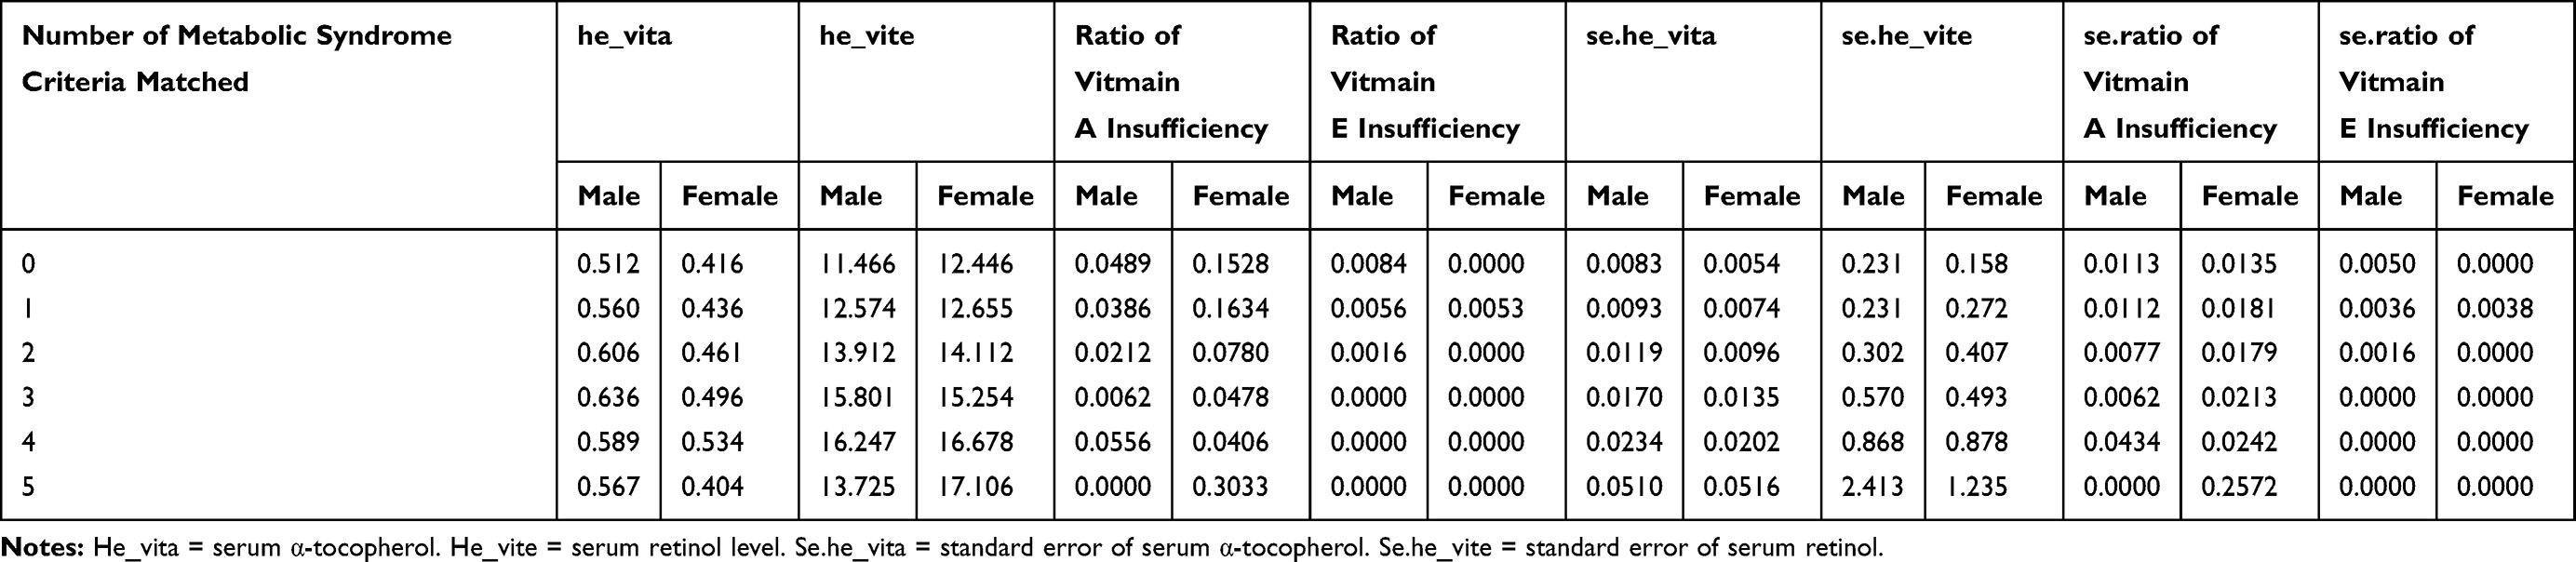 |
Table 8. Number of Metabolic Syndrome Criteria Matched with Vitamin A and E Status |
Discussion
Vitamin A Signaling is Mediated by Inflammation
Previous studies have shown an inverse correlation between vitamin A and inflammation; many factors are known to influence the level of vitamin A through many phases from transport to metabolism. Inflammation and infection are known to negatively affect vitamin A through decreased absorption, increased urinary excretion, and increased sequestration in the liver. Studies suggest that liver retinol-binding protein (RBP) synthesis is reduced by TNF- α (tumor necrosis factor alpha), IL-1 (Interleukin 1), IL-6 (Interleukin 6), and type 1 interferons through reduced transcription of retinol binding protein 4 (RBP4) mRNA signaling.5 Other studies suggest that enteric infections can decrease vitamin A absorption through damaged intestinal epithelium and leakiness of intestines.5,6 Septic conditions are also known to decrease vitamin A levels in the kidney. One study done in Birmingham reported that adults with severe infection excreted more vitamin A than healthy controls,7 while another study suggested that children with severe infection are at risk of increased urinary retinol loss.8
Acute inflammation not only decreases serum vitamin A levels but also diminishes retinol availability in peripheral tissues due to decreased mobilization from the liver.9 One study suggested that a decrease in light sensitivity during infection occurred through decreased availability of retinal for rhodopsin formation.10
Vitamin A and Its Anti-Inflammatory Properties
The anti-inflammatory effects of vitamin A are known to occur through macrophage lineage regulation at the monocyte differentiation level. All-trans retinoic acid (ATRA) inhibits the release of macrophage inflammatory cytokines and induces M1 macrophages, which secrete pro-inflammatory cytokines to transform into M2 macrophages, which secrete anti-inflammatory cytokines.11
Some studies have reported low serum levels of vitamin A and carotene in elderly patients with chronic leg ulcers.12 Other studies have shown that vitamin A can reverse the anti-inflammatory steroid effect on wound healing, enhance the production of extracellular matrix components, and increase the proliferation of keratinocytes and fibroblasts in organs. The mechanism underlying the enhancement of the early inflammatory phase is believed to be the stimulation of the local immune response through an increased number of monocytes and macrophages at the wound site.13 This implies that while vitamin A can work as an anti-inflammatory agent, it may also be pro-inflammatory. Studies have suggested that vitamin A is an immune response regulator; it is crucial in maintaining homeostasis and proper immune regulation. These are known to occur according to the degree of pathogen-induced inflammation. These decrease the production of retinoic acid, leading to a more pro-inflammatory environment to help fight pathogens.14
Vitamin A, Alcohol, and Smoking Interactions
Studies suggest that alcohol consumption affects retinoid storage in two phases. The first is the mobilization phase and the second is the catabolism phase. The mobilization phase occurs through hepatic retinoid redistribution to extrahepatic tissues, mediated by an increase in RBP and hepatic RBP expression. The catabolism phase is believed to be mediated by cytochrome (CYP) leading to a decline in hepatic retinoid with no further increase in extrahepatic tissue retinoid levels.15,16
Alcohol dehydrogenase (ADH) and acetaldehyde dehydrogenase (ALDH) are also known to affect vitamin A. Retinol is the commonly ingested form of vitamin A. Retinol is converted to retinaldehyde via ADH, and retinaldehyde is converted to retinoic acid via ALDH. Retinoic acid is the active form since it can bind to retinoic acid receptors (RARs) and initiate intracellular signaling.17 With chronic alcohol ingestion, alcohol acts as a competitive inhibitor of vitamin A oxidation via ADH and ALDH, and the conversion process of both retinaldehyde and retinoic acid is altered. This results in inadequate signaling leading to altered proliferation and differentiation of cells.18,19 Alcohol also induces CYP (particularly CYP2E1) and degrades retinol and retinoid acid. Furthermore, it increases intrahepatic retinol and retinoic acid mobilization.
Numerous studies have investigated the effect of smoking on CYP 450 (cytochrome 450); smoking enhances the expression of CYP, CYP1A1, and CYP1A2 in particular. One study conducted on animals suggested that ferrets exposed to cigarette smoke had increased 4-oxo-RA and 18-hydroxy-RA, the metabolites of retinoic acid. Furthermore, administration of CYP inhibitors such as liarozole or disulfiram, substantially inhibited 4-oxo-RA and 18-hydroxy-RA production.20 This suggests the role of cigarette smoke in retinoic acid degradation.
Our study results showed that there was a negative correlation between CRP and serum retinol levels in the alcohol drinking smoking/non-smoking male group and the alcohol drinking non-smoking female group. The lack of significant results in alcohol drinking females who were smokers may be attributable to differences in ADH and CYP1A2 activity among genders. Studies suggest that ADH activity is higher in males, CYP1A2 activity is lower in females, and ALDH activity does not show much difference between genders.21,22
Vitamin E and Its Anti-Inflammatory Properties
Vitamin E exists in different isoforms in nature. These include α-tocopherol, β-tocopherol, γ-tocopherol, δ-tocopherol, and tocotrienol forms. Among the four tocopherols, α-tocopherol and γ-tocopherol are found in the serum and red blood cells (RBCs).23 The most common form in the human body is α-tocopherol due to the preferential affinity of α-tocopherol transfer protein (100% for α-tocopherol and 9% for γ-tocopherol), and from the faster metabolism of the other forms.24 There are only scarce concentrations of β-tocopherol and δ-tocopherol found in the serum.25
Different isoforms exhibit different ROS-scavenging properties. Studies suggest that ROS scavenging activities in vivo are α> β> Ƴ> δ, and these differences come from the methylation patterns of each tocopherols.26 α-Tocopherol and γ-tocopherol both exhibit anti-oxidant activity, but studies suggest that there is a difference in anti-inflammatory properties.27
Previous studies have suggested that α-tocopherol therapy has anti-inflammatory effects in vitro and in vivo. Pro-inflammatory cytokines IL-6, IL-1β, TNF-α, chemokine IL-8, and PAI-1 (Plasminogen activator inhibitor 1) were decreased in the α-tocopherol treated group.28 Studies on γ-tocopherol suggested a difference in the mechanism as compared to that of α-tocopherol. One study suggested that γ-tocopherol inhibits prostaglandin E2 (PGE2) and leukotriene B4 (LTB4) and decreases TNF- α.29 Another study reported that γ-tocopherol metabolites also inhibited PGE2 through COX-2 (cyclooxygenase 2) inhibition and therefore attenuated inflammation-mediated damage. The unique role of γ-tocopherol comes from its ability to preferentially react with nitrogen oxidant species, thus limiting cellular damage from the enzymatic generation of NO (nitric oxide) more significantly than α-tocopherol.30
Studies also imply that γ-tocopherol acts as a trap for membrane-soluble electrophilic nitrogen oxides and other electrophilic mutagens, an action that is not present with α-tocopherol. This suggests the importance of γ-tocopherol and its metabolites in chronic inflammation. Some studies indicate that γ-tocopherol and its metabolites, but not α-tocopherol, possess anti-inflammatory activity.31
Vitamin E Interaction with Smoking and Alcohol Consumption
Our results showed a positive correlation between α-tocopherol and hs-CRP in non-smoking and alcohol-drinking male and female unadjusted groups and a positive correlation between α-tocopherol and hs-CRP in the non-smoking and alcohol-drinking female adjusted groups. Studies suggest that smoking increases inflammation and changes levels of γ-tocopherol and α-tocopherol, elevates plasma γ-tocopherol and decreases α-tocopherol levels.32 Other studies suggest that smoking is inversely associated with both the serum α-tocopherol and γ-tocopherol levels.33 Studies on alcohol consumption and α-tocopherol suggest that there was a decrease in α-tocopherol with 30 g/day alcohol consumption compared to no alcohol consumption.34 Other studies have suggested that the frequency of alcohol consumption was positively associated with α-tocopherol.35
From previous studies and implications from our study, we believe that non-smokers had increased levels of α-tocopherol through a decrease in γ-tocopherol (as there is an inverse relationship between α and γ-tocopherol) compared to smokers, which might have participated in the observed effect. We believe that lack of significant result in the non-smoking and alcohol drinking male adjusted group may have come from BMI (beta 0.07, standard error 0.01, confidence interval 0.05 ~ 0.09, P-value<0.01). There are studies suggesting a positive correlation between BMI and α-tocopherol levels,36 whereas other studies suggest a negative correlation.37 Studies on BMI and α-tocopherol levels have shown conflicting results, and further analysis is warranted. Table 9 shows correlation between α-tocopherol levels and alcohol. It showed that there was an increase in mean serum α-tocopherol level with increase in frequency of drinking (never in the past one year, less than one time a month, about one time a month, two to four times a month, two to three times a week and more than four times a week) and by amount (1–2 g, 3–4 g, 5–6 g, 7–9 g, and 10 g or more of ethanol). The result of this was not purely linear and had an inverse U-shaped graph in the low frequency groups. This result was not applicable to our current study on vitamin A and vitamin E due to very specific subject stratification (over 100 subparts).
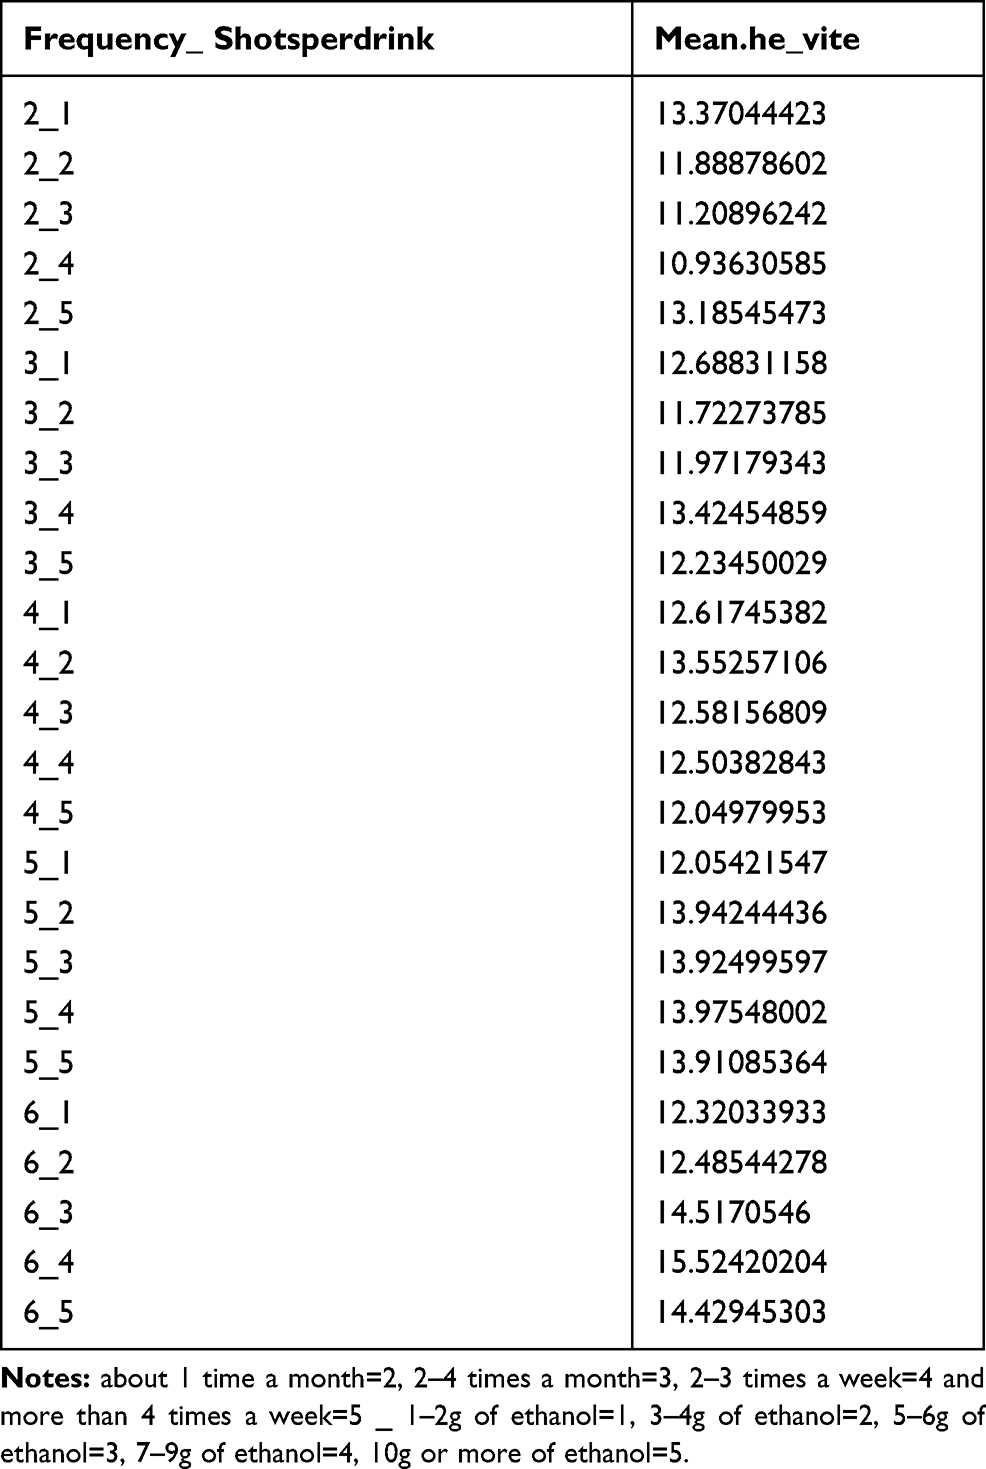 |
Table 9 Mean α-Tocopherol Levels of Groups Stratified with Frequency of Drinking and Shots per Drinking |
Association of Metabolic Syndrome Profiles of α-Tocopherol and Serum Retinol Levels
Vitamin A and vitamin E have been previously reported to benefit patients with metabolic syndrome. Studies on vitamin E reported that participants who were supplemented with α - or γ-tocopherol, or both, showed that the combination of α - and γ-tocopherol supplementation showed superiority in reducing lipid peroxides.38 Other studies reported that γ-tocopherol supplementation decreased obesity and insulin resistance,39 reduced triglyceride synthesis and transport,40 and anti-hypertensive.41
Studies on vitamin A reported that patients with metabolic syndrome had lower vitamin A levels;42 individuals with vitamin A deficiency had a higher risk of hypertriglyceridemia and hyperglycemia,43 and RBP4 was positively associated with hip circumference, TG (triglyceride), and diastolic blood pressure.44 Contrary to previous studies, our results showed different results. Our results showed that the percentage of male and female vitamin E deficient subjects who matched metabolic profile criteria were 0.00% and 0.00%, respectively. The percentage of male and female vitamin A deficient subjects who matched metabolic profile criteria were 10.03% and 3.12%, respectively. The percentage of male and female vitamin E sufficient subjects who matched metabolic profile criteria were 15.65% and 7.58%, respectively. The percentage of male and female vitamin A sufficient subjects who matched metabolic profile criteria were 15.46% and 9.18%, respectively. The percentage of male and female vitamin E over-sufficient subjects who matched metabolic profile criteria were 41.91% and 24.06%, respectively. The percentage of male and female vitamin A over-sufficient subjects who matched metabolic profile criteria were 27.45% and 16.73%, respectively. These results were summarized in Table 4 through 7. The highest percentage of metabolic syndrome criteria matched/whole group in both males and females were observed in the vitamin A & E over-sufficient group.
Table 8 shows the analysis of the number of metabolic criteria matched with levels of vitamin A and E, and the ratio of vitamin A and E deficiency. In male group vitamin A level increased from zero matched to 3 matched and decreased from 4 matched to 5 matched. In female group vitamin A level increased from zero matched to 4 matched and declined at 5 matched. In male group vitamin E level steadly increased from zero matched to 4 matched and declined at 5 matched. In female group vitamin E level steadly increased from zero matched to 5 matched, with no decline. U-shaped correlation between the number of metabolic criterias matched and vitamin A were found. The results resembled those of the previous study. As the numbers of matched metabolic criteria increased, so did vitamin A and E levels, except when all five metabolic syndrome criteria were matched in the vitamin A analysis. Female serum vitamin A level was the lowest when all five metabolic syndrome criteria were matched. Studies have shown that obesity and ALDH function are inversely related, and with bariatric surgery, ALDH shows decreased activity.45
Our cross-sectional study used serum retinol and serum α-tocopherol for the analysis of vitamin A and vitamin E status. The circulating vitamins and metabolic syndrome causality could not have been confirmed. However, since the active form of anti-inflammatory vitamin A is retinoic acid, which is excreted from the liver with inflammation, the serum retinol level may be a reflection of retinoic acid during transport. For vitamin E and metabolic syndrome, we postulate that α-tocopherol is inversely related to γ-tocopherol, and the elevation of α-tocopherol may reflect a decrease in γ-tocopherol levels.
Weaknesses and Limitations of Our Study
Our study data consisted of weighted samples of the Korean population and the power comes from the large scale. However, since our study is purely cross-sectional, no causal relationship could be made. Although some sections needed explanation that could have been done with more detailed stratification, this was not feasible due to the relatively small sample size when divided as such. Most studies on vitamin A focus on serum retinol levels, which is a serum sample and relatively easy to obtain; however, since the main active form in the human body is retinoic acid, which is not readily available as a serum sample, gross analysis of retinol had to be made.
ALDH is involved in the conversion of retinol to retinoic acid. Because of the specified measurement of ALDH in different parts of the body, such as biopsy, the data on ALDH are difficult to reach. However, when considering the effect of vitamin A, a more precise interpretation of vitamin A could be possible with the conjunction of serum retinol levels, retinoic acid level, and ALDH levels.
Vast studies on vitamin E consist of two isoforms of vitamin E, α, and γ-tocopherol. Since more emphasis is being placed on γ-tocopherol due to its distinct anti-inflammatory properties compared to α-tocopherol, future studies on vitamin E should consider γ-tocopherol as well as α-tocopherol for vitamin E analysis.
Conclusion
There was a negative correlation between vitamin A and hs-CRP and a positive correlation between vitamin E and hs-CRP. A negative correlation between vitamin A and hs-CRP was found in non-smoking and non-alcohol drinking, non-smoking, and smoking and alcohol drinking groups. A positive correlation between vitamin E and hs-CRP was found in the non-smoking and alcohol drinking groups. Subjects with metabolic syndrome had a positive correlation with serum retinol and α-tocopherol levels; an exception was observed when all five metabolic profiles were met in the study of serum retinol, which was observed to be the lowest. Since obesity is inversely related to ALDH activity, we postulate that patients with metabolic syndrome may also have low ALDH activity, especially in the Asian population. Future studies are warranted to further investigate the efficacy of ALDH or ALDH inducers in patients with vitamin A deficiency or metabolic syndrome.
Disclaimer
The analyses, conclusions, opinions, and statements expressed herein are solely those of the authors and do not reflect those of the data sources; no endorsement is intended or should be inferred.
Abbreviations
SE, standard error; KNHANES, Korea National Health and Nutrition Examination Survey; hs-CRP, high sensitivity C-reactive protein; RBP, retinol binding protein; ADH, alcohol dehydrogenase; ALDH, acetaldehyde dehydrogenase; CYP450, cytochrome p450; ROS, reactive oxygen species; TNF- α, tumor necrosis factor alpha; IL-1, interleukin 1; IL-6, interleukin 6; IL-8, interleukin 8; PAI-1, plasminogen activator inhibitor 1; PGE2, prostaglandin E2; LTB4, leukotriene B4; RBP4 mRNA, retinol binding protein 4 mediator ribonucleic acid; ATRA, all-trans retinoic acid; CYP2E1, cytochrome P450 2E1; CYP1A1, cytochrome P450 1A1; CYP1A2, cytochrome P450 1A2; 4-oxo-RA, 4-oxoretinoic acid; 18-hydroxy-RA, 18-hydroxyretinoic acid.
Data Sharing Statement
Korea National Health and Nutrition Examination Survey (KNHANES) 2016–2018 7th edition can be accessed through https://knhanes.cdc.go.kr/knhanes/main.do.
Ethic Statement
The study protocol was approved by the Institutional Review Board of Veterans Hospital Seoul (IRB Number 2020-06-015). In compliance with ethical principles for medical research involving human subjects (World Medical Association Declaration of Helsinki, 2013).
Author Contributions
M.D. Hong and M.S. Lee had full access to all of the data in the study and take responsibility for the integrity of the data and the accuracy of the data analysis. All authors contributed to data analysis, drafting or revising the article, have agreed on the journal to which the article will be submitted, gave final approval of the version to be published, and agree to be accountable for all aspects of the work.
Funding
There is no funding to report.
Disclosure
The authors have no conflicts of interest to be declared.
References
1. Rückerl R, Greven S, Ljungman P, et al. Air pollution and inflammation (interleukin-6, C-reactive protein, fibrinogen) in myocardial infarction survivors. Environ Health Perspect. 2007;115(7):1072–1080. doi:10.1289/ehp.10021
2. Lanki T, Hampel R, Tiittanen P, et al. Air pollution from road traffic and systemic inflammation in adults: a cross-sectional analysis in the European ESCAPE project. Environ Health Perspect. 2015;123(8):785–791. doi:10.1289/ehp.1408224
3. Greer RM, Buntain HM, Lewindon PJ, et al. Vitamin A levels in patients with CF are influenced by the inflammatory response. J Cyst Fibros. 2004;3(3):143–149. doi:10.1016/j.jcf.2004.04.003
4. Gieng SH, Raila J, Rosales FJ. Accumulation of retinol in the liver after prolonged hyporetinolemia in the vitamin A-sufficient rat. J Lipid Res. 2005;46(4):641–649. doi:10.1194/jlr.M400415-JLR200
5. Sarker SA, Wahed MA, Rahaman MM, Alam AN, Islam A, Jahan F. Persistent protein losing enteropathy in post measles diarrhoea. Arch Dis Child. 1986;61(8):739–743. doi:10.1136/adc.61.8.739
6. Stephensen CB, Alvarez JO, Kohatsu J, Hardmeier R, Kennedy JI, Gammon RB. Vitamin A is excreted in the urine during acute infection. Am J Clin Nutr. 1994;60(3):388–392. doi:10.1093/ajcn/60.3.388
7. Mitra AK, Alvarez JO, Stephensen CB. Increased urinary retinol loss in children with severe infections. Lancet. 1998;351(9108):1033–1034. doi:10.1016/S0140-6736(05)79000-0
8. Gieng SH, Green MH, Green JB, Rosales FJ. Model-based compartmental analysis indicates a reduced mobilization of hepatic vitamin A during inflammation in rats. J Lipid Res. 2007;48(4):904–913. doi:10.1194/jlr.M600528-JLR200
9. Stephensen CB, Vitamin A. Vitamin A, I Nfection, And Immune Function. Annu Rev Nutr. 2001;21(1):167–192. doi:10.1146/annurev.nutr.21.1.167
10. Huang Z, Liu Y, Qi G, Brand D, Zheng SG. Role of vitamin A in the immune system. J Clin Med. 2018;7(9):258. doi:10.3390/jcm7090258
11. Rojas AI, Phillips TJ. Patients with chronic leg ulcers show diminished levels of vitamins A and E, carotenes, and zinc. Dermatol Surg. 1999;25:601–604.
12. Hunt TK. Vitamin A and wound healing. J Am Acad Dermatol. 1986;15(4):817–821. doi:10.1016/S0190-9622(86)70238-7
13. Erkelens MN, Mebius RE. Retinoic acid and immune homeostasis: a balancing act. Trends Immunol. 2017;38(3):168–180. doi:10.1016/j.it.2016.12.006
14. Clugston RD, Jiang H, Lee MX, et al. Altered hepatic retinyl ester concentration and acyl composition in response to alcohol consumption. Biochim Biophys Acta. 2013;1831(7):1276–1286. doi:10.1016/j.bbalip.2013.04.006
15. Clugston RD, Huang LS, Blaner WS. Chronic alcohol consumption has a biphasic effect on hepatic retinoid loss. FASEB J. 2015;29(9):3654–3667. doi:10.1096/fj.14-266296
16. Seitz HK. Alcohol and retinoid metabolism. Gut. 2000;47:748.
17. Soprano DR, Teets BW, Soprano KJ. Role of retinoic acid in the differentiation of embryonal carcinoma and embryonic stem cells. Vitam Horm. 2007;75:69–95.
18. Gudas LJ, Wagner JA. Retinoids regulate stem cell differentiation. J Cell Physiol. 2011;226(2):322–330. doi:10.1002/jcp.22417
19. Liu C, Russell RM, Wang X-D. Exposing ferrets to cigarette smoke and a pharmacological dose of β-carotene supplementation enhance in vitro retinoic acid catabolism in lungs via induction of cytochrome P450 enzymes. J Nutr. 2003;133(1):173–179. doi:10.1093/jn/133.1.173
20. Chrostek L, Jelski W, Szmitkowski M, Puchalski Z. Gender-related differences in hepatic activity of alcohol dehydrogenase isoenzymes and aldehyde dehydrogenase in humans. J Clin Lab Anal. 2003;17(3):93–96. doi:10.1002/jcla.10076
21. Ou-Yang DS, Huang SL, Wang W, et al. Phenotypic polymorphism and gender-related differences of CYP1A2 activity in a Chinese population. Br J Clin Pharmacol. 2000;49(2):145–151. doi:10.1046/j.1365-2125.2000.00128.x
22. Rizvi S, Raza ST, Ahmed F, Ahmad A, Abbas S, Mahdi F. The role of vitamin E in human health and some diseases. Sultan Qaboos Univ Med J. 2014;14:e157–165.
23. Hosomi A, Arita M, Sato Y, et al. Affinity for alpha-tocopherol transfer protein as a determinant of the biological activities of vitamin E analogs. FEBS Lett. 1997;409(1):105–108. doi:10.1016/S0014-5793(97)00499-7
24. Abdulla KA, Um CY, Gross MD, Bostick RM. Circulating γ-tocopherol concentrations are inversely associated with antioxidant exposures and directly associated with systemic oxidative stress and inflammation in adults. J Nutr. 2018;148(9):1453–1461. doi:10.1093/jn/nxy132
25. Yadav NU, Sharma S. Reactive oxygen species, oxidative stress and ROS scavenging system in plants. J Chem Pharm Res. 2016;8:595–604.
26. Reiter E, Jiang Q, Christen S. Anti-inflammatory properties of alpha- and gamma-tocopherol. Mol Aspects Med. 2007;28(5–6):668–691. doi:10.1016/j.mam.2007.01.003
27. Singh U, Jialal I. Anti-inflammatory effects of α-tocopherol. Ann N Y Acad Sci. 2004;1031(1):195–203. doi:10.1196/annals.1331.019
28. Jiang Q, Ames BN. γ-Tocopherol, but not α-tocopherol, decreases proinflammatory eicosanoids and inflammation damage in rats. FASEB J. 2003;17(8):816–822. doi:10.1096/fj.02-0877com
29. Cooney RV, Franke AA, Harwood PJ, Hatch-Pigott V, Custer LJ, Mordan LJ. Gamma-tocopherol detoxification of nitrogen dioxide: superiority to alpha-tocopherol. Proc Natl Acad Sci U S A. 1993;90(5):1771–1775. doi:10.1073/pnas.90.5.1771
30. Jiang Q, Elson-Schwab I, Courtemanche C, Ames BN. Gamma-tocopherol and its major metabolite, in contrast to alpha-tocopherol, inhibit cyclooxygenase activity in macrophages and epithelial cells. Proc Natl Acad Sci U S A. 2000;97(21):11494–11499. doi:10.1073/pnas.200357097
31. Cooney RV, Franke AA, Wilkens LR, Gill J, Kolonel LN. Elevated plasma gamma-tocopherol and decreased alpha-tocopherol in men are associated with inflammatory markers and decreased plasma 25-OH vitamin D. Nutr Cancer. 2008;60(Suppl 1):21–29. doi:10.1080/01635580802404162
32. Zou Y, Wang DH, Sakano N, et al. Associations of serum retinol, α-tocopherol, and γ-tocopherol with biomarkers among healthy Japanese men. Int J Environ Res Public Health. 2014;11(2):1647–1660. doi:10.3390/ijerph110201647
33. Hartman TJ, Baer DJ, Graham LB, et al. Moderate alcohol consumption and levels of antioxidant vitamins and isoprostanes in postmenopausal women. Eur J Clin Nutr. 2005;59(2):161–168. doi:10.1038/sj.ejcn.1602051
34. Talwar D, McConnachie A, Welsh P, et al. Which circulating antioxidant vitamins are confounded by socioeconomic deprivation? The MIDSPAN family study. PLoS One. 2010;5(6):e11312. doi:10.1371/journal.pone.0011312
35. Gascón-Vila P, Garcia-Closas R, Serra-Majem L, et al. Determinants of the nutritional status of vitamin E in a non-smoking Mediterranean population. Analysis of the effect of vitamin E intake, alcohol consumption and body mass index on the serum alpha-tocopherol concentration. Eur J Clin Nutr. 1997;51(11):723–728. doi:10.1038/sj.ejcn.1600472
36. White E, Kristal AR, Shikany JM, et al. Correlates of serum alpha- and gamma-tocopherol in the Women’s Health Initiative. Ann Epidemiol. 2001;11(2):136–144. doi:10.1016/S1047-2797(00)00189-7
37. Devaraj S, Leonard S, Traber MG, Jialal I. Gamma-tocopherol supplementation alone and in combination with alpha-tocopherol alters biomarkers of oxidative stress and inflammation in subjects with metabolic syndrome. Free Radic Biol Med. 2008;44(6):1203–1208. doi:10.1016/j.freeradbiomed.2007.12.018
38. Zhao L, Kang I, Fang X, et al. Gamma-tocotrienol attenuates high-fat diet-induced obesity and insulin resistance by inhibiting adipose inflammation and M1 macrophage recruitment. Int J Obes (Lond). 2015;39(3):438–446. doi:10.1038/ijo.2014.124
39. Zaiden N, Yap WN, Ong S, et al. Gamma delta tocotrienols reduce hepatic triglyceride synthesis and VLDL secretion. J Atheroscler Thromb. 2010;17(10):1019–1032. doi:10.5551/jat.4911
40. Newaz MA, Yousefipour Z, Nawal N, Adeeb N. Nitric oxide synthase activity in blood vessels of spontaneously hypertensive rats: antioxidant protection by gamma-tocotrienol. J Physiol Pharmacol. 2003;54:319–327.
41. Godala M, Materek-Kuśmierkiewicz I, Moczulski D, et al. Estimation of plasma vitamin A, C and E levels in patients with metabolic syndrome. Pol Merkur Lekarski. 2014;36:320–323.
42. Wei X, Peng R, Cao J, et al. Serum vitamin A status is associated with obesity and the metabolic syndrome among school-age children in Chongqing, China. Asia Pac J Clin Nutr. 2016;25:563–570.
43. Tabesh M, Noroozi A, Amini M, Feizi A, Saraf-Bank S, Zare M. Association of retinol-binding protein 4 with metabolic syndrome in first-degree relatives of type 2 diabetic patients. J Res Med Sci. 2017;22(1):28. doi:10.4103/1735-1995.200270
44. Hess DA, Trac JZ, Glazer SA, et al. Vascular risk reduction in obesity through reduced granulocyte burden and improved angiogenic monocyte content following bariatric surgery. Cell Rep Med. 2020;1(2):100018. doi:10.1016/j.xcrm.2020.100018
45. Ong S. World Medical Association Declaration of Helsinki: ethical principles for medical research involving human subjects. JAMA. 2013;310(20):2191–2194. doi:10.1001/jama.2013.281053
 © 2020 The Author(s). This work is published and licensed by Dove Medical Press Limited. The full terms of this license are available at https://www.dovepress.com/terms.php and incorporate the Creative Commons Attribution - Non Commercial (unported, v3.0) License.
By accessing the work you hereby accept the Terms. Non-commercial uses of the work are permitted without any further permission from Dove Medical Press Limited, provided the work is properly attributed. For permission for commercial use of this work, please see paragraphs 4.2 and 5 of our Terms.
© 2020 The Author(s). This work is published and licensed by Dove Medical Press Limited. The full terms of this license are available at https://www.dovepress.com/terms.php and incorporate the Creative Commons Attribution - Non Commercial (unported, v3.0) License.
By accessing the work you hereby accept the Terms. Non-commercial uses of the work are permitted without any further permission from Dove Medical Press Limited, provided the work is properly attributed. For permission for commercial use of this work, please see paragraphs 4.2 and 5 of our Terms.