")
Back to Journals » Therapeutics and Clinical Risk Management » Volume 11
National consumption of opioid and nonopioid analgesics in Croatia: 2007–2013
Authors Krnic D, Anic-Matic A, Dosenovic S, Draganic P, Zezelic S, Puljak L
Received 7 April 2015
Accepted for publication 6 July 2015
Published 28 August 2015 Volume 2015:11 Pages 1305—1314
DOI https://doi.org/10.2147/TCRM.S86226
Checked for plagiarism Yes
Review by Single anonymous peer review
Peer reviewer comments 3
Editor who approved publication: Professor Garry Walsh
Darko Krnic,1 Andrea Anic-Matic,2 Svjetlana Dosenovic,2 Pero Draganic,1 Sasa Zezelic,1 Livia Puljak2
1Agency for Medicinal Products and Medical Devices, Zagreb, 2Laboratory for Pain Research, School of Medicine, University of Split, Split, Croatia
Background: The increased consumption of analgesics has been documented worldwide during the last 2 decades. The aim of the study was to examine the trends in opioid and nonopioid analgesic consumption in Croatia between 2007 and 2013.
Methods: Data on opioid consumption were extracted from the database of the national authority. All opioid and nonopioid analgesics were included in the analysis. Data were presented as defined daily doses per 1,000 inhabitants per day. Adequacy of opioid consumption was calculated using adequacy of consumption measure.
Results: During the examined 7-year period, the total consumption and total cost of all analgesics in Croatia showed continuous increase. In the M01A group (anti-inflammatory and antirheumatic products, nonsteroids), ibuprofen had an exponential increasing trend, and in 2011, it overtook diclofenac consumption. Ibuprofen and diclofenac had the highest consumption also in the M02A group of topical products for joint and muscular pain. Tramadol was by far the most consumed type of opioids (N02A group) and paracetamol in the group of other analgesics and antipyretics (N02B). The adequacy of consumption measure value was 0.19, indicating that Croatia is a country with a low opioid consumption.
Conclusion: Between 2007 and 2013, both consumption of analgesics and their cost in Croatia had an increasing trend. Comparisons with data from other countries, based on the published literature, indicate that analgesic consumption in Croatia is still relatively low. Calculation of the adequacy of opioid consumption indicated that Croatia is a country with low opioid consumption. Further studies are necessary for establishing whether current analgesic consumption in Croatia corresponds to patient needs.
Keywords: pain, analgesic agents, prescription opioids, drug utilization, adequacy
Introduction
The increased consumption of analgesics for alleviation of pain has been documented worldwide during the last 2 decades.1–4 This could be due to an increased awareness about pain and its recognition as the fifth vital sign.5 However, the amount and quality of consumption of analgesics can also be influenced by several other factors such as legislation, reimbursement policies, and marketing.1
Therefore, the analysis of national analgesic consumption can provide valuable information about the use of pain medications and enable recognition of the problems associated with prescription medications. Furthermore, such analysis enables comparison of analgesic consumption with other countries.
Analyzing opioid consumption is particularly important. Oral opioids are key medications for the treatment of moderate-to-severe pain, and some of them are regarded by the World Health Organization as essential medicines.6 However, opioids are associated with multiple complications and side effects.7 About half of the patients consuming opioids will experience at least one side effect, and more than one-fifth will discontinue treatment due to a serious adverse event.8 Tolerance is frequently seen as an adaptive phenomenon to opioid treatment, requiring increased dosage or a switch in opioid.9 On the contrary, physical dependence may be experienced as well.10 Even though there are potential problems and concerns regarding opioids, they remain effective analgesics for intense pain.
However, despite the effectiveness of oral analgesics, many patients do not receive this treatment when suffering from severe pain and therefore adequacy of opioid consumption is not necessarily appropriate. Calculating the adequacy of opioid consumption can provide valuable data for making policy changes and making international comparisons.11
The aim of the study was to examine the trends in analgesic consumption in Croatia between 2007 and 2013. The following research questions were addressed: What were the trends in consumption of opioid and nonopioid analgesics? Did the price of opioid and nonopioid analgesics change throughout that period? Is consumption of opioids in Croatia adequate?
Methods
Retrospective analysis of analgesic consumption was conducted between 2007 and 2013 using data on national consumption of medications collected by the national Croatian authority–Agency for Medicinal Products and Medical Devices (HALMED). HALMED collects data on consumption of analgesics from 1,188 institutions, including pharmacies, hospital pharmacies, and drugstores. As defined by the Croatian law, drugs may be sold in specialized retail sale outlets, such as drugstores, which are defined and regulated by the law number 122-2348/2014. These are different from pharmacies.
The data on analgesic consumption refer to both prescription and over-the-counter (OTC) analgesics. Analgesics were analyzed according to the Anatomical Therapeutic Chemical (ATC) classification Defined Daily Dose (DDD) international system for classification and consumption of drugs.12 In the ATC, medications are classified into different groups based on their mechanism of action on organ or organ system and according to the therapeutic, pharmacological, and chemical properties. DDD per 1,000 inhabitants per day (DDD/1,000/day) was used as a measurement unit for analyzing consumption of medications classified within the ATC classification.12
Analyzed classes of analgesics
According to the ATC/DDD classification system, analgesics from the following groups were analyzed: anti-inflammatory and antirheumatic products, nonsteroids (M01A), topical products for joint and muscular pain (M02A), opioid analgesics (N02A), and other analgesics and antipyretics (N02B). A distinctive feature of the M02A group is the DDD, which is zero, according to the ATC classification. Thus, we analyzed changes in drug package sales and costs as indicators of consumption of these medications. For drug utilization analysis, number of DDD/1,000/day and the cost of medication in Croatian kuna (HRK) were calculated.
Adequacy of opioid consumption measure
Descriptive statistics were calculated and annual consumption of medications (according to their generic name), their price, and consumption trend were provided for the analyzed period.
The adequacy of opioid consumption was conducted based on a previously described method.11 The adequacy of consumption measure (ACM) analyzes the need for strong opioids based on the three main causes of pain (terminal cancer, injuries, and final stage of HIV/AIDS). At country level, the mortality data were collected for cancer, HIV/AIDS, and injuries and calculated from the per capita amounts of opioids that would be sufficient to manage pain related to these diseases (need of morphine equivalents for (MEs) selected diseases in milligram per capita). Next, the actual per capita consumption of relevant strong opioids (including morphine, fentanyl, oxycodone, hydromorphone, and pethidine) was calculated from the per capita consumption of each of those drugs (consumption of MEs in milligram per capita). The opioid consumption was obtained from the website of the Pain and Policy Studies Group,13 which receives consumption data for six principal opioids used to treat moderate-to-severe pain from the International Narcotics Control Board.
Reference countries were the top 20 countries based on the Human Development Index.14 Their average ratio between calculated per capita consumption and per capita need as a standard was used as an adequate consumption level, based on the assumption that these countries have adequate consumption of opioids. The method defines five levels of adequacy of opioid consumption: adequate, moderate, low, very low, and nonexistent.11
Results
Consumption of anti-inflammatory and antirheumatic products, nonsteroids (M01A)
During the examined 7-year period (2007–2013), the data collected for consumption of analyzed nonsteroidal anti-inflammatory and antirheumatic products showed an overall increase of 18% (Figure 1).
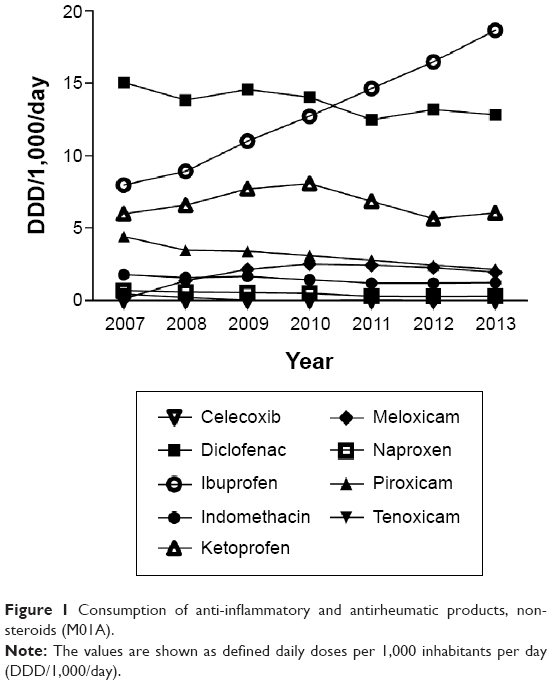 | Figure 1 Consumption of anti-inflammatory and antirheumatic products, nonsteroids (M01A). |
In 2007, diclofenac (15.06 DDD/1,000/day) was the most commonly consumed drug in this group (Figure 1, Table 1). A slowly decreasing trend in diclofenac consumption (-15% decrease between 2007 and 2013) and the reported increasing usage of ibuprofen (134% increase between 2007 and 2013) resulted in the latter having the highest consumption from 2011 onward (18.65 DDD/1,000/day in 2013). Ibuprofen was the only medication in the M01A group that showed a continuous increase in consumption throughout the study period (Figure 1, Table 1). The amount of ketoprofen consumed showed some fluctuations both in consumption (Figure 1, Table 1) and cost (Table 2). After reaching a peak in 2010 (8.08 DDD/1,000/day), the consumption of ketoprofen decreased during the following years. Consumption of indomethacin (-0.54 DDD/1,000/day) and naproxen (-0.38 DDD/1,000/day) was continuously decreasing throughout the study period. Meloxicam, unlike two other oxicams, showed a large increase in consumption, from 0.13 DDD/1,000/day in 2007 to 1.96 DDD/1,000/day in 2013 (Figure 1, Table 1). Celecoxib was the least consumed drug of the M01A group throughout the study period (Table 1).
 | Table 1 Consumption of analgesic drugs in Croatia during years 2007–2013 |
 | Table 2 Cost of analgesic drugs in Croatia during years 2007–2013 |
The costs of nonsteroidal anti-inflammatory and antirheumatic drugs from M01A group followed a similar trend as their consumption, increasing from 88.74 million HRK in 2007 to 115.62 million HRK in 2013 (Figure 2). Ibuprofen accounted for more than a half (56%) and diclofenac for over a quarter (27%) of the cost of this group in 2013. Meloxicam presented with the greatest increase in the cost, but its overall contribution to the group cost was only 3% (Table 2).
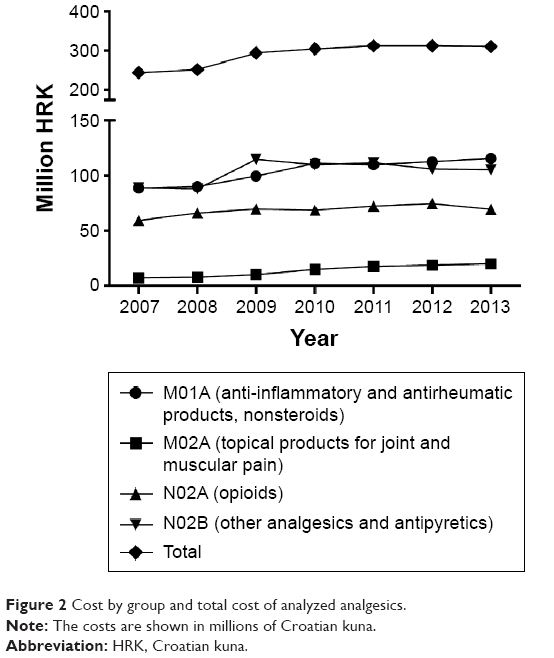 | Figure 2 Cost by group and total cost of analyzed analgesics. |
Consumption of topical products for joint and muscular pain (M02A)
Seven topical products for joint and muscular pain from the M02A group were analyzed. The total sale of topical products for joint and muscular pain increased from 2007 to 2013. A change in the preference of medication in M02A group was observed. In 2007, the most commonly sold products were diclofenac and methyl salicylate. The reported consumption of ibuprofen was low before 2009, but in 2013, ibuprofen and diclofenac were reported as the best-selling topical products for joint and muscular pain. The sale of piroxicam was continuously decreasing, while ketoprofen’s sale decreased almost by half after 2010. The contribution of bufexamac and phenylbutazone to the total sale of topical products for joint and muscular pain was negligible (Table 2).
For all analyzed drugs in the M02A group, the costs rose from 7.14 million HRK in 2007 to 20.11 million HRK in 2013. The most commonly consumed topical products for joint and muscular pain in 2013 were diclofenac and ibuprofen. Diclofenac accounted for 44% and ibuprofen for 41% of the total cost of drugs of the group in 2013. The price of both products increased throughout each year of the study period. For the topical ibuprofen, based on the data gathered by HALMED, the costs increased from 664 HRK in 2007 to 8.29 million HRK in 2013, rising precipitously after 2009 (Table 2).
During the 2007–2013 period, the cost of ketoprofen increased ~800%, unlike bufexamac, piroxicam, and methyl salicylate, which showed continuous decreases in utilization (Table 2).
Consumption of opioids (N02A)
After a 5-year period of growth in the opioid consumption (+1.01 DDD/1,000/day), their consumption remained stable in the following 2 years (-5%) (Table 1, Figure 3). In 2007, the most commonly consumed opioids were tramadol (2.5 DDD/1,000/day) and fentanyl (0.56 DDD/1,000/day) (Table 1, Figure 3). The consumption of tramadol showed some fluctuations with a small increase (+4.1%) by 2013. Although fentanyl presented with an increase in consumption (+9.5%), buprenorphine with an overall increase of 106% became the second most commonly utilized opioid from 2008 onward (Figure 3). Those three medications accounted for 97% of the total opioid consumption in Croatia in 2013. While all four natural opium alkaloids that were analyzed fluctuated in consumption during the examined time period, only hydromorphone utilization decreased (-73%). Unlike the moderate increase in morphine consumption (+0.01 DDD/1,000/day), oxycodone consumption increased from 0.01 DDD/1,000/day in 2007 to 0.05 DDD/1,000/day by the end of the study (Table 1). During the 7-year period, the consumption of pentazocine was relatively stable (-2.02%), while pethidine increased by 30% (Table 1). The sale of tramadol combinations from 2007 to 2013 increased by 153%.
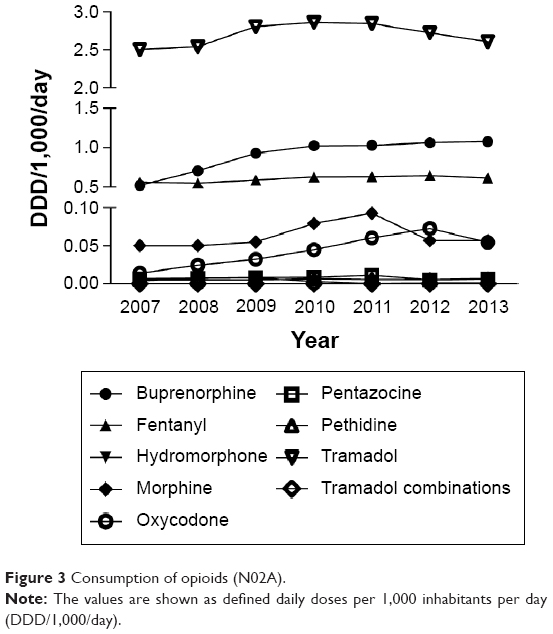 | Figure 3 Consumption of opioids (N02A). |
The total cost of opioids showed a similar trend as their consumption. The total cost of opioids in 2013 was 69.45 million HRK, an increase of 17% compared to 2007 (Table 2). The cost of tramadol combinations constituted almost half (47%) of that amount. Tramadol (−23%) and fentanyl (−54%) costs continuously decreased throughout the study period. Although showing variations in cost during the studied years, the cost of buprenorphine was 30% and oxycodone 269% higher in year 2013 compared to the year 2007. Morphine costs showed some fluctuations. Hydromorphone, pethidine, and pentazocine accounted for only 0.48% of the cost of this group in 2013 (Table 2).
Consumption of other analgesics and antipyretics (N02B)
During 2007–2013, the N02B group with other analgesics and antipyretics was the only one of the four analyzed groups of drugs that showed an overall decrease in total consumption (−1.26 DDD/1,000/day). Paracetamol was the most commonly consumed medication of this group (Table 1, Figure 4); its consumption was continuously increasing from 2007 to 2013 and accounted for over three quarters of the total group utilization. On the contrary, consumption of acetylsalicylic acid exhibited continuous decrease, going down from the second most commonly consumed drug in this group to the third place by the end of the study period. In 2012, acetylsalicylic acid was overtaken by metamizole sodium as a second most commonly consumed drug in this group (Figure 4). The remaining four analyzed drugs in this group are combinations with other drugs; therefore, the trends in their sale were studied instead (acetylsalicylic acid combinations excluding psycholeptics; acetylsalicylic acid combinations with psycholeptics; paracetamol combinations excluding psycholeptics; paracetamol combinations with psycholeptics).
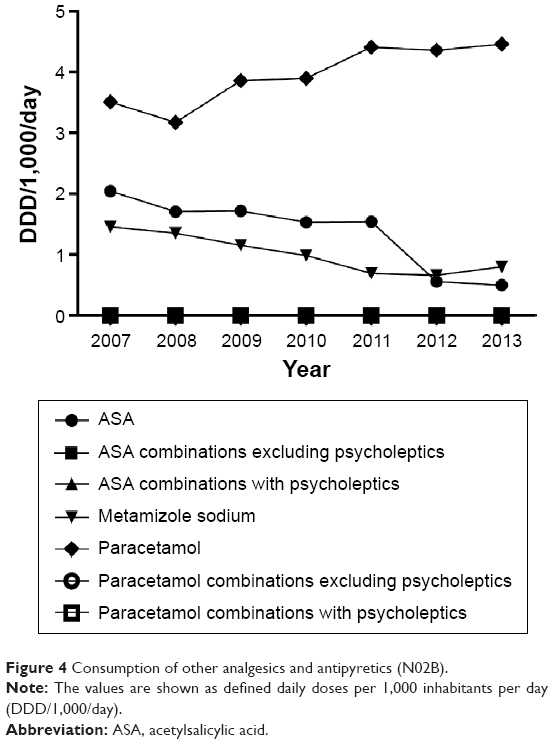 | Figure 4 Consumption of other analgesics and antipyretics (N02B). |
Unlike consumption, the total costs of other analgesics and antipyretics from the N02B group increased by 16.46 million HRK over a 7-year period. The highest increase was in 2009, and afterward, a stable decline of 8.1% was observed (Table 2). Paracetamol and combinations of paracetamol with psycholeptics dominated in the total expenditure throughout the whole examined time period, as well as in the drugs sale.
Sudden decrease in the expenses of paracetamol combinations excluding psycholeptics and acetylsalicylic acid occurred in 2010 and 2012, respectively. The same trend was observed in their sales. Both sales and costs of acetylsalicylic acid combinations excluding psycholeptics presented with some fluctuations between 2007 and 2013. In 2013, acetylsalicylic acid combinations excluding psycholeptics were in the third place by sale and expenditure (Table 2). Acetylsalicylic acid combinations with psycholeptics had the highest increase in costs, but their contribution to the costs of the group was <1%. Metamizole sodium presented with a continuous decrease in sale and expenditure throughout the study period.
Total consumption and cost of all analyzed analgesics
The total consumption of analyzed analgesics in Croatia for 2007–2013 showed an overall increase from 47.19 DDD/1,000/day to 53.4 DDD/1,000/day (Figure 5, Table 1). During the study period, the increase in the total analgesics consumption was mainly due to an increase in the consumption of nonsteroidal anti-inflammatory and antirheumatic drugs from the M01A group (36.51–43.2 DDD/1,000/day) and opioids from the N02A group (3.67–4.44 DDD/1,000/day).
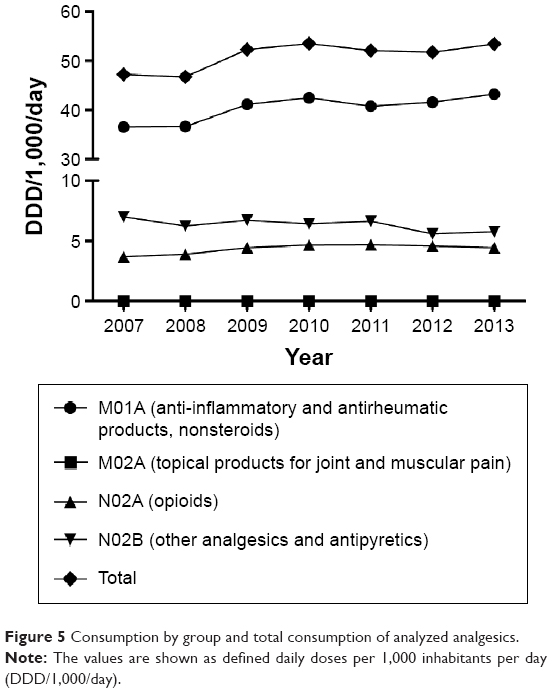 | Figure 5 Consumption by group and total consumption of analyzed analgesics. |
The total cost for all analyzed drugs increased from 244.21 million HRK in 2007 to 310.66 million HRK in 2013, with an increase of 182% for the topical products for joint and muscular pain (M02A) (Figure 2, Table 2). The total costs in 2013 were equally distributed between nonsteroidal anti-inflammatory and antirheumatic products (36%) and other analgesics and antipyretics (36%).
Adequacy of opioid consumption in Croatia
We compared opioid analgesic consumption in Croatia with the consumption levels of the 20 most developed countries based on the Human Development Index system. According to the data for 2011, opioid consumption (expressed in milligram ME per capita) in Croatia was 250.52 mg ME per capita. To evaluate the adequacy of opioid consumption, we calculated the total need for morphine consumption for 2011 (46.53 mg ME per capita) and compared it with the actual consumption, which gave the ACM value of 0.19, indicating that Croatia is a country with a low opioid consumption.
Discussion
In this study, the trends in opioid and nonopioid analgesic consumption in Croatia in 2007–2013 were examined. The total consumption of analgesics and their price increased from 2007 to 2013. The highest overall consumption of all analyzed analgesics was observed in 2010. The total cost of analgesics kept increasing, even in 2011 and 2012, when the total consumption of analgesics decreased. Of all analyzed analgesic groups, the M01A group of drugs (anti-inflammatory and antirheumatic products, nonsteroids) had the highest consumption and the highest total cost.
Croatia’s laws regulate the dispensation of drugs. Among analyzed groups of analgesics, the N02A group, containing opioid medication, is available only via prescription, while the other groups contain drugs that can be obtained via prescription or OTC. Therefore, this study contains both prescription and OTC analgesics. A number of guidelines regulate prescription of analgesics for different indications.
National analyses of all types of analgesics are rare in the published literature. A study of the consumption in the five Nordic countries for the period 1978–1988 showed that the analgesic consumption had increased 15%–42% in the analyzed period. The highest analgesic consumption was observed in Denmark, with 112 DDD/1,000/day, followed by Norway, with 61 DDD/1,000/day.15
Compared to those studies, our study – conducted 25 years later – showed an increase in the consumption of analgesics from 47.2 DDD/1,000/day in 2007 to 53.4 DDD/1,000/day in 2013, with some fluctuations. One of the recent national analgesic consumption studies was conducted in Lithuania for the period 2005–2006, indicating that the analgesic consumption increased 17% in the observed period, from 58.37 DDD/1,000/day to 68.03 DDD/1,000/day.3 Compared to those findings, the national consumption of analgesics in Croatia is still relatively low.
In the M01A group, nine drugs were analyzed. Diclofenac was the most commonly consumed analgesic from the M01A group until 2009. After 2010, it was replaced by ibuprofen, which remained on top of this group until the end of 2013. In the topical group M02A, seven drugs were analyzed. The highest consumption was observed for topical diclofenac and ibuprofen. Diclofenac was the top seller in 2007–2010, replaced by ibuprofen afterward. Changing trends between diclofenac and ibuprofen consumption can be explained by pricing of these drugs in Croatia, ie, ibuprofen is cheaper. All nonsteroidal anti-inflammatory drugs are on a so-called B-list of drugs funded.
There are very few studies examining the utilization of analgesics with anti-inflammatory and antirheumatic properties (M01A group). In 2005–2008, consumption of anti-inflammatory M01A drugs was lower in Croatia than in the neighboring country Serbia. In both countries, the most commonly consumed drug from the M01A group was diclofenac, which indicated a moderate trend toward decreased consumption in Croatia because of increased utilization of ibuprofen.16 Similar to Croatia, diclofenac has also been observed to be the most commonly consumed drug in the M01A group in Lithuania, followed by glucosamine. Ibuprofen indicated sharply increased consumption trends after the withdrawal of coxibs.3 A study in Denmark conducted between 1997 and 2005 indicated that ibuprofen and diclofenac were the most frequently consumed nonselective nonsteroidal anti-inflammatory drugs.17 In Slovakia, another European country, up till 2007, ibuprofen was the most commonly consumed drug from the M01A group.18
In a study conducted in 15 countries worldwide, including Australia, People’s Republic of China, Malaysia, Taiwan, Canada, and the UK, diclofenac was the most commonly consumed anti-inflammatory drug, despite its association with an increased cardiovascular risk. Among the most commonly consumed drugs in these countries were also ibuprofen, naproxen, and mefenamic acid. Besides these drugs, in countries such as Bangladesh, Malaysia, Hong Kong, and the UK, etoricoxib also indicated significant consumption.19
Drugs acting on the nervous system have an important role in pain management. In this study, ten drugs from the N020 group were analyzed. More than three quarters of the total consumption in this group during the analyzed period in Croatia refers to tramadol and tramadol in combinations. The results of opioid consumption found in this study differ from the trend observed during the 1999–2002 period, when tramadol had the second highest consumption. A study conducted in Croatia about consumption of ACT subgroups N02A and N02B indicated that the most commonly consumed analgesic was the fixed-ratio combination of propyphenazone + paracetamol + caffeine + codeine (N02B), while the next was tramadol (N02A).20 Opioid consumption showed increasing trends, both in terms of the dosage utilized and in terms of the financial expenditure.
An increasing trend in the consumption of opioids has recently been observed worldwide. Between 2006 and 2010, 66 countries had an increased opioid consumption of >10%, and Croatia was one of them.21 However, these countries do not even make for half of the world population with adequate access to opioid analgesics.21 European countries had different trends in the opioid utilization. A 2002–2006 study showed increased consumption of opioids in all Scandinavian countries, except in Sweden. Consumption of oxycodone, fentanyl, and methadone in that 5-year period was increased. Consumption of tramadol also showed an increasing trend, except in Sweden. However, morphine showed a decreasing consumption trend. Very small consumption of hydromorphone and buprenorphine was observed.1,22
Consumption of opioids in Canada from 2005 to 2012 is not consistent with those observed in Croatia. Consumption of opioids was increasing in Canada up till the year 2011, when due to decreased consumption of oxycodone consumption of all opioids was decreased. This finding is explained with interventions in control and expenditures of analgesics that were introduced in the beginning of the year 2012.23
Calculation of the adequacy of opioid consumption indicated that Croatia is a country with a low opioid consumption. Since this calculation is based on the calculated needs, our findings could point out to inadequate treatment of patients with moderate and severe pain in Croatia. The rise of opiophobia among clinicians could be one explanation.24 Additionally, as pointed out previously, health care professionals are frequently not trained to prescribe opioid analgesics.21 Even though there is a lot of emphasis on opioids analgesics, there is ample evidence that nonsteroidal analgesics are also prone to inappropriate prescription pattern.25
The ACM analyzes needs for strong opioids based on the several main causes of intense pain, including terminal cancer, injuries, and final stages of HIV/AIDS. However, it should also be noted that the use of opioids is not only frequent in chronic pain conditions but also controversial, as currently there is no strong scientific evidence that opioids as analgesics are effective for chronic nonmalignant pain.26 Therefore, the use of opioids should be continually monitored to make sure that they are used where there is strong evidence for their effectiveness.
Drugs from the N02B group showed decreasing consumption trend in Croatia from 2007 to 2013. However, even though the total consumption of these drugs was decreased, their total cost was continually increasing. Seven drugs from this group were analyzed and paracetamol had the highest consumption as a single drug and also in combination with psycholeptics.
The cost of analgesics kept increasing throughout the study period. Dispensed prices and affordability of opioids differ around the globe. Even if the patients do not have to cover the price of the drug, health systems have to.27
The strengths of the study are the amount of data presented and the number of years covered, as this is the first national study of opioid consumption in Croatia. A limitation to this study is the necessity to rely on data reported by pharmacies and other institutions to HALMED. It took some time for HALMED to establish full cooperation with the reporting institutions. For example, data on consumption of ibuprofen are extremely low for years 2007 and 2008, with an enormous increase of reported consumption afterward. The authorities from HALMED indicate that data for years 2007–2008 are less accurate because at that time, private institutions reporting data on drug expenditure, such as private pharmacies, did not deliver accurate data, perhaps due to fear of being taxed. The number of private pharmacies reporting data and accuracy of the data has since improved considerably. Therefore, the data reported for some drugs between 2007 and 2008 may not be as accurate as the data for the subsequent years. Furthermore, this analysis did not include indications, and so it is unknown whether opioids were prescribed for conditions where they are the most effective.
Conclusion
In conclusion, from 2007 to 2013, both the consumption of analgesics and their cost in Croatia had an increasing trend. The comparisons with data from other countries, based on the published literature, indicate that the analgesic consumption in Croatia is still relatively low. Calculation of the adequacy of opioid consumption indicated that Croatia is a country with a low opioid consumption. Further studies are necessary in order to establish whether current analgesic consumption in Croatia corresponds to patient needs.
Acknowledgments
We are very grateful to HALMED for providing data and to Professor Willem Scholten for kindly providing assistance with calculating ACM. This study did not receive any funding. Majority of data described in this manuscript were part of a graduation thesis of Dr Andrea Anic-Matic, which was written in Croatian language and defended in the year 2014 in Split, Croatia.
Disclosure
The authors report no conflicts of interest in this work.
References
Hamunen K, Laitinen-Parkkonen P, Paakkari P, et al. What do different databases tell about the use of opioids in seven European countries in 2002? Eur J Pain. 2008;12(6):705–715. | ||
De Conno F, Ripamonti C, Brunelli C. Opioid purchases and expenditure in nine western European countries: ‘are we killing off morphine?’. Palliat Med. 2005;19(3):179–184. | ||
Lasinkas M. Trends in the consumption of analgesic drugs in Lithuania iz 2005–2007, Master’s Thesis, Kauno Medicinos Universitetas, 2008, Available from: http://vddb.library.lt/obj/LT-eLABa-0001:E.02~2008~D_20080616_100523-46119. Accessed August 14, 2015. | ||
Gudin JA. The changing landscape of opioid prescribing: long-acting and extended-release opioid class-wide risk evaluation and mitigation strategy. Ther Clin Risk Manag. 2012;8:209–217. | ||
Stone ME. The fifth vital sign: what we need to know about pain. Libr J. 2002;127(6):131. | ||
World Health Organization. WHO Model List of Essential Medicines; 2015. Available from: http://www.who.int/medicines/publications/essentialmedicines/en/. Accessed August 14, 2015. | ||
Aloisi AM, Aurilio C, Bachiocco V, et al. Endocrine consequences of opioid therapy. Psychoneuroendocrinology. 2009;34(suppl 1):S162–S168. | ||
Moore RA, McQuay HJ. Prevalence of opioid adverse events in chronic non-malignant pain: systematic review of randomised trials of oral opioids. Arthritis Res Ther. 2005;7(5):R1046–R1051. | ||
Farrell M. Opiate withdrawal. Addiction. 1994;89(11):1471–1475. | ||
Savage SR. Assessment for addiction in pain-treatment settings. Clin J Pain. 2002;18(4 suppl):S28–S38. | ||
Seya MJ, Gelders SF, Achara OU, Milani B, Scholten WK. A first comparison between the consumption of and the need for opioid analgesics at country, regional, and global levels. J Pain Palliat Care Pharmacother. 2011;25(1):6–18. | ||
WHO. World Health Organization Collaborating Centre for Drug Statistics; 2014. Available from: www.whocc.no. Accessed August 14, 2015. | ||
Pain & Policy Studies Group. Opioid Consumption Data; 2015. Available from: http://www.painpolicy.wisc.edu/opioid-consumption-data. Accessed August 14, 2015. | ||
UNDP. Human Development Index; 2014. Available from: http://hdr.undp.org/en/content/human-development-index-hdi. Accessed August 14, 2015. | ||
Ahonen R, Enlund H, Klaukka T, Martikainen J. Consumption of analgesics and anti-inflammatory drugs in the nordic countries between 1978–1988. Eur J Clin Pharmacol. 1991;41(1):37–42. | ||
Mijatovic V, Calasan J, Horvat O, Sabo A, Tomic Z, Radulovic V. Consumption of non-steroidal anti-inflammatory drugs in Serbia: a comparison with Croatia and Denmark during 2005–2008. Eur J Clin Pharmacol. 2011;67(2):203–207. | ||
Fosbøl EL, Gislason GH, Jacobsen S, et al. The pattern of use of non-steroidal anti-inflammatory drugs (NSAIDs) from 1997 to 2005: a nationwide study on 4.6 million people. Pharmacoepidem Drug Saf. 2008;17(8):822–833. | ||
Hudec R, Kriska M, Bozekova L, Foltan V. Comparison of NSAID consumption in Slovakia, Finland and Norway. Bratisl Lek Listy. 2008;109(8):370–373. | ||
McGettigan P, Henry D. Use of non-steroidal anti-inflammatory drugs that elevate cardiovascular risk: an examination of sales and essential medicines lists in low-, middle-, and high-income countries. PLoS Med. 2013;10(2):e1001388. | ||
Lovrek V, Bradamante V, Saric-Medic M, Kovacic M. Analysis of opioids and other analgesics and antipyretics consumption. In: World Congress of Pharmacy and Pharmaceutical Sciences 63rd International Congress of FIP, Sydney, Australia; September 4–9; 2003. | ||
Duthey B, Scholten W. Adequacy of opioid analgesic consumption at country, global, and regional levels in 2010, its relationship with development level, and changes compared with 2006. J Pain Symptom Manage. 2014;47(2):283–297. | ||
Fredheim OMS, Skurtveit S, Breivik H, Borchgrevink PC. Increasing use of opioids from 2004 to 2007-Pharmacoepidemiological data from a complete national prescription database in Norway. Eur J Pain. 2010;14(3):289–294. | ||
Fischer B, Jones W, Rehm J. Trends and changes in prescription opioid analgesic dispensing in Canada 2005–2012: an update with a focus on recent interventions. BMC Health Serv Res. 2014;14:90. | ||
Rhodin A. The rise of opiophobia: is history a barrier to prescribing? J Pain Palliat Care Pharmacother. 2006;20(3):31–32. | ||
Fadare JO, Agboola SM, Opeke OA, Alabi RA. Prescription pattern and prevalence of potentially inappropriate medications among elderly patients in a Nigerian rural tertiary hospital. Ther Clin Risk Manag. 2013;9:115–120. | ||
Manchikanti L, Atluri S, Hansen H, et al. Opioids in chronic noncancer pain: have we reached a boiling point yet? Pain Physician. 2014;17(1):E1–E10. | ||
De Lima L, Pastrana T, Radbruch L, Wenk R. Cross-sectional pilot study to monitor the availability, dispensed prices, and affordability of opioids around the globe. J Pain Symptom Manage. 2014;48(4):649–659e641. |
 © 2015 The Author(s). This work is published and licensed by Dove Medical Press Limited. The full terms of this license are available at https://www.dovepress.com/terms.php and incorporate the Creative Commons Attribution - Non Commercial (unported, v3.0) License.
By accessing the work you hereby accept the Terms. Non-commercial uses of the work are permitted without any further permission from Dove Medical Press Limited, provided the work is properly attributed. For permission for commercial use of this work, please see paragraphs 4.2 and 5 of our Terms.
© 2015 The Author(s). This work is published and licensed by Dove Medical Press Limited. The full terms of this license are available at https://www.dovepress.com/terms.php and incorporate the Creative Commons Attribution - Non Commercial (unported, v3.0) License.
By accessing the work you hereby accept the Terms. Non-commercial uses of the work are permitted without any further permission from Dove Medical Press Limited, provided the work is properly attributed. For permission for commercial use of this work, please see paragraphs 4.2 and 5 of our Terms.