")
Back to Journals » International Journal of Nanomedicine » Volume 13
Nanostructures of diamond, graphene oxide and graphite inhibit CYP1A2, CYP2D6 and CYP3A4 enzymes and downregulate their genes in liver cells
Authors Strojny B, Sawosz E , Grodzik M , Jaworski S, Szczepaniak J , Sosnowska M , Wierzbicki M , Kutwin M , Orlińska S, Chwalibog A
Received 27 September 2018
Accepted for publication 2 November 2018
Published 13 December 2018 Volume 2018:13 Pages 8561—8575
DOI https://doi.org/10.2147/IJN.S188997
Checked for plagiarism Yes
Review by Single anonymous peer review
Peer reviewer comments 2
Editor who approved publication: Dr Thomas Webster
Barbara Strojny,1 Ewa Sawosz,1 Marta Grodzik,1 Sławomir Jaworski,1 Jarosław Szczepaniak,1 Malwina Sosnowska,1 Mateusz Wierzbicki,1 Marta Kutwin,1 Sylwia Orlińska,1 André Chwalibog2
1Division of Nanobiotechnology, Warsaw University of Life Sciences, Warsaw, Poland; 2Department of Veterinary and Animal Sciences, University of Copenhagen, Frederiksberg, Denmark
Introduction and objective: Currently, carbon nanostructures are vastly explored materials with potential for future employment in biomedicine. The possibility of employment of diamond nanoparticles (DN), graphene oxide (GO) or graphite nanoparticles (GN) for in vivo applications raises a question of their safety. Even though they do not induce a direct toxic effect, due to their unique properties, they can still interact with molecular pathways. The objective of this study was to assess if DN, GO and GN affect three isoforms of cytochrome P450 (CYP) enzymes, namely, CYP1A2, CYP2D6 and CYP3A4, expressed in the liver.
Methods: Dose-dependent effect of the DN, GO and GN nanostructures on the catalytic activity of CYPs was examined using microsome-based model. Cytotoxicity of DN, GO and GN, as well as the influence of the nanostructures on mRNA expression of CYP genes and CYP-associated receptor genes were studied in vitro using HepG2 and HepaRG cell lines.
Results: All three nanostructures interacted with the CYP enzymes and inhibited their catalytic activity in microsomal-based models. CYP gene expression at the mRNA level was also downregulated in HepG2 and HepaRG cell lines. Among the three nanostructures, GO showed the most significant influence on the enzymes, while DN was the most inert.
Conclusion: Our findings revealed that DN, GO and GN might interfere with xenobiotic and drug metabolism in the liver by interactions with CYP isoenzymes responsible for the process. Such results should be considered if DN, GO and GN are used in medical applications.
Keywords: carbon nanostructures, nanoparticles, cytochrome P450, microsomes, liver
Introduction
Recent advances in nanotechnology are strongly focused on the application of nanoparticles and nanomaterials in biotechnology and biomedical-related fields. The possibility of using carbon nanostructures as a component of drug delivery systems,1 diagnostic tools and biosensors2,3 or anticancer therapies4–6 is considered to be the future; however, at the same time, it raises a question of safety and toxicity of the materials.7 They are tested for biocompatibility when intended for contact with human body, both externally, for example, as a dressing,8 and internally, for example, for the delivery of imaging contrast9–11 or active compounds.12 It has been shown that regardless of administration route for internal applications, nanoparticles can be transported with blood to tissues where they might be deposited for a long time, sometimes binding proteins and changing their function. The major site of nanoparticle deposition is the liver;13 therefore, detailed studies on the impact of nanoparticles on liver functions are necessary. The liver is a major organ responsible for the metabolism and biotransformation of xenobiotics, including drugs; so, possible interactions with liver enzymes should be considered, especially when drugs are co-administrated with nanoparticles. Even though it was shown that carbon nanoparticles did not induce direct toxic effects on the liver tissue,14 there is a possibility that interaction with enzymes responsible for metabolism might change the effectiveness of a drug.
The major enzymes responsible for the metabolism of xenobiotics are members of the cytochrome P450 (CYP) family. CYP isoforms are catalysts for Phase I metabolism, where the oxygen atom is built into a parent compound, making the compound more hydrophilic.15 Usually, toxins are detoxified and drugs can be transformed into an active form; however, some cytochromes are engaged in the metabolic activation of carcinogens. The biotransformation reactions take place in the active site located in a pocket of the CYP enzyme. The key factor for CYP functioning is proper electron transfer from a flavoprotein donor, which determines the catalytic activity within the pocket.16 Depending on the secondary structure of the isoform, the catalytic site differs slightly and has a direct effect on what molecules can fit into the site and undergo biotransformation.17 The most important members of the CYP family are CYP3A isoforms, especially CYP3A4 which is responsible for ~30% of the total hepatic activity of CYP.18 Other important isoenzymes highly engaged in drug and xenobiotic metabolism are CYP2D6 and CYP1A2. CYP2D6 metabolizes about 20% of clinically relevant drugs, and its characteristic feature is a possible duplication of an encoding gene, which has an impact on the different metabolism of drugs among populations.19 The CYP1A2 form is relevant not only in drug metabolism (over 10% of popular drugs) but also for polycyclic aromatic hydrocarbon (PAH) metabolism, leading to metabolic activation of procarcinogens.20 Products of such reactions can form adducts with DNA and initiate tumor development.
The problem with disturbances of CYP reactions caused by nanomaterials is a new topic, studied most recently on metallic nanoparticles (gold or silver) and using the CYP3A4 isoform. It was shown that gold nanoparticles can inhibit the catalytic activity of CYPs, as well as change the expression of CYP genes and genes responsible for CYP regulation.21 Ye et al also demonstrated that alterations in enzyme activity depend on the size of gold nanoparticles.22 Another study showed size-dependent inhibition of CYP enzymes for low-toxic polystyrene nanoparticles.23 Inhibition of enzymes was also demonstrated for silver nanoparticles during in vitro tests, but not within the liver tissue of rats fed with nanoparticles.24 As for carbon nanomaterials, mainly carbon nanotubes have been studied so far. Single-walled carbon nanotubes (SWCNT) inhibited the activity of the CYP3A4 enzyme by direct interaction between SWCNT and the enzyme.25 Hitoshi et al reported that SWCNT also downregulated genes coding other CYP isoenzymes, namely, CYP1A1 and CYP1B1.26
We turned our attention to other carbon nanostructures, such as diamond nanoparticles (DN), graphene oxide (GO) and graphite nanoparticles (GN), which were previously shown to be nontoxic or low toxic; however, no data are available on their potential interactions with CYP isoenzymes.12,14,27 We hypothesized that a physicochemical interaction occurs between employed carbon nanostructures and CYP1A2, CYP2D6 and CYP3A4 enzymes. We investigated the dose-dependent effect of the nanostructures on the catalytic activity of CYPs using a microsome-based model and the influence of the carbon nanostructures on the mRNA expression of CYP genes and CYP-associated receptor genes in two hepatic-derived cell lines, HepG2 and HepaRG.
Materials and methods
Nanostructures
DN and GN powders were purchased from Skyspring Nanomaterials Inc. (Houston, TX, USA). Both nanoparticles were produced by the explosive method and synthesized to 3–4 nm. The purity was >95% for DN and >93% for GN, and the specific surface area was 282 m2/g for DN and 540–650 m2/g for GN. Stock solutions at a concentration of 1,000 mg/L were prepared by suspending the nanoparticles in ultra-pure water (MilliQ; Merck KGaA, Darmstadt, Germany) followed by dispersion using an ultrasonic bath at 550 W/m2 for 1 hour (Sonorex Super RK 514H; Bandelin Electronic, Berlin, Germany). Stock solutions were ultrasonicated again for 30 minutes prior to every experiment in order to prepare solutions of nanoparticles. Raman spectra for the DN and GN used are available in the previous paper by Wierzbicki et al.28
GO was obtained from Nanopoz (Poznan, Poland), where it was produced by a modified Hummers’ method.29 The obtained GO platelets had a size between 5 and 30 μm and contained 39%–49% of oxygen. GO was delivered in the form of hydrocolloid at 4,000 mg/L concentration, which was diluted to 1,000 mg/L. Similar to DN and GN, it was sonicated for 30 minutes prior to every experiment.
Visualization of nanostructures
Droplets of nanoparticle solutions at a concentration of 50 mg/L were placed onto formvar-coated copper grids (Agar Scientific, Stansted, UK), and after air-drying, the grids were inspected by transmission electron microscopy (TEM; JEM-2000EX; JEOL, Tokyo, Japan) at 80 keV. Images were captured with a Morada 11 megapixel camera (Olympus Soft Imaging Solutions GmbH, Münster, Germany).
Microsomal model with CYP450 isoenzymes expression
Vivid® CYP450 Screening Kits with Baculosomes® expressing human CYP450 isoenzymes 1A2, 2D6 and 3A were purchased from Thermo Fisher Scientific (Waltham, MA, USA). Control Baculosomes lacking the expression of the human enzymes were purchased as a negative control. All reagents were handled and prepared according to the manufacturer’s protocol. Baculosomes system mimics the microsomal model for liver CYP450 enzyme activity studies.
Preparation of nanomaterial–CYP450 complex for physicochemical interaction measurements
From the 1,000 mg/L stock solutions of DN, GO and GN, the following 10× concentrated solutions were prepared in ultra-pure water: 31.25, 62.5, 125, 250, 500 and 1,000 mg/L. The hydrocolloids (100 μL) were then transferred to new tubes containing 800 μL of ultra-pure water and 100 μL of diluted Baculosomes with 1A2, 2D6 or 3A4 expressed enzymes. Each of the Baculosomes was previously diluted to a concentration of 100 μg/mL of the total protein, according to the Baculosomes characterization specific for the purchased lot. Dilutions were prepared directly before tests. After mixing the Baculosomes with DN, GO and GN, the suspensions were incubated at 37°C for 1 hour and zeta potential, hydrodynamic diameter and adsorption of the enzymes to the nanostructures were measured.
Zeta potential measurements
Zeta potential of the pure hydrocolloids of DN, GO and GN (50 mg/L) and Baculosomes mixed with increasing concentrations of DN, GO and GN (complexes) were measured after 120 seconds of stabilization at 25°C by the microelectrophoretic method with Smoluchowski approximation using a Zetasizer Nano-ZS90 analyser (Malvern, Worcestershire, UK). Each measurement was repeated three times.
Size distribution and hydrodynamic diameter
Size distribution and hydrodynamic diameter of the nanostructures and the described complexes were measured using dynamic light scattering technique with a Zetasizer Nano-ZS90 analyser after 120 seconds of stabilization at 25°C. Each measurement was repeated three times.
Adsorption of CYP450 enzymes on nanostructures measured by free protein concentration
The quantitative effect of the adsorption of CYP450 enzymes expressed in the Baculosomes of DN, GO and GN was measured using the above complexes as previously described. Baculosomes incubated without nanostructures were used as a control. Additionally, the control Baculosomes without CYP450 expression were mixed in the same manner as the Baculosomes with CYP1A2, CYP2D6 and CYP3A4 expression. After the incubation step, all tubes were centrifuged for 5 minutes at 2,000 rpm in order to remove the heaviest complexes from the suspension. Free protein in Baculosomes, which was not adsorbed on the nanostructures, remained in the supernatant and was used for further analysis. Total protein content in the supernatant was determined using the Bicinchoninic Acid Protein Assay (Sigma Aldrich, St Louis, MO, USA). It is based on the formation of a Cu2+–protein complex under alkaline conditions, followed by the reduction of Cu2+ to Cu1+, which forms a purple complex with bicinchoninic acid. The amount of reduction and intensity of the purple color is proportional to the protein present. After adding reagents according to the manufacturer’s protocol, the samples were incubated for 30 minutes at 37°C and absorbance was read at 562 nm.
Enzymatic detection of CYP450 activity in the presence of DN, GO and GN
The assays for enzymatic activity detection were used according to the Vivid® CYP450 Screening Kit protocol for the kinetic mode. For the assays, DN, GO and GN stock 1,000 mg/L hydrocolloids were diluted in working buffer from the kits (200 mM potassium phosphate, pH 8.0). Hydrocolloids were sonicated for 30 minutes prior to dilution. The dilutions were 2.5× concentrated in order to obtain the following final concentrations in the test: 3.125, 6.25, 12.5, 25, 50 and 100 mg/L. Known inhibitors of CYP450 enzymes were used as positive controls: miconazole for CYP1A2, quinidine for CYP2D6 and ketoconazole for CYP3A4. They were diluted in anhydrous acetonitrile to prepare stock solutions and then diluted in working buffer to obtain final concentrations recommended by the manufacturer in the test (30 μM miconazole, 10 μM quinidine and 10 μM ketoconazole).
In the first step (Figure 1), Vivid Substrates (EOMCC for CYP1A2 and CYP2D6, BOMCC for CYP3A4) were reconstituted in anhydrous acetonitrile, and then 40 μL of tested compounds (DN, GO, GN or inhibitors) or working buffer (control) was added to each well on 96-well black-bottom plate (Corning, New York, NY, USA). Then, 50 μL of Master Pre-Mix consisting of Baculosomes (containing either CYP1A2, CYP2D6 or CYP3A4 isoenzyme and NADPH reductase) in working buffer and the regeneration system (consisting of glucose-6-phosphate and glucose-6-phosphate dehydrogenase) were added to each well. The plate was incubated for 10 minutes to allow the compounds to interact with the CYP enzymes (step 2). A pre-read of the plate was performed at this point in order to check for nonspecific fluorescence signals from DN, GO or NG. The reaction was initiated by addition of 10 μL Vivid Substrate and NADP+ mixture (step 3), and a fluorescence read was performed immediately in a kinetic mode at 60 seconds interval for 1 hour with an excitation wavelength of 405 nm and an emission wavelength of 460 nm on the Infinite200 PRO microplate reader (Tecan Group Ltd, Männedorf, Germany). Additional wells containing all tested compounds and substrates without Baculosomes were prepared to exclude nonspecific formation of the fluorescent product in the presence of DN, GO and GN without CYP450 enzymes. All reactions were performed in triplicate and the experiment was run two independent times.
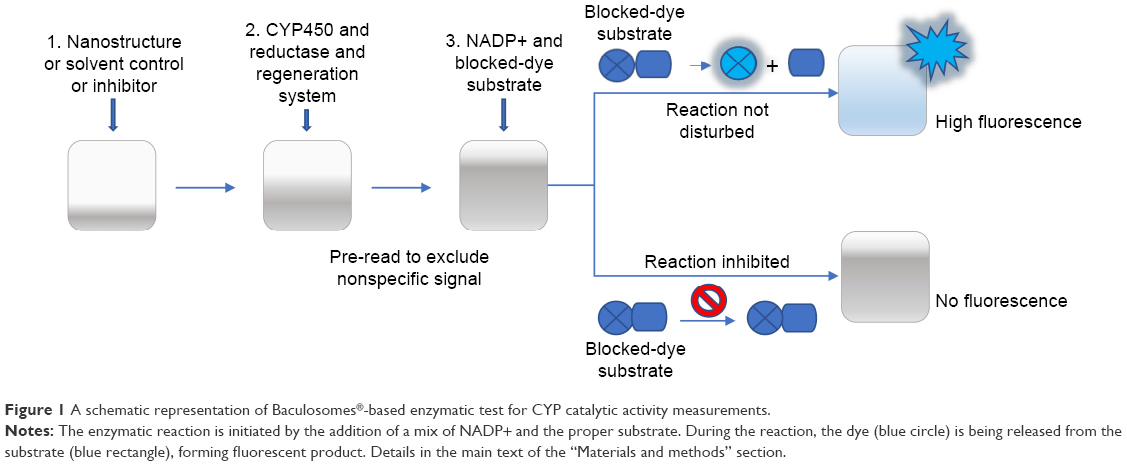 | Figure 1 A schematic representation of Baculosomes®-based enzymatic test for CYP catalytic activity measurements. |
Inhibition of the reaction after 60 minutes was calculated from the following formula:
|
where X=the fluorescence intensity in the presence of test compound, A=the fluorescence intensity in control (without any inhibition) and B=the fluorescence intensity in the presence of the inhibitor.
Cell cultures
For cytotoxicity and gene expression experiments, two hepatic-derived cell lines were used: HepG2 (American Type Culture Collection, Rockville, MD, USA) and HepaRG™ (Biopredic International, Saint Grégoire, France).
HepG2 cells
HepG2 cells were cultured in DMEM (Gibco™; Thermo Fisher Scientific) supplemented with 10% FBS (Gibco) and an antibiotic mix (Gibco) of penicillin (100 U/mL) and streptomycin (100 mg/mL), and the culture was maintained at 37°C in a humidified atmosphere containing 5% CO2. HepG2 cells were seeded at a density of 4×10⁵ cells/mL on a 96-well microplate (Corning) in 100 μL of medium per well and on a 6-well plate in 2 mL of medium per well. The next day, the medium was removed and replaced with fresh medium containing dilutions of DN, GO and GN at concentrations of 3.125, 6.25, 12.5, 25, 50 and 100 mg/L on a 96-well plate and 50 mg/L on a 6-well plate. The dilutions were prepared from 10× concentrated solutions to ensure an equal volume of solvent (1/10) in all groups. In the control group, one-tenth of the medium was also replaced with the solvent (water).
HepaRG cells
Since HepaRG cells are terminally differentiated hepatic cells, they are single-use cells and prohibited from being propagated. As a result, the procedure was slightly different than for HepG2 cells. After thawing, the cells were suspended in a base medium consisting of Williams’ Medium E, 1% GlutaMAX™ and HepaRG Supplement for Thaw, Plate and General Purpose (all media from Gibco) and counted on a hemocytometer. Cells at a prepared density of 1.25×10⁶ cells/mL were then seeded on a 12-well plate (1 mL per well) and on a 96-well plate (100 μL per well). Cells were cultured for 7 days at 37°C in a humidified atmosphere containing 5% CO2. The medium was replaced with a base medium containing HepaRG Supplement for Maintenance/Metabolism instead of the previous supplement on day 2 and was refreshed at days 5 and 7. At day 8, the medium was replaced with medium containing DN, GO and GN at a concentration of 50 mg/L or medium with one tenth water in the control group.
Viability assay
In 96-well plates, cell viability was assessed after 24 hours of treatment with nanostructures using MTT assay, where yellow soluble tetrazolium salt is converted to purple formazan crystals. MTT was dissolved in PBS (5 mg/mL) and 15 μL was added per well. After 3 hours, solubilization detergent (10% SDS, 0.01 M HCl) was added (100 μL/well). Spectrophotometer readings were performed on the following day at 570 nm on an Infinite200 PRO microplate reader (Tecan Group Ltd). Cell viability was expressed as the percentage of the control group viability, which was 100%. Calculations were performed from the following formula: ABStest/ABScontrol×100%, where “ABStest” is the absorbance of wells exposed to the treatment and “ABScontrol” is the mean absorbance of control wells.
RNA isolation
After 24 hours of treatment, cells on 6- or 12-well plates were removed from media. The cells were gently washed twice with PBS and detached from plates using cell scrapers. After collecting the cells with round-bottom 2 mL tubes, the cells were centrifuged for 5 minutes at 1,200 rpm and the supernatant was replaced with freshly prepared lysis buffer from PureLink™ RNA Mini Kit (Thermo Fisher Scientific), which was further used for total RNA isolation. Cells were homogenized using TissueLyser LT (Qiagen, Germantown, MD, USA) with a pre-frosted adapter at 50 Hz for 5 minutes, followed by centrifugation for 10 minutes at 1,200 rpm. The supernatant was transferred to new tubes and mixed with one volume of 70% ethanol and then transferred on a spin cartridge. Further steps were performed according to the manufacturer’s protocol. The RNA concentration in each sample after isolation was determined using the NanoDrop 2000 (Thermo Fisher Scientific).
cDNA synthesis
The RNA level in all samples was equalized, and 10 μL of sample was used for cDNA synthesis using the High-Capacity cDNA Reverse Transcription Kit (Thermo Fisher Scientific). The procedure was performed according to the manufacturer’s protocol with the following cycle conditions: 10 minutes at 25°C, 120 minutes at 37°C and 5 minutes at 4°C, using the 2720 Thermal Cycler (Thermo Fisher Scientific). cDNA concentration was measured with the NanoDrop 2000, and samples were diluted to 20 ng/μL in RNase/DNase-free water. Diluted and undiluted samples were kept at −20°C.
Gene expression
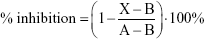
Gene expression at the mRNA level was determined using the ΔΔCT relative quantification real-time PCR method. In the experiment, the expression levels of genes for the previously studied cytochromes CYP1A2, CYP2D6 and CYP3A4, for two other cytochromes vastly expressed in the liver: CYP2B6 and CYP2E1, as well as the receptors responsible for cytochrome gene expression regulation: pregnane X receptor (PXR), constitutive androstane receptor (CAR) and aryl hydrocarbon receptor (AhR) were measured. β-actin and glyceraldehyde 3-phosphate dehydrogenase (GAPDH) were used as housekeeping genes. Relative gene expression (fold change [FC]) was calculated from the formula 2−ΔΔCT, where ΔΔCT=ΔCT of a control − ΔCT of a treated sample and ΔCT=mean CT of β-actin and GAPDH − CT of a target gene. The reaction was performed using the Step One™ Real-Time PCR System (Thermo Fisher Scientific) with the following settings: 95°C for 10 minutes, followed by 40 cycles of 95°C for 15 seconds and 60°C for 60 seconds. The reaction was set for 20 μL volume using 500 nM primer concentration (details in Table 1), Power SYBR™ Green PCR Master Mix (Thermo Fisher Scientific) and 50 ng of cDNA template.
 | Table 1 Sequence of primers used in the presented study |
Statistical analysis
Data for zeta potential and hydrodynamic diameter changes as well as cell viability were analyzed using one-factorial analysis of variance with Statgraphics Centurion XVI (StatPoint Technologies, Warrenton, VA, USA). Differences between groups were tested with Tukey’s post hoc test. Data for gene expression were analyzed using t-tests. Differences at P<0.05 were considered significant.
Results
Nanostructures and CYP450–nanostructure complexes physicochemical characterization
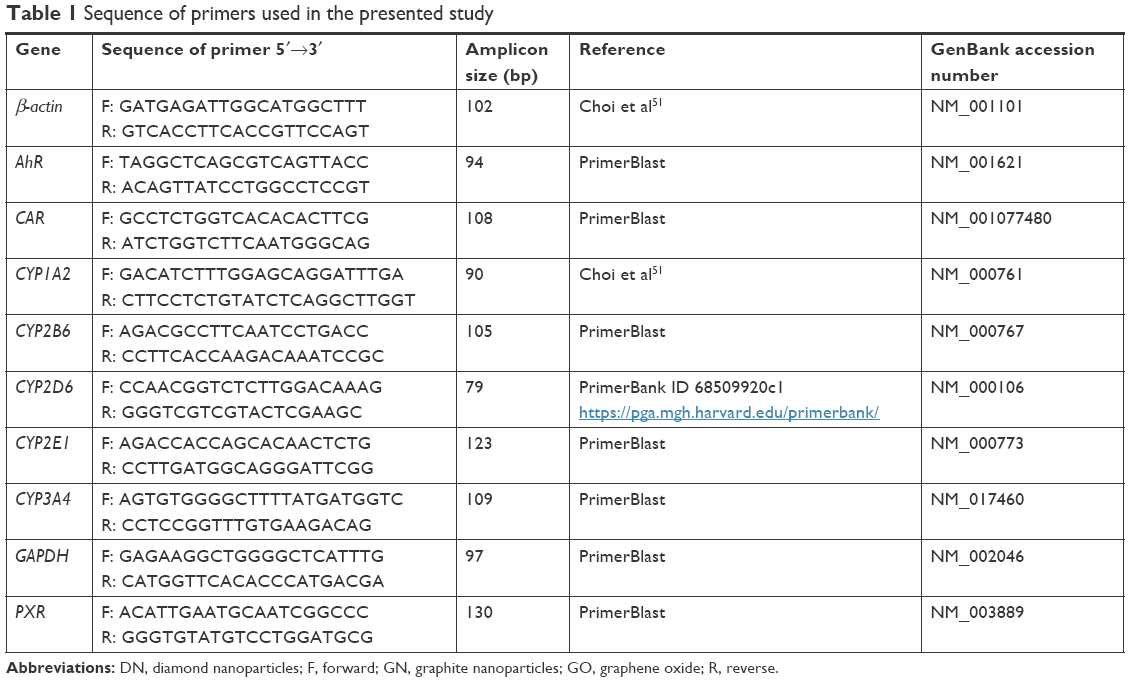
DN, GO and GN morphology inspected by TEM is presented in Figure 2. Zeta potential, size calculated on the basis of TEM pictures and the average hydrodynamic diameter measured by dynamic light scattering are presented in Table 2. DN and GN nanoparticles had sizes <10 nm, while the size of GO platelets was ~>1 μm. The obtained results for zeta potential measurements, which were >25 mV for all the nanostructures (−25.6 mV for DN, −39.7 mV for GO and 26.7 mV for GN) indicated the high degree of stability of hydrocolloids.
 | Figure 2 Transmission electron microscopic images of nanoparticles. Scale bar=200 nm. |
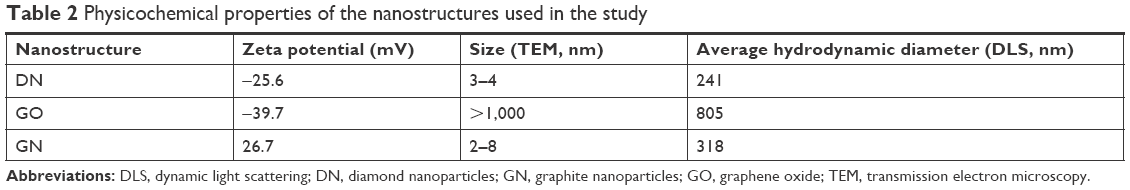 | Table 2 Physicochemical properties of the nanostructures used in the study |
Changes in the hydrodynamic diameter and zeta potential of microsomes (Baculosomes) incubated with increasing concentrations of DN, GO and GN are shown in Figure 3. Values for control samples of microsomes without nanoparticles (marked as 0 mg/L) differed between series, since they were calculated from independent measurements. DN almost did not affect the diameter (Figure 3A–C) or zeta potential (Figure 3D–F) of the microsomes expressing CYP1A2, CYP2D6 and CYP3A4 isoenzymes, whereas GO and GN visibly increased the diameter of the microsomes, especially for the Baculosomes expressing CYP1A2 and CYP3A4 isoenzymes (>1,000 nm in comparison to ~300 nm in 0 mg/L samples). GN also shifted zeta potential of the microsomes from highly negative (−37, −31 and −42 mV for CYP1A2, CYP2D6 and CYP3A4, respectively) toward more positive values (−2, −16 and −30 mV for CYP1A2, CYP2D6 and CYP3A4, respectively) and GO shifted the values toward more negative values (−43, −44 and −48 mV for 1A2, 2D6 and 3A4, respectively), which indicates the impact of GO and GN on the stability of microsome hydrocolloids and the occurrence of physicochemical interactions between the nanostructures and microsomes expressing the CYP enzymes. All the changes induced by GO and GN were concentration dependent.
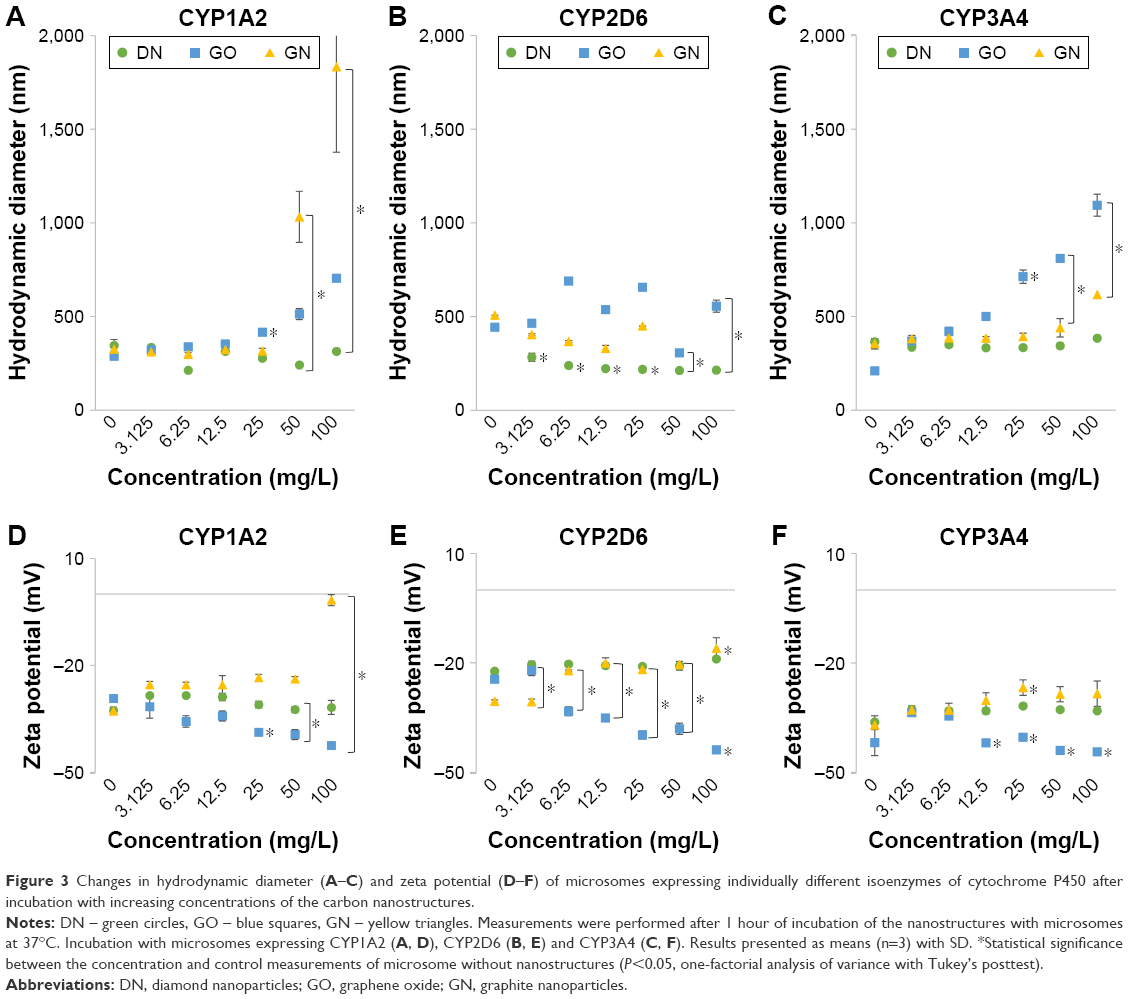 | Figure 3 Changes in hydrodynamic diameter (A–C) and zeta potential (D–F) of microsomes expressing individually different isoenzymes of cytochrome P450 after incubation with increasing concentrations of the carbon nanostructures. |
The rate of the physicochemical interactions was also measured by the protein levels remaining in the supernatant after incubation of microsomes with DN, GO and GN followed by centrifugation compared to microsomes incubated with solvent (ultra-pure water, MilliQ). Obtained results indicated that GO bound the highest amount of protein, since only about 50% of the protein remained in the supernatant. However, additional measurements performed with the control Baculosomes, which did not express any recombinant CYP isoenzyme, revealed that the binding might not be specific for the CYP1A2, CYP2D6 or CYP3A4 proteins, since a similar decrease in the protein level was observed (Table 3).
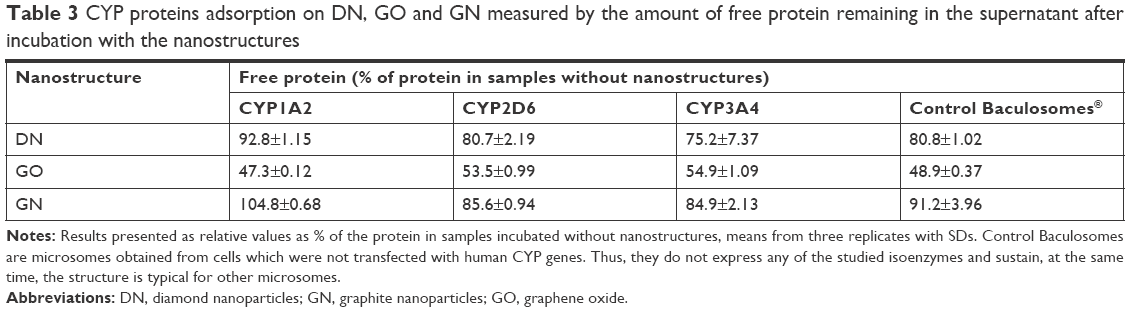 | Table 3 CYP proteins adsorption on DN, GO and GN measured by the amount of free protein remaining in the supernatant after incubation with the nanostructures |
Enzymatic activity of CYP450 in the presence of nanostructures
In the enzymatic test based on Baculosomes, all three types of nanostructures inhibited reactions by CYP1A2, CYP2D6 and CYP3A4 isoenzymes. Inhibition rate was compared to inhibition in positive control samples with the known specific inhibitors miconazole, quinidine and ketoconazole for CYP1A2, CYP2D6 and CYP3A4, respectively. Cytochrome enzymatic activity was not completely inhibited by nanostructures; however, the rate of the reaction and fluorescent product formation was significantly lower (Figure 4) for all the nanostructures. The degree of inhibition was different between the nanostructures and the isoenzymes (Figure 5). In the reaction catalyzed by CYP1A2, higher inhibition at a similar level was observed for DN and GN (about 70%–80% compared to the control inhibitor, miconazole) than for GO (20%–50% inhibition). In the DN and GN groups, the highest concentration (100 mg/L) inhibited the reaction less than lower concentrations, whereas in GO, we observed the opposite effect – the rate of inhibition was concentration dependent in this case. The inhibition rate of CYP3A4 was comparable for DN, GO and GN at all concentrations (50%–60% inhibition); however, at the highest concentration, we observed an effect similar to the one in CYP1A2.
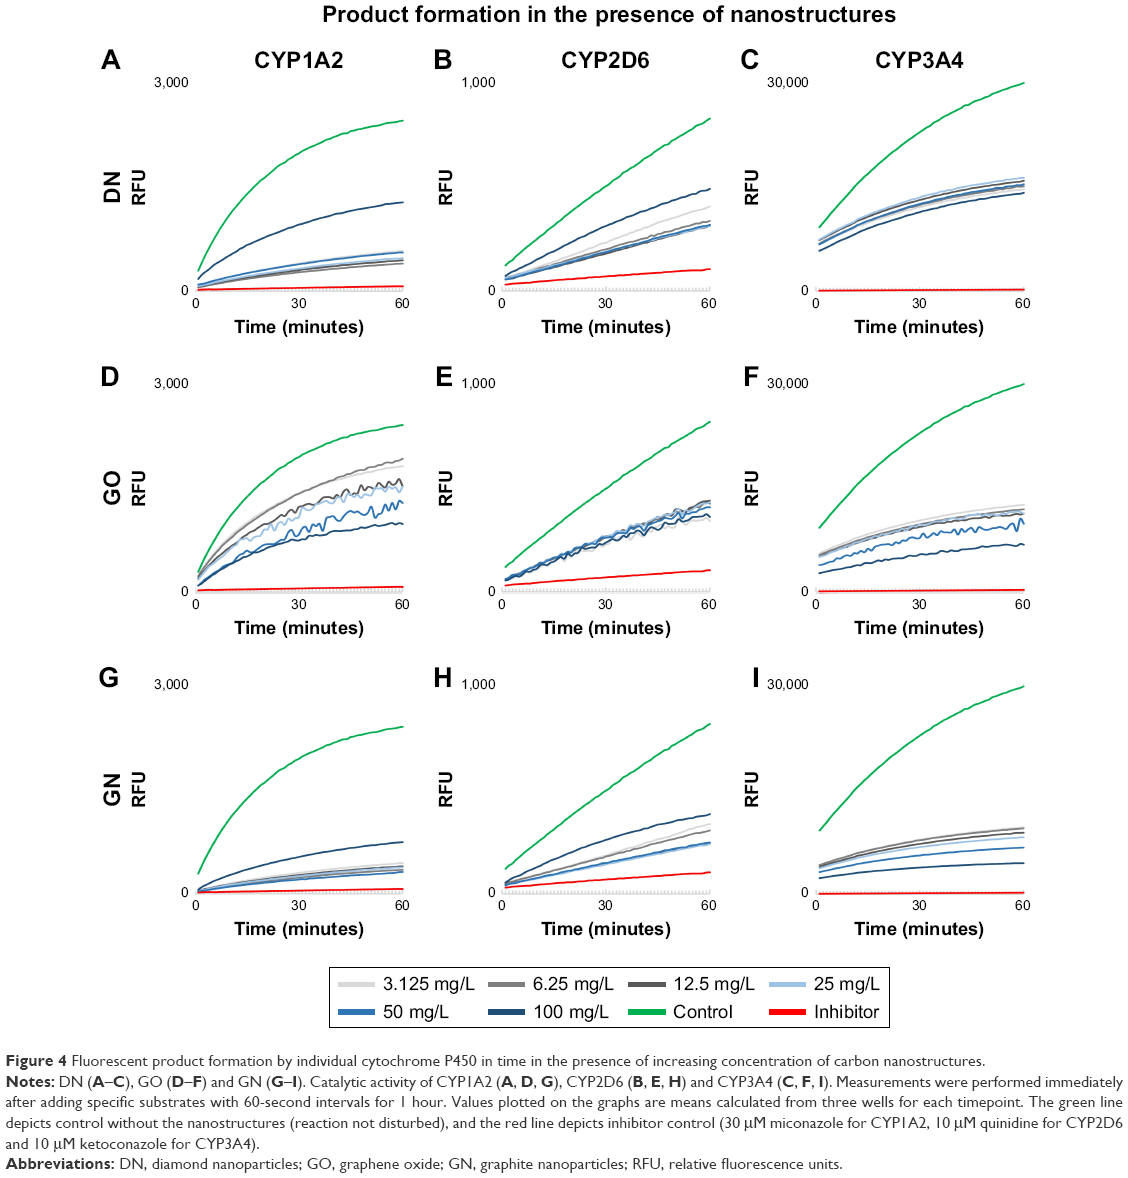 | Figure 4 Fluorescent product formation by individual cytochrome P450 in time in the presence of increasing concentration of carbon nanostructures. |
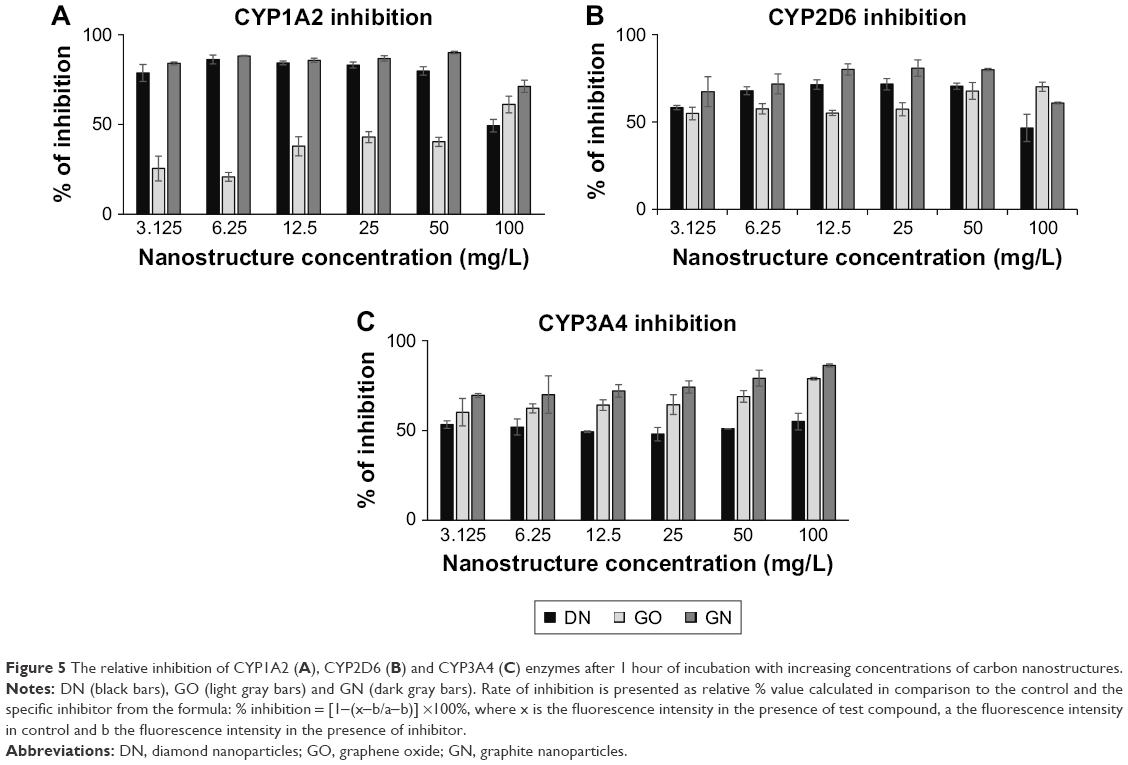 | Figure 5 The relative inhibition of CYP1A2 (A), CYP2D6 (B) and CYP3A4 (C) enzymes after 1 hour of incubation with increasing concentrations of carbon nanostructures. |
Cell viability and CYP450 gene expression in hepatic-derived cell lines
The tested nanostructures did not induce significant toxic effect in cells. No cytotoxic effect was observed for DN in HepG2 cell line at any of the introduced concentrations, while for GO, viability was slightly decreased at 50 and 100 mg/L concentrations (Figure 6A). In the GN group, viability was decreased by about 50% in concentrations from 25 to 100 mg/L. In the HepaRG cells, where 50 mg/L concentration was selected for the test, no cytotoxic effect was observed for DN, GO and GN (Figure 6B).
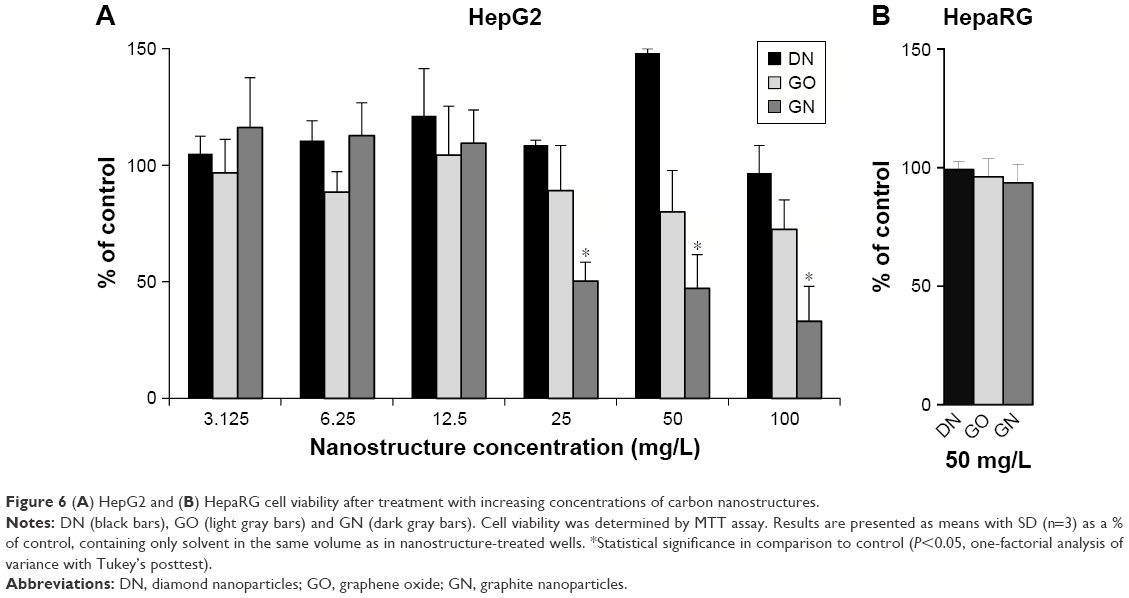 | Figure 6 (A) HepG2 and (B) HepaRG cell viability after treatment with increasing concentrations of carbon nanostructures. |
To obtain more reliable results, changes in gene expression were calculated in relation to two housekeeping genes, β-actin and GAPDH. The results are presented as log2 (FC) for convenient interpretation of positive and negative regulation of expression in comparison to 0=no regulation in the control group (Figure 7). Detailed calculated FCs and classification of gene regulations are summarized in Table 4. Genes coding CYP450 isoenzymes (Figure 7A–C) as well as genes coding CYP450-related receptors (Figure 7B–D) were mostly downregulated at the mRNA level and the effect was stronger in the HepaRG cell line than in the HepG2 cell line. GO had the highest impact on studied gene expression, which was visible for the HepaRG line. CYP1A2 expression was significantly decreased in both cell lines in the DN (45.9% and 36% of the control in HepG2 and HepaRG, respectively) and GO (50.6% and 1.7% of the control in HepG2 and HepaRG, respectively) groups, but increased in the GN group (55.8% and 138.7% more than in the control, HepG2 and HepaRG, respectively). No significant changes were observed for CYP2D6; however, in other studied members of the CYP2 subfamily (2B6 and 2E1), we observed lower expression of both genes in HepaRG cells, while in HepG2 cells, the 2B6 level was increased. The level of CYP3A4 was decreased in all nanostructure groups in both cell lines (<40% of the control, reaching only 1% in the GO group in HepaRG cells), except the GN group in HepaRG cells, where no changes occurred. For AhR, CAR and PXR genes, we observed decrease of gene expression in all groups in the HepaRG cell line (2.2%–72.1% of the control) and similar, but less significant, effect in the HepG2 cell line (31.1%–89.7% of the control). Upregulation was noted only for PXR in the DN group in HepG2 cells (49.8% more than in the control).
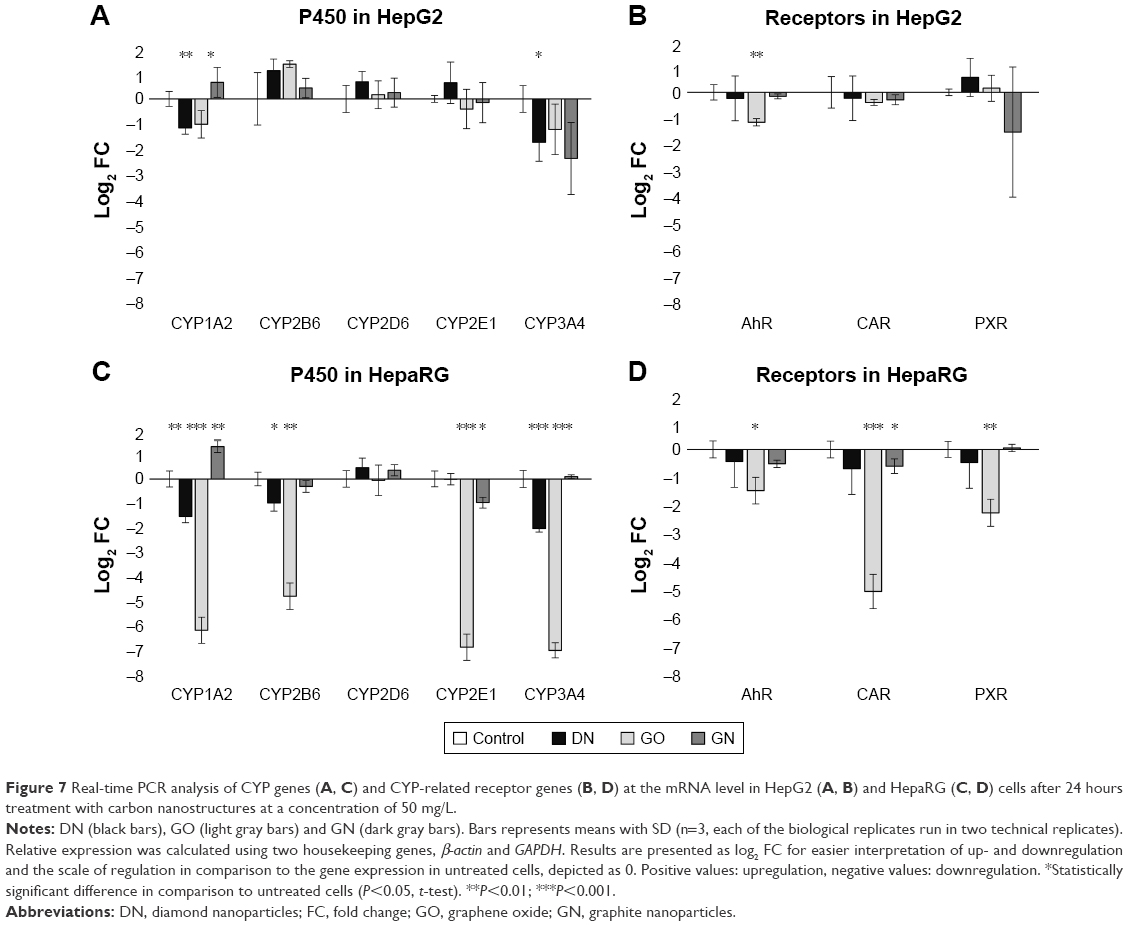 | Figure 7 Real-time PCR analysis of CYP genes (A, C) and CYP-related receptor genes (B, D) at the mRNA level in HepG2 (A, B) and HepaRG (C, D) cells after 24 hours treatment with carbon nanostructures at a concentration of 50 mg/L. |
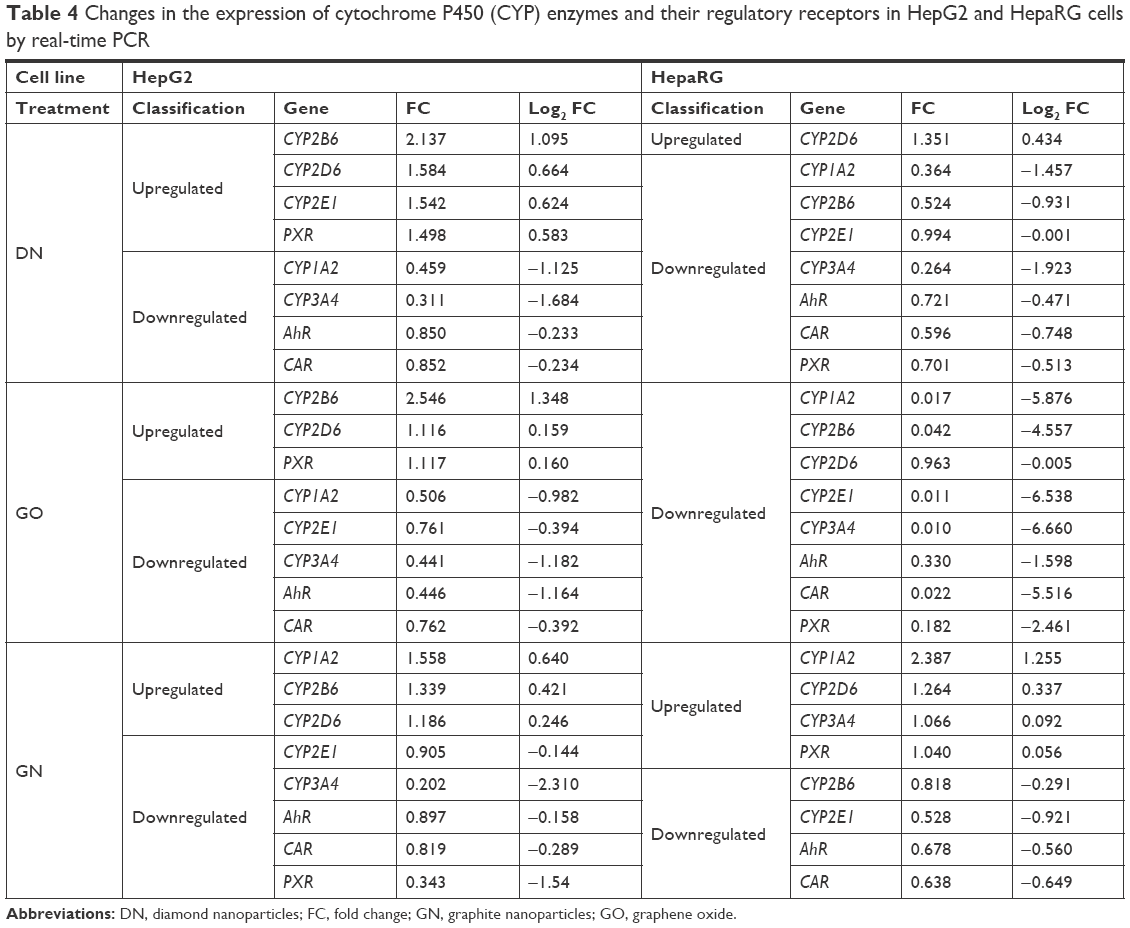 | Table 4 Changes in the expression of cytochrome P450 (CYP) enzymes and their regulatory receptors in HepG2 and HepaRG cells by real-time PCR |
Discussion
In this study, we presented interactions among three nanostructures of different carbon allotropes, namely, DN, GO and GN, and isoenzymes of CYP450, namely, CYP1A2, CYP2D6 and CYP3A4, in the model of Baculosomes. We also demonstrated the consequences of the interactions that occurred, resulting in inhibition of enzymatic activity of CYP450, as well as the effect of introduction of DN, GO and GN to hepatic-derived cells of HepG2 and HepaRG cell lines, resulting in downregulation of CYP450 and CYP-related genes at the mRNA level.
Using microsome-based Baculosomes model (here referred to as microsomes) incubated with the nanostructures, we demonstrated that GO and GN interacted with CYP450 in a dose-dependent manner, increasing the average hydrodynamic diameter of the microsomes and changing their zeta potential. Shifting values of the potential toward higher values in the case of GN and toward more negative values in the group with GO could be related to the zeta potential of bare nanostructures (−39.7 mV for GO and 26.7 mV for GN). Since DN has similar zeta potential to the microsomes (~−30 mV), such shifting was not observed. Highly positive potential of GN could also directly enhance the binding between GN and the microsomes, increasing the hydrodynamic diameter. As DN did not affect either of the parameters, the interactions can be also related to differences in structure at the atomic level as well. Although DN usually has on its surface sp2-hybridized carbon atoms and graphitic areas to some extent, sp3 hybridization is typical for most of the atoms, building the characteristic core of DN and making DN one of the most inert materials.30 Typical for GO and GN, sp2 hybridization and the presence of π electrons might be responsible for the interactions, which are discussed below. Measurements of the level of protein adsorption at the nanostructures revealed that microsomes binding to the nanostructures might be nonspecific to the CYP isoenzyme type and connected with the structure of the microsome itself, meaning also phospholipid membranes (structurally, the microsomes are phospholipid spheres expressing transmembrane CYP proteins). It is still important because any microsome-based model represents hepatocyte endoplasmic reticulum (internal phospholipid membranes) containing all the necessary compounds for the catalytic activity of CYP450 and transmembrane protein CYP450 cannot be studied separately from cellular membranes. Therefore, it is still the preferred model for preclinical studies of drug metabolism mechanisms.31
The most important evidence for the direct interaction between CYP-expressing microsomes and DN, GO and GN is inhibition of the catalytic activity of CYP1A2, CYP2D6 and CYP3A4 measured separately for all three isoforms and revealing subtle differences among the isoenzymes. Product formation on CYP1A2 was highly inhibited by DN and GN, while on CYP2D6 and CYP3A4, all nanostructures inhibited the reaction at similar levels. Interestingly, inhibition of CYP1A2 and CYP3A4 was lower in the presence of the highest concentration of DN and GN (100 mg/L), which could be related to the formation of nanoparticle agglomerates in higher concentrations and then reduction of their surface area available to interact.32 When lower concentrations were introduced, the nanoparticles were probably more dispersed and, taking into consideration the size of the smallest nanoparticles (2–4 nm), they could better fit into the canal leading to the active site of the enzyme. On the contrary, inhibition of CYP1A2 was concentration dependent in the presence of GO. Another important deduction from the course of the reaction was disturbances occurring on all of the cytochromes in the presence of GO. In our studies, a direct redox reaction between GO and the substrates was excluded by running independent samples without CYP enzymes. It has been reported previously that GO has an exceptionally high capability of spontaneously binding to proteins33 and other macromolecules,34 and it depends on the number of oxide-containing groups on the surface.35 Thus, it is probable that GO bound the substrate or prevented the substrate from entering the active site of CYP by binding to microsomes. Using the molecular dynamics method, it was previously demonstrated that multi-walled carbon nanotubes can bind competitively to a protein, preventing the specific ligand from binding.36
DN, GO and GN were previously demonstrated to be biocompatible nanomaterials with no significant toxic effect within an organism.14 Results for viability assessment of HepG2 and HepaRG cells in the present study confirmed that DN has no direct cytotoxic effect for hepatic-derived cells in the in vitro conditions and GO almost had no impact, whereas GN decreased HepG2 cell viability in concentrations higher than 25 mg/L. Even though no direct toxic effect was observed, carbon nanostructures can still affect the molecular pathways within cells.28 Downregulation of CYP-coding genes and CYP-related receptor genes in HepG2 and HepaRG cells in the presence of DN, GO and GN confirmed this statement. General downregulation of the genes was especially visible in HepaRG cells, which probably results from a weaker expression of genes encoding enzymes of Phases I and II of the xenobiotic metabolism in the HepG2 cell line, making HepaRG a more suitable model for drug metabolism studies.37–39
The strongest downregulation of CYP genes was induced by GO, which influenced not only CYP1A2 and CYP3A4 genes, but also CYP2B6, CYP2E1 and AhR, CAR and PXR, which are responsive elements regulating the expression of CYP genes.17 This indicates that GO not only directly inhibits CYP isoenzymes itself but also attenuates the expression of mRNA, which may lead to reduction of the protein pool, limiting the enzymes available to run reactions. Lammel et al reported that GO itself did not change the mRNA expression of CyP1A in PLHC-1 cells from topminnow fish, but could enhance the transport of AhR to the nucleus.40 In other studies by Hitoshi et al, multi-walled carbon nanotubes downregulated CYP1A1 and in HepG2 cells by repression of AhR binding to the enhancer region.26 Interestingly, we observed induction of CYP1A2 upon treatment with GN. A known inducer of CYP1A2 is cigarette smoke containing a significant amount of nanoparticulated carbon black and PAH.17,41 Thus, it might be related to GN structure, more similar to compounds found in the cigarette smoke, when compared to the DN or GO used in this study, as PAH structure also consists of sp2-hybridized carbon atoms with delocalized π electrons, which is a reason for naming PAH nanographenes or cutouts of graphene.42
The enzymes belonging to the CYP450 family are some of the most important enzymes within hepatocytes, as they are responsible for the initial phase of xenobiotic degradation, drug metabolism and prodrug activation.18 If they are affected in the discussed way, relevant changes in xenobiotic metabolism may occur. Examples of implications for applications in the medical field are a disturbance in drug clearance or inhibition of active drug formation from a prodrug, leading either to intoxication of an organism or diminishing the expected effect of the drug.43 It is important when considering DN, GO or GN for drug-delivery systems and in the case of in vivo introduction; yet, it should be noted that such interactions may affect the metabolism of xenobiotics in general. Particularly, it is known that DN, GO or GN remain within an organism after administration and have a tendency to be transported and stored in liver tissues (summarized by Kurantowicz et al).13 Bare nanostructures within the bloodstream usually undergo so-called protein corona formation with blood plasma proteins, which prevents them from interacting with other molecules; however, when they are internalized in cells, the corona is degraded again in the lysosomes.44 This may lead to direct physicochemical interaction of nanostructures with internal membranes and proteins within liver cells. The interactions may induce changes in a protein conformation45 or block an active site in an enzyme.25
It was previously reported that SWCNT inhibited the most important of the isoenzymes, CYP3A4, mostly due to the occurrence of π–π stacking interactions between the nanotube walls and aromatic residues of the enzyme.25 A carbon nanotube is, in fact, a rolled sheet of graphene, which is a single atomic layer of crystalline graphite; therefore, its surface consists of the same hexagonally arranged carbon atoms at sp2 hybridization with π electrons.46 Thus, it can be expected that graphite and graphene interact with CYP similar to SWCNT, since graphene and its derivatives have similar, yet much higher due to the difference in curvature, capacities for disrupting protein structure.47 In the case of GO, which is an oxidized form of graphene, such interactions might not play such an important role, since π electrons are diminished because of the introduction of oxide-containing groups. Oxide-containing groups and defect sites in graphene or GO may also interact by an electrostatic interaction with a hydrogenated group in a protein.36 Moreover, inside a cell, GO can be degraded similarly to nanotubes by enzymes belonging to peroxidases, which creates holes by binding to the graphitic surface of GO, resulting in more defects prone to the interactions.33,48–50
Conclusion
We have demonstrated that DN, GO and GN inhibit the catalytic activity of CYP450 1A2, 2D6 and 3A4 isoenzymes and downregulate the expression of CYP-coding genes and CYP-related genes at the mRNA level, with special emphasis on GO. The results showed that even though carbon nanostructures do not induce cytotoxic effects in liver-derived cells, they impact molecular pathways. The consequence of the interactions may include interruptions in drug and xenobiotic metabolism, which is especially important due to future in vivo applications.
Acknowledgments
This work was supported by The National Science Center in Poland (grant 2016/21/N/NZ7/03344) and The National Center for Research and Development in Poland (grant LIDER/144/L6/14/NCBR/2015).
Disclosure
The authors report no conflicts of interest in this work.
References
Iannazzo D, Pistone A, Salamò M, et al. Graphene quantum dots for cancer targeted drug delivery. Int J Pharm. 2017;518(1–2):185–192. | ||
Sanginario A, Miccoli B, Demarchi D. Carbon nanotubes as an effective opportunity for cancer diagnosis and treatment. Biosensors. 2017;7(1):9–23. | ||
Afsahi S, Lerner MB, Goldstein JM, et al. Novel graphene-based biosensor for early detection of Zika virus infection. Biosens Bioelectron. 2018;100:85–88. | ||
Jaworski S, Sawosz E, Grodzik M, et al. In vitro evaluation of the effects of graphene platelets on glioblastoma multiforme cells. Int J Nanomedicine. 2013;8:413–420. | ||
Sawosz E, Jaworski S, Kutwin M, et al. Graphene functionalized with arginine decreases the development of glioblastoma multiforme tumor in a gene-dependent manner. Int J Mol Sci. 2015;16(10):25214–25233. | ||
Grodzik M, Sawosz E, Wierzbicki M, et al. Nanoparticles of carbon allotropes inhibit glioblastoma multiforme angiogenesis in ovo. Int J Nanomedicine. 2011;6:3041–3048. | ||
Brayner R, Fiévet F, Thibaud C, editors. Nanomaterials: A Danger or a Promise? A Chemical and Biological Perspective. London: Springer-Verlag; 2013. | ||
Ostadhossein F, Mahmoudi N, Morales-Cid G, et al. Development of chitosan/bacterial cellulose composite films containing nanodiamonds as a potential flexible platform for wound dressing. Materials. 2015;8(9):6401–6418. | ||
Kanakia S, Toussaint JD, Mullick Chowdhury S, et al. Dose ranging, expanded acute toxicity and safety pharmacology studies for intravenously administered functionalized graphene nanoparticle formulations. Biomaterials. 2014;35(25):7022–7031. | ||
Gao Y. Carbon nano-allotrope/magnetic nanoparticle hybrid nanomaterials as T2 contrast agents for magnetic resonance imaging applications. J Funct Biomater. 2018;9(1):16. | ||
Lin BR, Chen CH, Kunuku S, et al. Fe doped magnetic nanodiamonds made by ion implantation as contrast agent for MRI. Sci Rep. 2018;8(1):1–6. | ||
Strojny B, Grodzik M, Sawosz E, et al. Diamond nanoparticles modify curcumin activity: in vitro studies on cancer and normal cells and in ovo studies on chicken embryo model. PLoS One. 2016;11(10):e0164637. | ||
Kurantowicz N, Strojny B, Sawosz E, et al. Biodistribution of a high dose of diamond, graphite, and graphene oxide nanoparticles after multiple intraperitoneal injections in rats. Nanoscale Res Lett. 2015;10(1):398. | ||
Strojny B, Kurantowicz N, Sawosz E, et al. Long term influence of carbon nanoparticles on health and liver status in rats. PLoS One. 2015;10(12):e0144821. | ||
Munro AW, Girvan HM, Mason AE, Dunford AJ, McLean KJ. What makes a P450 tick? Trends Biochem Sci. 2013;38(3):140–150. | ||
Sevrioukova IF, Li H, Zhang H, Peterson JA, Poulos TL. Structure of a cytochrome P450-redox partner electron-transfer complex. Proc Natl Acad Sci U S A. 1999;96(5):1863–1868. | ||
Zanger UM, Schwab M. Cytochrome P450 enzymes in drug metabolism: regulation of gene expression, enzyme activities, and impact of genetic variation. Pharmacol Ther. 2013;138(1):103–141. | ||
Anzenbacher P, Anzenbacherová E. Cytochromes P450 and metabolism of xenobiotics. Cell Mol Life Sci. 2001;58(5–6):737–747. | ||
Ahmed S, Zhou Z, Zhou J, Chen SQ. Pharmacogenomics of drug metabolizing enzymes and transporters: relevance to precision medicine. Genomics Proteomics Bioinformatics. 2016;14(5):298–313. | ||
Moorthy B, Chu C, Carlin DJ. Polycyclic aromatic hydrocarbons: from metabolism to lung cancer. Toxicol Sci. 2015;145(1):5–15. | ||
Choi K, Riviere JE, Monteiro-Riviere NA. Protein corona modulation of hepatocyte uptake and molecular mechanisms of gold nanoparticle toxicity. Nanotoxicology. 2017;11(1):64–75. | ||
Ye M, Tang L, Luo M, et al. Size- and time-dependent alteration in metabolic activities of human hepatic cytochrome P450 isozymes by gold nanoparticles via microsomal coincubations. Nanoscale Res Lett. 2014;9(1):642. | ||
Fröhlich E, Kueznik T, Samberger C, Roblegg E, Wrighton C, Pieber TR. Size-dependent effects of nanoparticles on the activity of cytochrome P450 isoenzymes. Toxicol Appl Pharmacol. 2010;242(3):326–332. | ||
Kulthong K, Maniratanachote R, Kobayashi Y, Fukami T, Yokoi T. Effects of silver nanoparticles on rat hepatic cytochrome P450 enzyme activity. Xenobiotica. 2012;42(9):854–862. | ||
El-Sayed R, Bhattacharya K, Gu Z, et al. Single-walled carbon nanotubes inhibit the cytochrome P450 enzyme, CYP3A4. Sci Rep. 2016;6:21316. | ||
Hitoshi K, Katoh M, Suzuki T, Ando Y, Nadai M. Changes in expression of drug-metabolizing enzymes by single-walled carbon nanotubes in human respiratory tract cells. Drug Metab Dispos. 2012;40(3):579–587. | ||
Kurantowicz N, Sawosz E, Halik G, et al. Toxicity studies of six types of carbon nanoparticles in a chicken-embryo model. Int J Nanomedicine. 2017;12:2887–2898. | ||
Wierzbicki M, Jaworski S, Kutwin M, et al. Diamond, graphite, and graphene oxide nanoparticles decrease migration and invasiveness in glioblastoma cell lines by impairing extracellular adhesion. Int J Nanomedicine. 2017;12:7241–7254. | ||
Hummers WS, Offeman RE. Preparation of graphitic oxide. J Am Chem Soc. 1958;80(6):1339. | ||
Nunn N, Torelli M, McGuire G, Shenderova O. Nanodiamond: a high impact nanomaterial. Curr Opin Solid State Mater Sci. 2017;21(1):1–9. | ||
Zhang D, Luo G, Ding X, Lu C. Preclinical experimental models of drug metabolism and disposition in drug discovery and development. Acta Pharm Sin B. 2012;2(6):549–561. | ||
Williams OA, Hees J, Dieker C, Jäger W, Kirste L, Nebel CE. Size-dependent reactivity of diamond nanoparticles. ACS Nano. 2010;4(8):4824–4830. | ||
Bhattacharya K, Mukherjee SP, Gallud A, et al. Biological interactions of carbon-based nanomaterials: from coronation to degradation. Nanomedicine. 2016;12(2):333–351. | ||
Tanum J, Heo J, Hong J. Spontaneous biomacromolecule absorption and long-term release by graphene oxide. ACS Omega. 2018;3(5):5903–5909. | ||
Geldert A, Liu Y, Loh KP, Teck Lim C, Kenry GA. Nano–bio interactions between carbon nanomaterials and blood plasma proteins: why oxygen functionality matters. NPG Asia Mater. 2017;9(8):e422. | ||
Zuo G, Kang SG, Xiu P, Zhao Y, Zhou R. Interactions between proteins and carbon-based nanoparticles: exploring the origin of nanotoxicity at the molecular level. Small. 2013;9(9–10):1546–1556. | ||
Soldatow VY, Lecluyse EL, Griffith LG, Rusyn I. In vitro models for liver toxicity testing. Toxicol Res. 2013;2(1):23–39. | ||
Szabo M, Veres Z, Baranyai Z, Jakab F, Jemnitz K. Comparison of human hepatoma HepaRG cells with human and rat hepatocytes in uptake transport assays in order to predict a risk of drug induced hepatotoxicity. PLoS One. 2013;8(3):e59432. | ||
Westerink WM, Schoonen WG. Cytochrome P450 enzyme levels in HepG2 cells and cryopreserved primary human hepatocytes and their induction in HepG2 cells. Toxicol In Vitro. 2007;21(8):1581–1591. | ||
Lammel T, Boisseaux P, Navas JM. Potentiating effect of graphene nanomaterials on aromatic environmental pollutant-induced cytochrome P450 1A expression in the topminnow fish hepatoma cell line PLHC-1. Environ Toxicol. 2015;30(10):1192–1204. | ||
You R, Lu W, Shan M, et al. Nanoparticulate carbon black in cigarette smoke induces DNA cleavage and Th17-mediated emphysema. Elife. 2015;4:1–20. | ||
Rieger R, Müllen K. Forever young: polycyclic aromatic hydrocarbons as model cases for structural and optical studies. J Phys Org Chem. 2010;23(4):315–325. | ||
Lin JH, Lu AY. Inhibition and induction of cytochrome P450 and the clinical implications. Clin Pharmacokinet. 1998;35(5):361–390. | ||
Wang F, Yu L, Monopoli MP, et al. The biomolecular corona is retained during nanoparticle uptake and protects the cells from the damage induced by cationic nanoparticles until degraded in the lysosomes. Nanomedicine. 2013;9(8):1159–1168. | ||
Saptarshi SR, Duschl A, Lopata AL. Interaction of nanoparticles with proteins: relation to bio-reactivity of the nanoparticle. J Nanobiotechnology. 2013;11(1):26. | ||
Atif R, Inam F. Reasons and remedies for the agglomeration of multilayered graphene and carbon nanotubes in polymers. Beilstein J Nanotechnol. 2016;7:1174–1196. | ||
Gu Z, Yang Z, Chong Y, et al. Surface curvature relation to protein adsorption for carbon-based nanomaterials. Sci Rep. 2015;5:1–9. | ||
Kotchey GP, Allen BL, Vedala H, et al. The enzymatic oxidation of graphene oxide. ACS Nano. 2011;5(3):2098–2108. | ||
Russier J, Ménard-Moyon C, Venturelli E, et al. Oxidative biodegradation of single- and multi-walled carbon nanotubes. Nanoscale. 2011;3(3):893–896. | ||
Flores-Cervantes DX, Maes HM, Schäffer A, Hollender J, Kohler HP. Slow biotransformation of carbon nanotubes by horseradish peroxidase. Environ Sci Technol. 2014;48(9):4826–4834. | ||
Choi JM, Oh SJ, Lee SY, et al. HepG2 cells as an in vitro model for evaluation of cytochrome P450 induction by xenobiotics. Arch Pharm Res. 2015;38(5):691–704. |
 © 2018 The Author(s). This work is published and licensed by Dove Medical Press Limited. The full terms of this license are available at https://www.dovepress.com/terms.php and incorporate the Creative Commons Attribution - Non Commercial (unported, v3.0) License.
By accessing the work you hereby accept the Terms. Non-commercial uses of the work are permitted without any further permission from Dove Medical Press Limited, provided the work is properly attributed. For permission for commercial use of this work, please see paragraphs 4.2 and 5 of our Terms.
© 2018 The Author(s). This work is published and licensed by Dove Medical Press Limited. The full terms of this license are available at https://www.dovepress.com/terms.php and incorporate the Creative Commons Attribution - Non Commercial (unported, v3.0) License.
By accessing the work you hereby accept the Terms. Non-commercial uses of the work are permitted without any further permission from Dove Medical Press Limited, provided the work is properly attributed. For permission for commercial use of this work, please see paragraphs 4.2 and 5 of our Terms.