")
Back to Journals » International Journal of Nanomedicine » Volume 11
Nanostructured ultra-thin patches for ultrasound-modulated delivery of anti-restenotic drug
Authors Vannozzi L , Ricotti L, Filippeschi C, Sartini S, Coviello V, Piazza V, Pingue P, La Motta C, Dario P, Menciassi A
Received 8 July 2015
Accepted for publication 21 October 2015
Published 23 December 2015 Volume 2016:11 Pages 69—92
DOI https://doi.org/10.2147/IJN.S92031
Checked for plagiarism Yes
Review by Single anonymous peer review
Peer reviewer comments 4
Editor who approved publication: Dr Thomas Webster
Video abstract presented by Vannozzi et al
Views: 550
Lorenzo Vannozzi,1 Leonardo Ricotti,1 Carlo Filippeschi,2 Stefania Sartini,3 Vito Coviello,3 Vincenzo Piazza,4 Pasqualantonio Pingue,5 Concettina La Motta,3 Paolo Dario,1 Arianna Menciassi1
1The BioRobotics Institute, Scuola Superiore Sant’Anna, 2Center for MicroBioRobotics at SSSA, Istituto Italiano di Tecnologia, Pontedera, 3Department of Pharmacy, University of Pisa, 4Center for Nanotechnology Innovation at NEST, Istituto Italiano di Tecnologia, 5NEST, Scuola Normale Superiore, Istituto Nanoscienze-CNR, Pisa, Italy
Abstract: This work aims to demonstrate the possibility to fabricate ultra-thin polymeric films loaded with an anti-restenotic drug and capable of tunable drug release kinetics for the local treatment of restenosis. Vascular nanopatches are composed of a poly(lactic acid) supporting membrane (thickness: ~250 nm) on which 20 polyelectrolyte bilayers (overall thickness: ~70 nm) are alternatively deposited. The anti-restenotic drug is embedded in the middle of the polyelectrolyte structure, and released by diffusion mechanisms. Nanofilm fabrication procedure and detailed morphological characterization are reported here. Barium titanate nanoparticles (showing piezoelectric properties) are included in the polymeric support and their role is investigated in terms of influence on nanofilm morphology, drug release kinetics, and cell response. Results show an efficient drug release from the polyelectrolyte structure in phosphate-buffered saline, and a clear antiproliferative effect on human smooth muscle cells, which are responsible for restenosis. In addition, preliminary evidences of ultrasound-mediated modulation of drug release kinetics are reported, thus evaluating the influence of barium titanate nanoparticles on the release mechanism. Such data were integrated with quantitative piezoelectric and thermal measurements. These results open new avenues for a fine control of local therapies based on smart responsive materials.
Keywords: restenosis, micro/nanotherapeutic systems, thin films, layer-by-layer polyelectrolytes, barium titanate nanoparticles, drug delivery, ultrasound
Introduction
Restenosis, which is the recurrence of a stenosis, represents an “Achille heel” of endovascular procedures. This phenomenon, normally occurring after an arterial injury, causes the narrowing of blood vessel lumen, thus limiting the regular blood flow. Restenosis can emerge as a complication of clinical endovascular procedures, such as angioplasty or stent placement.1–3 This effect is due to an immune response that causes the hyperproliferation of vascular smooth muscle cells (VSMCs) and their migration from the tunica media to the tunica intima, with a shrinkage of the vascular lumen.4 This process involves a VSMC phenotype change (from contractile to noncontractile), which facilitates the migratory activity.5 The reduction of restenosis events represents one of the key priorities in endovascular procedures.6
Drugs able to inhibit platelet aggregation and neointima proliferation are mostly used to reduce atherothrombotic complications. However, they are normally injected at systemic level, with a series of drawbacks and side effects, related to the systemic administration route.7,8 Drug-eluting stents (DES) have also been employed to limit restenotic effects.9 However, issues regarding stent-induced thrombosis and possible increase of heart-attack risks remain controversial, as demonstrated for both short- and long-term applications.10,11 A second-generation DES has been designed with the goal of improving safety, but long-term results are still a matter of debate.12 Recently, strategies based on hydrogels,13 smart materials,14 and thin films15 have been conceived to release drugs in a target area. Other strategies involved nanoparticles,16,17 liposomes,18 and other carriers,19 with open issues concerning bioaccumulation, safety, and long-term biocompatibility. Targeted drug delivery can be successfully achieved also by exploiting a promising approach based on layer-by-layer (LbL) nanofilms.20
The LbL method was introduced in 1990s by Decher et al21 to fabricate thin films with controlled structures for biomedical applications. The technique consists of an alternated deposition of oppositely charged polyelectrolytes (PE) that allow to fabricate multilayer polymeric structures with tuned properties, thanks to electrostatic interactions. LbL nanofilms are characterized by a high aspect ratio (~105) and constitute a simple and low-cost strategy to tune the thickness of a membrane at the nanometer scale. In addition, the capability to control surface chemistry and composition and to embed drugs or other molecules within the nanofilm structure makes this technique one of the most promising for the development of targeted drug delivery systems.
Release mechanisms by LbL structures are based on diffusion, drug solvation, film degradation, and swelling.22 Different from other drug delivery systems, LbL structures allow us to embed high quantities of drug inside the polymeric matrix, thanks to the two macroscopic dimensions (and thus a relatively large area) of the nanofilms. Although with some challenges, these platforms could be adapted and exploited to treat restenosis.
Inner vessel walls represent hard-to-reach areas where all the traditional systems show limitations. A rapid washout from arterial tissues strongly compromises the efficiency of treatments based on polymeric,23,24 and magnetic nanoparticles,25,26 which do not show a proper binding affinity. Particle size is critical for the delivery of drugs to vessel walls.27 Some steps ahead have been moved in this field, but the achievement of effective local treatments remains an attractive yet challenging goal.28 PE multilayers have been demonstrated capable of embedding and releasing antibiotics and drugs.29,30 However, few attempts have been made to use these structures as anti-restenotic devices. Promising results in this direction were obtained by Thierry et al.31 They fabricated a PE multilayer made of chitosan and hyaluronic acid (HA) containing L-arginine, able to reduce the restenosis, directly on the wall of aortic porcine arteries. A strong adhesion of the coating was assured by the presence of chitosan (positively charged) as the first layer that interacted with the endothelium (negatively charged). Similar approaches were also reported for in situ repair of damaged vessel, but without using any drug, only relying on PEs directly fabricated onto the targeted tissue/area.32,33 This strategy permitted to prevent blood clotting or restenosis together with an enhancement of vessel luminal surface re-endothelialization. In this case, the main drawback was constituted by the temporary blockage of blood flow that was necessary to treat the inner vessel wall. An alternative approach, based on free-standing nanofilms constituted of PEs deposited onto a polymeric substrate, was recently developed by Redolfi Riva et al.34 These structures were able to load and to locally release anti-inflammatory drugs for the treatment of inflammatory bowel diseases.
Remotely triggerable systems are able to reduce possible toxicity effects, improving at the same time the treatment efficacy by controlling in a flexible manner both drug dose and timing.35,36 Many strategies have been proposed for performing such triggering, starting from a controlled release microchip,37 to materials responsive to visible,38 near-infrared light,39 magnetic fields,40 and ultrasound (US),41 thus developing a series of smart systems capable to tune drug release, thanks to the remote control of an external source. US stimulation is nowadays used in many health-related applications and represents one of the most intriguing noninvasive tools for advanced medical and bioengineering tasks.42–45 In particular, US waves can interact with piezoelectric nanoparticles, converting energy from mechanical to electrical at the microdomains, and representing a high-potential tool in nanomedicine and tissue engineering.46–50
To best of our knowledge, no studies reported the development of an LbL nanofilm loaded with an anti-restenotic drug with a tunable release kinetics, achieved by exploiting the interaction between piezoelectric nanoparticles and US waves.
In this paper, we demonstrated the possibility to embed a 2,3-diphenyl-4H-pyrido[1,2-a]12yrimidin-4-one derivative (named DB103), which recently demonstrated anti-restenotic properties,51 within an LbL nanofilm composed by chitosan and HA, coupled with a poly(L-lactic acid) (PLLA) nanolayer acting as supporting barrier that can be provided with piezoelectric barium titanate (BaTiO3) nanoparticles (Figure 1). We aimed at characterizing the obtained structures, assessing the DB103 release profiles from the nanofilms, and evaluating smooth muscle cells (SMC) and fibroblast adhesion and proliferation on them. Finally, we aimed at verifying if the interaction between BaTiO3 nanoparticles and US waves influenced drug release kinetics.
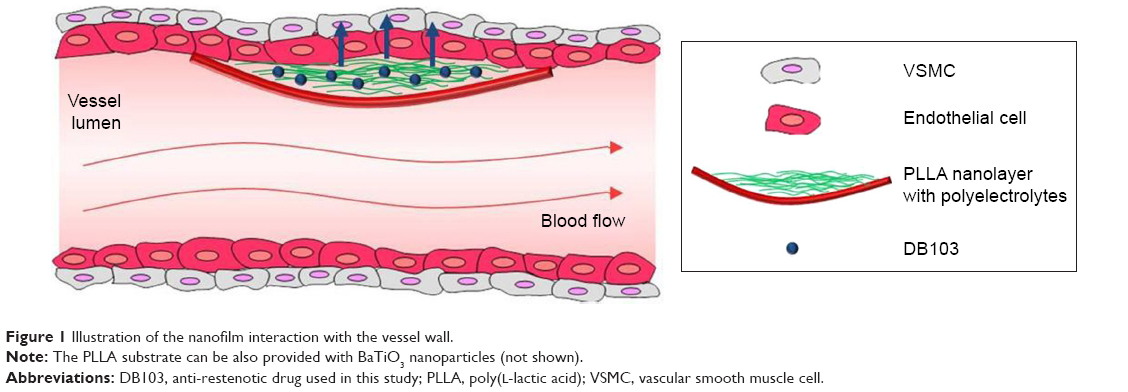 | Figure 1 Illustration of the nanofilm interaction with the vessel wall. |
Materials and methods
Drug synthesis
The anti-restenotic drug (2-(3,4-dimethoxyphenyl)-3-phenyl-4H-pyrido[1,2-a]pyrimidin-4-one [DB103]) was synthesized as previously described.51,52 Briefly, 2-aminopyridine and ethyl 3,4-dimethoxybenzoylacetate (Sigma-Aldrich Co., St Louis, MO, USA) were heated at a temperature of 100°C and stirred with a glass stick until the starting materials dissolved. 2-(3,4-Dimethoxyphenyl)-4H-pyrido[1,2-a]pyrimidin-4-one was obtained and was then added to N-bromosuccinimide (Sigma-Aldrich) and refluxed in chloroform until the starting material was dissolved. Once the reaction was complete, the mixture was cooled down to room temperature and the solvent was removed under vacuum, in order to obtain a yellow powder. In the last step of the synthesis, the bromo derivative was added to a solution of bis(triphenylphosphine)palladium(II) dichloride (Sigma-Aldrich) in toluene, under stirring. After stirring for 10 minutes at room temperature, phenylboronic acid (Sigma-Aldrich) in EtOH and 2 M Na2CO3 were added. The resulting mixture was refluxed overnight and, once the reaction was complete, 2-(3,4-dimethoxyphenyl)-3-phenyl-4H-pyrido[1,2-a]pyrimidin-4-one (DB103) was obtained (Figure S1A).
The drug showed an intrinsic autofluorescence. Thus, it was possible to extract a calibration curve by analyzing different dilutions of the drug in phosphate-buffered saline (PBS). Results were reported as relative fluorescence units (RFUs) versus compound concentration (mM), measured with a microplate reader (Victor X3, Perkin Elmer, Waltham, MA, USA) (Figure S1B).
Nuclear magnetic resonance spectrum was recorded in dimethyl sulfoxide (DMSO)-d6 solution by using a Varian Gemini 200 MHz spectrometer (Agilent Technologies, Santa Clara, CA, USA). Infrared spectrum was recorded with an Agilent Cary 660 FT-IR spectrometer (Agilent Technologies, Santa Clara, CA, USA) (Table S1).
Preparation of nanostructured films
SiO2 wafers (400 μm thickness, p-type boron-doped, Si(100), Si-Mat Silicon materials, Si-Mat Silicon materials, Kaufering, Germany) were cut (1.5×1.5 cm2) and used as substrates for film deposition. Each wafer was treated with acetone, isopropanol, and deionized water (d-H2O) before using it, in order to remove impurities from the surface.
PLLA/PE structures were fabricated by spin coating (SPIN150, SPS Europe, Putten, the Netherlands) of PLLA (molecular weight [Mw] =101,000 g/mol, Sigma-Aldrich), HA sodium salt (Mw =120,000–350,000 g/mol, Sigma-Aldrich), and chitosan (Mw =190,000–310,000 g/mol, 75%–85% degree of deacetylation, Sigma-Aldrich). Poly(vinyl alcohol) (PVA, Mw =23,000 g/mol, 98% hydrolyzed, Sigma-Aldrich) was exploited as sacrificial layer to obtain free-standing films.
First, PVA (10 mg/mL) was spinned (4,000 rpm for 20 seconds) and baked (80°C for 2 minutes) to create a water-soluble layer (Figure 2A) allowing the subsequent detachment of the nanofilm from the SiO2 wafers in aqueous environment.53,54 Then, 300 μL of PLLA solution (10 and 20 mg/mL in chloroform) was deposited on the PVA layer (Figure 2B), spinned at different velocities (2,000, 3,000, 4,000, 5,000, and 6,000 rpm, respectively, for 40 seconds) and held on a hot plate to remove the excess of solvent (80°C for 1 minute). These substrates were treated with oxygen plasma (20 W for 2 minutes at 0.6 mbar) to increase the hydrophilicity of the polymer surface. Then, the PEs were deposited: 250 μL of chitosan (1 mg/mL, 1 % [v/v] acetic acid) and 250 μL of HA (1 mg/mL) were spin-coated alternatively using the same velocity and spinning time (2,500 rpm for 15 seconds). After each deposition, the sample was rinsed with 250 μL of d-H2O and spin-coated (2,500 rpm for 15 seconds) over the whole surface. This procedure was repeated for ten times, thus to obtain ten PE bilayers over the PLLA substrate (Figure 2C). Then, 10 μL of drug solution (DB103, 1 mg/mL in methanol with 5% [v/v] DMSO) was placed over the multilayer structure (Figure 2D), and left overnight to permit drug evaporation. DMSO was added to the drug solution, in order to improve the drug solubility in methanol. DMSO may induce possible cytotoxic effects, so a low amount was added.55,56 This solvent has a higher boiling temperature (~189°C) compared with methanol (~65°C), thus the addition of DMSO increased the time needed for solvent evaporation. To address this issue, before the deposition of the additional ten bilayers, we left the samples overnight, thus allowing the complete evaporation of the solvent from the drug solution before going on with the procedure. After drug loading, ten additional bilayers of chitosan/HA and at the end a further single layer of chitosan were finally spin-coated over the structure (Figure 2E), in order to confer a positive charge on the nanofilm surface that should interact with the endothelium (negative charged).
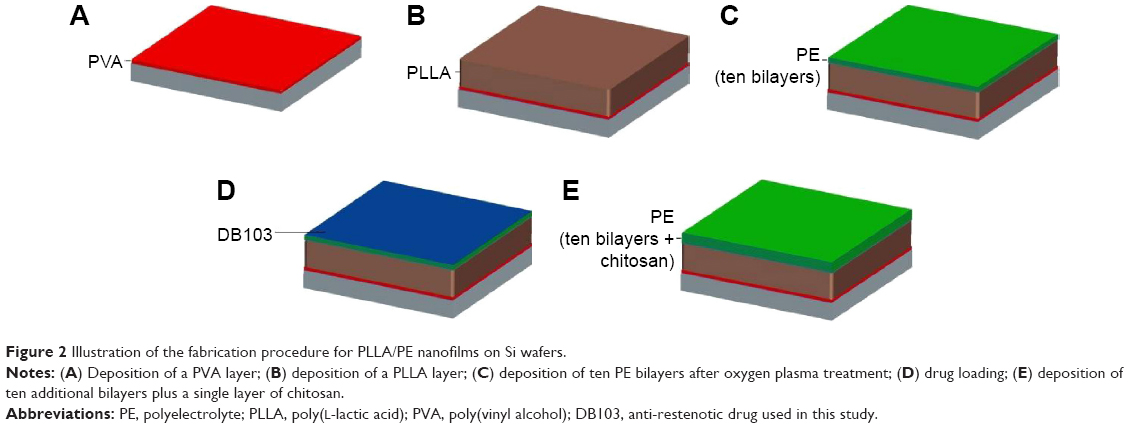 | Figure 2 Illustration of the fabrication procedure for PLLA/PE nanofilms on Si wafers. |
Barium titanate nanoparticles (BaTiO3, 99.9% barium titanate, 100 nm of nominal size, Nanostructured & Amorphous Materials Inc., Houston, TX, USA) were added in the PLLA layer at different concentrations (1, 2.5, 5, 7.5, and 10 mg/mL, respectively, within the PLLA solution) in order to obtain piezoelectric nanostructures (PLLA(BaTiO3)). The solutions were thereafter sonicated for 1.5 hours to favor the dispersion of nanoparticles, then spinned, and baked as explained earlier. Then, PLLA(BaTiO3)/PE structures were fabricated as described earlier for PLLA/PE samples. Also in this case, when the nanostructured films were immersed in water, the PVA layer was dissolved, thus releasing a freely suspended nanofilm. All the fabrication procedures for achieving the described nanofilms were conducted in a clean room (class 1,000), to avoid any contaminations.
Morphological characterization
For nanofilm thickness measurements, a cut with tweezers was made at the center of each SiO2-supported structure, in order to measure the height profile across the scratch. Measurements were performed by means of a surface profiler (KLA-Tencor, Milpitas, CA, USA). The evaluation of topography and roughness was achieved by atomic force microscopy (AFM, Veeco Innova Scanning Probe Microscope, Veeco Instruments Inc., Santa Barbara, CA, USA) scans, operating in tapping mode by setting 0.5 Hz scan frequency, and scanning areas of 10×10 μm2 and 1×1 μm2, respectively. A silicon probe with a nominal spring constant in the range of 25–75 N/m and a resonant frequency of 240–440 kHz was used. The measurements concerned the assessment of the average roughness (Ra), and the root-mean-square (RMS) on the images acquired. Ra is defined as the average height of the center line, whereas RMS represents the root-mean-square average of the roughness profile ordinates, and it permits to better discriminate differences among surfaces with comparable Ra values. Three images were acquired for each sample and three independent samples were analyzed for PLLA(BaTiO3) nanofilms at different concentrations and PLLA/PE and PLLA(BaTiO3)/PE nanostructured films. The scans obtained were elaborated by using a Gwyddion scanning probe microscopy analysis tool (http://gwyddion.net). Raw scan data were leveled to remove possible sample tilts. All these measures were performed in air at room temperature.
The drug layer deposited on PEs (depicted in Figure 2D) was imaged by means of scanning electron microscopy (SEM, EVO MA 10, Carl Zeiss, Oberkochen, Germany), whereas the dispersion of piezoelectric nanoparticles inside PLLA nanofilms was investigated with a dual beam microscope (FIB/SEM microscope, Helios (Hillsboro, OR, USA) NanoLab 600i, FEI, Hillsboro, OR, USA) and energy-dispersive X-ray spectroscopy (EDX). SEM scans were carried out by setting a beam voltage of 5 kV and a current of 43 pA, whereas for the dual beam microanalysis (energy dispersive X-ray analysis), a beam voltage of 15 kV, a current of 0.17 nA, and an acquisition time of 90 seconds were set.
BaTiO3 nanoparticles embedded in the PLLA matrix were also imaged by means of a multimodal microscope with an in-plane resolution of approximately 300 nm and a resolution of 1 μm along the optical axis. Sum-frequency-generated (SFG) photons at approximately 460 nm from the combination of laser pulses at 810 nm and 1,070 nm wavelengths were emitted from the nanoparticles owing to the non-centrosymmetric crystal structure of BaTiO3, allowing to locate the particles within the polymer matrix. The images were analyzed by means of ImageJ, a free software (National institutes of Health, Bethesda, MD, USA) available at http://rsbweb.nih.gov/ij/.
Contact angle measurements
Contact angle measures of both bare PLLA and composite PLLA(BaTiO3) nanolayers were performed, by using the sessile drop method in air,57 in order to quantify the hydrophilic state of PLLA and PLLA(BaTiO3) nanofilms for the following deposition of PE. A dedicated tensiometer (Theta Lite, Attension/Biolin Scientific, Espoo, Finland) was used to this purpose. Drops of 4 μL (d-H2O) were placed on the sample surfaces. Measurements started 5 seconds after the contact between the drop and the polymer surface. Contact angle data were acquired at different time-points (0, 2, 4, 6, 12, 18, and 24 hours, respectively). Five different points on the sample surface were analyzed, for each sample, and three independent samples were analyzed for each sample type.
Drug release experiments
As mentioned in the “Drug synthesis” section, the autofluorescence of DB103 was exploited to carry out drug release experiments. Before starting the experiments, drug loading was estimated by sonicating overnight both PLLA/PE and PLLA(BaTiO3)/PE samples in order to facilitate the complete drug release and, subsequently, by measuring the correspondent fluorescence signals. Four sample types were analyzed in terms of drug release kinetics, namely: PLLA/PE, PLLA(BaTiO3)/PE, PLLA/PE/PLLA, and PLLA(BaTiO3)/PE/PLLA(BaTiO3). Each sample was placed in a 24-well standard polystyrene plate and kept in 0.5 mL of PBS solution at 37°C. At each time-point, 150 μL of solution was removed from each well and replaced with 150 μL of fresh PBS. The collected samples were analyzed by using the microplate reader with 355 nm and 460 nm as excitation and emission wavelengths, respectively. The selected time-points were: 5, 15, 30 minutes, 1, 2, 3, 4, 5, 6, and 18 hours. The same experiment, involving the same sample types, was repeated by treating the samples with US stimulation (Bransonic sonicator 2510, Danbury, CT, USA), performed 10 minutes after the experiment start, and characterized by a power of 20 W, a frequency of 40 kHz and a stimulation period of 10 seconds.49
Each nanofilm was initially loaded with 10 μg of DB103. The total amount of the drug released in PBS overtime was calculated by converting the RFU in mass (μg) using the calibration curve, shown in Figure S1B. Blank measures (PBS only) were used as negative controls. Five independent samples were analyzed, for each sample type. The volume taken from each sample (150 μL) at each time-point was then measured in triplicate, within 96-well reading plates.
Cell cultures and in vitro assays
In vitro tests were performed on human SMCs (Lonza, Basel, Switzerland), which constituted the target of the anti-restenotic drug, and normal human dermal fibroblasts (nHDFs, Lonza), as controls. Such tests aimed at both assessing the efficacy of DB103, once released from PE in vitro, and at assessing the influence of substrate nanocues (due to the presence of BaTiO3 nanoparticles) on cell adhesion and proliferation.
Both cell types were expanded in proliferation medium, composed of 90% Dulbecco’s Modified Eagle’s Medium (EuroClone, Pero, Milan, Italy) supplemented with 10% fetal bovine serum (FBS, EuroClone), 100 IU/mL penicillin (EuroClone), 100 mg/mL streptomycin (EuroClone), and 2 mM L-glutamine (Sigma-Aldrich). During culture, the cells were maintained at 37°C in a saturated humidity atmosphere containing 95% air and 5% CO2. For in vitro experiments, SMCs and nHDFs (passage <6) were seeded on PLLA/PE and on PLLA(BaTiO3)/PE samples at a density of 2,500 cells/cm2, thus resembling the situation of Figure 1. The cultures were kept in proliferation medium. At the desired time-point (24, 48, and 72 hours, respectively), samples were analyzed in terms of DNA content, to quantify the cell proliferation rate. Before starting the experiment, we carefully rinsed the sample three times with PBS in order to remove dead cells from the samples, thus eliminating the contribution of dead cells’ DNA to the fluorescence measurements. The samples were removed from the original cell culture wells and placed in new wells, which were treated with 500 μL of d-H2O. Cell lysates were then obtained by two freeze/thaw cycles of the samples (overnight freezing at −20°C and 15 minutes thawing at 37°C in an ultrasonication bath) to enable the DNA to go into the aqueous media. The DNA content in the cell lysates was measured by using the PicoGreen kit (Invitrogen Co., Carlsbad, CA, USA). The PicoGreen dye binds to DNA, and the resulting fluorescence intensity is directly proportional to the DNA concentration. Standard solutions of DNA in d-H2O at concentrations from 0 to 6 μg/mL were prepared, and 50 μL of standard or sample was loaded for quantification in a 96-well black microplate. Working buffer and PicoGreen dye solution were prepared and added according to the manufacturer’s instructions (100 and 150 μL/well, respectively). After 10 minutes of incubation in the dark at room temperature, fluorescence intensity was measured on the microplate reader, using an excitation wavelength of 485 nm and an emission wavelength of 535 nm. For DNA quantification, three independent samples were analyzed for each sample type, for each time-point, and the volume analyzed for each sample was read in triplicate in the microplate.
At the 72 hours time-point, cells on the different samples were also fixed and stained for fluorescence imaging. Briefly, at the end point, culture medium was removed, cells were rinsed with PBS and incubated with 4% paraformaldehyde in H2O for 15 minutes. Standard procedures were then followed for staining. Oregon Green 488 phalloidin (Invitrogen) was used to stain F-actin, and 1 μM DAPI was used to stain cell nuclei. Fluorescence images were acquired by means of an inverted microscope (Eclipse Ti, FITC-TRITC filters, Nikon Corporation, Tokyo, Japan) equipped with a CCD camera (DS-5MC USB2, Nikon Corporation) and with NIS Elements imaging software (DS-5MC USB2, Nikon Corporation). The cell shape index (CSI) was calculated for nHDFs and SMCs by elaborating fluorescence images using ImageJ. The index was calculated as:
|
|

where A and p are the area and the perimeter of the cells, respectively. The CSI gives an indication of the cell shape. It ranges from 0 to 1 and constitutes a useful parameter to evaluate cell behavior on nanostructured substrates.58 All procedures followed the tenets of the Declaration of Helsinki. The study was analyzed by the local ethics committee of Scuola Superiore Sant’Anna that judged it exempt from review since the human cell lines used are commercially available and they do not raise any ethical issue.
Piezoelectric properties of nanostructured films
The piezoelectric characteristics of PLLA/PE and PLLA(BaTiO3)/PE nanostructured films were investigated by means of piezoresponse force microscopy (PFM) technique, employing a Bruker (Nano Inc., Santa Barbara, CA, USA) ICON AFM system, by setting a 0.3 Hz scan frequency and scanning areas of 5×5 μm2. A silicon probe with a Pt-Ir coating (SCM-PIT) and a measured spring constant of 1.72 N/m, resonant frequency of 68.2 kHz, and deflection sensitivity of 108 nm/V was used. The measurements concerned the acquisition of amplitude and phase of the piezoelectric signal together with the topographic images. The substrate piezoresponse was analyzed in the vertical direction via lock-in detection with the application of an alternating current (AC) voltage of 10 V at 30 kHz frequency applied to the tip. A preliminary calibration was performed by using a periodically poled lithium niobate (PPLN) as a test sample for PFM. Three specimens were analyzed for each sample type, and each sample was analyzed in five different points, and the average value of piezoresponse amplitude (d33 piezoelectric coefficient) was computed.
Thermographic imaging
Thermal imaging was performed to analyze possible temperature variations occurring on PLLA/PE and PLLA(BaTiO3)/PE samples after the 10 seconds US stimulation used during drug release experiments. Measurements were performed with an A325sc thermal camera (FLIR Systems, Wilsonville, OR, USA) with a close-up lens (T197415, FLIR Systems). The thermal camera was positioned over the samples to record thermal fluctuations in real-time and in a noninvasive way. Each sample was placed in a 24-well standard polystyrene plate and kept in 0.5 mL of PBS solution. Three independent samples were analyzed, for each sample type, compared with a white control (PBS only).
Statistical analyses
All results were presented as mean values ± standard error of the mean. Data about DNA content were subjected to analysis of variance in order to identify statistically significant differences among the experimental groups. A Student’s t-test was performed for comparison between two groups, whereas Holm–Sidak tests were performed for comparisons among several groups. Significance was set at 5%.
Results and discussion
Morphological and surface characterization of PLLA nanofilms
PLLA is a semicrystalline and biodegradable polymer, approved by Food and Drug Administration. It is widely used for medical applications in vivo, due to its excellent biocompatibility. This polymer is considered suitable for endovascular applications,59 and has been widely used for the fabrication of endovascular scaffolds and stents.60
Bare PLLA nanofilms were first characterized by analyzing their thickness in correspondence to different spin-coating speeds (Figure 3). The obtained thicknesses are in good agreement with previous literature reports.53 As expected, the thickness was greater (ranging from ~200 to ~300 nm) for samples characterized by a concentration of 20 mg/mL, whereas 10 mg/mL PLLA nanofilms were permitted to obtain membranes with a thickness slightly less than 100 nm. Our interest focused on ~250 nm thick membranes (20 mg/mL PLLA, spinned at 4,000 rpm). Such nanofilms constituted a good compromise, showing a relatively small thickness (thus maximizing the surface adhesive forces between the nanostructured film and the vessel wall, crucial in a future clinical application), allowing at the same time to efficiently embed BaTiO3 nanoparticles (which have a nominal diameter of 100 nm) within the PLLA matrix. Subsequently, different concentrations of BaTiO3 nanoparticles were considered and embedded in 20 mg/mL PLLA nanofilms.
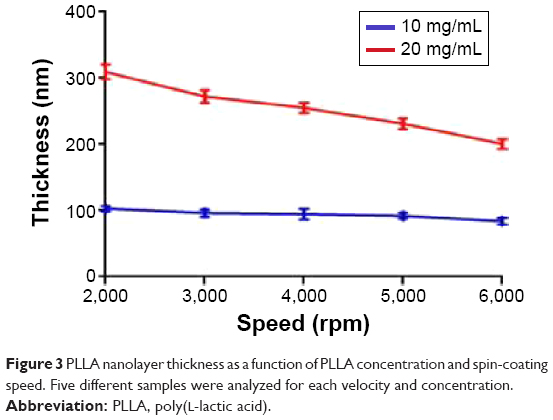 | Figure 3 PLLA nanolayer thickness as a function of PLLA concentration and spin-coating speed. Five different samples were analyzed for each velocity and concentration. |
AFM analyses allowed to evaluate surface morphology and roughness of the nanocomposites, as reported in Figure 4 and Table 1.
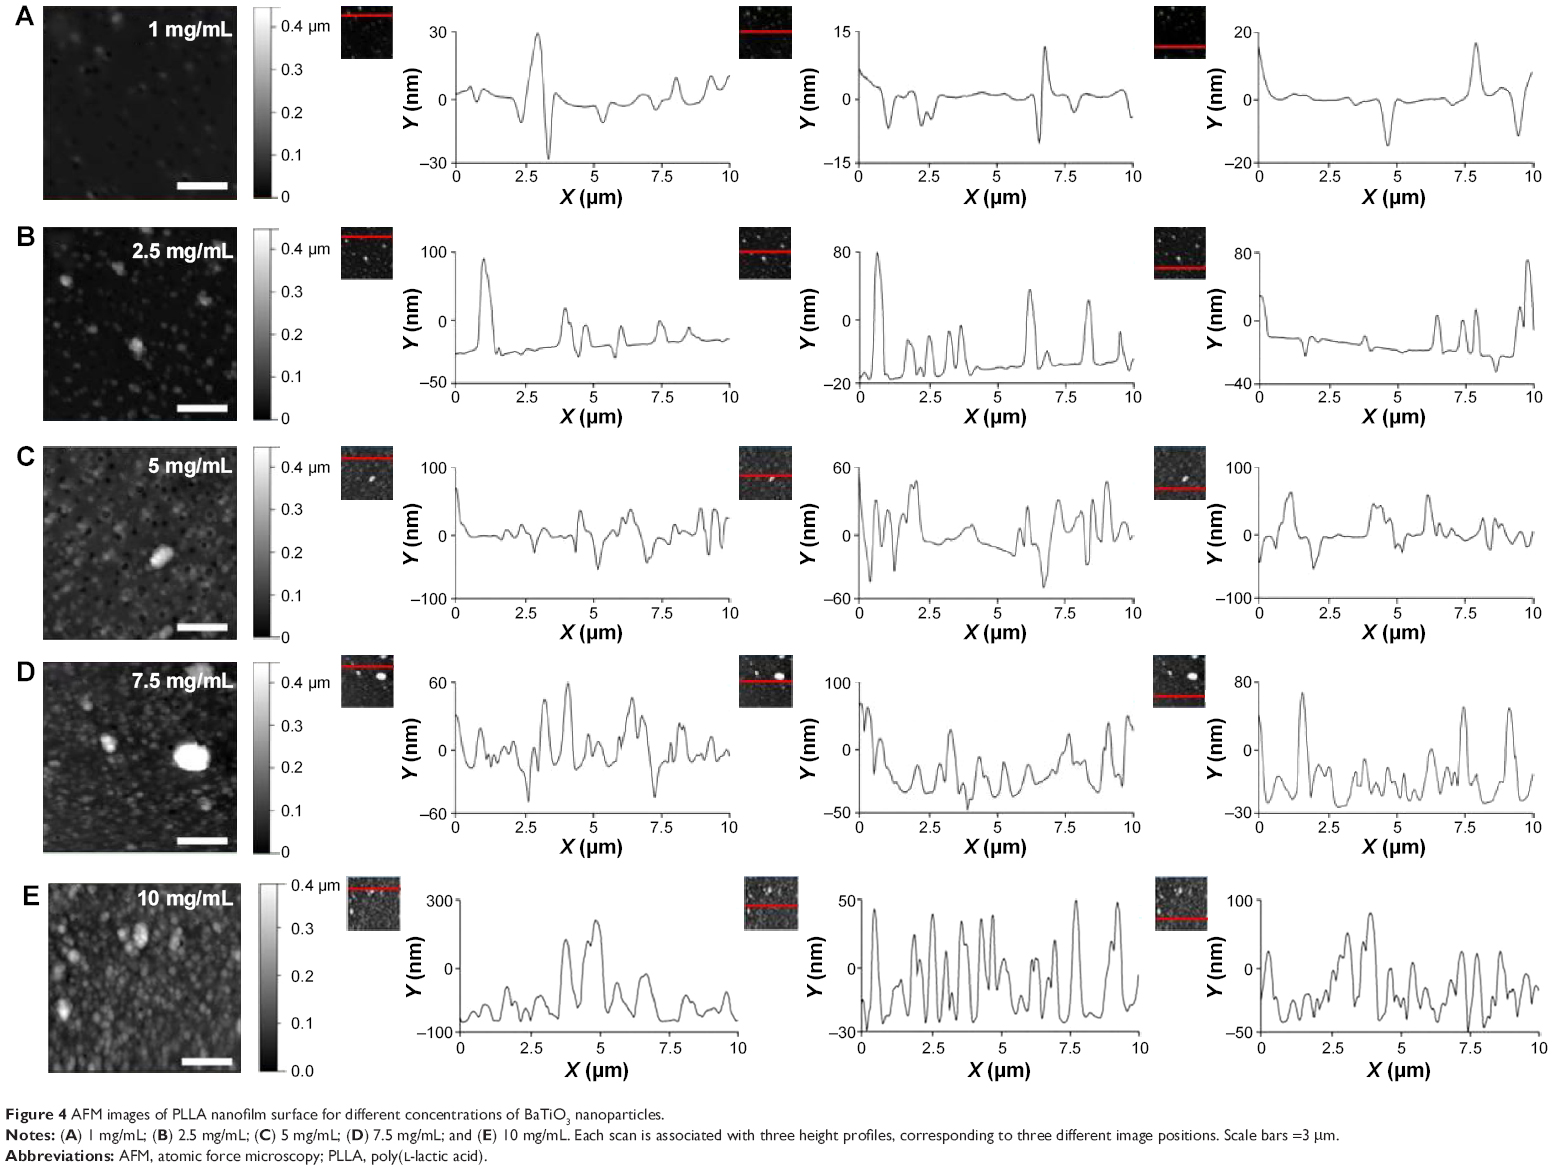 | Figure 4 AFM images of PLLA nanofilm surface for different concentrations of BaTiO3 nanoparticles. |
 | Table 1 Ra, RMS, and thickness values for different BaTiO3 nanoparticle concentrations within 20 mg/mL PLLA matrices |
Higher values of Ra and RMS were observed in correspondence to higher contents of BaTiO3 nanoparticles. Nanofilm surface and AFM profiles were, indeed, more irregular when high nanoparticle concentrations were used. At the same time, a slight thicknesses increase was correlated with nanoparticle concentration: probably, a large presence of nanoparticles inside the PLLA matrix influenced the polymer distribution, as higher BaTiO3 nanoparticle contents corresponded to higher thicknesses. In addition, high nanoparticle concentrations caused the formation of larger aggregates, with the presence of local height peaks that could reach 300–400 nm (Figure 4E).
Dual beam images and EDX microanalysis (Figure 5A) show a homogenous distribution of BaTiO3 nanoparticles inside the PLLA matrix and an increasing content of both Ba and Ti, as a consequence of a higher nanoparticle concentration. We chose 5 mg/mL as the optimal nanoparticle concentration for our purposes. In fact, this represents a compromise between a reasonable roughness and a relatively high content of nanoparticles. Higher concentrations of BaTiO3 nanoparticles, besides increasing the overall nanofilm thickness, caused the formation of aggregates and local height peaks, which could hamper the nanofilm adhesion to the vessel wall, in targeted configuration of Figure 1.
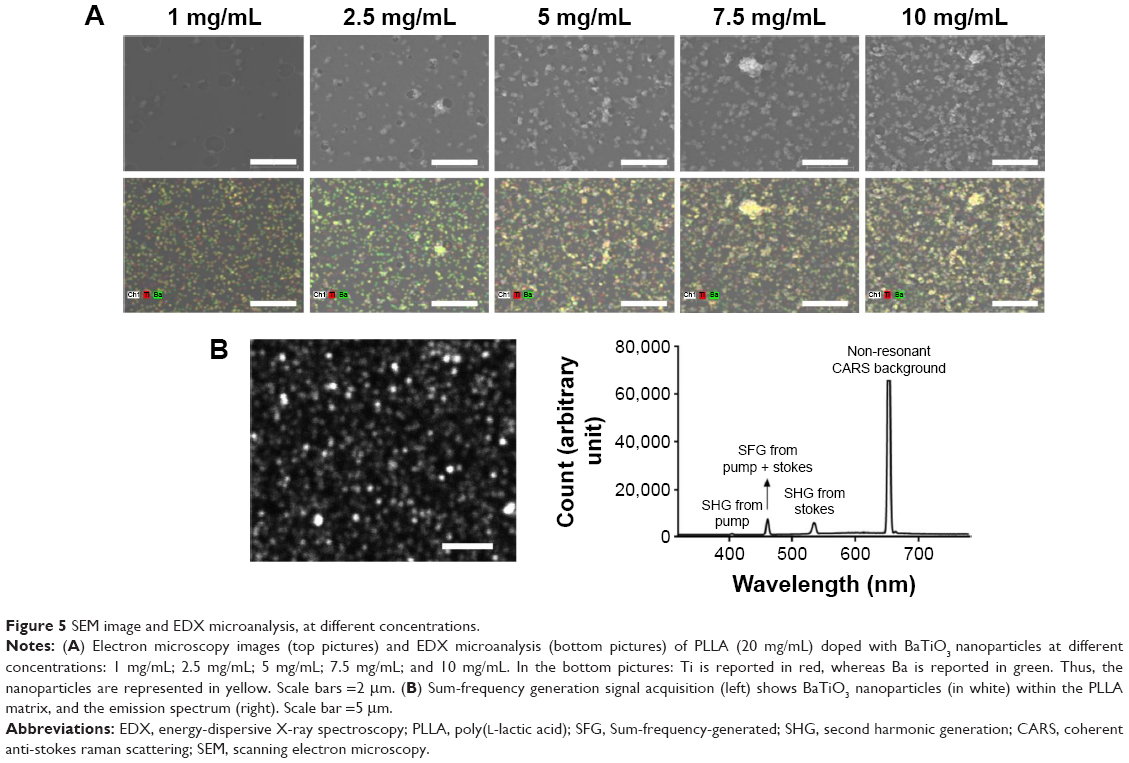 | Figure 5 SEM image and EDX microanalysis, at different concentrations. |
Figure 5B shows the results of nonlinear microscopy characterization. The image highlights the homogenous nanoparticle dispersion within the PLLA matrix. Four peaks were observable in the emission spectrum when the BaTiO3 nanoparticles embedded in the PLLA matrix were irradiated with overlapping pulsed (~1 ps duration, 80 MHz repetition rate) excitation beams at 810 nm and the 1,070 nm, namely: the second harmonic generation (SHG) derived from the 810 nm beam, the SFG derived from the combination of the two beams, the SHG derived from the 1,070 nm beam, and the four-wave-mixing nonresonant signal. In particular, the SFG and SHG signals were generated owing to the non-centrosymmetric structure of BaTiO3 nanoparticles.
We treated the nanofilms with oxygen plasma to facilitate the deposition of PEs on PLLA. In fact, PLLA is per se highly hydrophobic. Plasma treatment allowed to graft functional groups over the polymer surface, thus increasing the hydrophilic behavior.61,62 After the treatment, we observed that plasma also induced an etching effect, thus reducing the polymer thickness from 255.34±7.87 nm to 187.45±10.46 nm for 20 mg/mL PLLA samples, and from 287.42±7.75 nm to 196.25±8.42 nm for 20 mg/mL PLLA +5 mg/mL BaTiO3 samples.
Initially, without plasma treatment, the contact angle value for PLLA and PLLA(BaTiO3) samples was 86.41°±0.41° and 78.66°±3.46°, respectively. Then we observed that the wettability immediately increased after plasma treatments, but it slightly decreased overtime (Figure S2A). The average contact angle values after plasma application varied from 36.95° to 55.88° in 24 hours, for PLLA substrates. Thus, the wettability remained higher, in comparison with nontreated PLLA samples, even after several hours, although a progressive reorientation of polar groups caused a progressive contact angle increase (Figure S2B). In the case of PLLA(BaTiO3) samples, similar results were obtained, with average contact angle values varying from 43.15° to 62.73° in 24 hours. The higher contact angle values for PLLA(BaTiO3) samples in comparison with PLLA ones are probably due to the relatively high hydrophobicity of BaTiO3 nanoparticles. In addition, nanoscale roughness has been shown to have a significant influence on surface wettability.63
Polyelectrolyte and drug deposition
HA and chitosan were deposited over PLLA and PLLA(BaTiO3) substrates by means of spin coating. HA is a biodegradable and non-thrombogenic polysaccharide, and it is also known to inhibit vascular cell proliferation during neointima formation. It has been extensively used as stent coating material and to develop matrices for local drug delivery.64,65 Chitosan is a polysaccharide that can be found in crustacean shells. It is normally used to fabricate hydrogels, films, sponges, or fibers.66 It shows intrinsic haemostatic properties.67 PEs deposited on PLLA and PLLA(BaTiO3) films showed a linear thickness growth as a function of the number of deposited chitosan/HA bilayers (Figure 6A). The adhesion of the first chitosan layer was promoted by electrostatic interactions between the functional groups generated on PLLA surface after plasma treatment and the chitosan amine groups. Then, thanks to a diffusion-based buildup mechanism process,68 the PE nanofilms were obtained as a stratified structure, in which each PE layer interpenetrated its neighboring ones.
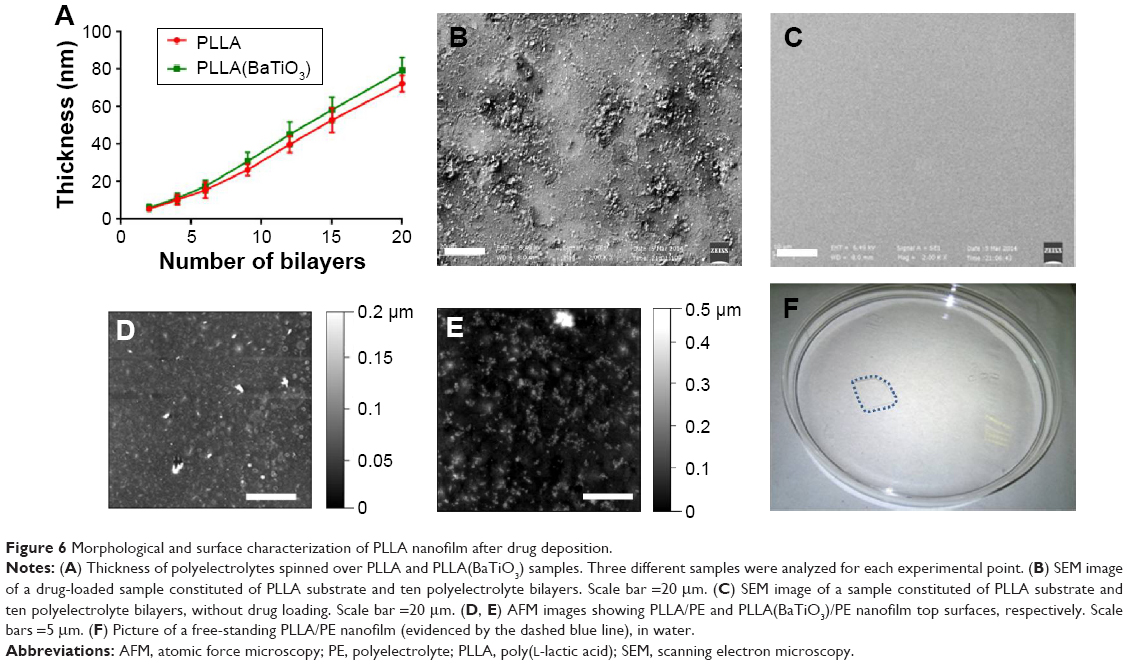 | Figure 6 Morphological and surface characterization of PLLA nanofilm after drug deposition. |
DB103 was loaded through deposition and solvent evaporation on the PE surface, over a structure composed of the first ten PE bilayers over the polymeric nanofilm. SEM images clearly show the presence of the drug deposited on the nanofilm surface after this process (Figure 6B). As a negative control, Figure 6C shows the nanofilm surface provided with the ten PE bilayers without drug loading.
The nanofilm structure was then completed by spinning ten additional PE bilayers on top of the drug, adding at the end another layer made of chitosan, in order to assure the presence of positive charges on the nanofilm surface. Chitosan is a natural cationic polysaccharide successfully used for the fabrication of multilayer structures. Chitosan is positively charged, as reported in the literature.69
Figure 6D and E shows AFM surface scans of complete nanofilms, PLLA- and PLLA(BaTiO3)-based ones, respectively. Ra and RMS values were obtained from AFM images of PLLA/PE and PLLA(BaTiO3)/PE nanofilms after each step of the fabrication procedure (spin coating of PLLA or PLLA(BaTiO3), plasma treatment, deposition of the first ten bilayers, drug loading, and deposition of the last ten bilayers plus an additional chitosan layer). The results of a quantitative analysis performed on these samples are reported in Table 2.
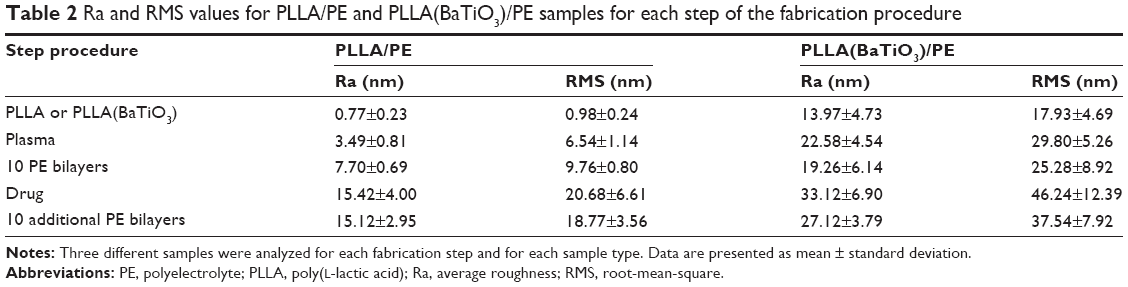 | Table 2 Ra and RMS values for PLLA/PE and PLLA(BaTiO3)/PE samples for each step of the fabrication procedure |
Surface roughness resulted rather different between PLLA/PE and PLLA(BaTiO3)/PE nanofilms, for all the fabrication steps, because the presence of nanoparticles strongly influenced surface features. Plasma treatment, causing surface erosion, induced an increase of Ra and in particular RMS values for both sample types, but this effect was more marked in the case of PLLA(BaTiO3)/PE samples. Drug loading involved further superficial alterations that did not compromise the stability of the structure as it can be observed in AFM scans (Figure 6D and E). The drug was not molecularly incorporated over the PE layer, but crystal-dispersed, with a maximum crystal diameter smaller than 5 μm in terms of width. The actual drug loading, assessed by measuring fluorescence signals obtained after overnight sample sonication, was 35.94%±5.96% and 39.17%±4.12% respect to the initial drug volume used (10 μL), respectively, for PLLA/PE and PLLA(BaTiO3)/PE nanofilms. The deposition of the last ten PE bilayers decreased the Ra, inducing a progressive flattening, especially concerning PLLA(BaTiO3)/PE nanostructures. Figure 6F shows a complete free-standing nanostructured film.
Drug release experiments
In drug release experiments, four different types of sample were tested, as represented in Figure 7A. Drug release kinetics in PBS environment was analyzed: results are shown in Figure 7B. A similar initial trend for PLLA/PE and PLLA(BaTiO3)/PE samples could be observed. Then, after 2 hours, the profiles started to diverge significantly, as better evidenced in the inset (Figure 7C). PLLA/PE nanofilms were capable to release a greater amount of drug respect to PLLA(BaTiO3)/PE samples. After 18 hours, the average total drug quantity released was 2.41 μg for the PLLA/PE nanofilms and 1.98 μg for the PLLA(BaTiO3)/PE nanofilms. These values do not match 10 μg, which represents the initial overall drug load for each nanofilm. However, they constitute relatively high values, considering that part of the drug is lost during the spin-coating process (the procedure removed aggregates that did not interact with the polymer surface). In addition, the greater PE thickness in PLLA(BaTiO3)/PE samples and their greater roughness may influence the diffusion mechanism by increasing the diffusion time, thus slowing down the drug delivery in PBS.
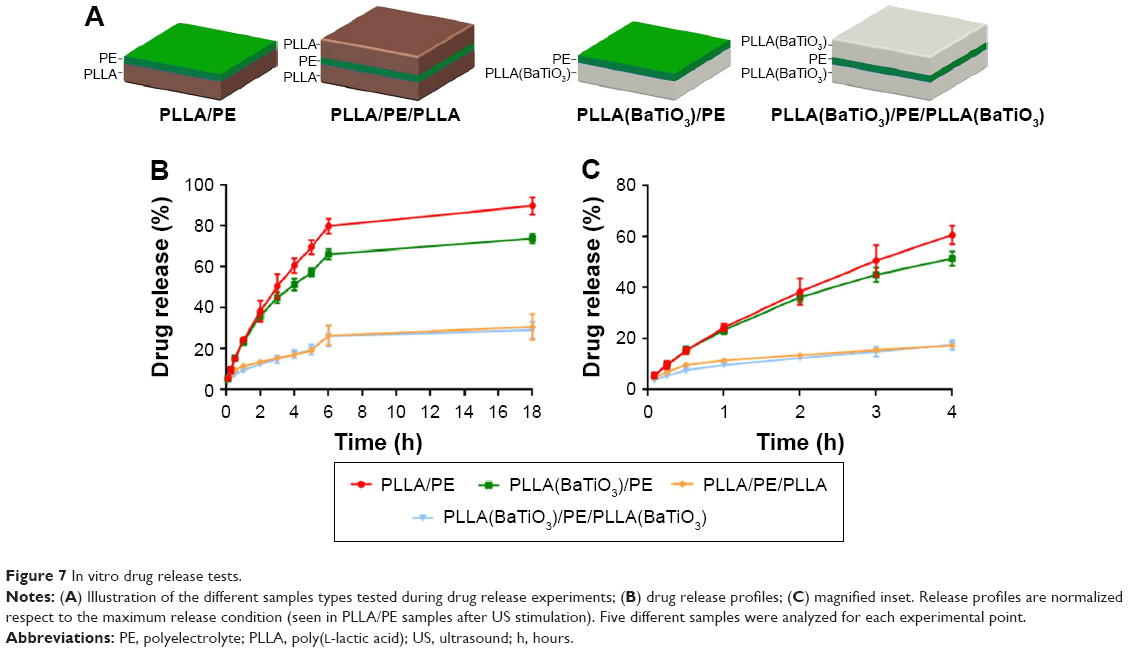 | Figure 7 In vitro drug release tests. |
We can affirm that the PLLA layer acted not only as support, but also as barrier, thus allowing an almost unidirectional drug diffusion. Such barrier effect was clearly visible both for PLLA/PE/PLLA and PLLA(BaTiO3)/PE/ PLLA(BaTiO3) samples. Part of the drug was released from such samples during the first hours, probably due to diffusion from the lateral nanofilm edges. Overall, the release was strongly limited. The barrier effect is of primary importance for future clinical applications. Indeed, it can be exploited to release the drug in a unidirectional way toward the vessel wall, thus enhancing the therapy efficacy.
In vitro tests
Both SMC and nHDF behavior over PLLA/PE and PLLA(BaTiO3)/PE samples was assessed to evaluate the efficacy of DB103, once released from PE nanofilms in vitro, and the influence of substrate nanocues (due to the presence of BaTiO3 nanoparticles) on cell adhesion and proliferation. Fluorescence images acquired 72 hours after cell seeding (Figure 8A–D) qualitatively show that approximately the same number of nHDFs can be observed on the two sample types with DB103 (Figure 8A and B). Differently, a reduced number of SMCs can be observed on PLLA/PE samples, in comparison with PLLA(BaTiO3)/PE ones, at the mentioned time-point (Figure 8C and D).
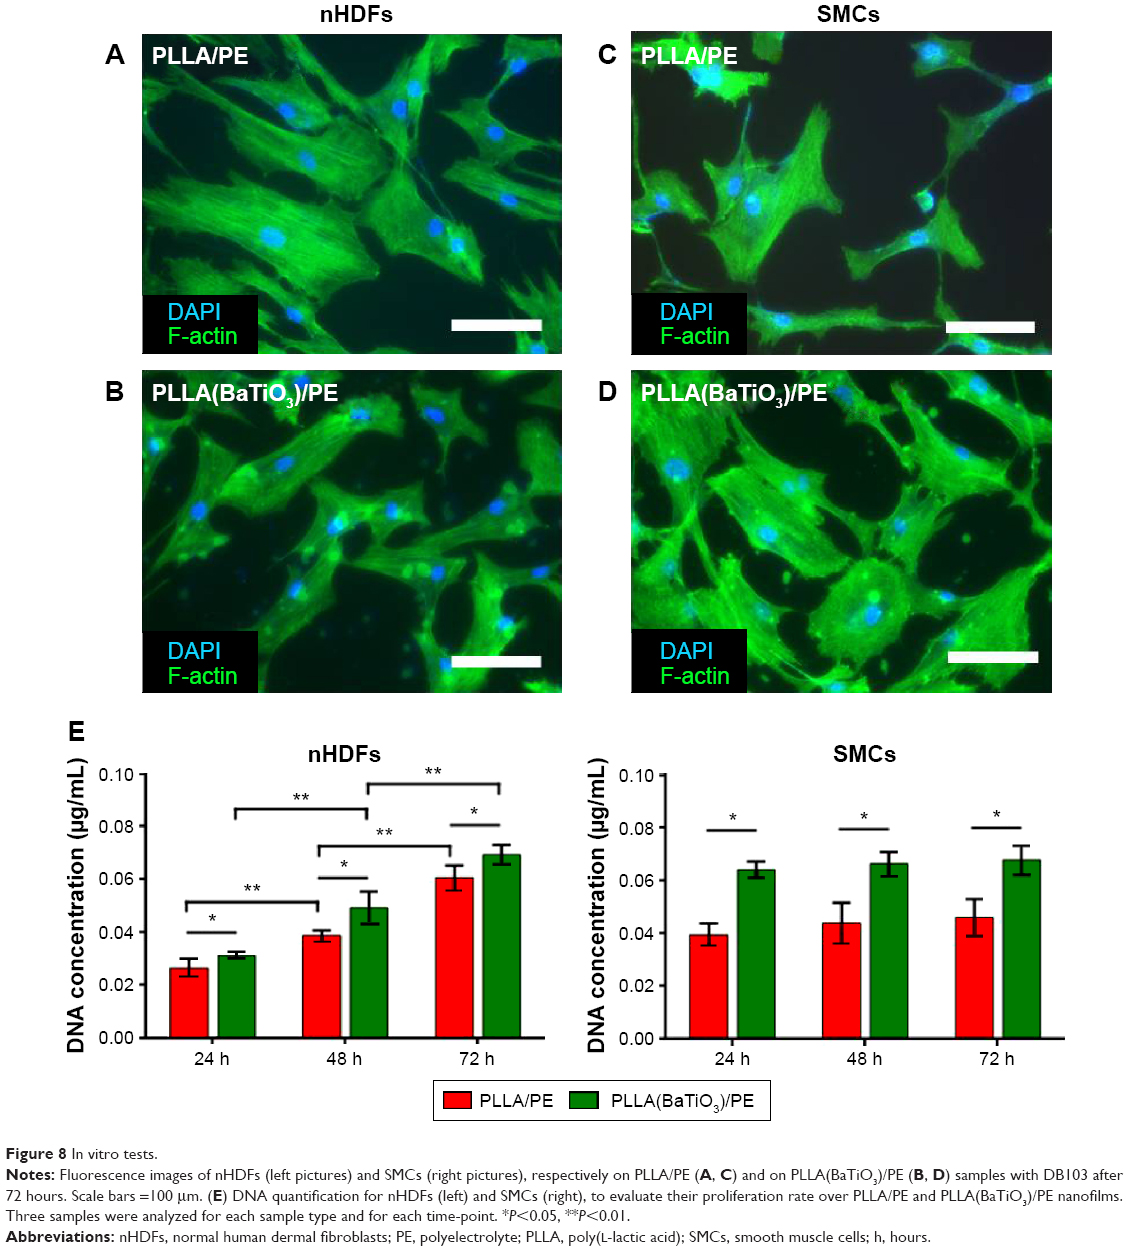 | Figure 8 In vitro tests. |
Quantitative data were obtained by means of DNA content analyses (Figure 8E). DNA content represents a direct indication of the number of cells grown on the nanofilms. Results show that SMC proliferation was blocked on both PLLA/PE and PLLA(BaTiO3)/PE samples, thus demonstrating the efficacy of DB103, released from the nanofilms. The overall number of SMCs was higher on PLLA(BaTiO3)/PE samples in comparison with PLLA/PE ones. DNA quantification for nHDFs showed that DB103 released from the nanofilms did not hamper fibroblast proliferation: the nHDF number significantly increased overtime, on both sample types. Similar to SMCs, also nHDFs showed a higher cell number on PLLA(BaTiO3)/PE samples in comparison with PLLA/PE ones. In comparison, white controls without DB103 demonstrated a constant increase of the DNA content both for SMCs and nHDFs on PLLA/PE and PLLA(BaTiO3)/PE samples (Figure S3), because their proliferation rate was not altered.51
As known, several factors influence cell behavior on PE nanofilms. In particular, surface charge, mechanical properties, and hydrophobicity play a key role.70–72 The PE interface composed by HA and chitosan, due to their high aspect ratio, is essentially a two-dimensional structure, so its surface composition has a high impact on the interaction with cells. Surface roughness is also an important parameter that affects cells behavior, in particular adhesion and proliferation. At the nanoscale, in fact, subcellular structures such as cytoskeleton components, transmembrane proteins, and filopodia are influenced by the polymer surface and, in particular, by nanoscale elements that are often used to tune substrate surface roughness and, consequently, cell response.73
Table 3 shows CSI values calculated for the two cell types, on the different samples. CSI represents a parameter to study cell functions. CSI values were smaller for nHDFs cultured on PLLA(BaTiO3)/PE nanofilms respect to those cultured on a smoother surface. Differently, for SMCs, CSI values were smaller for smoother surfaces, corresponding to PLLA/PE nanofilms.
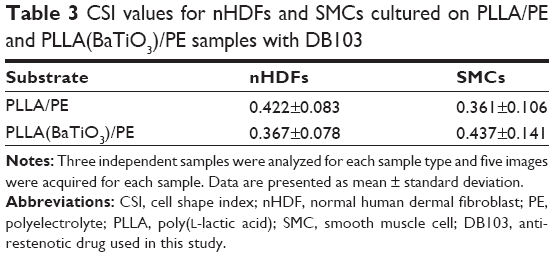 | Table 3 CSI values for nHDFs and SMCs cultured on PLLA/PE and PLLA(BaTiO3)/PE samples with DB103 |
The results of Figure 8 and Table 3 agree with literature data: a higher cell density is, indeed, associated with a higher surface roughness.74 Fibroblasts normally have an oblong or triangular shape, while on rougher surfaces, they assume a spindle-shaped morphology.75,76 Even if there is a correlation between SMCs’ shape and their function,77 our primary objective was to inhibit their proliferation, ie, the cause of restenosis. Anyhow, SMCs were characterized by an opposite behavior in comparison with nHDFs, with larger CSI values on rougher surfaces, which agrees with the results obtained in previous studies.78
Drug release modulation by ultrasound
As an additional intriguing feature, we observed that it was possible to modulate drug release kinetics by means of US stimulation (Figure 9). We tested the same samples showed in Figure 7A, by introducing a US trigger at a specific time-point (10 minutes).
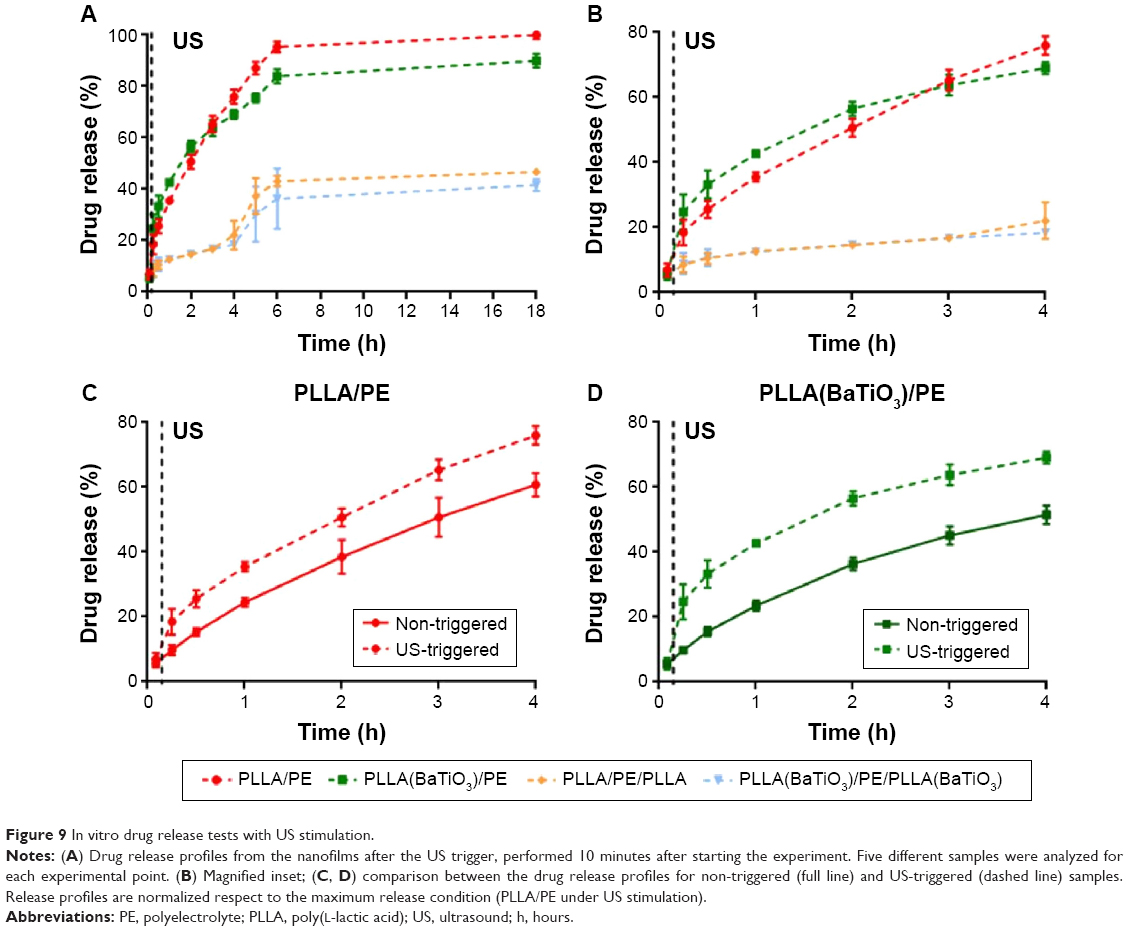 | Figure 9 In vitro drug release tests with US stimulation. |
US stimulation enhanced drug release: after 18 hours, 2.67 μg and 2.40 μg were released from PLLA/PE and PLLA(BaTiO3)/PE nanofilms, respectively (Figure 9A).
An interesting feature was constituted by the burst effect due to the US stimulation at 10 minutes, clearly visible in Figure 9B. As a consequence of such burst, the release from PLLA(BaTiO3)/PE nanofilms was significantly higher compared with the release from PLLA/PE ones. The barrier effect efficacy was also demonstrated in the case of US stimulation. Drug release profiles of PLLA/PE and PLLA(BaTiO3)/PE samples were compared, evaluating the differences between non-triggered and US-triggered ones (Figure 9C and D). It is clear that a significantly higher amount of drug was released from both sample types, after US stimulation.
In addition, as it can be observed in Figures 7B and 9A, the drug release saturation level at 18 hours for the PLLA(BaTiO3)/PE samples is lower when compared with the case without nanoparticles. The presence of barium titanate nanoparticles as second-phase reinforcement for the PLLA matrix may indeed directly affect the drug release kinetics, by interacting with the embedded drug. In fact, due to their small sizes, nanoparticles possess distinctive physicochemical properties that confer them high surface reactivity. Thus, exposed nanoparticles outside the PLLA nanofilm could absorb part of the drug, thus slightly limiting its release toward the external environment over time.
Different phenomena can influence the drug release kinetics with and without US stimulation. The shape of each profile suggests a potential erosion of the PE layer overtime. In particular, inflections points in Figure 9 also suggest a potential PLLA delamination/disruption and PE dissolution.
The partial erosion of PLLA nanofilms in a biological environment may induce the release of BaTiO3 nanoparticles entrapped inside the PLLA matrix. Once in the blood stream, nanoparticles can be transported around the body and be taken up by organs and tissues, interfering with biological processes. Bulk BaTiO3 has been demonstrated to be biocompatible, showing the absence of inflammatory or foreign body reactions, once implanted in vivo.79 However, at the nanoscale size, its properties substantially differ from those possessed by the bulk material. Thus, its potential toxic effects in the human body, at such scales, remain a concern, although recent studies demonstrated the biocompatibility of BaTiO3 nanoparticles in vitro, with different cell lines.80,81 Inorganic nanoparticles such as BaTiO3 ones degrade slowly. This implies a long-term accumulation of these nanoparticles that are not excreted via urine, especially inside the liver and the spleen.82 In our case, we assume that the nanoparticle release from the nanostructured platform will be limited, because the in vivo degradation estimated for PLLA thin films is very low after few days to weeks.83 The main scope of this study is the design of a nanovascular patch to be used in the context of a temporary therapy, designing an ad hoc system that permits to position it in the targeted area and to remove it after the treatment, thus overcoming possible toxicity issues associated with a systemic delivery of BaTiO3 nanoparticles.
We decided to analyze more in-depth possible mechanisms responsible for this effect. Mechanical deformations of PEs, induced by both US mechanical waves per se, and US interactions with barium titanate nanoparticles may generate openings and localized electrical effects, thus facilitating drug release. Anyhow, it is clear that the combination of US stimulation and the presence of piezoelectric elements enhanced drug release kinetics. Figure 10A and B shows topography (left), amplitude (middle), and phase (right) images of PLLA/PE and PLLA(BaTiO3)/PE samples that underwent PFM characterization (Figure S4). The amplitude of the detected piezoelectric signals is related to the material’s piezoelectric coefficient. Nanoparticles were able to locally interact with the PFM tip provided with 10 V of voltage, as visible from the amplitude graphs (up to 15 mV of signal). Such amplitude signal was significantly different from the background, detected on the PLLA/PE samples, and its results correlated to the presence of some specific nanoparticles in the topographic signal (Figure S5). The local effective piezoelectric coefficient d33 reached the value of 10.19±0.75 pm/V in the case of PLLA(BaTiO3)/PE samples, whereas 1.18±0.11 pm/V was detected in the case of PLLA/PE samples. The piezoresponse contrast resulted quite homogenous inside the PLLA(BaTiO3)/PE matrix, whereas it is almost absent in PLLA/PE matrix. Instead, the phase reflected the polarization direction of the domains, observable in the presence of nanoparticles. More details on PFM characterization are reported in the “Supplementary materials”. PFM analysis confirmed that PLLA nanostructures provided with BaTiO3 nanoparticles possessed piezoelectric properties. Thus, their presence increased the PLLA(BaTiO3)/PE nanofilm piezoresponse during US stimulation, generating local potentials that may enhance PE disruption or poration.
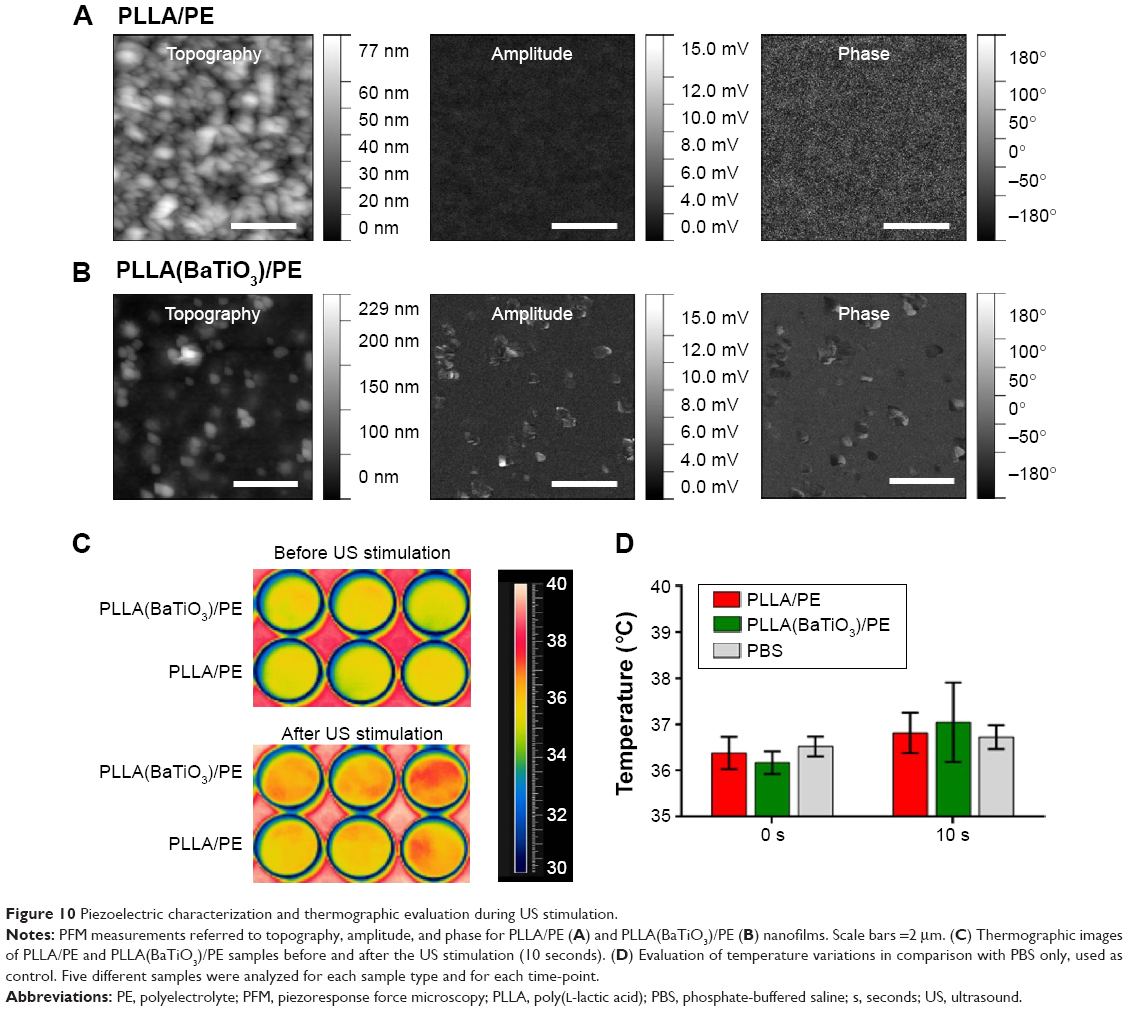 | Figure 10 Piezoelectric characterization and thermographic evaluation during US stimulation. |
A recent study has shown that US can trigger drug release from carriers by exploiting different effects. Mechanical effects include cavitation, acoustic streaming, and simple pressure variations.84 In addition, as mentioned, piezoelectric nanomaterials have shown the ability to generate electrical stimuli when hit by US waves. This property has been used to enable intriguing intracellular applications,47–50 but it has been never exploited to modulate drug release kinetics from a nanostructured film.
Local heating, induced by the US stimulation, can also affect the diffusion rate, increasing the drug delivery rate.85 In fact, US energy is dissipated to thermal energy as the acoustic waves propagate and generate friction. To explore this effect, we investigated at a macroscopic scale the temperature variations during US stimulation of PLLA/PE and PLLA(BaTiO3)/PE samples, by using a thermal camera. Results showed a nonsignificant increase of temperature, after 10 seconds US stimulation, in comparison with the initial condition at 0 second, for PLLA(BaTiO3)/PE, PLLA/PE, and PBS control samples. These results suggest that thermal effects did not play a significant role in the enhancement of the drug diffusion rate from the stimulated samples, thus confirming that the main mechanisms involved are the mechanical and electrical ones.
Drug release kinetics modeling
Data from drug release experiments were fitted by exploiting the Korsmeyer–Peppas semiempirical model equation to evaluate the drug release mechanism that characterizes the nanovascular patch in its different experimental configurations (PLLA/PE and PLLA(BaTiO3)/PE samples, without and with US stimulation):
|
|

where M(t)/M∞ is the released fraction of drug at the time-point t (M(t)/M∞ <0.6), whereas k and n are fitting parameters, representing, respectively, the release rate constant and the release exponent.86 For the thin films case (aspect ratio >10), n-values <0.5 suggest a diffusion-controlled drug release, whereas n-values between 0.5 and 1 suggest a superposition of diffusion and anomalous transport. Finally, when n=1 a swelling-controlled behavior is observed.87 Data obtained from our in vitro release studies were properly fitted by means of MATLAB (The Mathworks Inc, Natick, MA, USA) (Figure S6).
Results are summarized in Table 4.
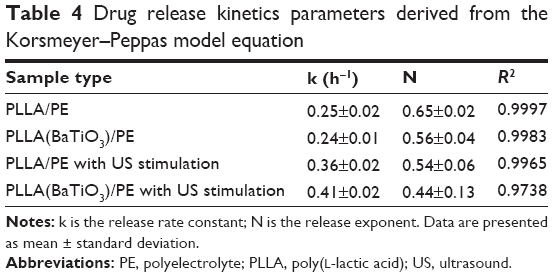 | Table 4 Drug release kinetics parameters derived from the Korsmeyer–Peppas model equation |
The kinetics, represented by the coefficient k, considerably increased with the support of US stimulation, especially in the presence of piezoelectric nanoparticles, thus demonstrating the great relevance of the US influence in the drug release process.
For the PLLA/PE case, the value n=0.65 suggests that the release mechanism is not purely diffusion-controlled, but more than one phenomenon may be involved, such as diffusion and swelling. PE swelling enable drug diffusion, because the water penetrates inside the polymeric matrix.88 In particular, HA possesses viscoelastic properties in aqueous solution that confer a more evident swelling behavior to the PE matrix and a polymer chain relaxation behavior.89 A similar trend was observed for PLLA(BaTiO3)/PE samples, even if the presence of nanoparticles slightly limited the swelling contribution.
The drug release mechanism from PEs-based matrices by US stimulation is more complex and not completely understood.90 The US stimulation cases showed smaller n-values with larger standard deviation values. Probably, the mechanical action of US stimulation can partially erode the PEs layer, thus causing a lower swelling effect due to the presence of a thinner PEs layer, thus favoring a diffusion-controlled behavior. At the same time, US stimulation may trigger a shaking effect on PLLA/PE and PLLA(BaTiO3)/PE, thus promoting the drug release toward the external environment.
Conclusion
We demonstrated the possibility to design and develop free-standing nanofilms made of a layer of poly(lactic acid), possibly provided with barium titanate nanoparticles and PE loaded with an anti-restenotic drug. These platforms were able to release an anti-restenotic drug in PBS. In addition, a US trigger was used to significantly influence the drug release kinetics. This was the first time that the interaction between US and piezoelectric nanoparticles was exploited to modulate drug release kinetics from a nanostructured film. We also demonstrated that the main mechanisms involved are mechanical and electrical ones, whereas thermal effects seem not to play a significant role. Vascular patches represent a great challenge and may allow to locally treat intravascular pathologies, such as restenosis, in a smart and efficient way. Future studies will be focused on the optimization of the US stimulation setup (thus allowing to control and optimize the US dose to trigger the desired effects) and on ex vivo and in vivo experiments, to test the safety and stability of the patches within vessels. In vivo translation of this technology will require the design and development of a customized catheter, robotic endovascular navigation/orientation techniques, and other additional key technologies needed to safely reach the region of interest, deliver the patch, keep the system in position or reorient it, if necessary, and finally retrieving it, with a minimally invasive approach. We expect that biocompatible piezoelectric nanodevices will be increasingly used in future preclinical and clinical studies, with the aim of triggering specific high-efficiency and minimally invasive therapies.
Acknowledgments
This work was partly supported by the Fondazione Cassa di Risparmio di Pisa in the framework of the project Micro-VAST (microsystem for vascular diagnostics and intervention), by the GeT Small project (targeted therapy at small scale), funded by the Scuola Superiore di Studi Universitari e di Perfezionamento Sant’Anna (Pisa, Italy), by the M2Neural project (Multifunctional Materials for Advanced Neural Interfaces) (http://www.m2neural.eu) funded in the FP7 M-ERA. NET Transnational framework and by the Fondazione Cassa di Risparmio di Lucca (Lucca, Italy), in the framework of the SUAVES project (artificial urinary system based on bladder and sphincter endoprostheses). The authors thank Dr Eugenio Ridolfi Riva and Dr Virgilio Mattoli for their advices and support during the nanofilm fabrication procedure.
Disclosure
The authors report no conflicts of interest in this work.
References
Nobuyoshi M, Kimura T, Ohishi H, et al. Restenosis after percutaneous transluminal coronary angioplasty: pathologic observations in 20 patients. J Am Coll Cardiol. 1991;17(2):433–439. | ||
Chakhtoura EY, Hobson II RW, Goldstein J, et al. In-stent restenosis after carotid angioplasty-stenting: incidence and management. J Vasc Surg. 2001;33(2):220–226. | ||
Tosaka A, Soga Y, Iida O, et al. Classification and clinical impact of restenosis after femoropopliteal stenting. J Am Coll Card. 2012;59(1):16–23. | ||
Austin GE, Ratliff NB, Hollman J, Tabei S, Phillips DF. Intimal proliferation of smooth muscle cells as an explanation for recurrent coronary artery stenosis after percutaneous transluminal coronary angioplasty. J Am Coll Cardiol. 1985;6(2):369–375. | ||
Zargham R. Preventing restenosis after angioplasty: a multistage approach. Clin Sci. 2008;114:257–264. | ||
O’Brien B, Carroll W. The evolution of cardiovascular stent materials and surfaces in response to clinical drivers: a review. Acta Biomater. 2009;5(4):945–958. | ||
Duda SH, Poerner TC, Wiesinger B, et al. Drug-eluting stents: potential applications for peripheral arterial occlusive disease. J Vasc Interv Radiol. 2003;14(3):291–301. | ||
Garza L, Aude YW, Saucedo JF. Can we prevent in-stent restenosis? Curr Opin Cardiol. 2002;17(5):518–525. | ||
Sternberg K, Grabow N, Petersen S, et al. Advances in coronary stent technology-active drug-loaded stent surfaces for prevention of restenosis and improvement of biocompatibility. Curr Pharm Biotechnol. 2013;14(1):76–90. | ||
Nakazawa G, Otsuka F, Nakano M, et al. The pathology of neoatherosclerosis in human coronary implants: bare-metal and drug-eluting stents. J Am Coll Cardiol. 2005;57(11):1314–1322. | ||
Tsimikas S. Drug-eluting stents and late adverse clinical outcomes lessons learned, lessons awaited. J Am Coll Card. 2006;47(10):2112–2115. | ||
Sabaté M, Räber L, Heg D, et al. Comparison of newer-generation drug-eluting with bare-metal stents in patients with acute ST-segment elevation myocardial infarction: a pooled analysis of the EXAMINATION (clinical Evaluation of the Xience-V stent in Acute Myocardial INfArcTION) and COMFORTABLE-AMI (Comparison of Biolimus Eluted From an Erodible Stent Coating With Bare Metal Stents in Acute ST-Elevation Myocardial Infarction) trials. JACC: Cardiovasc Interv. 2014;7(1):55–63. | ||
Baroli B. Hydrogels for tissue engineering and delivery of tissue-inducing substances. J Pharm Sci. 2007;96(9):2197–2223. | ||
Chen M, Huang H, Pierstorff E, Shin E, Robinson E, Ho D. Parylene-encapsulated copolymeric membranes as localized and sustained drug delivery platforms. Ann Biomed Eng. 2009;37(10):2003–2017. | ||
Zelikin AN. Drug releasing polymer thin films: new era of surface-mediated drug delivery. ACS Nano. 2010;4(5):2494–2509. | ||
Chan JM, Zhang L, Tong R, et al. Spatiotemporal controlled delivery of nanoparticles to injured vasculature. Proc Natl Acad Sci U S A. 2010;107(5):2213–2218. | ||
Zhang J, Misra RDK. Magnetic drug-targeting carrier encapsulated with thermosensitive smart polymer: core-shell nanoparticle carrier and drug release response. Acta Biomater. 2007;3(6):838–850. | ||
Gutman D, Golomb G. Liposomal alendronate for the treatment of restenosis. J Control Release. 2012;161(2):619–627. | ||
Lande C, Cecchettini A, Tedeschi L, et al. Innovative erythrocyte-based carriers for gene delivery in porcine vascular smooth muscle cells: basis for local therapy to prevent restenosis. Cardiovasc Hematol Disord Drug Targets. 2012;12(1):68–75. | ||
Hammond PT. Building biomedical materials layer-by-layer. Mater Today. 2012;15(5):196–206. | ||
Decher G, Lehr B, Lowack K, Lvov Y, Schmitt J. New nanocomposite films for biosensors: layer-by-layer adsorbed films of polyelectrolytes, proteins or DNA. Biosens Bioelectron. 1994;9(9):677–684. | ||
Meng S, Liu Z, Shen L, et al. The effect of a layer-by-layer chitosan–heparin coating on the endothelialization and coagulation properties of a coronary stent system. Biomaterials. 2009;30(12):2276–2283. | ||
Chan JM, Rhee J-W, Drum CL, et al. In vivo prevention of arterial restenosis with paclitaxel-encapsulated targeted lipid–polymeric nanoparticles. Proc Natl Acad Sci U S A. 2011;108(48):19347–19352. | ||
Panyam J, Labhasetwar V. Biodegradable nanoparticles for drug and gene delivery to cells and tissue. Adv Drug Deliv Rev. 2003;55(3):329–347. | ||
Chorny M, Fishbein I, Forbes S, Alferiev I. Magnetic nanoparticles for targeted vascular delivery. IUBMB Life. 2011;63(8):613–620. | ||
Lanza GM, Yu X, Winter PM, et al. Targeted antiproliferative drug delivery to vascular smooth muscle cells with a magnetic resonance imaging nanoparticle contrast agent implications for rational therapy of restenosis. Circulation. 2002;106(22):2842–2847. | ||
Westedt U, Barbu-Tudoran L, Schaper AK, Kalinowski M, Alfke H, Kissel T. Deposition of nanoparticles in the arterial vessel by porous balloon catheters: localization by confocal laser scanning microscopy and transmission electron microscopy. AAPS Pharm Sci. 2002;4(4):206–211. | ||
McDowell G, Slevin M, Krupinski J. Nanotechnology for the treatment of coronary in stent restenosis: a clinical perspective. Vasc Cell. 2011;3(8):1–5. | ||
Chuang HF, Smith RC, Hammond PT. Polyelectrolyte multilayers for tunable release of antibiotics. Biomacromolecules. 2008;9(6):1660–1668. | ||
Fujie T, Saito A, Kinoshita M, et al. Dual therapeutic action of antibiotic-loaded nanosheets for the treatment of gastrointestinal tissue defects. Biomaterials. 2010;31(24):6269–6278. | ||
Thierry B, Winnik FM, Merhi Y, Tabrizian M. Nanocoatings onto arteries via layer-by-layer deposition: toward the in vivo repair of damaged blood vessels. J Am Chem Soc. 2003;125(25):7494–7495. | ||
Kerdjoudj H, Boura C, Moby V, et al. Re-endothelialization of human umbilical arteries treated with polyelectrolyte multilayers: a tool for damaged vessel replacement. Adv Funct Mat. 2007;17(15):2667–2673. | ||
Groth T, Lendlein A. Layer-by-layer deposition of polyelectrolytes – a versatile tool for the in vivo repair of blood vessels. Angew Chem Int Ed. 2004;43(8):926–928. | ||
Redolfi Riva E, Desii A, Sartini S, La Motta C, Mazzolai B, Mattoli V. PMMA/polysaccharides nanofilm loaded with adenosine deaminase inhibitor for targeted anti-inflammatory drug delivery. Langmuir. 2013;29(43):13190–13197. | ||
Ricotti L, Cafarelli A, Iacovacci V, Vannozzi L, Menciassi A. Advanced micro-nano-bio systems for future targeted therapies. Curr Nanosci. 2015;11(2):144–160. | ||
Timko BP, Dvir T, Kohane DS. Remotely triggerable drug delivery systems. Adv Mater. 2010;22(44):4925–4943. | ||
Santini JT, Cima MJ, Langer R. A controlled-release microchip. Nature. 1999;397(6717):335–338. | ||
Knežević NŽ, Trewyn BG, Lin VSY. Functionalized mesoporous silica nanoparticle-based visible light responsive controlled release delivery system. Chem Commun. 2011;47(10):2817–2819. | ||
Liu J, Bu W, Pan L, Shi J. NIR-triggered anticancer drug delivery by upconverting nanoparticles with integrated azobenzene-modified mesoporous silica. Angew Chem Int Ed. 2013;52(16):4375–4379. | ||
Satarkar NS, Hilt JZ. Magnetic hydrogel nanocomposites for remote controlled pulsatile drug release. J Control Release. 2008;130(3):246–251. | ||
Hernot S, Klibanov AL. Microbubbles in ultrasound-triggered drug and gene delivery. Adv Drug Deliv Rev. 2008;60(10):1153–1166. | ||
Deckers R, Moonen CT. Ultrasound triggered, image guided, local drug delivery. J Control Release. 2010;148(1):25–33. | ||
Dubinsky TJ, Cuevas C, Dighe MK, Kolokythas O, Hwang JH. High-intensity focused ultrasound: current potential and oncologic applications. Am J Roentgenol. 2008;190(1):191–199. | ||
Ciofani G, Danti S, Ricotti L, D’Alessandro D, Moscato S, Mattoli V. Applications of Piezoelectricity in Nanomedicine. Berlin: Springer; 2012. | ||
Polat BE, Hart D, Langer R, Blankschtein D. Ultrasound-mediated transdermal drug delivery: mechanisms, scope, and emerging trends. J Control Release. 2011;152(3):330–348. | ||
Ciofani G, Danti S, D’Alessandro D, Moscato S, Petrini M, Menciassi A. Barium titanate nanoparticles: highly cytocompatible dispersions in glycol-chitosan and doxorubicin complexes for cancer therapy. Nanoscale Res Lett. 2010;5(7):1093–1101. | ||
Ciofani G, Danti S, D’Alessandro D, et al. Enhancement of neurite outgrowth in neuronal-like cells following boron nitride nanotube-mediated stimulation. ACS Nano. 2010;4(10):6267–6277. | ||
Ciofani G, Danti S, Ricotti L, et al. Boron nitride nanotubes: production, properties, biological interactions and potential applications as therapeutic agents in brain diseases. Curr Nanosci. 2011;7(1):94–109. | ||
Ricotti L, Fujie T, Vazão H, et al. Boron nitride nanotube-mediated stimulation of cell co-culture on micro-engineered hydrogels. PLoS One. 2013;8(8):e71707. | ||
Ricotti L, das Neves RP, Ciofani G, et al. Boron nitride nanotube-mediated stimulation modulates F/G-actin ratio and mechanical properties of human dermal fibroblasts. J Nanopart Res. 2014;16(2):1–14. | ||
Del Turco S, Sartini S, Sentieri C, et al. A novel 2,3-diphenyl-4H-pyrido [1,2-a] pyrimidin-4-one derivative inhibits endothelial cell dysfunction and smooth muscle cell proliferation/activation. Eur J Med Chem. 2014;72:102–109. | ||
La Motta C, Sartini S, Mugnaini L, et al. Pyrido [1,2-a] pyrimidin-4-one derivatives as a novel class of selective aldose reductase inhibitors exhibiting antioxidant activity. J Med Chem. 2007;50(20):4917–4927. | ||
Fujie T, Ricotti L, Desii A, Menciassi A, Dario P, Mattoli V. Evaluation of substrata effect on cell adhesion properties using freestanding poly (L-lactic acid) nanosheets. Langmuir. 2011;27(21):13173–13182. | ||
Pensabene V, Taccola S, Ricotti L, et al. Flexible polymeric ultrathin film for mesenchymal stem cell differentiation. Acta Biomater. 2011;7(7):2883–2891. | ||
Da Violante G, Zerrouk N, Richard I, Provot G, Chaumeil JC, Arnaud P. Evaluation of the cytotoxicity effect of dimethyl sulfoxide (DMSO) on Caco2/TC7 colon tumor cell cultures. Biol Pharm Bull. 2002;25(12):1600–1603. | ||
Hebling J, Bianchi L, Basso FG, et al. Cytotoxicity of dimethyl sulfoxide (DMSO) in direct contact with odontoblast-like cells. Dent Mater. 2015;31(4):399–405. | ||
Greco F, Zucca A, Taccola S, Mazzolai B, Mattoli V. Patterned free-standing conductive nanofilms for ultraconformable circuits and smart interfaces. ACS Appl Mater Interfaces. 2013;5(19):9461–9469. | ||
Xu B, Song G, Ju Y, Li X, Song Y, Watanabe S. RhoA/ROCK, cytoskeletal dynamics, and focal adhesion kinase are required for mechanical stretch-induced tenogenic differentiation of human mesenchymal stem cells. J Cell Physiol. 2012;227(6):2722–2729. | ||
Tamai H, Igaki K, Kyo E, et al. Initial and 6-month results of biodegradable poly-L-lactic acid coronary stents in humans. Circulation. 2000;102(4):399–404. | ||
Ormiston JA, Serruys PW. Bioabsorbable coronary stents. Circ Cardiovasc Interv. 2009;2(3):255–260. | ||
Wan Y, Yang J, Yang J, Bei J, Wang S. Cell adhesion on gaseous plasma modified poly-(L-lactide) surface under shear stress field. Biomaterials. 2003;24(21):3757–3764. | ||
Armentano I, Ciapetti G, Pennacchi M, et al. Role of PLLA plasma surface modification in the interaction with human marrow stromal cells. J Appl Polym Sci. 2009;114(6):3602–3611. | ||
Hsieh CT, Chen JM, Kuo RR, Lin TS, Wu CF. Influence of surface roughness on water-and oil-repellent surfaces coated with nanoparticles. Appl Surf Sci. 2005;240(1):318–326. | ||
Deux JF, Meddahi-Pellé A, Le Blanche AF, et al. Low molecular weight fucoidan prevents neointimal hyperplasia in rabbit iliac artery in-stent restenosis model. Arterioscler Thromb Vasc Biol. 2002;22(10):1604–1609. | ||
Zhang J, Senger B, Vautier D, et al. Natural polyelectrolyte films based on layer-by layer deposition of collagen and hyaluronic acid. Biomaterials. 2005;26(16):3353–3361. | ||
Kumar MNR. A review of chitin and chitosan applications. React Funct Polym. 2000;46(1):1–27. | ||
Rao SB, Sharma CP. Use of chitosan as a biomaterial: studies on its safety and hemostatic potential. J Biomed Mater Res. 1997;34(1):21–28. | ||
Picart C, Mutterer J, Richert L, et al. Molecular basis for the explanation of the exponential growth of polyelectrolyte multilayers. Proc Natl Acad Sci U S A. 2002;99(20):12531–12535. | ||
Carneiro-da-Cunha M, Cerqueira MA, Souza BWS, Teixeira JA, Vicente AA. Influence of concentration, ionic strength and pH on zeta potential and mean hydrodynamic diameter of edible polysaccharide solutions envisaged for multinanolayered films production. Carbohyd Polym. 2011;85(3):522–528. | ||
Gribova V, Auzely-Velty R, Picart C. Polyelectrolyte multilayer assemblies on materials surfaces: from cell adhesion to tissue engineering. Chem Mater. 2011;24(5):854–869. | ||
Boudou T, Crouzier T, Ren K, Blin G, Picart C. Multiple functionalities of polyelectrolyte multilayer films: new biomedical applications. Adv Mater. 2010;22(4):441–467. | ||
Ricotti L, Taccola S, Bernardeschi I, Pensabene V, Dario P, Menciassi A. Quantification of growth and differentiation of C2C12 skeletal muscle cells on PSS–PAH-based polyelectrolyte layer-by-layer nanofilms. Biomed Mater. 2011;6(3):031001. | ||
Ciofani G, Ricotti L, Mattoli V. Preparation, characterization and in vitro testing of poly (lactic-co-glycolic) acid/barium titanate nanoparticle composites for enhanced cellular proliferation. Biomed Microdev. 2011;13(2):255–266. | ||
Thapa A, Miller DC, Webster TJ, Haberstroh KM. Nano-structured polymers enhance bladder smooth muscle cell function. Biomaterials. 2003;24(17):2915–2926. | ||
Baxter L, Frauchiger V, Textor M, Ap Gwynn I, Richards R. Fibroblast and osteoblast adhesion and morphology on calcium phosphate surfaces. Eur Cell Mater. 2002;4(1):1–17. | ||
Wang RCC, Hsieh MC, Lee TM. Effects of nanometric roughness on surface properties and fibroblast’s initial cytocompatibilities of Ti6AI4V. Biointerphases. 2011;6(3):87–97. | ||
Denes L, Entz L, Jancsik V. Restenosis and therapy. Int J Vasc Med. 2012. | ||
Miller DC, Thapa A, Haberstroh KM, Webster TJ. Endothelial and vascular smooth muscle cell function on poly (lactic-co-glycolic acid) with nano-structured surface features. Biomaterials. 2004;25(1):53–61. | ||
Park JB, Kelly BJ, Kenner GH, von Recum AF, Grether MF, Coffeen WW. Piezoelectric ceramic implants: in vivo results. J Biomed Mater Res. 1981;15(1):103–110. | ||
Ciofani G, Danti S, Ricotti L, et al. Potential applications of barium titanate nanoparticles in nanomedicine: a preliminary study. 10th IEEE Conference on Nanotechnology (IEEE-NANO), 2010. Kintex, Gyeonggi-Do, Korea (South). 2010;987–990. | ||
Ciofani G, Ricotti L, Canale C, et al. Effects of barium titanate nanoparticles on proliferation and differentiation of rat mesenchymal stem cells. Colloids Surf B Biointerfaces. 2013;102:312–320. | ||
Blanco E, Shen H, Ferrari M. Principles of nanoparticle design for overcoming biological barriers to drug delivery. Nat Biotechnol. 2015;33(9):941–951. | ||
Sultana N, Kadir MRA. Study of in vitro degradation of biodegradable polymer based thin films and tissue engineering scaffolds. Afr J Biotechnol. 2013;10(81):18709–18715. | ||
Sirsi SR, Borden MA. State-of-the-art materials for ultrasound-triggered drug delivery. Adv Drug Deliv Rev. 2014;72:3–14. | ||
Husseini GA, Pitt WG. Ultrasonic-activated micellar drug delivery for cancer treatment. J Pharm Sci. 2009;98(3):795–811. | ||
Korsemeyer RW, Peppas NA. Effect of the morphology of hydrophilic polymeric matrices on the diffusion and release of water soluble drugs. J Membr Sci. 1981;9:211–227. | ||
Siepmann J, Peppas NA. Modeling of drug release from delivery systems based on hydroxypropyl methylcellulose (HPMC). Adv Drug Deliv Rev. 2012;64:163–174. | ||
Anal KA, Stevens WF. Chitosan-alginate multilayer beads for controlled release of ampicillin. Int J Pharm. 2005;290(1):45–54. | ||
Rodriguez-Belenguer PA, Nacher MJ, Hernanedz MJ, Diez-Sales O. Characterization of novel hyaluronic acid matrix systems for vaginal administration of metronidazole. J App Polym Sci. 2014;132(3):41313. | ||
Ferrara KW. Driving delivery vehicles with ultrasound. Adv Drug Deliv Rev. 2008;10(30):1097–1102. |
Supplementary materials
PFM analysis
Before imaging the poly(L-lactic acid) (PLLA) nanostructures, the periodically poled lithium niobate (PPLN) test sample was used for standard piezoresponse force microscopy (PFM) imaging verification. The d33 measurement procedure is described as:
|
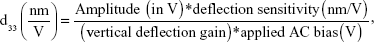
where deflection sensitivity is 107.61 nm/V, vertical deflection gain is 16×, and applied alternating current (AC) bias is 10 V.
The vertical piezoresponse was calibrated using deflection sensitivity of the PFM cantilever tip obtained from a force–displacement curve on sapphire substrate.
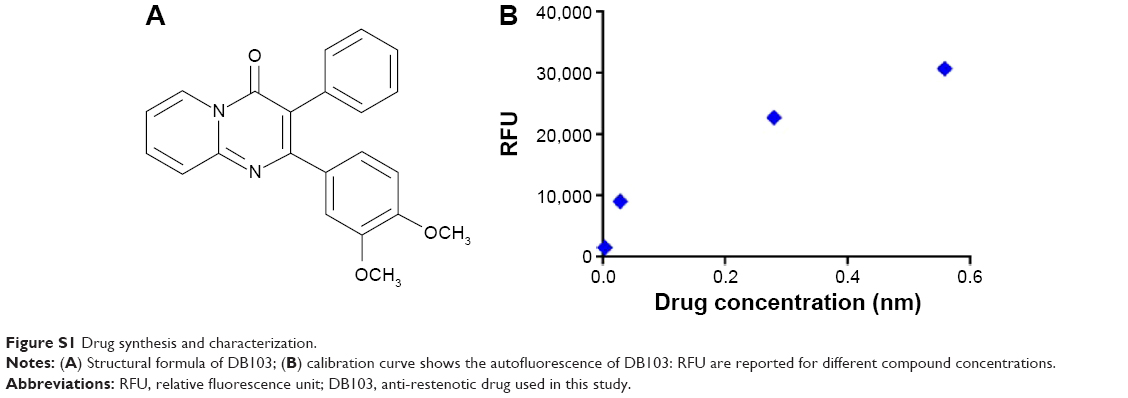 | Figure S1 Drug synthesis and characterization. |
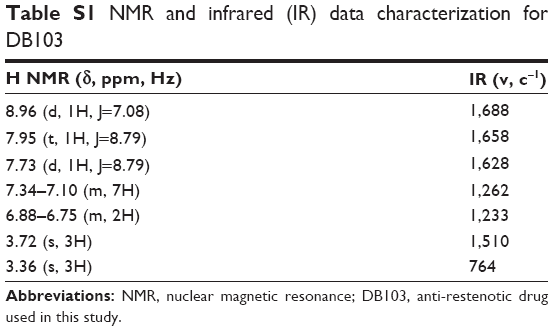 | Table S1 NMR and infrared (IR) data characterization for DB103 |
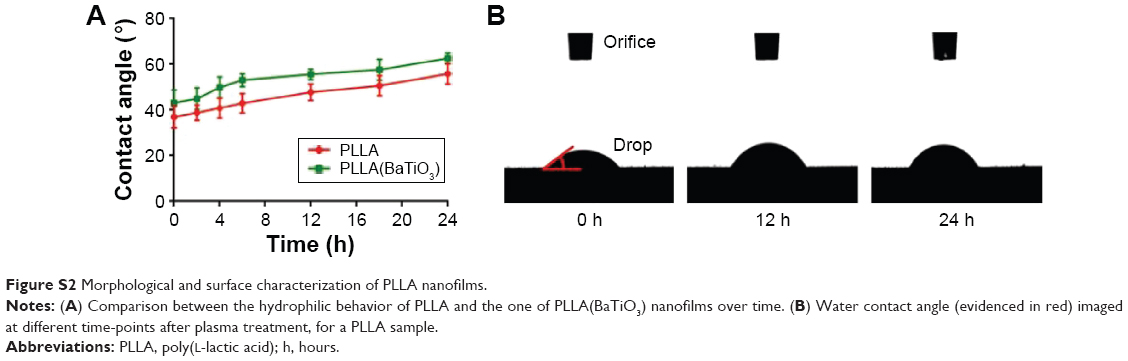 | Figure S2 Morphological and surface characterization of PLLA nanofilms. |
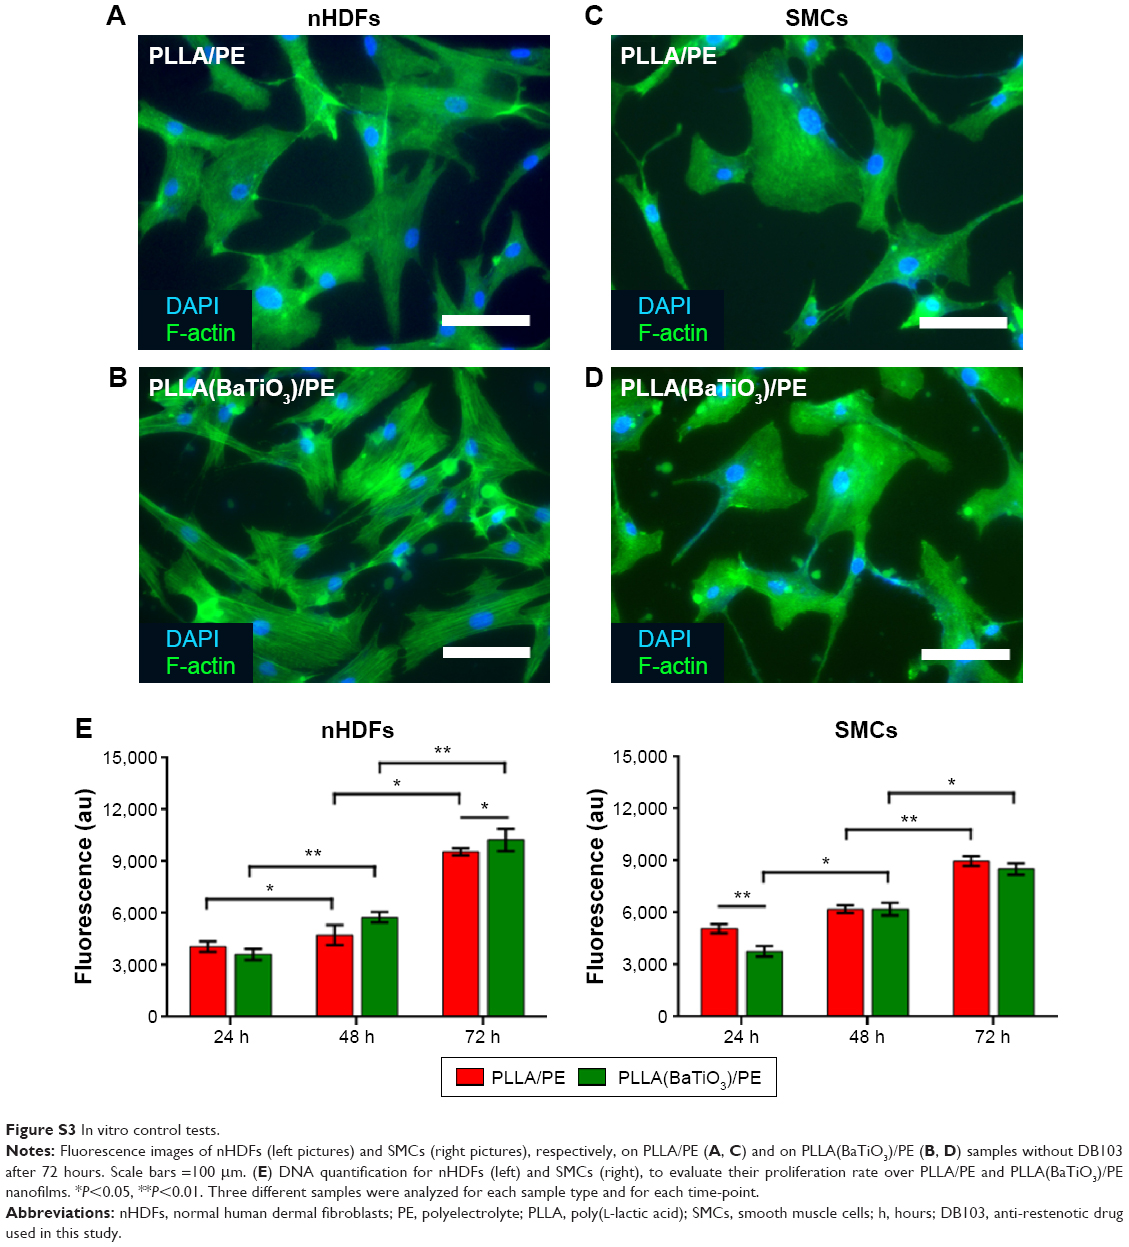 | Figure S3 In vitro control tests. |
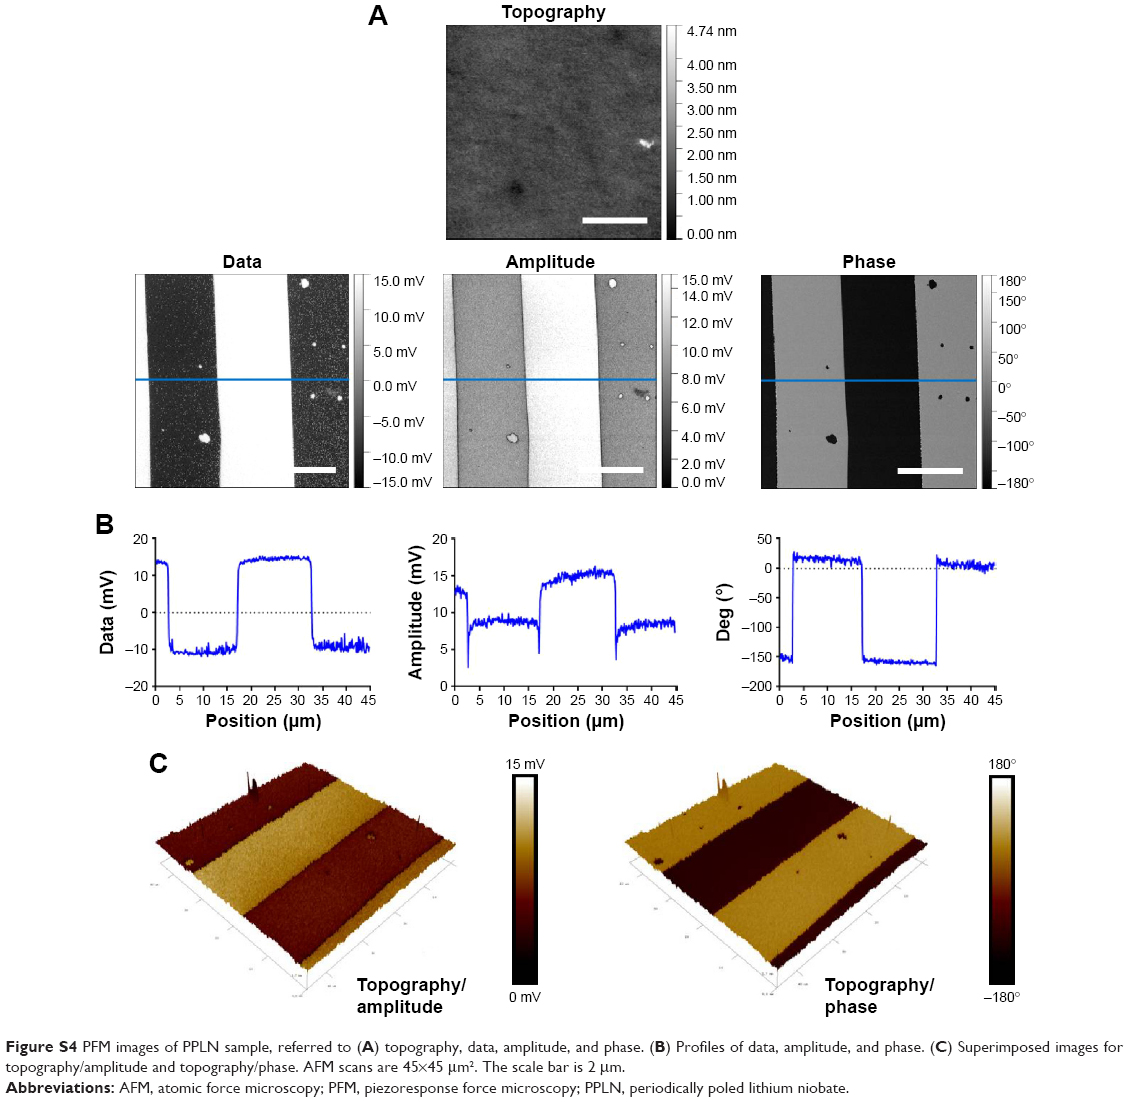 | Figure S4 PFM images of PPLN sample, referred to (A) topography, data, amplitude, and phase. (B) Profiles of data, amplitude, and phase. (C) Superimposed images for topography/amplitude and topography/phase. AFM scans are 45×45 μm2. The scale bar is 2 μm. |
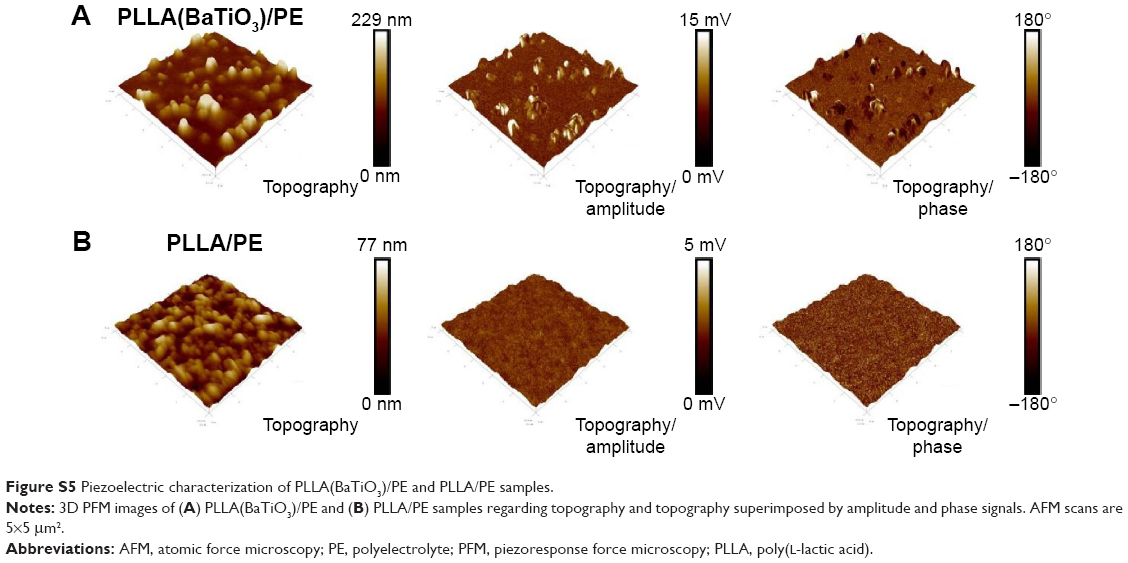 | Figure S5 Piezoelectric characterization of PLLA(BaTiO3)/PE and PLLA/PE samples. |
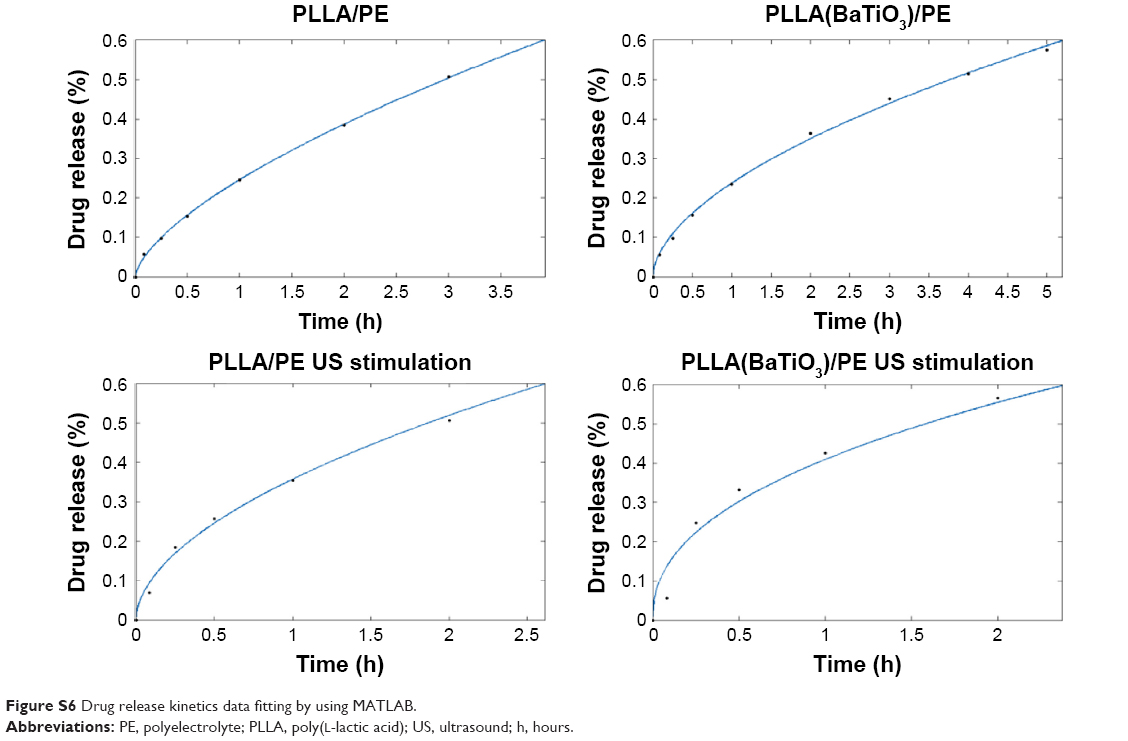 | Figure S6 Drug release kinetics data fitting by using MATLAB. |
 © 2015 The Author(s). This work is published and licensed by Dove Medical Press Limited. The full terms of this license are available at https://www.dovepress.com/terms.php and incorporate the Creative Commons Attribution - Non Commercial (unported, v3.0) License.
By accessing the work you hereby accept the Terms. Non-commercial uses of the work are permitted without any further permission from Dove Medical Press Limited, provided the work is properly attributed. For permission for commercial use of this work, please see paragraphs 4.2 and 5 of our Terms.
© 2015 The Author(s). This work is published and licensed by Dove Medical Press Limited. The full terms of this license are available at https://www.dovepress.com/terms.php and incorporate the Creative Commons Attribution - Non Commercial (unported, v3.0) License.
By accessing the work you hereby accept the Terms. Non-commercial uses of the work are permitted without any further permission from Dove Medical Press Limited, provided the work is properly attributed. For permission for commercial use of this work, please see paragraphs 4.2 and 5 of our Terms.