")
Back to Journals » International Journal of Nanomedicine » Volume 9 » Issue 1
Nanosizing of a poorly soluble drug: technique optimization, factorial analysis, and pharmacokinetic study in healthy human volunteers
Authors Elsayed I, Abdelbary A, Elshafeey A
Received 3 March 2014
Accepted for publication 31 March 2014
Published 17 June 2014 Volume 2014:9(1) Pages 2943—2953
DOI https://doi.org/10.2147/IJN.S63395
Checked for plagiarism Yes
Review by Single anonymous peer review
Peer reviewer comments 3
Ibrahim Elsayed,1 Aly Ahmed Abdelbary,1 Ahmed Hassen Elshafeey1,2
1Department of Pharmaceutics and Industrial Pharmacy, Faculty of Pharmacy, Cairo University, Cairo, Egypt; 2Department of Pharmaceutical Sciences, School of Pharmacy, University of Waterloo, ON, Canada
Context: Diacerein (DCN) has low aqueous solubility (3.197 mg/L) and, consequently, low oral bioavailability (35%–56%). To increase both the solubility and dissolution rate of DCN while maintaining its crystalline nature, high pressure homogenization was used but with only a few homogenization cycles preceded by a simple bottom-up technique.
Methods: The nanosuspensions of DCN were prepared using a combined bottom-up/top-down technique. Different surfactants – polyvinyl alcohol, sodium deoxycholate, and sodium dodecyl sulfate – with different concentrations were used for the stabilization of the nanosuspensions. Full factorial experimental design was employed to investigate the influence of formulation variables on nanosuspension characteristics using Design-Expert® Software. Particle size (PS), zeta potential, saturation solubility, in vitro dissolution, and drug crystallinity were studied. Moreover, the in vivo performance of the optimized formula was assessed by bioavailability determination in healthy human volunteers.
Results: The concentration of surfactant had a significant effect on both the PS and polydispersity index values. The 1% surfactant concentration showed the lowest PS and polydispersity index values compared with other concentrations. Both type and concentration of surfactant had significant effects on the zeta potential. Formula F8 (containing 1% sodium deoxycholate) and Formula F12 (containing 1% sodium dodecyl sulfate) had the highest desirability values (0.952 and 0.927, respectively). Hence, they were selected for further characterization. The saturated solubility and mean dissolution time, in the case of F8 and F12, were significantly higher than the coarse drug powder. Techniques utilized in the nanocrystals’ preparation had no effect on DCN crystalline state. The selected formula (F12) showed a higher bioavailability compared to the reference market product with relative bioavailability of 131.4%.
Conclusion: The saturation solubility, in vitro dissolution rate and relative bioavailability of DCN were significantly increased after nanocrystallization. Less time and power consumption were applied by the combination of bottom-up and top-down techniques.
Keywords: nanocrystals, high pressure homogenization, diacerein, factorial analysis, pharmacokinetic study
Introduction
The first step in oral absorption of solid dosage forms is dissolution of drug compound in the gastrointestinal lumen contents. Hence, poor aqueous solubility has become the leading hurdle for formulation, and scientists are concerned in improving oral delivery of insoluble drug candidates.1–3 Various approaches have been utilized for the enhancement of solubility and dissolution rate of poorly soluble drugs such as solid dispersions preparation,4 inclusion in cyclodextrins,5 and particle size (PS) reduction.6 Although these approaches improved solubility and dissolution of poorly soluble drugs, their commercial use is limited due to stability issues of the amorphous nature of the produced drug. Nowadays, crystalline nanosuspensions (nanocrystals) are considered a valuable formulation for drugs that have a poor dissolution rate and/or aqueous solubility.3,7
Nanosuspensions consist of stabilized submicron sized crystalline drug particles in liquid medium, usually water.8,9 They can be produced either by precipitation techniques (bottom-up approach) or by size reduction (top-down approach).10,11
The bottom-up approaches are advantageous with respect to improving bioavailability through obtaining smaller PS (<100 nm) and amorphous drug particles, thereby showing similarity to formulation approaches as solid dispersions. However, currently, no commercial application of these systems has yet been realized. Typical limitations of the bottom-up processes are the time required for processing, scale-up difficulties, low drug loading efficiencies and wide nanoparticle size distributions.12 On the other hand, the top-down techniques have already served as the formulation basis for several commercial products.13
High pressure homogenization (HPH) is a simple top-down technique which can be used to produce nanosuspensions. It is a well-known process in the food, cosmetics and pharmaceutical industries.14,15 The PS reduction is done by repeatedly forcing a suspension through a very thin gap (5–20 μm) at extremely high velocity.10,12,14 The main disadvantage of HPH is that the thin gap can be blocked during operation if the drug is not micronized before processing.16 To avoid blocking of the homogenization gap, it is recommended to perform pre-milling. Typical sequence for pre-milling is two cycles at 100 bar, two cycles at 200 bar, two cycles at 500 bar, and two cycles at 1,000 bar.17 Other disadvantages of HPH include the high number of homogenization cycles, high energy input and the possibility of product contamination due to the metal ions coming off from the wall of the homogenizer.18
Diacerein (DCN) – 4,5-diacetoxy-9,10- dioxo-9,10-dihydroanthracene-2-carboxylic acid – is a chondroprotective agent used for osteoarthritis treatment.19–21 It is the diacetylated derivative of rhein, a molecule with an anthraquinone ring, which is the active metabolite of DCN.22 DCN is classified as Biopharmaceutics Classification System class II with low solubility and high permeability.23 DCN is sparingly soluble in water (3.197 mg/L), which results in a poor dissolution rate and, consequently, low oral bioavailability (35%–56%).24,25 Hence, increasing the aqueous solubility of DCN should result in increased bioavailability.21,26
In this manuscript, the disadvantages of the HPH process were significantly reduced through the avoidance of the pre-milling cycles and the efficient reduction of the number of homogenization cycles. By using a simple bottom-up technique before the HPH process, the number of cycles was significantly reduced from 20 to only five cycles at 1,000 bar with no pre-milling. Different surfactants with different concentrations, such as polyvinyl alcohol (PVA), sodium deoxycholate (SDC), and sodium dodecyl sulfate (SDS), were used for the stabilization of the nanosuspensions of DCN, a poorly soluble model drug. The PS, saturation solubility, in vitro dissolution, and drug crystallinity were studied. Moreover, the in vivo performance of the optimized formula was assessed by bioavailability determination in healthy human volunteers.
Materials and methods
Materials
DCN was a gift from Eva Pharma, Cairo, Egypt. The SDS was provided by Hercules, Wilmington, DE, USA. The SDC was purchased from BASF, Florham Park, NJ, USA; dimethyl sulfoxide was supplied by Thermo Fisher Scientific, Waltham, MA, USA. The PVA, with an average MW of approximately 25,000, sucrose, and mannitol were purchased from Sigma-Aldrich Co., St Louis, MO, USA. All other chemicals and solvents were of an analytical grade and used without further purification.
Methods
Preparation of nanosuspensions
Nanosuspension formulas were prepared using a combined bottom-up/top-down technique.27 Briefly, DCN (50 mg) was dissolved in 6 mL dimethyl sulfoxide. The solution was then poured into an aqueous surfactant solution (50 mL) of either PVA, SDC, or SDS; each was in a concentration of 0.1%, 0.25%, 0.5%, or 1%. This was performed in the presence of ultrasonication at 40 kHz for 2 minutes (probe sonicator, Hielscher Ultrasonics GmbH, Teltow, Germany). The formed dispersion was homogenized using a high pressure homogenizer (Stansted SPCH-10; Stansted Fluid Power Ltd, Harlow, UK) for five cycles at 1,000 bar. The obtained nanosuspensions were centrifuged at 15,000 rpm for 60 minutes at 4°C. Then, the collected nanoparticles were washed with distilled water and centrifuged again at the same conditions. Finally, the washed nanoparticles were dispersed in the same surfactant solution used during its preparation to be stabilized during storage.
Statistical design of the study
Full factorial experimental design was employed to investigate the influence of formulation variables on nanosuspension properties using Design-Expert® 7 Software (Stat-Ease Inc., Minneapolis, MN, USA). As shown in Table 1, two independent variables were evaluated, which were type (X1) and concentration (X2) of the surfactant. The particle size (Y1: PS), polydispersity index (Y2: PDI), and zeta potential (Y3: ZP) were selected as the dependent variables. The composition of the prepared nanosuspensions formulas is shown in Table 2. Desirability was calculated for selection of the optimized formulas, which were subjected for further investigations.
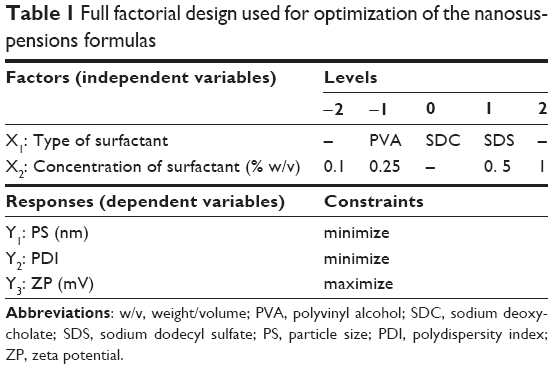 | Table 1 Full factorial design used for optimization of the nanosuspensions formulas |
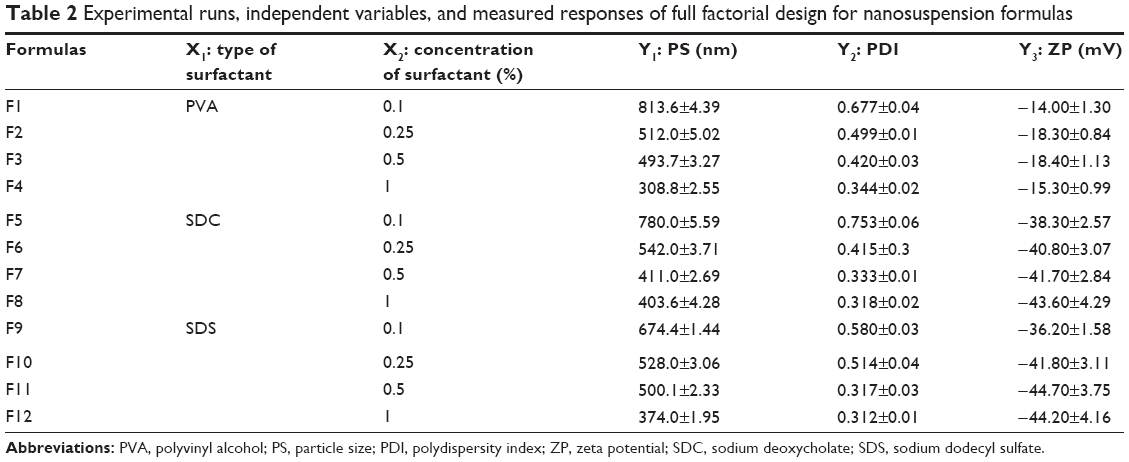 | Table 2 Experimental runs, independent variables, and measured responses of full factorial design for nanosuspension formulas |
PS, PDI, and ZP
The PS, PDI, and ZP of the prepared DCN nanosuspensions were measured by photon correlation spectroscopy (PCS) using a Zetasizer Nano ZS-90 instrument (Malvern Instruments, Malvern, UK). An aliquot of the nanosuspension was diluted before the measurement. Measurements were performed in triplicate using 90° scattering angle at 25°C. The displayed results are the average value ± the standard deviation.
Lyophilization of prepared nanosuspensions
To study the saturation solubility and dissolution rate, the selected nanosuspension formulas were lyophilized after preparation. First, the nanosuspensions were poured into glass flasks and prefrozen using an ultracold Revco freezer (Thermo Scientific) at −80°C for 12 hours; then, the samples were freeze-dried using a Flexi-DryTM MP Freeze Dryer (SP Scientific, Stone Ridge, New York, USA) at −90°C and 380 mT of pressure for 48 hours to yield dry nanoparticles powder. Additionally, sucrose or mannitol (2% weight/volume) was added into the dispersions prior to freezing as a cryoprotectant agent. PS and PDI were analyzed for the lyophilized formulas after reconstitution, and the results were compared to those without cryoprotectant. Statistical analysis of data was performed using the software SPSS 19.0 (IBM Corporation, Armonk, NY, USA) applying a one-way analysis of variance test followed by post hoc multiple comparisons using Fisher’s least significant difference test, and the results were considered significantly different when P-values were <0.05.
Determination of saturated solubility
The saturation solubilities of coarse DCN powder and from the selected nanocrystal formulas were determined by adding an excess amount of the powder in a vial containing 5 mL Sorenson’s phosphate buffer (pH 6.8). Shaking was performed using a thermostatically controlled shaking water bath (Precision Scientific Inc., Chicago, IL, USA) at 37°C until equilibrium (48 hours). Samples were taken and filtered using a 0.1 μm membrane filter (Whatman Inc., Clifton, NJ, USA).28 The filtrate was analyzed spectrophotometrically at the predetermined λmax (258 nm) using a disposable microcuvette.24 The experiment was conducted in triplicate for each formula and the mean values ± standard deviation were calculated. Statistical analysis of data was performed using the software SPSS 19.0 (IBM Corporation).
In vitro dissolution study
In vitro dissolution was performed for the selected lyophilized formulas, using an amount of drug equivalent to 50 mg, in comparison with the coarse drug powder. This was done using United States Pharmacopeia II dissolution apparatus (SR8-PLUS; Hanson Research Corporation, Chatsworth, CA, USA) containing 900 mL Sorenson’s phosphate buffer pH 6.8 as dissolution medium at 37°C and stirred at 50 rpm. Dissolution samples were withdrawn at 2, 4, 6, 8, 10, 15, 20, 30, 45, and 60 minutes, with replacement of an equal volume of dissolution medium. The samples were filtered and analyzed by ultraviolet spectrophotometry as mentioned earlier. All samples were analyzed in triplicate. Release rate was expressed by the mean dissolution time (MDT), which was calculated from the equation:
|
|
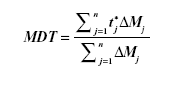
where j is the sample number, n is the number of dissolution samples, t*j is the time at midpoint between t and tj−1, and ΔMj is the additional amount of drug dissolved between t and tj−1.29
Also, the similarity factor (f2) was calculated for multiple comparisons between the obtained release profiles utilizing the following equation:
|
|
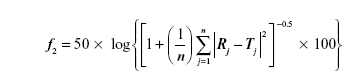
where, n is the sampling number, R and T are the percent dissolved of the reference and test products, respectively at each time point j.29
Assessment of crystallinity of nanocrystals
Differential scanning calorimetry (DSC)
Samples of approximately 5 mg were weighed and analyzed in hermetically sealed aluminum pans. DSC was performed using a DSC822e Mettler-Toledo differential scanning calorimeter (Mettler-Toledo International Inc., Columbus, OH, USA). Samples were heated at a scanning rate of 10°C/minute between 25°C–300°C, using nitrogen as a blanket gas.30,31 An empty aluminum pan was used as standard reference.
Powder X-ray diffractometry (PXRD)
PXRD studies were conducted using an X-ray diffractometer (MD-10 mini diffractometer, MTI Corporation, Richmond, CA, USA) using Cu K2α rays (λ =1.54056 Å) with a voltage of 25 kV and a current of 30 mA, in a flat plate θ/2θ geometry, over the 2θ ranges 14°–75°. A 60 mg sample was placed in the sample holder groove and packed tightly.32
Scanning electron microscopy
The surface characteristics of the selected formula were observed using a scanning electron microscope (JXA-840; JEOL, Tokyo, Japan). The samples were gold-coated under vacuum and then examined.
Pharmacokinetics study in healthy subjects
Study design and subjects
A single-dose, two-period randomized cross-over design was adopted under fasting conditions. Six healthy adult male volunteers participated in this comparative study: their mean age was 22.8±3.4 years; the mean body weight 80.3±6.9 kg; and mean height, 174.25±7.4 cm. The volunteers had given their written consent after the purpose of the study was fully explained. The volunteers were instructed to refrain from taking any drug for 2 weeks before and during the study period. The study was performed according to the revised Declaration of Helsinki for biomedical research involving humans, as well as the rules of good clinical practices.33,34 The study protocol was reviewed and approved by the institutional review board of the Genuine Research Center, Cairo, Egypt.
The volunteers were hospitalized at 9 pm and had a standard dinner in the clinical site. After an overnight fast (10 hours), subjects were given a single oral dose of the commercial product, DCN 50 mg capsules (EVA Pharma), or the optimized formula with equivalent amount to 50 mg drug, which was accurately weighed and filled in hard gelatin capsules. Approximately 6 mL blood samples for rhein (the active metabolite of DCN) analysis were drawn into evacuated heparinized glass tubes through an indwelling cannula at 0.0, 0.25, 0.5, 0.75, 1, 1.5, 2, 2.5, 3.0, 4.0, 6.0, 8.0, 10.0, 12.0, and 24.0 hours after dosing. Blood samples were centrifuged at 3,500 rpm for 10 minutes at 4°C; plasma was transferred directly into 5 mL plastic tubes and stored frozen at −20°C, pending drug analysis. After a washing-out period of 7 days, the study was repeated adopting the same procedure to complete the crossover design.
Sample preparation
All frozen human plasma samples were thawed at ambient temperature. The human plasma samples (0.5 mL) were placed in 5 mL glass tubes, and 100 μL of fenoterol as internal standard (IS, 5 μg/mL) solution in acetonitrile was added to each and vortexed. Then, 1 mL acetonitrile was added; samples were then vortexed for 2 minutes. The tubes were then centrifuged for 10 minutes at 4,000 rpm (1,790 g). The upper organic phases were then transferred to the autosampler vials where 20 μL was injected into the liquid chromatography-tandem mass spectrometry (LC-MS/MS).
A sensitive, selective, and accurate LC-MS/MS method was developed and validated before the study for determination of rhein (the active DCN metabolite) concentrations in human plasma. Fenoterol (IS) stock solution was prepared by dissolving 10 mg in methanol and serially diluted with mobile phase to give a final working concentration of 5 μg/mL. A Shimadzu Prominence (Shimadzu Scientific Instruments, Columbia, MD, USA) series LC system equipped with degasser (DGU-20A3), solvent delivery unit (LC-20AB) with an autosampler (SIL-20 AC) was used to inject 20 μL aliquots of the processed samples on a Luna C18 (Phenomenex Inc., Torrance, CA, USA) 50×4.6 mm, 5 μm PS. The guard column was a Phenomenex C18 5×4.0 mm, 5 μm PS. All analysis was carried out at room temperature.
The isocratic mobile phase consisted of acetonitrile and (0.02 M) ammonium acetate buffer (7:3 volume:volume) and 0.1% formic acid, which was delivered at a flow rate of 0.50 mL/minute into the mass spectrometer’s electrospray ionization chamber. Quantitation was achieved by MS/MS detection in the negative ion mode using a MDS Sciex (Ontario, Canada) API-3200 mass spectrometer, equipped with a turbo ion spray interface at 400°C. The ion spray voltage was set at -4,400 V. The common parameters, namely curtain gas, nebulizer gas, collision gas, and auxiliary gas were set at 25 psi, 20 psi, 11 psi, and 30 psi, respectively. The compound parameters of declustering potential, collision energy, entrance potential and collision exit potential were -45 V, -32 V, -6 V, -4 V for rhein and -60 V, -50 V, -12 V, and -3.5 V for fenoterol (IS), respectively. Detection of the ions was performed in the multiple reaction monitoring mode, monitoring the transition of the m/z 282.9 precursor ion to the m/z 238.9 for rhein and m/z 302.0 precursor ion to the m/z 139.0 for IS. Quadrupoles Q1 and Q3 were set on unit resolution. The analytical data were processed by Analyst® Software Version 1.5 (Applied Biosystems product line of Thermo Fisher Scientific).
Pharmacokinetic and statistical analysis
Plasma concentration-time data of rhein was analyzed for each subject by noncompartmental pharmacokinetic models using Kinetica® software version 4.4.1 (Thermo Fisher Scientific Inc.). The peak plasma concentrations (Cmax) and the time of their occurrence (Tmax) were directly obtained from the concentration-time data. The area under the plasma concentration-time curve (AUC) from time zero to the last measured concentration (AUC0−t) was calculated according to the linear trapezoidal rule. The terminal elimination rate constant (λz) was calculated by linear regression of the terminal portion of the natural logarithm of the concentration, ln (Cp), and the elimination half-life was calculated.
Results and discussion
PS, PDI, and ZP
The prepared nanosuspensions formulas had PS values ranging from 308.8–813.6 nm. The effects of type (X1) and concentration (X2) of surfactant on the PS are demonstrated in Figure 1A. Factorial analysis of variance showed a significant effect for concentration of surfactant (X1) on the PS (P=0.0009). The 1% surfactant concentration showed the lowest PS compared with the other concentrations. This could be explained by the decrease in surface tension by increasing the surfactant concentration, which facilitates the size reduction and stabilizes the formed nanoparticles with inhibition of aggregation.35 Moreover, PDI was significantly decreased by increasing the concentration of surfactant (P=0.0015). The lowest PDI value was observed in the presence of 1% surfactant, as shown in Figure 1B. These results are consistent with the previous observations of Zambaux et al who demonstrated that increasing the surfactant concentration leads to a significant decrease in the nanoparticles size and PDI.36 On the other hand, the PS and PDI of the prepared nanosuspensions formulas were not affected by the type of surfactant (P=0.9251 and P=0.4831, respectively).
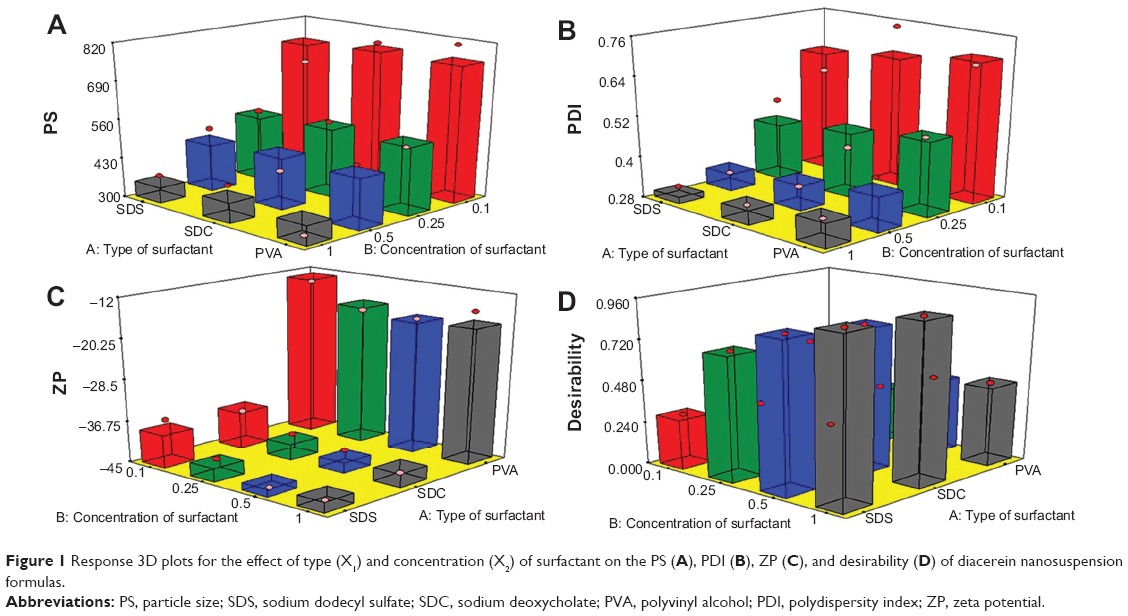 | Figure 1 Response 3D plots for the effect of type (X1) and concentration (X2) of surfactant on the PS (A), PDI (B), ZP (C), and desirability (D) of diacerein nanosuspension formulas. |
High ZP values indicate the physical stability of the prepared nanosuspensions with low probability of aggregation and crystal growth.37 Figure 1C shows the ZP values of the prepared nanosuspension formulas. Since the values of the ZP of all the samples prepared in our study were negative, their changes will be discussed in terms of their absolute values to avoid confusion.9,38
Both type and concentration of surfactant had significant effects on the ZP (P<0.0001 and P=0.0375, respectively). SDC and SDS containing formulas showed significantly higher values, when compared to those containing PVA, especially at the highest surfactant concentration (1%). This might be attributed to the negative charge carried by these anionic surfactants compared to the nonionic surfactant, PVA.35 These results are in agreement with that demonstrated by Han et al who observed that lecithin or SDC, as anionic surfactants, yielded a higher ZP than that produced in the presence of nonionic surfactants like tween or poloxamer 188.39
Analysis of factorial design
The factorial design was used for planning and analysis of experimental trials. The used design was a full 31·41 factorial design with statistical analysis through Design-Expert® Software (Stat-Ease, Inc.). Adequate precision measured the signal-to-noise ratio to ensure that the model can be used to navigate the design space.40 A ratio greater than 4 (the desirable value) was observed in all responses, as shown in Table 3. On the other hand, predicted R2 was calculated as a measure of how good the model predicts a response value.41,42 The adjusted R2 and predicted R2 should be within approximately 0.20 of each other to be in reasonable agreement.43 If they are not, there might be a problem with either the data or the model. It is worthy to note that the predicted R2 values were in a reasonable agreement with the adjusted R2 in all responses.
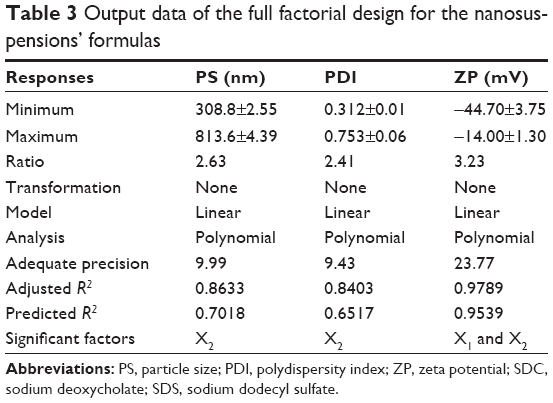 | Table 3 Output data of the full factorial design for the nanosuspensions’ formulas |
For the selection of the optimum formula, it was almost impossible to achieve all the desired responses simultaneously because interference may occur.44 The optimum condition reached in one response may have an opposite impact on another response. Fortunately, the desirability function combines all the responses into one variable to predict the optimum levels for the studied factors.45 So, desirability was calculated to select the optimized formulas with the least PS, PDI, and the highest ZP (as absolute value). The highest desirability values were 0.952 and 0.927 for formulas F8 (containing 1% SDC) and F12 (containing 1% SDS), respectively, as shown in Figure 1D. Hence, these two formulas were selected for further investigations.
Lyophilization of prepared nanosuspensions
Lyophilization was performed to stabilize the prepared nanosuspensions and to prevent their crystal growth.46 The selected lyophilized formulas (F8 and F12) were tested for their PS and PDI, after reconstitution, in the absence and presence of cryoprotectant (mannitol or sucrose). This was done to select the most suitable cryoprotectant that could prevent the aggregation of nanoparticles after lyophilization. Without cryoprotectant, it was evident from Figure 2 that there was a significant increase in both PS and PDI values for the two investigated formulas (P<0.001).
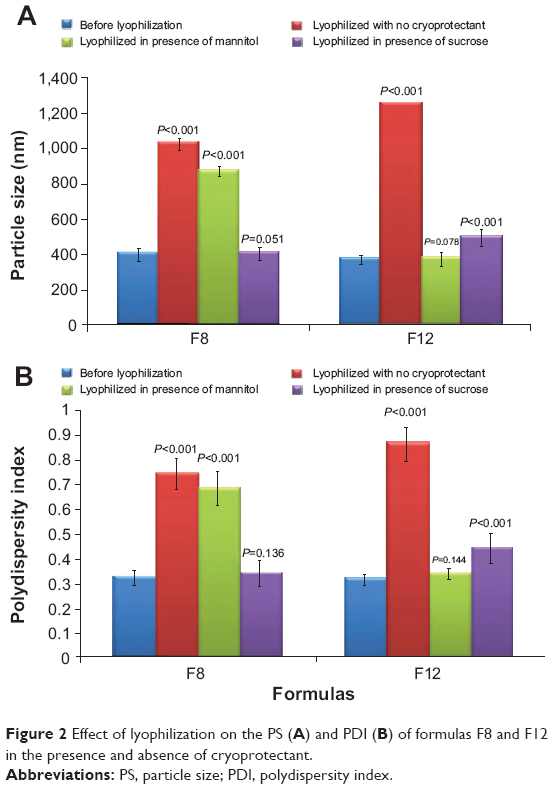 | Figure 2 Effect of lyophilization on the PS (A) and PDI (B) of formulas F8 and F12 in the presence and absence of cryoprotectant. |
Moreover, it could be observed that mannitol protected the nanoparticles of F12 (containing SDS) from aggregation as the PS and PDI values were not significantly different from those before lyophilization (P=0.078 and P=0.144, respectively). On the other hand, sucrose was more suitable than mannitol for protecting the nanoparticles of F8 (containing SDC) as shown by the nonsignificant difference in PS and PDI before and after lyophilization (P=0.051 and P=0.136, respectively).
Determination of saturated solubility
The saturated solubility in the case of F8 and F12 was 1.53-fold and 2.23-fold higher than the coarse drug powder, respectively, as shown in Table 4. The smaller PS and the higher surface area of the nanoparticles are associated with high potential energy, which resulted in an increase in solubility.47 F12 (containing SDS) showed also a significantly higher saturated solubility than F8 (containing SDC) (P<0.001). This could be attributed to the higher hydrophilic-lipophilic balance (HLB) value of SDS (40) when compared with SDC (16).35 This higher HLB value might result in higher solubilization efficiency.48
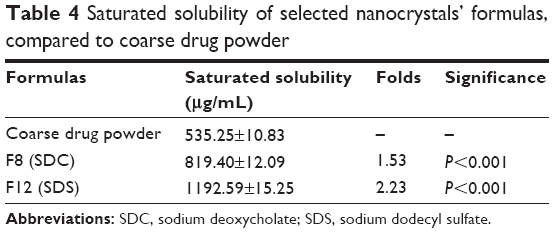 | Table 4 Saturated solubility of selected nanocrystals’ formulas, compared to coarse drug powder |
In vitro dissolution study
The coarse drug powder showed a relatively slow dissolution rate, as 81.37% only was dissolved during the release time (1 hour), as shown in Figure 3. On the other hand, the nanocrystals’ formulas (F8 and F12) exhibited complete and very rapid dissolution. MDT was equal to 13.65 minutes in the case of the coarse drug powder. Formula F8 showed a significant decrease in the MDT to be 4.14 minutes (P<0.001); further decrease also was observed in the case of F12 (1.26 minutes), which was significantly different with both the drug powder and F8 (P<0.001). The f2 was calculated to compare the dissolution profiles of the coarse drug powder with the two formulas F8 and F12, and it was found to be 22.70 and 15.51, respectively. Being lower than 50, this could indicate the presence of a significant difference in the release profiles.29 Besides, F12 had a significantly higher dissolution rate than F8 with f2 equal to 38.82. This might be due to the higher HLB value of SDS compared to SDC as mentioned earlier.
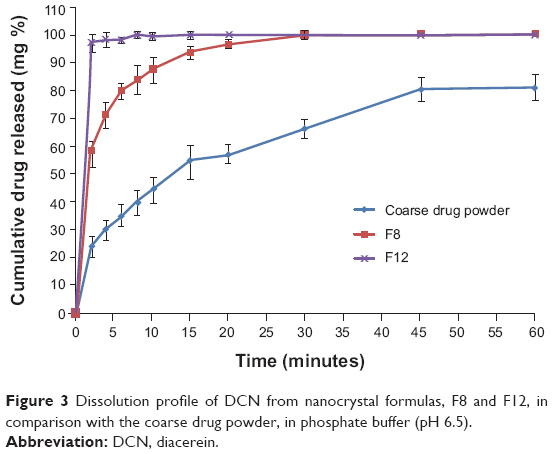 | Figure 3 Dissolution profile of DCN from nanocrystal formulas, F8 and F12, in comparison with the coarse drug powder, in phosphate buffer (pH 6.5). |
The increased surface area described by the Noyes–Whitney equation3,49 and the higher surface-to-volume ratio enabled hydration over a larger surface area and, consequently, resulted in increased drug dissolution.50 Moreover, the increase in the dissolution rate caused due to PS reduction can be explained by the decrease in diffusion layer thickness. According to the Prandtl boundary layer equation for flow passing a flat surface, the hydrodynamic boundary layer thickness (hH) can be expressed as follows:
hH = k (L1/2/V1/2) | (3) |
where L is the length of the surface in the direction of flow, k denotes a constant, and V is the relative velocity of the flowing liquid against the flat surface. It is believed that a difference in particle diameter could correspond to a difference in the parameter L 51 Bisrat and Nyström have shown that, for solids dispersed in a liquid medium under agitation, a decrease in PS probably leads to a decrease in both L and V.52 The net effect is reduced hH.53 This decrease in diffusional thickness h leads to an increase in the concentration gradient (Cs−Ct)/h, which consequently increases the dissolution rate.1
Assessment of crystallinity of nanocrystals
From the previous results, it was observed that the formula F12 (containing SDS) had significantly higher saturated solubility and dissolution rate than the formula F8 (containing SDC). Hence, formula F12 was selected to be characterized by DSC and PXRD.
DSC
DSC was performed to explore the physical changes that occurred in the drug after processing into nanocrystals. It appears from Figure 4 that the drug has a sharp endothermic peak at 254.09°C, indicating its crystallinity. Such a finding coincides with that obtained by Aggarwal and Singh who studied the thermogram of DCN.21 Moreover, the SDS thermogram had endothermic peaks at 105.43°C, 168.52°C, 202.25°C, and 277.56°C. Mannitol had a single characteristic endothermic peak at 167.70°C. The drug characteristic peak disappeared in the thermograms of both physical mixture and F12. This might be referred to the dilution effect of the drug with the excipients, especially in the presence of a wide shoulder for the SDS that might cover the drug peak. Furthermore, there is a possibility for decrease or disappearance of the drug crystallinity.1 Finally, these findings denoted that DSC was not a discriminative tool for explaining the changes that occurred in drug crystals during preparation.
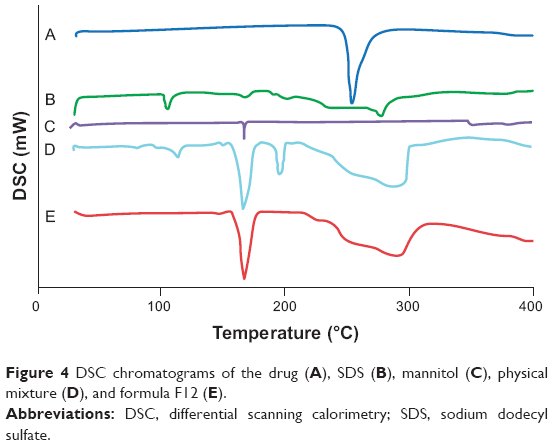 | Figure 4 DSC chromatograms of the drug (A), SDS (B), mannitol (C), physical mixture (D), and formula F12 (E). |
PXRD
X-ray diffraction was utilized to analyze the inner crystalline structure of the coarse drug powder, SDS, mannitol, physical mixture and the formula (F12). DCN had characteristic diffraction peaks at 5.27°, 10.51°, 17.43°, and 27.92°, as shown in Figure 5. On the other hand, SDS had no overlapping peaks with the drug diffractogram, while mannitol had an overlapping peak with drug at 10.45°. Moreover, it was noticed that the drug characteristic peaks were reserved but with diminished intensities in both the physical mixture and the formula F12. This might be due to the dilution effect of excipient used rather than decreased or lack of drug crystallinity.54,55 This result confirmed that the HPH had no effect on the DCN crystalline state, and the enhancement of dissolution rate was due to the reduction of PS and not the appearance of amorphous form. Furthermore, maintenance of the initial crystalline state is advantageous for long-term stability.56
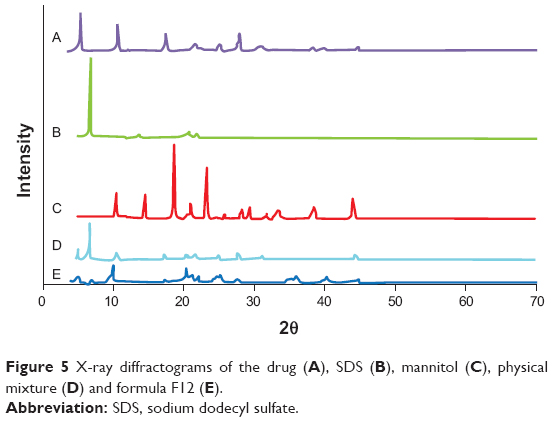 | Figure 5 X-ray diffractograms of the drug (A), SDS (B), mannitol (C), physical mixture (D) and formula F12 (E). |
SEM
The scanning electron micrographs of the selected formula (F12) are shown in Figure 6A. It is clear that the investigated lyophilized matrix possessed a highly porous nature, which led to the rapid penetration of water resulting in rapid drug dissolution. Upon further magnification, as in Figure 6B, lyophilized particles occurred in the form of rods with smooth and uniform surfaces.
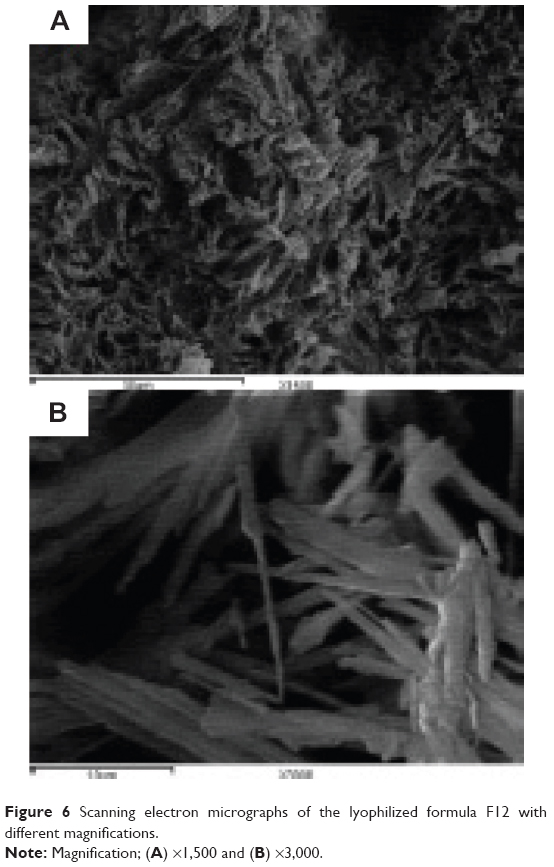 | Figure 6 Scanning electron micrographs of the lyophilized formula F12 with different magnifications. |
Pharmacokinetics study in healthy subjects
All volunteers fully completed the study. No adverse reactions were reported by any of the subjects. The liquid chromatography–mass spectrometry assay has a good linearity from 0.02–4.80 μg/mL with acceptable within- and between-day reproducibility. The lower limit of rhein quantification in plasma was 0.02 μg/mL. The intraday accuracy of the method ranged from 95.4%–104.0% (data not shown) while the intraday precision calculated as coefficient of variation % ranged from 3.7%–12.4%. The interday accuracy ranged from 96.2%–103.1%, while the interday precision ranged from 4.1%–8.7%. The accuracy of freeze and thaw stability ranged from 85.6%–92.7%, while its precision ranged from 3.8%–7.7%.
The rhein mean plasma concentration-time profiles following single oral dose administration of DCN commercial product and F12 lyophilized formula to six healthy human volunteers are shown in Figure 7. Corresponding pharmacokinetic parameters are summarized in Table 5.
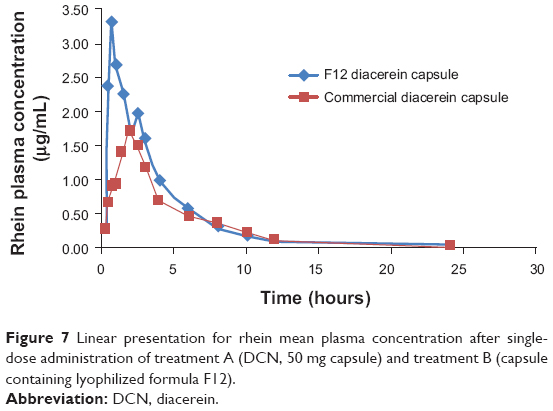 | Figure 7 Linear presentation for rhein mean plasma concentration after single-dose administration of treatment A (DCN, 50 mg capsule) and treatment B (capsule containing lyophilized formula F12). |
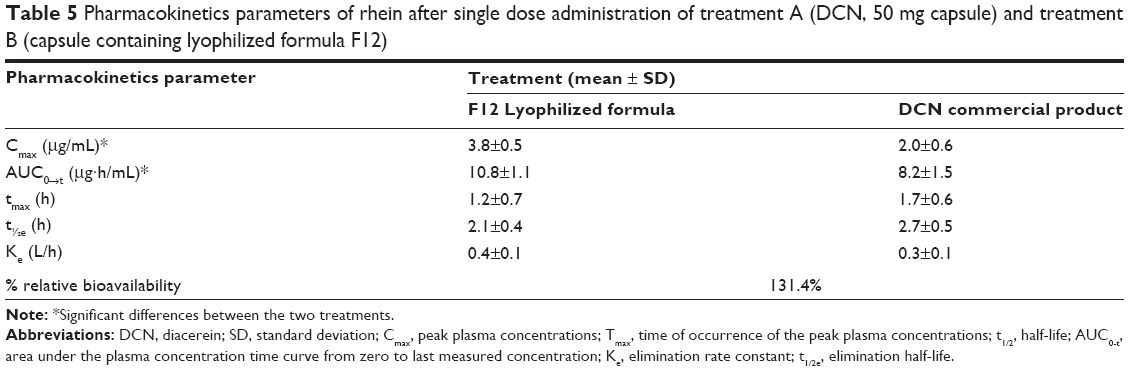 | Table 5 Pharmacokinetics parameters of rhein after single dose administration of treatment A (DCN, 50 mg capsule) and treatment B (capsule containing lyophilized formula F12) |
After oral administration, DCN entirely metabolized into rhein before entering the systemic blood and was rapidly absorbed. The F12 lyophilized capsules reached a significantly higher Cmax of 3.8±0.5 μg/mL at a Tmax of 1.2±0.7 hours, while the commercial product reached a Cmax of 2.0±0.6 μg/mL at a Tmax of 1.7±0.6 hours. In parallel with the Cmax, the mean AUC values after oral administration of F12 lyophilized formula showed significantly higher values compared to the commercial DCN capsules of 10.8±1.1 μg·hour/mL and 8.2±1.5 μg·hour/mL, respectively, which resulted in a relative bioavailability of 131.4%. However, there was no significant difference (P<0.001) in the rate of drug absorption from the two treatments in terms of Tmax. In addition the elimination half-life (t1/2) and the elimination rate constant (Ke) showed no significant differences between the two treatments.
DCN is classified as Biopharmaceutics Classification System class II with high permeability and low solubility, as previously mentioned.23 The poor dissolution characteristic of DCN has long been a problem to the pharmaceutical industry, and it still remains so, because the dissolution rate is the rate-limiting step in the absorption of a drug from a solid dosage form. Increasing DCN’s saturated solubility and dissolution rate resulted in a higher extent of absorption and an improvement in the total drug exposure in the treated subjects.
Conclusion
Combined bottom-up/top-down technique could be considered as a promising approach for nanocrystallization of poorly soluble drugs. The nanocrystals of DCN were successfully prepared by HPH using only five cycles at 1,000 bar after a simple bottom-up step. The saturation solubility and in vitro dissolution rate of the DCN nanocrystals were significantly increased compared to coarse drug powder. Moreover, the relative bioavailability of the optimized formula was found to be 131.4%, compared to the DCN market product.
Disclosure
The authors report no conflicts of interest in this work.
References
Abdelbary AA, Li X, El-Nabarawi M, Elassasy A, Jasti B. Comparison of nanomilling and coprecipitation on the enhancement of in vitro dissolution rate of poorly water-soluble model drug aripiprazole. Pharm Dev Technol. 2014;19(4):491–500. | ||
Lipinski CA. Poor aqueous solubility – an industry wide problem in drug discovery. American Pharmaceutical Review. 2002;5:82–85. | ||
Kesisoglou F, Panmai S, Wu Y. Nanosizing – oral formulation development and biopharmaceutical evaluation. Adv Drug Deliv Rev. 2007;59(7):631–644. | ||
Chen Y, Zhang GG, Neilly J, Marsh K, Mawhinney D, Sanzgiri YD. Enhancing the bioavailability of ABT-963 using solid dispersion containing Pluronic F-68. Int J Pharm. 2004;286(1–2):69–80. | ||
Ali SM, Upadhyay SK, Maheshwari A. NMR spectroscopic study of the inclusion complex of desloratadine with β-cyclodextrin in solution. J Incl Phenom Macrocycl Chem. 2007;59(3–4):351–355. | ||
Chaumeil JC. Micronization: a method of improving the bioavailability of poorly soluble drugs. Methods Find Exp Clin Pharmacol. 1998;20(3):211–215. | ||
Van Eerdenbrugh B, Vermant J, Martens JA, et al. Solubility increases associated with crystalline drug nanoparticles: methodologies and significance. Mol Pharm. 2010;7(5):1858–1870. | ||
Rabinow BE. Nanosuspensions in drug delivery. Nat Rev Drug Discov. 2004;3(9):785–796. | ||
Abdelbary AA, Li X, El-Nabarawi M, Elassasy A, Jasti B. Effect of fixed aqueous layer thickness of polymeric stabilizers on zeta potential and stability of aripiprazole nanosuspensions. Pharm Dev Technol. 2013;18(3):730–735. | ||
Müller RH, Möschwitzer J, Bushrab FN. Manufacturing of nanoparticles by milling and homogenization techniques. In: Gupta RB, Kompella UB, editors. Nanoparticle Technology for Drug Delivery (Drugs and the Pharmaceutical Sciences). Book 159. New York: CRC Press; 2006:21–51. | ||
Ali HS, York P, Blagden N. Preparation of hydrocortisone nanosuspension through a bottom-up nanoprecipitation technique using microfluidic reactors. Int J Pharm. 2009;375(1–2):107–113. | ||
Van Eerdenbrugh B, Vermant J, Martens JA, et al. A screening study of surface stabilization during the production of drug nanocrystals. J Pharm Sci. 2009;98(6):2091–2103. | ||
Van Eerdenbrugh B, Van den Mooter G, Augustijns P. Top-down production of drug nanocrystals: nanosuspension stabilization, miniaturization and transformation into solid products. Int J Pharm. 2008;364(1):64–75. | ||
Müller RH, Jacobs C. Buparvaquone mucoadhesive nanosuspension: preparation, optimisation and long-term stability. Int J Pharm. 2002;237(1–2):151–161. | ||
Müller RH, Bohm BHL. Nanosuspensions. In: Müller RH, Benita S, Bohm BH, editors. Emulsions and Nanosuspensions for the Formulation of Poorly Soluble Drugs: Stuttgart: Medpharm GmbH Scientific Publishers; 1998:149–174. | ||
Patravale VB, Date AA, Kulkarni RM. Nanosuspensions: a promising drug delivery strategy. J Pharm Pharmacol. 2004;56(7):827–840. | ||
Krause KP, Müller RH. Production and characterisation of highly concentrated nanosuspensions by high pressure homogenisation. Int J Pharm. 2001;214(1–2):21–24. | ||
Chingunpituk J. Nanosuspension technology for drug delivery. Walailak Journal of Science and Technology. 2007;4(2):139–153. | ||
Toegel S, Huang W, Piana C, et al. Selection of reliable reference genes for qPCR studies on chondroprotective action. BMC Mol Biol. 2007;8:13. | ||
O’Neil MJ, Heckelman PE, Koch CB. The Merck Index, An Encyclopedia of Chemicals: Drugs and Biologicals. 14th ed. Whitehouse Station, NJ: Merck Research Laboratories; 2006. | ||
Aggarwal AK, Singh S. Physicochemical characterization and dissolution study of solid dispersions of diacerein with polyethylene glycol 6000. Drug Dev Ind Pharm. 2011;37(10):1181–1191. | ||
Nicolas P, Tod M, Padoin C, Petitjean O. Clinical pharmacokinetics of diacerein. Clin Pharmacokinet. 1998;35(5):347–359. | ||
Jain A, Singh SK, Singh Y, Singh S. Development of lipid nanoparticles of diacerein, an antiosteoarthritic drug for enhancement in bioavailability and reduction in its side effects. J Biomedl Nanotechnol. 2013;9(5):891–900. | ||
Batt DK, Garala KC. Preparation and evaluation of inclusion complexes of diacerein with β-cyclodextrin and hydroxypropyl β-cyclodextrin. J Incl Phenom Macrocycl Chem. 2013;77(1–4):471–481. | ||
Maski N, Kumaran A, Girhepunje K, Ghode P, Randive S, Pal R. Studies on the preparation, characterization and solubility of β-cyclodextrin/diacerein inclusion complexes. International Journal of Pharmacy and Pharmaceutical Sciences. 2009;1(2):121–135. | ||
Abdelbary AA, Elshafeey AH, El-Nabarawi M, Elassasy A, Li X, Jasti B. Comparative in vivo evaluation of aripiprazole coprecipitate, nanoparticles and marketed tablets in healthy human volunteers and in vitro-in vivo correlation. Current Trends in Biotechnology and Pharmacy. 2011;5(4):1397–1409. | ||
Xu Y, Liu X, Lian R, et al. Enhanced dissolution and oral bioavailability of aripiprazole nanosuspensions prepared by nanoprecipitation/homogenization based on acid-base neutralization. Int J Pharm. 2012;438(1–2):287–295. | ||
Hecq J, Deleers M, Fanara D, Vranckx H, Amighi K. Preparation and characterization of nanocrystals for solubility and dissolution rate enhancement of nifedipine. Int J Pharm. 2005;299(1–2):167–177. | ||
Costa P, Sousa Lobo JM. Modeling and comparison of dissolution profiles. Eur J Pharm Sci. 2001;13(2):123–133. | ||
Gao B, Wang J, Wang D, et al. A novel preparation method for drug nanocrystals and characterization by ultrasonic spray-assisted electrostatic adsorption. Int J Nanomedicine. 2013;8:3927–3935. | ||
Sun J, Wang F, Sui Y, et al. Effect of particle size on solubility, dissolution rate, and oral bioavailability: evaluation using coenzyme Q10 as naked nanocrystals. Int J Nanomedicine. 2012;7:5733–5744. | ||
Rahman Z, Zidan AS, Khan MA. Risperidone solid dispersion for orally disintegrating tablet: its formulation design and non-destructive methods of evaluation. Int J Pharm. 2010;400(1–2):49–58. | ||
World Medical Association. World Medical Association Declaration of Helsinki: ethical principles for medical research involving human subjects. JAMA. 2013;310(20):2191–2194. | ||
Smith PF. Third international conference on harmonization of technical requirements for registration of pharmaceuticals for human use – a toxicologist’s perspective. Toxicol Pathol. 1996;24(4):519–528. | ||
Rowe RC, Sheskey PJ, Quinn ME. Handbook of Pharmaceutical Excipients. 6th ed. NY: Pharmaceutical Press; 2009. | ||
Zambaux MF, Bonneaux F, Gref R, et al. Influence of experimental parameters on the characteristics of poly(lactic acid) nanoparticles prepared by a double emulsion method. J Control Release. 1998;50(1–3):31–40. | ||
Yu W, Xie H. A review on nanofluids: preparation, stability mechanisms, and applications. Journal of Nanomaterials. 2012;2012:1. | ||
de Laat AWM, Bijsterbosch HD, Cohen Stuart MA, Fleer GJ, Struijk CW. Solvency effects in polymer layers studied by electrokinetics: PVME as homopolymer and in an anionic diblock copolymer adsorbed on SiO2. Colloids Surf A: Physicochem Eng Asp. 2000;166(1–3):79–89. | ||
Han F, Li S, Yin R, Liu H, Xu L. Effect of surfactants on the formation and characterization of a new type of colloidal drug delivery system: Nanostructured lipid carriers. Colloids Surf A: Physicochem Eng Asp. 2008;315(1–3):210–216. | ||
de Lima LS, Araujo MDM, Quináia SP, Migliorine DW, Garcia JR. Adsorption modeling of Cr, Cd and Cu on activated carbon of different origins by using fractional factorial design. Chem Eng J. 2011;166(3): 881–889. | ||
Kaushik R, Saran S, Isar J, Saxena RK. Statistical optimization of medium components and growth conditions by response surface methodology to enhance lipase production by Aspergillus carneus. J Mol Catal B Enzym. 2006;40(3–4):121–126. | ||
Chauhan B, Gupta R. Application of statistical experimental design for optimization of alkaline protease production from Bacillus sp. RGR-14. Process Biochemistry. 2004;39(12):2115–2122. | ||
Annadurai G, Ling LY, Lee JF. Statistical optimization of medium components and growth conditions by response surface methodology to enhance phenol degradation by Pseudomonas putida. J Hazard Mat. 2008;151(1):171–178. | ||
Singh G, Pai RS, Devi VK. Optimization of pellets containing solid dispersion prepared by extrusion/spheronization using central composite design and desirability function. J Young Pharm. 2012;4(3):146–156. | ||
Pandya VM, Patel JK, Patel DJ. Formulation and optimization of nanosuspensions for enhancing simvastatin dissolution using central composite design. Dissolution Technologies. 2011;18(3):40–45. | ||
Mauludin R, Müller RH, Keck CM. Development of an oral rutin nanocrystal formulation. Int J Pharm. 2009;370(1–2):202–209. | ||
Judefeind A, de Villiers MM. Drug loading into and in vitro release from nanosized drug delivery systems. In: de Villiers MM, Aramwit P, Kwon GS, editors. Nanotechnology in Drug Delivery. NY: Springer; 2009:129–162. | ||
Kunieda H, Sato Y. Recent progress on HLB system. In: Friberg SE, Lindmann B, eds. Organized Solutions: Surfactants in Science and Technology. Volume 44. NY: CRC Press; 1992:67–88. | ||
Junghanns JU, Müller RH. Nanocrystal technology, drug delivery and clinical applications. Int J Nanomedicine. 2008;3(3):295–309. | ||
Dolenc A, Kristl J, Baumgartner S, Planinsek O. Advantages of celecoxib nanosuspension formulation and transformation into tablets. Int J Pharm. 2009;376(1–2):204–212. | ||
Mosharraf M, Nyström C. The effect of particle size and shape on the surface specific dissolution rate of microsized practically insoluble drugs. Int J Pharm. 1995;122(1–2):35–47. | ||
Bisrat M, Nyström C. Physicochemical aspects of drug release. VIII. The relation between particle size and surface specific dissolution rate in agitated suspensions. Int J Pharm. 1988;47(1–3):223–231. | ||
Niebergall PJ, Milosovich G, Goyan JE. Dissolution rate studies. II. Dissolution of particles under conditions of rapid agitation. J Pharm Sci. 1963;52:236–241. | ||
Hong SB, Hwang BW, Yeom Y, Kim SJ, Uh YS. Chemical interactions of aluminophosphate molecular sieve with vanadium oxide. In: Inui T, Namba S, Tatsumi T, editors. Chemistry of Microporous Crystals. Amsterdam: Elsevier; 1991:179–187. | ||
Sachan NK, Pushkar S, Ghosh SK. Evaluation of assam bora rice as a natural mucoadhesive matrixing agent for controlled drug delivery. In: Khemani LD, Srivastava MM, Srivastava S, editors. Chemistry of Phytopotentials: Health, Energy and Environmental Perspectives. NY: Springer; 2012:165–170. | ||
Gao L, Zhang D, Chen M, Zheng T, Wang S. Preparation and characterization of an oridonin nanosuspension for solubility and dissolution velocity enhancement. Drug Dev Ind Pharm. 2007;33(12): 1332–1339. |
 © 2014 The Author(s). This work is published and licensed by Dove Medical Press Limited. The full terms of this license are available at https://www.dovepress.com/terms.php and incorporate the Creative Commons Attribution - Non Commercial (unported, v3.0) License.
By accessing the work you hereby accept the Terms. Non-commercial uses of the work are permitted without any further permission from Dove Medical Press Limited, provided the work is properly attributed. For permission for commercial use of this work, please see paragraphs 4.2 and 5 of our Terms.
© 2014 The Author(s). This work is published and licensed by Dove Medical Press Limited. The full terms of this license are available at https://www.dovepress.com/terms.php and incorporate the Creative Commons Attribution - Non Commercial (unported, v3.0) License.
By accessing the work you hereby accept the Terms. Non-commercial uses of the work are permitted without any further permission from Dove Medical Press Limited, provided the work is properly attributed. For permission for commercial use of this work, please see paragraphs 4.2 and 5 of our Terms.