")
Back to Journals » International Journal of Nanomedicine » Volume 15
Nanomicellar Lenalidomide–Fenretinide Combination Suppresses Tumor Growth in an MYCN Amplified Neuroblastoma Tumor
Authors Orienti I , Farruggia G , Nguyen F , Guan P, Calonghi N, Kolla V , Chorny M , Brodeur GM
Received 13 May 2020
Accepted for publication 18 August 2020
Published 16 September 2020 Volume 2020:15 Pages 6873—6886
DOI https://doi.org/10.2147/IJN.S262032
Checked for plagiarism Yes
Review by Single anonymous peer review
Peer reviewer comments 4
Editor who approved publication: Prof. Dr. Anderson Oliveira Lobo
Isabella Orienti,1 Giovanna Farruggia,1 Ferro Nguyen,2 Peng Guan,2 Natalia Calonghi,1 Venkatadri Kolla,2 Michael Chorny,2 Garrett M Brodeur2
1Department of Pharmacy and Biotechnology, University of Bologna, Bologna 40127, Italy; 2Divisions of Oncology and Cardiology, Children’s Hospital of Philadelphia, Philadelphia, PA 19104, USA
Correspondence: Isabella Orienti Email [email protected]
Purpose: In a previous study, we demonstrated that the combination of fenretinide with lenalidomide, administered by a novel nanomicellar formulation (FLM), provided a strong antitumor effect in a neuroblastoma TrkB-expressing tumor. In this study, we tested the nanomicellar combination in an MYCN amplified neuroblastoma xenograft to assess its efficacy in different tumor genotypes and evaluate the interactions of the nanomicelles with the tumor cells.
Experimental Design: FLM was administered to mice bearing human NLF xenografts to evaluate its efficacy in comparison with the nanomicelles containing fenretinide alone (FM). Confocal laser-scanning fluorescence microscopy images of the NLF cells treated with FLM and FM allowed us to estimate the nanomicelle ability to transport the encapsulated drugs inside the tumor cells. Flow cytometric analysis of the cells from treated tumors was performed to assess the effect of treatment on GD2 expression and NK cell infiltration.
Results: FLM and FM decreased the growth of NLF xenografts at comparable extents during the treatment period. Afterwards, FLM induced a progressive tumor regression without regrowth, while FM treatment was followed by regrowth within 15– 20 days after the end of treatment. Both FLM and FM were able to penetrate the tumor cells transporting the encapsulated drugs. FLM transported higher amount of fenretinide inside the cells. Also, FLM treatment strongly increased GD2 expression in treated tumors and slightly decreased the NK infiltration compared to FM.
Conclusion: FLM treatment induced a superior antitumor response than FM in NLF xenografts, presumably due to the combined effects of fenretinide cytotoxicity and lenalidomide antiangiogenic activity. The ability of FLM to penetrate tumor cells, transporting the encapsulated drugs, substantially improved the therapeutic efficiency of this system. Moreover, the enhancement of GD2 expression in FLM treated tumors offers the possibility to further increase the antitumor effect by the use of anti-GD2 CAR-T cells and anti-GD2 antibodies in combination with FLM in multimodal therapies.
Keywords: nanomicelles, fenretinide–lenalidomide combination, neuroblastoma, antitumor activity, nanomicelle penetration in tumor cells, GD2 increased expression.
Introduction
Neuroblastoma (NB) is a tumor of the sympathetic nervous system that accounts for about 8% of childhood cancers. In high-risk NB, more than 50% of patients develop recurrent multidrug-resistant disease and die, due to the persistence of minimal residual disease (MRD), in spite of intensive, multimodality therapy.1,2 Therefore, new antitumor treatments, active against recurrent, multidrug-resistant NB are needed to improve survival.
Many approaches are currently being developed including immunotherapy, gene therapy, combination and repositioning therapy.3,4 Another approach is the enhanced delivery of drugs to solid tumors using nanoparticulate drug carriers. Nanoparticles selectively accumulate in solid tumors due to their ability to extravasate through the capillary discontinuities generated by tumor angiogenesis. Their accumulation may increase the drug concentration in the tumor environment, thus improving its pharmacological efficiency. In addition, the selective accumulation in tumors may significantly reduce the toxicity associated with the uncontrolled drug body-distribution that occurs with conventionally administered antitumor drugs.5 Nanoparticles loaded with selected antitumor agents able to attack NB by different mechanisms, are regarded with increasing interest for the lack of off-target toxicity and the possibility of long-term administration (months or years) until complete eradication of the tumor cells. Nanoparticles loaded with combinations of two or more alternative antitumor agents represent a novel bio-nanomedicine approach aimed at increasing therapeutic efficacy based on the combined effect of different agents carried together to the tumor site in high concentrations by the ability of the nanoparticulate carriers to accumulate in tumors.6
Among the alternative antitumor agents, N‐(4‐hydroxyphenyl) retinamide (fenretinide), is particularly interesting for its antitumor activity and low toxicity profile. Fenretinide is active in NB7–10 and many other cancer types11–16 by multiple mechanisms,17–22 and it has shown efficacy against cancer stem cells.23–28 Lenalidomide is another alternative antitumor agent currently used in the post-consolidation maintenance therapy of multiple myeloma and other hematological malignances. We selected lenalidomide to combine with fenretinide for its antiangiogenic properties and its acceptable toxicity profile.29–33
Both drugs were encapsulated in novel nanomicelles based on a phospholipid: glyceryl tributyrate: 2-hydroxypropyl beta cyclodextrin mixture prepared by an innovative method.34 Previously, we demonstrated that nanomicelles containing the fenretinide–lenalidomide combination (FLM) provided a strong antitumor effect in an NB xenograft model (BR6) driven by TrkB overexpression. The effect was greater than nanomicelles containing fenretinide alone (FM). This was attributed to the antiangiogenic effect of lenalidomide that together with the cytotoxic activity of fenretinide produced an improved overall antitumor response.34 In this study, we tested FLM in a different NB xenograft model to assess its efficacy in a challenging NB genotypic subset. We used the NLF NB cell line that is characterized by MYCN amplification, a distinct genotype from the single-copy NB driven by TrkB. NLF cells also have low GD2 expression and high metastatic ability.35
Moreover, NLF cells, like many high-risk NBs, may induce a tolerogenic immune environment due to their significant immunosuppressive activity, mainly based on inhibition of dendritic cell differentiation and activation.36
Materials and Methods
Chemicals
N-4-hydroxyphenyl-retinamide (fenretinide, 4-HPR) was purchased from Olon Spa (Milan Italy); lenalidomide from AstaTech Inc (PA, USA); soy L-α-phosphatidylcholine, glyceryl tributyrate, 2-hydroxypropyl beta cyclodextrin (Mw 1460) and KOH from Sigma-Aldrich; ethanol absolute anhydrous from Carlo Erba Reagents (Milan Italy).
Nanomicelle Preparation
Nanomicelle preparation and characterization were carried out as previously described,34 with some minor modifications. Briefly, soy phosphatidylcholine (4 mmoles), glyceryl tributyrate (2 mmoles) and KOH 10 N (400 µL, 4 mmoles) were mixed with 2-hydroxypropyl beta cyclodextrin (0.8 mmoles) to obtain a semisolid phase. Mixing to homogeneity was carried out by pressure and friction in a mortar grinder (RM 200 Retsch Verder Italy) at 37°C for 30 minutes at 100 min−1 rate. Fenretinide (1 mmole) was dissolved in ethanol (300 µL) and KOH 10 N (100 µL, 1 mmole) and was subsequently added to the mixture. Homogenization was carried out in the mortar grinder for 30 minutes. Afterwards, lenalidomide (0.5 mmoles) was added, and mixing was continued for other 30 minutes. The resultant semisolid phase was dissolved in water (50 mg/mL) at 37°C and filtered through 0.4 µm and 0.2 µm cellulose acetate filters (Fisher Scientific) to obtain a final dispersion of the fenretinide–lenalidomide-loaded nanomicelles (FLM) suitable for in-vivo use. Nanomicelles without drugs (Mo) or containing fenretinide alone (FM) were prepared by the same procedure.
Drug Content in the Nanomicells
The drug content was evaluated in the nanomicelle dispersion diluted (1:3 v:v) with an ethanol:water (1:1, v:v) mixture and analyzed by UV spectroscopy (Shimadzu UV-1601) at 360 nm for fenretinide and 250 nm for lenalidomide in comparison with the empty nanomicelles.34
The concentrations obtained represented the drugs encapsulated in the nanomicelles and free in the aqueous phase. Therefore, to obtain the concentrations of free drugs, the nanomicelle dispersion was centrifuged in a 3.5 mL Ultra 5 KDa filter (Merck Millipore) at 4000 x g for 30 min, and the ultrafiltrate was spectrophotometrically analyzed for drug content, after dilution 1:3 with an ethanol:water (1:1, v:v) mixture. The difference between the whole drug concentration in the nanomicelle suspension and in the ultrafiltrate provided the concentration of the encapsulated drugs. The drug loading was obtained as the ratio between the concentration (w:v) of the encapsulated drug and the concentration (w:v) of the nanomicelle dispersion.34
Characterization of the Nanomicells
Particle size, polydispersity and zeta potential were measured at 37°C on the nanomicelle dispersions diluted 1:400 (v:v) with pH 7.4 or pH 6.0 phosphate buffer saline (PBS) (Malvern Instruments, Worcestershire, UK). A minimum of 12 measurements per sample were made. Results were the combination of three 10-minute runs for a total accumulation correlation function time of 30 minutes. The results were volume-weighted.
Stability of the Nanomicelles Towards Drug Leakage
Stability of the nanomicelles towards drug leakage was measured by dialysis at 37°C. The nanomicelle dispersion was diluted 1:10 (v:v) with pH 7.4 or pH 6.0 PBS containing 25% human plasma and placed in a dialysis bag (Mw cutoff 5KD) (Fisher Scientific) immersed in a receiving compartment containing the same PBS (pH 7.4 or pH 6.0) as the releasing phase. N-octanol 5% (v:v) was added to the receiving compartment to serve as a drug-extractive phase simulating the presence of cell membranes in vivo (47). Spectrophotometric analysis in the releasing phase was made at increasing time intervals, as described above.
Cell Lines
NLF cells were used for the in vitro experiments. We tested the integrity and authenticity of these cell lines for endotoxins, mycoplasma, bacterial and other viral contaminations as well as genetic authenticity by multiplex PCR techniques. These tests were performed on an annual basis at the cell center services facility of the University of Pennsylvania. Cells were grown in RPMI-1640 medium (Gibco) containing 10% fetal bovine serum (Cellgro) and maintained in 150 cm3 culture flasks (Corning) in a humidified atmosphere of 95% air and 5% CO2. Cells were harvested using 0.02% tetrasodium EDTA in PBS.
Cell Proliferation
The effect of FLM on cell proliferation was evaluated in comparison with FM and pure fenretinide (Fen). We plated 8 x 10³ cells per well in 96 well plates and allowed them to adhere. After 24 h, the cells were exposed to FLM and FM concentrations corresponding to 10, 20, 30 μM fenretinide for 24 h. As a blank, the empty nanomicelles were tested at the same concentrations as the nanomicelles loaded with the drugs. Fenretinide and lenalidomide were tested at concentrations comparable with those contained in the nanomicelles. The free drugs were dissolved in ethanol at 50 mM and diluted with cell medium to the final experimental concentrations. Cells treated with the same ethanol dilutions were used as controls. To assess the antiproliferative effect of FLM and FM over time, we treated the cells at 10 µM for 24 h, then washed and left them in fresh medium for 24 and 48 h after treatment. The viability of the cells was measured by Incucyte live cell imaging system (Essen BioScience, MI, USA) using the image analysis software for confluence (S3 Base Software). All the data were expressed as percentage versus control cells (100%).
Determination of ROS Production
The NLF cells (1 × 10⁶) were treated with FLM, FM and free fenretinide at concentrations corresponding to 10 µM fenretinide, for 3 or 24 hours. ROS production was evaluated by staining the cells with dihydrodichlorofluoresceinediacetate (H2DClFDA) 1 µM for 30 min at 37°C, washing and resuspending in propidium iodide (PI) 5 µg/mL in PBS to selectively stain dead cells. H2DClFDA was entrapped within the cells by cellular esterase and converted to fluorescent dichlorofluorescein (DClF) by the action of ROS. Flow cytometry data were acquired using a BD Accuri™ C6 Flow Cytometer. The yielded fluorescences were acquired and plotted on a logarithmic scale, and DClF production was gated on viable cells (PI negative). The percentage of PI-negative cells was used to evaluate cell viability.
Mitochondrial Membrane Potential
The NLF cells (1 × 10⁶) were treated with FLM, FM and free fenretinide at concentrations corresponding to 10 µM fenretinide, for 3 or 24 hours. The mitochondrial membrane potential was evaluated by incubating the cells with JC1 1.5 μM for 15 min at 37°C, washing and analyzing by BD Accuri™ C6 Flow Cytometer. The red and the green fluorescence were collected on a logarithmic scale. Mitochondrial membrane depolarization was indicated by a decrease in the red (590 ± 10 nm) to green (525 ± 25 nm) fluorescence intensity ratio.
Confocal Laser-Scanning Fluorescence Microscopy (CLSFM)
NFL cells were treated with FLM, FM or free fenretinide at concentrations corresponding to 30 µM fenretinide for 3 h. Nuclei were stained with 1µg/mL Hoechst 33342 for 30 min at 37°C in the dark. The cells were subsequently washed with PBS three times, fixed with 3% formaldehyde for 10 min at room temperature, washed repeatedly with 0.1 M glycine/PBS and 1% BSA/PBS. Specimens were embedded in Mowiol and analyzed using a Nikon C1s confocal laser-scanning microscope, equipped with a Nikon PlanApo 40, 1.4-NA oil immersion lens. Fenretinide was excited at 405 nm with an argon laser and emission was recorded 650 nm. The images were analyzed by Image J Software. One-way analysis of variance (ANOVA) followed by the Bonferroni Multiple Comparison Test (GraphPadPrism, GraphPad software Inc., CA, USA) was used to analyze the data.
Mice
We obtained six-week-old female athymic nude mice from Jackson Laboratories. Mice were maintained under humidity- and temperature-controlled conditions in a light/dark cycle that was set at 12-hour intervals. The Institutional Animals Care and Use Committee of the Children’s Hospital of Philadelphia Research Institute approved the mouse xenograft studies described in this report (IAC 18–000897 _ AR01 protocol #897). The studies were conducted in accordance with all international, USDA, PHS, AAALAC, state, and local rules and regulations and ethical principles regarding the use of animal subjects in research.
Flank Xenograft Experiments
Female athymic nude mice were injected subcutaneously in the right flank with (1 x 10⁷) NLF cells suspended in 0.1 mL of Matrigel (Corning, Tewksbury, MA). Tumors were measured manually 2x/week in two dimensions (mm) using a caliper. The tumor volume was calculated as follows: [(0.523 x L x W2)/1000)] where L > W. The relative tumor volume (V/Vo) was obtained by the ratio between the tumor volume on the measured day (V) and the tumor volume on day 0 (Vo). Body weights were obtained 2 or 3x/week, and treatment doses adjusted if there was a >10% change in body weight. When tumors reached a mean volume of 0.1 cm3 the mice were treated with FLM or FM by IV (tail vein) 3 times/week for 4 weeks at the dose of 30 mg/kg fenretinide and 17 mg/kg lenalidomide. At the end of treatment, one group of mice was maintained in observation to evaluate the tumor growth after treatment withdrawal. Another group was sacrificed, and the tumors were collected for determination of GD2 expression and NK infiltration.
Determination of GD2 Expression and Tumor-Infiltrating NK Cells
Surface expression of GD2 and the amount of infiltrating NK cells were determined by flow cytometric analysis on live cells isolated from the tumors. The isolation of tumor cells was performed according to a previously reported method.37 Briefly, tumor cells were dissociated and the cell suspension, passed through a 70-μm cell strainer, was washed twice in complete IMDM. Red blood cells were removed by incubation with ACK lysis buffer (0.15 M NH4Cl, 10 mM KHCO3, and 0.1 mM EDTA) in distilled water for 5 min at room temperature. Cells were washed twice again in complete IMDM, and dead cells were removed by density gradient centrifugation using Ficoll (400Å~g without brake for 30 min at 4°C). To determine GD2 expression, isolated cells (1 x 10⁶) were stained for 15 min with 1 μg ch14.18/CHO followed by incubation for 15 min with a phycoerythrin (PE)-labeled anti-human IgG secondary antibody at a dilution of 1:5 (cat. no. 555787, BD Biosciences, San Jose, CA, USA). In order to exclude dead cells from the analysis, cells were stained with 4 μL 4′,6-diamidino-2-phenylindole (DAPI; 0.1 μg/mL), which was added shortly before analysis. For each cell sample, 80000 live cells were analyzed by BD Accuri™ C6 Flow Cytometer using FlowJo software version 10.1. The amount of tumor-infiltrating NK cells was determined in the isolated cells (1 x 10⁶) by staining with 1 μL of an anti-mouse NK1.1 fluorescein isothiocyanate (FITC)-conjugated antibody (cat. no. 553164, BD Biosciences) for 45 min. As an isotype control, we used an FITC-labeled mouse IgG2A, K isotype antibody (cat. no. 553456, BD Biosciences). After incubation with the antibody, cells were washed two times, counterstained with DAPI and analyzed by flow cytometry as described above.
Statistical Analysis
All assays were performed at least in triplicate and expressed as mean ± SD. Statistical significance was determined by unpaired Student’s t-test. The data were analyzed by SPSS 20.0 software. Group differences were considered statistically significant when p < 0.05.
Results
Characterization of the Nanomicelles
The nanomicelles containing the fenretinide–lenalidomide combination were formulated by dissolution in water of the semisolid mixture made by phospholipids: drugs: glyceryl tributyrate: 2-hydroxypropyl beta cyclodextrin, as described previously.34 The spontaneous self-assembling in water of the mixture components triggers nanomicelle formation and drug inclusion in the amphiphilic matrix (Figure 1). The mean size and zeta potential of the nanomicelles were evaluated in pH 7.4 and pH 6.0 PBS to simulate both the physiological pH and the acidic pH of the tumor microenvironment. The mean diameter of the nanomicelles was optimally sized for tumor accumulation by the EPR effect (from a minimum of 235.3 ± 1.9 nm for FM at pH 6.0, to a maximum of 306.3 ± 3.2 nm for FLM at pH 7.4). At each pH, the mean size of FLM was slightly higher than FM. Polydispersity was always lower than 0.4, indicating good dimensional homogeneity. The zeta potentials were negative at either pH with similar values for FLM and FM. The pH decrease provided a decrease in the mean size and the zeta potential values in both systems (Table 1).
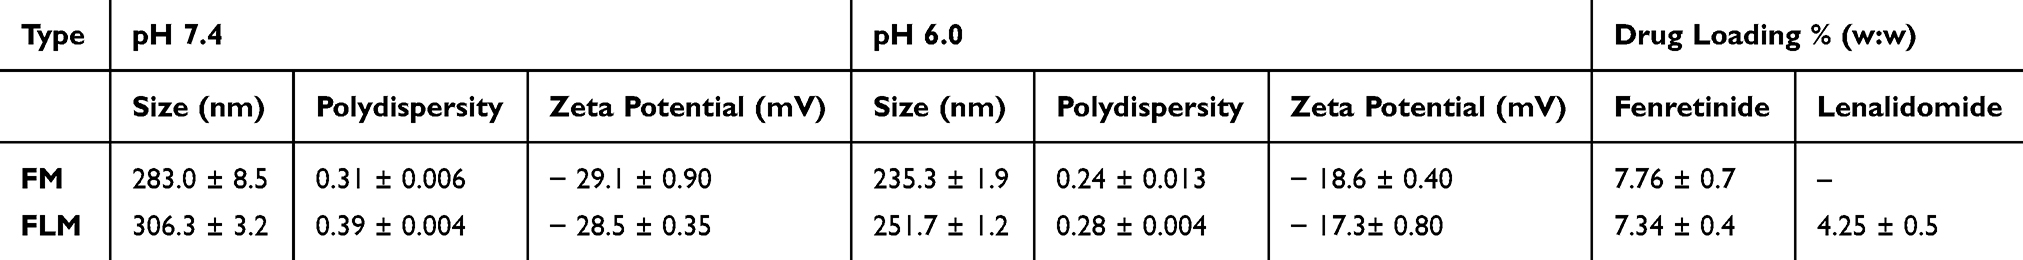 |
Table 1 Physicochemical Characteristics of Nanomicellar Fenretinide-Lenalidomide Combination (FLM) and Nanomicellar Fenretinide (FM) |
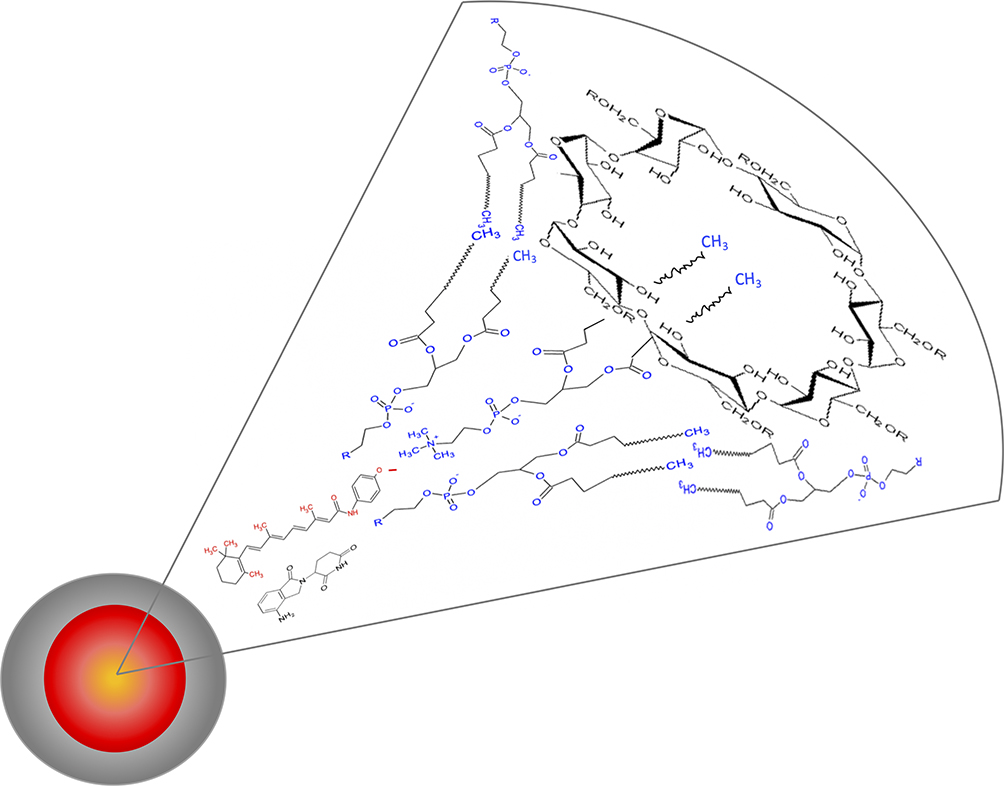 |
Figure 1 Schematic representation of FLM made of a phospholipid: 2-hydroxypropyl-betacyclodextrin amphiphilic matrix enclosing fenretinide and lenalidomide. |
Stability Towards Drug Leakage
Drug leakage from the FLM nanomicelles was very low at either pH. Indeed, after 72 h, 21% ± 5.7 fenretinide and 29% ± 3.2 lenalidomide were released at pH 7.4; 14% ± 5.5 fenretinide and 24% ± 6.8 lenalidomide were released at pH 6.0 (Figure 2). These data indicate nanomicelle stability towards drug leakage either in the physiological pH of blood during circulation, and in the slightly acidic pH of the extracellular fluids in the tumor site.
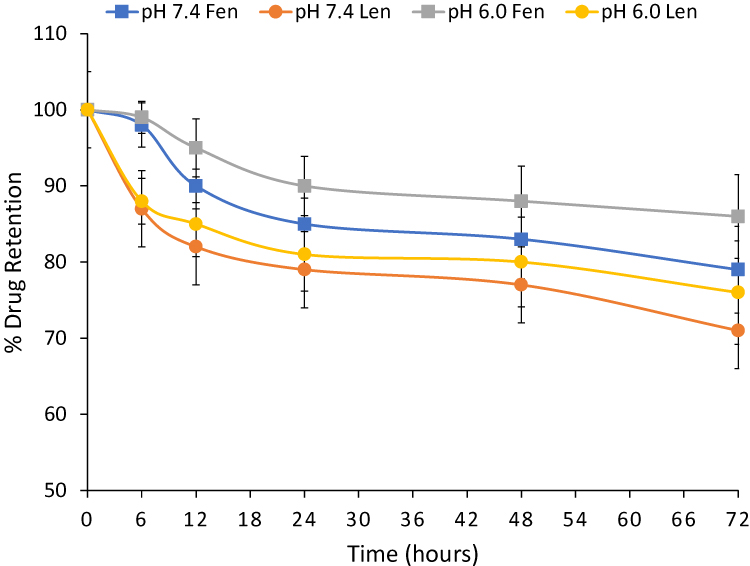 |
Figure 2 Leakage of fenretinide (Fen) and lenalidomide (Len) from FLM in pH 7.4 or pH 6.0 phosphate buffer saline containing 25% human plasma at 37° C. All data are the average of at least three independent experiments ± SD. |
Effect of FLM on Cell Proliferation in vitro
FLM and FM decreased the viability of NLF cells to a similar extent at all the analyzed concentrations, corresponding to 10 μM, 20 μM, 30 μM fenretinide. Their effect was lower than free fenretinide (Figure 3A). However, after a 24 treatment and washout, regrowth was observed with free fenretinide, but a progressive decrease in cell viability was obtained with FLM and FM (Figure 3B). Lenalidomide did not show cytotoxicity as a pure drug at the same concentrations as fenretinide (10 μM, 20 μM, 30 μM) that slightly exceeded the lenalidomide concentrations in FLM (6.6 μM, 13.2 μM, 19.86 μM) (Figure 3A). The empty nanomicelles, evaluated at the same concentrations as the loaded ones, had no cytotoxic effect (Figure 3A).
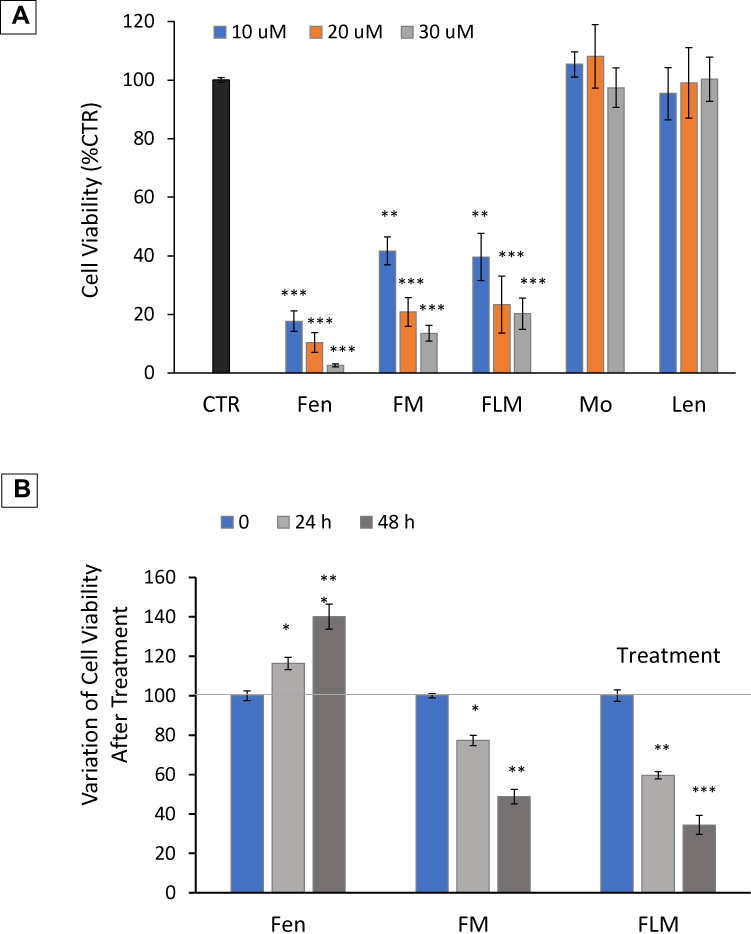 |
Figure 3 Cytotoxic activity of FLM, FM and free fenretinide (Fen) in NLF cells. (A) Cytotoxic activity of FLM, FM and Fen at increasing fenretinide concentrations. Pure lenalidomide (Len) was tested at concentrations corresponding to those contained in FLM. As a blank, empty nanomicelles (Mo) were tested at concentrations corresponding to the nanomicelles loaded with the drugs. The cells were exposed at the indicated drug doses and cell viability was evaluated by Incucyte after 24 hours and expressed as percentage versus control cells (100%) (mean ± SD, n = 6) (**p < 0.01, ***p < 0.001). (B) Variation of cell viability after 24 h treatment followed by wash-out. The cells were treated with FLM, FM and Fen at concentrations corresponding to 10 µM fenretinide. Cell viability was determined 24 h and 48 h after wash-up. (mean ± SD, n = 6) (*p < 0.05, **p < 0.01, ***p < 0.001). |
Confocal Laser-Scanning Fluorescence Microscopy (CLSFM)
The tumor cells treated with FLM, FM and free fenretinide were analyzed by confocal laser-scanning fluorescence microscopy, exploiting the spontaneous fluorescence of fenretinide. The images (Figure 4A and B) and the quantitative analysis of the fluorescence intensity (Figure 4C) showed that FLM and FM strongly increased the fluorescence inside the cells, while treatment with free fenretinide only provided a slight fluorescence increase with respect to the control. This suggests that FLM and FM penetrated the tumor cells, carrying high amounts of entrapped drug. In contrast, the passive drug diffusion, driving absorption in the cells treated with free fenretinide, did not provide significant fluorescence increase.
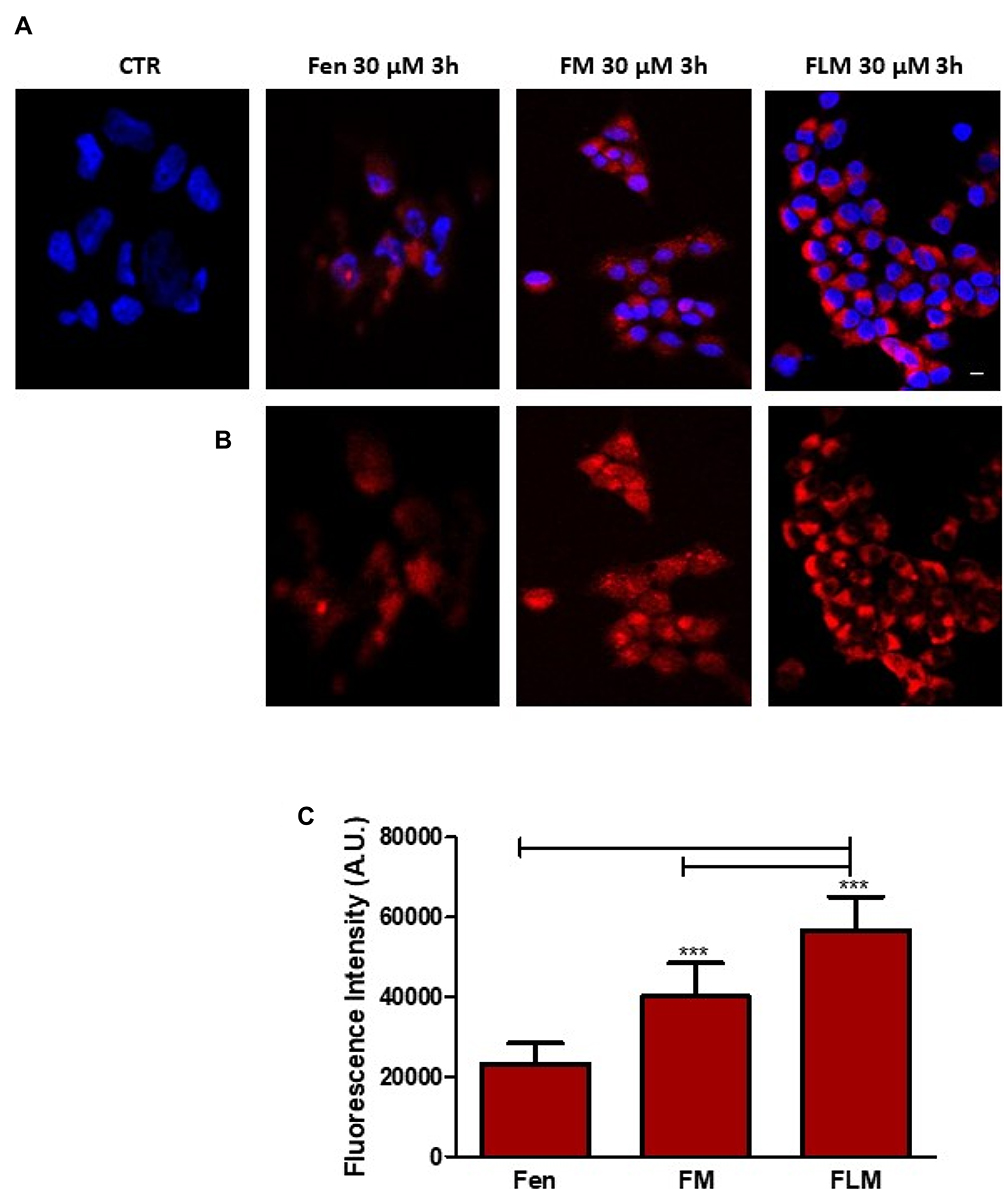 |
Figure 4 Confocal microscopy of NFL cells after 3h treatment with free fenretinide (Fen), FM, or FLM. (A) Cells treated with Fen, FM, or FLM were counterstained with Hoechst 33342 to visualize the nuclei. Photographs were taken at 40 × magnification, bar = 10 µm. (B) Representative micrographs are shown. (C) Fluorescence intensities of Fen, FM and FLM. The images were analyzed by Image J Software. One-way analysis of variance (ANOVA) followed by the Bonferroni Multiple Comparison Test (GraphPadPrism, GraphPad software Inc., CA, USA) was used to analyze the data and the level of significance was set at the probabilities of ***p < 0.001. |
ROS Increase and Mitochondrial Potential in Treated Cells in vitro
We determined whether fenretinide encapsulated in FLM and FM increased ROS and induced mitochondrial depolarization in NLF cells, relative to free fenretinide. This could provide indications about the ability of nanomicelles to release the free drug inside the cells, given that these effects are strictly dependent on the molecular drug interactions with mitochondrial targets. We found that free fenretinide increased ROS and induced mitochondrial depolarization at higher extents than both FLM and FM at 3 h and 24 h, in accordance with the fully free drug in the cells treated with free fenretinide (Figure 5). A comparison between the nanomicelles showed that FLM induced a slightly lower effect on ROS increase than FM (Figure 4A), and a significantly lower effect in mitochondrial depolarization (Figure 5B). This indicated an inferior drug release from FLM than FM.
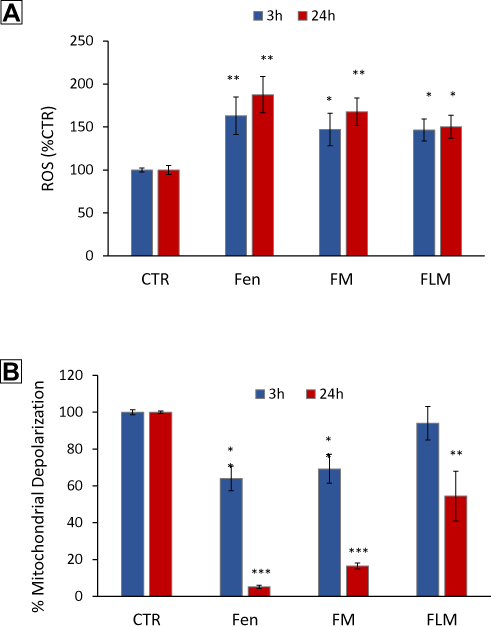 |
Figure 5 Effect of FLM, FM and free fenretinide (Fen) on ROS increase and mitochondrial membrane potential. (A) ROS production measured by H2DClFDA fluorescence in NLF cells treated at concentration corresponding to 10 µM fenretinide for 3 and 24 h versus control cells (mean ± SD, n = 6) (*p < 0.05, **p < 0.01). (B) Changes in the mitochondrial membrane potential determined by JC1 in NLF treated at concentration corresponding to 10 µM fenretinide for 3 and 24 h versus control cells (mean ± SD, n = 6) (*p < 0.05, **p < 0.01, ***p < 0.001). |
Efficacy of FLM in vivo
Both FLM and FM decreased tumor growth to a similar extent during the 4 weeks of treatment (Figure 6A). However, after the end of treatment, the animals receiving FLM showed a progressive tumor regression in the following 10–15 days, without regrowth. In contrast, in the animals receiving FM, the tumor volumes remained stable for about 15–20 days after the end of treatment followed by rapid tumor regrowth (Figure 6B). The mean body weights of the mice treated with FLM and FM did not differ significantly from the controls, indicating that neither formulation caused significant systemic side effects (Figure 7A). After the end of treatment, the body weight slightly increased in the group that received FLM and remained about constant in the group treated with FM (Figure 7B).
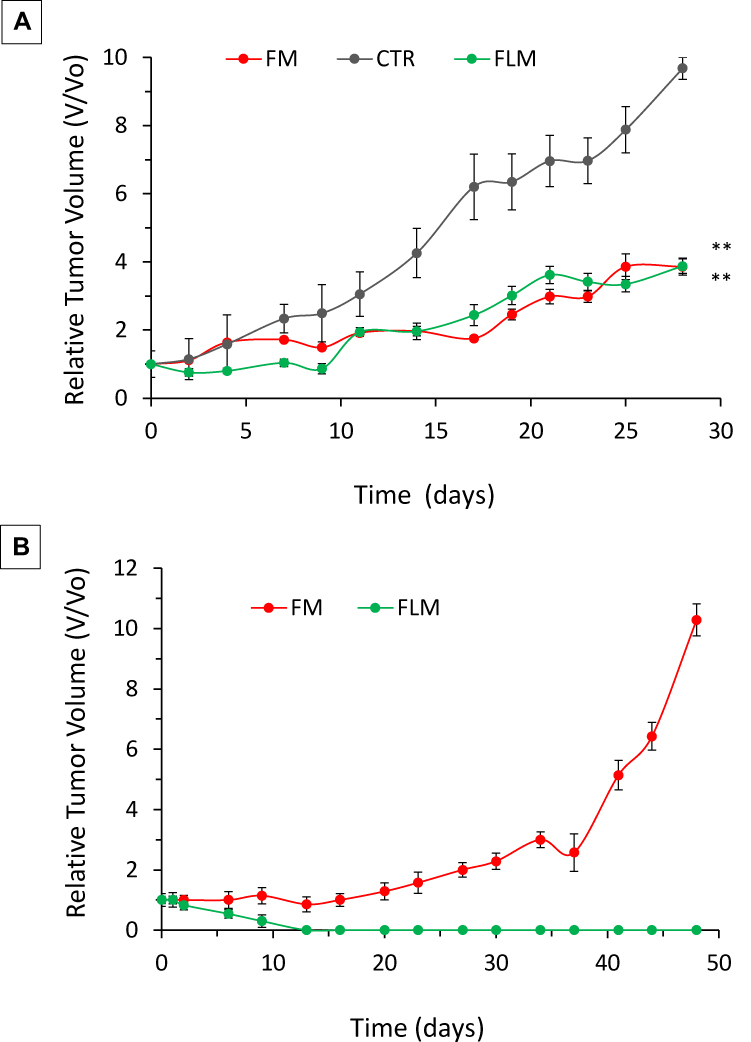 |
Figure 6 Efficacy of FLM and FM on NLF flank xenografts. Cells were implanted subcutaneously in the flank of each mouse. Mice (n=4 per arm) were treated intravenously via tail vein injections with FLM (30 mg/kg fenretinide and 17 mg/Kg lenalidomide) or FM (30 mg/kg fenretinide) 3x/week for 4 weeks when tumors reached a volume of 0.1 cm3. (A) Relative tumor volume (V/Vo) during treatment (mean ± SD, n = 4). Treatment resulted in a statistically significant decrease in the relative tumor volume growth versus controls (**p < 0.01). (B) Relative tumor volume (V/Vo) after the end of treatment (mean ± SD, n = 4). |
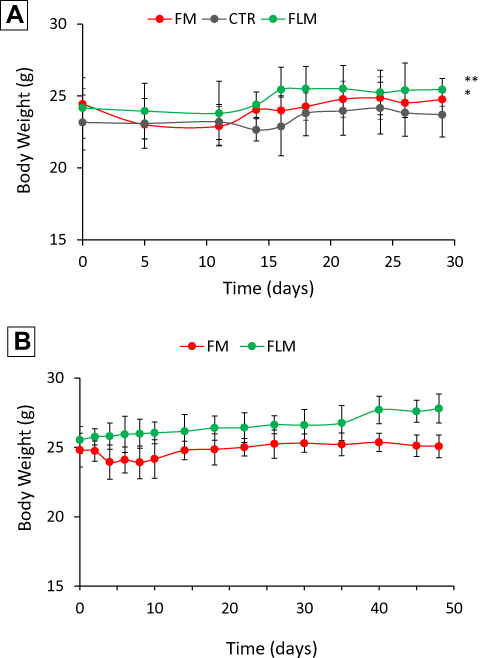 |
Figure 7 Body weight of mice (A) during treatment (mean ± SD, n = 4) and (B) after the end of treatment (mean ± SD, n = 4) (*p < 0.05, **p < 0.01). |
GD2 Expression and Tumor-Infiltrating NK Cells in vivo
GD2 expression and NK cells infiltration in treated tumors were evaluated by flow cytometry (Figure 8A). A significant increase in GD2 expression was observed in the tumors treated with FLM. In contrast, FM treatment did not result in a significant increase in GD2 expression compared to untreated tumors (Figure 8B). NK cell infiltration decreased in the tumors treated with FLM, presumably related to the antiangiogenic effect of lenalidomide. FM did not significantly affect NK infiltration (Figure 8C).
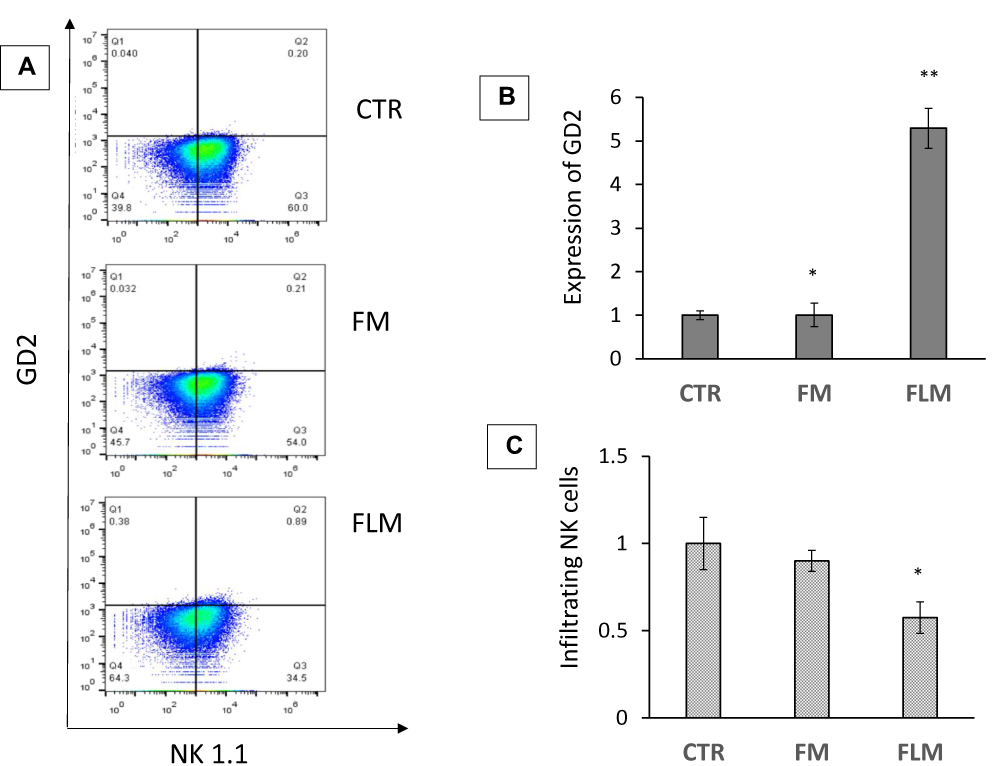 |
Figure 8 (A) GD2 expression and tumor-infiltrating NK cells determined by flow cytometry in tumor treated with FLM and FM compared to controls. (B) Fold increase of GD2 expression with respect to controls (mean ± SD, n = 4) (*p < 0.05, **p < 0.01). (C) Tumor-infiltrating NK cells in tumor treated with FLM and FM, fold decrease compared to controls (mean ± SD, n = 4) (*p < 0.05). |
Discussion
In the previous study, we demonstrated that the combination of fenretinide with lenalidomide, administered by a novel nanomicellar formulation (FLM) (Figure 1), provided a strong antitumor effect in a TrkB-expressing NB (BR6) xenograft model. The effect of FLM was much greater than fenretinide, which was in a similar nanomicellar formulation (FM). This occurred despite the absence of cytotoxicity of lenalidomide on BR6 cells in vitro and was attributed to the antiangiogenic activity of lenalidomide that, together with the cytotoxic activity of fenretinide, produced an improved overall antitumor effect.34 In this study, we tested the nanomicellar combination in a genotypically different NB xenograft model with MYCN amplification (NLF) to determine if it was also efficacious in this aggressive tumor model. Moreover, NLF is characterized by highly metastatic ability and capacity to induce a tolerogenic immune environment,36 which made it even more challenging.
The in vitro studies revealed similar antiproliferative activity of FLM and FM, in accordance with the lack of lenalidomide cytotoxicity on the NLF cells. Not surprisingly, the effect of free fenretinide was greater than FLM and FM, which contained encapsulated drugs (Figure 3A). However, after treatment and washout, a recovery in cell proliferation was observed with free fenretinide, but there was a progressive decrease in vitality with FLM and FM (Figure 3B). This behavior may be attributed to the ability of the nanomicelles to penetrate the tumor cells and transport encapsulated drugs, as demonstrated by confocal laser scanning microscopy images obtained by exploiting the fluorescence of fenretinide (Figure 4). The decrease in cell vitality after treatment correlates with the drug release from nanomicelles over time. The efficiency of sustained drug release can control the intracellular free drug concentration and therefore the cytotoxic effect. In contrast, free fenretinide is absorbed rapidly as a free molecule by the cells. This triggers an early cytotoxic effect that is greater than FLM and FM (Figure 3A), but there is a subsequent recovery after treatment, due to the lack of the protracted drug release associated with nanomicelles (Figure 3B).
The efficiency of fenretinide release from the nanomicelles has been correlated with the ROS increase and mitochondrial membrane depolarization obtained in the cells treated with FLM and FM at 3 and 24 h. Indeed, fenretinide linkage with protein kinase Cδ (PKCδ), a positive regulator of the pyruvate dehydrogenase complex (PDHC), makes the drug a real-time activator of ROS production and mitochondrial membrane depolarization22 thus providing information about free drug concentration inside cells. In these studies, FLM provided a lower effect than FM on both the ROS increase (Figure 5A) and mitochondrial membrane depolarization (Figure 5B), suggesting that fenretinide release from FLM was slower than from FM.
The slower release and the higher drug amount transported inside the cells by FLM, as determined by the quantitative evaluation of cell fluorescence (Figure 4C), might account for the comparable cytotoxic effects of FLM and FM during treatment (Figure 3A) and the improved cytotoxic activity of FLM after treatment (Figure 3B). Indeed, during treatment, the higher intracellular drug amount may counterbalance the slower drug release from FLM in determining the overall cytotoxic effect. However, after treatment, the more protracted release due to the higher amount of nanoencapsulated drug inside the cells, may account for the more evident cytotoxicity of FLM over time.
The ability of nanomicelles to penetrate tumor cells may be attributed to their physicochemical characteristics (Table 1) and to the presence of 2-hydroxypropyl beta cyclodextrin in their matrix (Figure 1). 2-hydroxypropyl beta cyclodextrin is known to interact with phospholipids and cholesterol in the cell membranes, loosening their structure packing. Moreover, phosphatidylcholine, the major component of the nanomicelles, may behave as a buffering agent in the environmental pH, thus controlling the nanomicelle surface charge. Indeed, the presence of both a quaternary ammonium and a phosphate group on the phosphatidylcholine molecule can modify its molecular charge from about neutral at pH 7.4 to positive at lower pH values. In proximity to the tumor cell membranes, where the pH drops from 7.4 to about 6.0, due to the secretion of lactic acid and protons, the positive charge of phosphatidylcholine, decreasing the net negative value of the nanomicelle zeta potential (Table 1), is expected to decrease the electrostatic repulsions with the negatively charged tumor cell membranes.39 This allows a close approach of the nanomicelles with the tumor cell surface and the establishment of interactions with the membrane components, favored by the presence of 2-hydroxypropyl beta cyclodextrin, thus triggering nanomicelle internalization.
The ability of FLM and FM to penetrate the tumor cells, as well as the stability towards drug leakage and accumulation at the tumor site through leaky tumor vasculature, allows them to improve the pharmacological efficacy of the encapsulated drugs. Indeed, the drugs entrapped in FLM and FM are mostly delivered into the tumor cells, with minimal release in other body compartments, thus providing maximum activity per unit drug dose administered.
In contrast, most nanoparticles cannot penetrate the tumor cells, and so the drug release occurs by their gradual destabilization in the extracellular tumor environment. The subsequent drug absorption occurs by passive diffusion through the tumor cell membranes, and this activates the therapeutic response to an extent depending on the intracellular drug concentration. By this mechanism, a fraction of the drug released from the nanoparticles remains entrapped in the extracellular tumor matrix where it can be metabolized by local enzymes, absorbed by fibroblasts40 or extracted by retro-diffusion into the venous capillary circulation leaving the tumor. All these processes reduce intracellular drug concentration and decrease pharmacological efficacy.
The antitumor activity of FLM and FM in NLF xenografts provided a decrease in tumor growth without significant differences between the two nanomicellar systems during the 4-week treatment period. After the end of the treatment, on the contrary, FLM gave a progressive tumor disappearance without regrowth while FM produced a delay in the tumor growth up to 15–20 days after the end of treatment, followed by a subsequent regrowth (Figure 6).
The superior antitumor activity of FLM than FM, demonstrated by its ability to completely inhibit the tumor growth, may be due to the antiangiogenic effect of lenalidomide, which, decreasing blood and oxygen supply to the tumor, increases the antitumor effect of fenretinide. Similar results were obtained in BR6 xenografts34 but in that case, the differences between FLM and FM became evident after just 6 days of treatment. The slower response of the NLF xenografts to the antiangiogenic activity of lenalidomide might be due to a delayed dependence of tumor growth from a blood supply that restricts the efficacy of antiangiogenic treatments to larger tumors.
In addition to its significant antitumor activity, FLM substantially increased GD2 expression in NLF tumors (Figure 8) which had relatively low expression of this ganglioside compared to most primary NBs.35 The increased GD2 expression that resulted from FLM treatment offers the possibility to further improve the antitumor efficacy of anti-GD2 antibodies (dinutuximab) or anti-GD2 CAR-T cells. The former inducing antibody-dependent cell-mediated cytotoxicity, and the latter providing direct tumor cell cytotoxicity. Another feature of lenalidomide that could improve the antitumor effect of FLM is its ability to decrease the expression of the immune check-point inhibitors Programmed Death-1 receptor (PD-1) and ligand (PD-L1) on both T and NK cells and in tumor cells, respectively. The consequent inhibition of the negative signal induced by PD-1/PD-L1 axis can restore the effectiveness of the immune response to counteract the tumor progression, as has been demonstrated in multiple myeloma and other hematologic malignances.41 Also, in NB, the inhibition of the PD-1/PD-L1 axis, is now regarded as a promising additional immunotherapeutic tool, in combined therapies, particularly in high-risk NB patients where the tumors are characterized by significant immunosuppressive activity.42,43
The xenograft model used in this study, consisting of immunosuppressed mice implanted with a human tumor, did not allow us to estimate the contribution of the immunomodulating effect of lenalidomide on the overall antitumor effect of the FLM system. However, in a clinical setting, we anticipate that the contribution of the immunomodulating activity of lenalidomide, in addition to its antiangiogenic effect and the intrinsic antitumor efficacy of fenretinide, would lead to a greater therapeutic efficacy of FLM in different tumor types and make it a valuable tool in combined therapies.
Conclusion
In this study, we demonstrated that the combination of fenretinide with lenalidomide, administered by a novel nanomicellar formulation (FLM), provided complete regression of the tumor growth in a xenograft model with the MYCN-amplified NB line, NLF. These data support previous results obtained in another xenograft model with the MYCN nonamplified cell line, BR6. In this model, the cytotoxic activity of fenretinide combined with the antiangiogenic effect of lenalidomide in FLM nanomicelles provided an overall antitumor response much higher than that obtained by the administration of fenretinide-containing nanomicelles (FM). The ability of FLM to accumulate in the tumor through leaky tumor vasculature, as well as penetrate tumor cells and transport the encapsulated drugs intracellularly, makes this system a valuable tool to increase the pharmacological and therapeutic efficacy of the transported drugs. Moreover, the enhancement of GD2 expression in the tumors treated with FLM offers an additional tool to further improve the antitumor effect of immunotherapies targeting GD2. Thus, the antitumor efficacy of FLM, carrying fenretinide and lenalidomide into the tumor cells, combined with its effects on angiogenesis and GD2 expression, would be particularly valuable for the treatment of high-risk NB patients. Furthermore, the ability to deliver therapeutic agents intracellularly to tumor cells would be a strategy applicable to the treatment of other pediatric (and adult) solid tumors.
Disclosure
The authors report no conflicts of interest in this work.
References
1. Uemura S, Ishida T, Thwin KKM, et al. Dynamics of minimal residual disease in neuroblastoma patients. Front Oncol. 2019;9:455. doi:10.3389/fonc.2019.00455
2. Applebaum MA, Vaksman Z, Lee SM, et al. Neuroblastoma survivors are at increased risk for second malignancies: a report from the international neuroblastoma risk group project. Eur J Cancer. 2017;72:177–185. doi:10.1016/j.ejca.2016.11.022
3. Hobbie WL, Moshang Yang EJ, Wu C, Liu Y, Lv J, Sup Shim J. Revisiting non-cancer drugs for cancer therapy. Curr Top Med Chem. 2016;16:2144–2155. doi:10.2174/1568026616666160216154441
4. Cheung BB. Combination therapies improve the anticancer activities of retinoids in neuroblastoma. World J Clin Oncol. 2015;6:212–215. doi:10.5306/wjco.v6.i6.212
5. Nichols JW, Sakurai Y, Harashima H, Bae YH. Nano-sized drug carriers: extravasation, intratumoral distribution, and their modeling. J Control Release. 2017;267:31–46. doi:10.1016/j.jconrel.2017.08.003
6. Rawal S, Patel MM. Threatening cancer with nanoparticle aided combination oncotherapy. J Control Release. 2019;301:76–109. doi:10.1016/j.jconrel.2019.03.015
7. Garaventa A, Luksch R, Lo Piccolo MS, et al. Phase I trial and pharmacokinetics of fenretinide in children with neuroblastoma. Clin Cancer Res. 2003;9:2032–2039.
8. Maurer BJ, Kang MH, Villablanca JG, et al. Phase I trial of fenretinide delivered orally in a novel organized lipid complex in patients with relapsed/refractory neuroblastoma: a report from the new approaches to neuroblastoma therapy (NANT) consortium. Pediatr Blood Cancer. 2013;60:1801–1808. doi:10.1002/pbc.24643
9. Villablanca JG, London WB, Naranjo A, et al. Phase II study of oral capsular 4-hydroxyphenylretinamide (4-HPR/fenretinide) in pediatric patients with refractory or recurrent neuroblastoma: a report from the Children’s oncology group. Clin Cancer Res. 2011;17:6858–6866. doi:10.1158/1078-0432.CCR-11-0995
10. Orienti I, Cripe TP, Currier MA, Cavallari C, Teti G, Falconi M. A cationic nanomicellar complex of the quaternary amphiphilic amine RC16+ with fenretinide as a new multitasking system for antitumor therapy. Curr Drug Deliv. 2019;16:807–817. doi:10.2174/1567201816666191002100745
11. Moore MM, Stockler M, Lim R, Mok TS, Millward M, Boyer MJ. A phase II study of fenretinide in patients with hormone refractory prostate cancer: a trial of the cancer therapeutics research group. Cancer Chemother Pharmacol. 2010;66:845–850. doi:10.1007/s00280-009-1228-x
12. Schneider BJ, Worden FP, Gadgeel SM, et al. Phase II trial of fenretinide (NSC 374551) in patients with recurrent small cell lung cancer. Investigational New Drugs. 2009;27(6):571–578. doi:10.1007/s10637-009-9228-6
13. Veronesi U, Mariani L, Decensi A, et al. Fifteen-year results of a randomized phase III trial of fenretinide to prevent second breast cancer. Ann Oncol. 2006;17(1):065–71. doi:10.1093/annonc/mdl047
14. Reynolds CP, Frgala T, Tsao-Wei DD, et al. High plasma levels of fenretinide (4-HPR) were associated with improved outcome in a phase II study of recurrent ovarian cancer: a study by the California cancer consortium. J Clin Oncol. 2007;25(18_suppl):5555. doi:10.1200/jco.2007.25.18_suppl.5555
15. Puduvalli VK, Yung WK, Hess KR, et al. North American brain tumor consortium. Phase II study of fenretinide (NSC 374551) in adults with recurrent malignant gliomas: a North American brain tumor consortium study. J Clin Oncol. 2004;22::4282–4289. doi:10.1200/JCO.2004.09.096
16. Vaishampayan U, Heilbrun LK, Parchment RE, et al. Phase II trial of fenretinide in advanced renal carcinoma. Investig New Drugs. 2005;23:179–185. doi:10.1007/s10637-005-5864-7
17. Oridate N, Suzuki S, Higuchi M, Mitchell MF, Hong WK, Lotan R. Involvement of reactive oxygen species in N-(4-hydroxyphenyl)retinamide-induced apoptosis in cervical carcinoma cells. J Natl Cancer Inst. 1997;89:1191–1198. doi:10.1093/jnci/89.16.1191
18. Rahmaniyan M, Curley RW, Obeid LM, Hannun YA, Kraveka JM. Identification of dihydroceramide desaturase as a direct in vitro target for fenretinide. J Biol Chem. 2011;286:24754–24764. doi:10.1074/jbc.M111.250779
19. Wang H, Maurer BJ, Liu -Y-Y, et al. N-(4-Hydroxyphenyl)retinamide increases dihydroceramide and synergizes with dimethylsphingosine to enhance cancer cell killing. Mol Cancer Ther. 2008;7:2967–2976. doi:10.1158/1535-7163.MCT-08-0549
20. Xie H, Zhu F, Huang Z, et al. Identification of mammalian target of rapamycin as a direct target of fenretinide both in vitro and in vivo. Carcinogenesis. 2012;33:1814–1821. doi:10.1093/carcin/bgs234
21. Maurer B, Metelitsa L, Seeger R, Cabot M, Reynolds C. Increased of ceramide and induction of mixed apoptosis/necrosis by N-(4-hydroxyphenyl)retinamide in neuroblastoma cell lines. J Natl Cancer Inst. 1999;91:1138–1146. doi:10.1093/jnci/91.13.1138
22. Kim YK, Hammerling U. The mitochondrial PKCδ/retinol signal complex exerts real-time control on energy homeostasis [published online ahead of print, 2020 Jan 10]. Biochim Biophys Acta Mol Cell Biol Lipids. 2020;1865:158614. doi:10.1016/j.bbalip.2020.158614
23. Bassani B, Bartolini D, Pagani A, et al. Fenretinide (4-HPR) targets caspase-9, ERK 1/2 and the Wnt3a/β-catenin pathway in medulloblastoma cells and medulloblastoma cell spheroids. PLoS One. 2016;11:e0154111. doi:10.1371/journal.pone.0154111
24. Fettig LM, McGinn O, Finlay-Schultz J, LaBarbera DV, Nordeen SK, Sartorius CA. Cross talk between progesterone receptors and retinoic acid receptors in regulation of cytokeratin 5-positive breast cancer cells. Oncogene. 2017;36:6074–6084. doi:10.1038/onc.2017.204
25. Mukherjee N, Reuland SN, Lu Y, et al. Combining a BCL2 inhibitor with the retinoid derivative fenretinide targets melanoma cells including melanoma initiating cells. J Invest Dermatol. 2015;135:842–850. doi:10.1038/jid.2014.464
26. Yan W, Du J, Du Y, et al. Fenretinide targets the side population in myeloma cell line NCI-H929 and potentiates the efficacy of antimyeloma with bortezomib and dexamethasone regimen. Leuk Res. 2016;51:32–40. doi:10.1016/j.leukres.2016.10.010
27. Orienti I, Salvati V, Sette G, et al. A novel oral micellar fenretinide formulation with enhanced bioavailability and antitumour activity against multiple tumours from cancer stem cells. J Exp Clin Cancer Res. 2019;38:373. doi:10.1186/s13046-019-1383-9
28. Orienti I, Francescangeli F, De Angelis ML, et al. A new bioavailable fenretinide formulation with antiproliferative, antimetabolic, and cytotoxic effects on solid tumors. Cell Death Dis. 2019;10:529. doi:10.1038/s41419-019-1775-y
29. Dredge K, Marriott JB, Macdonald CD, et al. Novel thalidomide analogues display antiangiogenic activity independently of immunomodulatory effects. Br J Cancer. 2002;87:1166–1172. doi:10.1038/sj.bjc.6600607
30. Kotla V, Goel S, Nischal S, et al. Mechanism of action of lenalidomide in hematological malignancies. J Hematol Oncol. 2009;2:36. doi:10.1186/1756-8722-2-36
31. Buesche G, Dieck S, Giagounidis A, et al. Antiangiogenic in vivo effect of lenalidomide (CC-5013) in myelodysplastic syndrome with del (5q) chromosome abnormality and its relation to the course of disease [abstract]. Blood. 2005;106:372. doi:10.1182/blood.V106.11.372.372
32. Dredge K, Horsfall R, Robinson SP, et al. Orally administered lenalidomide (CC-5013) is antiangiogenic in vivo and inhibits endothelial cell migration and Akt phosphorylation in vitro. Microvasc Res. 2005;69:56–63. doi:10.1016/j.mvr.2005.01.002
33. Lu L, Payvandi F, Wu L, et al. The anti-cancer drug lenalidomide inhibits angiogenesis and metastasis via multiple inhibitory effects on endothelial cell function in normoxic and hypoxic conditions. Microvasc Res. 2009;77:78–86. doi:10.1016/j.mvr.2008.08.003
34. Orienti I, Nguyen F, Guan P, et al. A novel nanomicellar combination of fenretinide and lenalidomide shows marked antitumor activity in a neuroblastoma xenograft model. Drug Des Devel Ther. 2019;13:4305–4319. doi:10.2147/DDDT.S221909
35. Mise N, Takami M, Suzuki A, et al. Antibody-dependent cellular cytotoxicity toward neuroblastoma enhanced by activated invariant natural killer T cells. Cancer Sci. 2016;107:233–241. doi:10.1111/cas.12882
36. Harada K, Ihara F, Takami M, et al. Soluble factors derived from neuroblastoma cell lines suppress dendritic cell differentiation and activation. Cancer Sci. 2019;110:888–902. doi:10.1111/cas.13933
37. Shibina A, Seidel D, Somanchi SS, et al. Fenretinide sensitizes multidrug-resistant human neuroblastoma cells to antibody-independent and ch14.18-mediated NK cell cytotoxicity. J Mol Med. 2013;91:459–472. doi:10.1007/s00109-012-0958-0
38. Anderson M, Moshnikova A, Engelman DM, Reshetnyak YK, Andreev OA. Probe for the measurement of cell surface pH in vivo and ex vivo. Proc Natl Acad Sci U S A. 2016;113:8177–8181. doi:10.1073/pnas.1608247113
39. Hu Y, Mayampurath A, Khan S, Cohen JK, Mechref Y, Volchenboum SL. N-linked glycan profiling in neuroblastoma cell lines. J Proteome Res. 2015;14:2074–2081. doi:10.1021/pr5011718
40. Sriraman SK, Aryasomayajula B, Torchilin VP. Barriers to drug delivery in solid tumors. Tissue Barriers. 2014;2:e29528. doi:10.4161/tisb.29528
41. Giuliani M, Janji B, Berchem G. Activation of NK cells and disruption of PD-L1/PD-1 axis: two different ways for lenalidomide to block myeloma progression. Oncotarget. 2017;8:24031–24044. doi:10.18632/oncotarget.15234
42. Dondero A, Pastorino F, Della Chiesa M, et al. PD-L1 expression in metastatic neuroblastoma as an additional mechanism for limiting immune surveillance. Oncoimmunology. 2015;5:e1064578. doi:10.1080/2162402X.2015.1064578
43. Melaiu O, Mina M, Chierici M, et al. PD-L1 is a therapeutic target of the bromodomain inhibitor JQ1 and, combined with HLA class I, a promising prognostic biomarker in neuroblastoma. Clin Cancer Res. 2017;23:4462–4472. doi:10.1158/1078-0432.CCR-16-2601
 © 2020 The Author(s). This work is published and licensed by Dove Medical Press Limited. The full terms of this license are available at https://www.dovepress.com/terms.php and incorporate the Creative Commons Attribution - Non Commercial (unported, v3.0) License.
By accessing the work you hereby accept the Terms. Non-commercial uses of the work are permitted without any further permission from Dove Medical Press Limited, provided the work is properly attributed. For permission for commercial use of this work, please see paragraphs 4.2 and 5 of our Terms.
© 2020 The Author(s). This work is published and licensed by Dove Medical Press Limited. The full terms of this license are available at https://www.dovepress.com/terms.php and incorporate the Creative Commons Attribution - Non Commercial (unported, v3.0) License.
By accessing the work you hereby accept the Terms. Non-commercial uses of the work are permitted without any further permission from Dove Medical Press Limited, provided the work is properly attributed. For permission for commercial use of this work, please see paragraphs 4.2 and 5 of our Terms.