")
Back to Journals » International Journal of Nanomedicine » Volume 11
Nanomechanical measurement of adhesion and migration of leukemia cells with phorbol 12-myristate 13-acetate treatment
Authors Zhou ZL, Ma J, Tong MH, Chan BP, Wong AST, Ngan AHW
Received 25 July 2016
Accepted for publication 29 September 2016
Published 7 December 2016 Volume 2016:11 Pages 6533—6545
DOI https://doi.org/10.2147/IJN.S118065
Checked for plagiarism Yes
Review by Single anonymous peer review
Peer reviewer comments 3
Editor who approved publication: Dr Thomas Webster
Zhuo Long Zhou,1 Jing Ma,2 Ming-Hui Tong,1 Barbara Pui Chan,1 Alice Sze Tsai Wong,2 Alfonso Hing Wan Ngan1
1Department of Mechanical Engineering, 2School of Biological Sciences, University of Hong Kong, Hong Kong, People’s Republic of China
Abstract: The adhesion and traction behavior of leukemia cells in their microenvironment is directly linked to their migration, which is a prime issue affecting the release of cancer cells from the bone marrow and hence metastasis. In assessing the effectiveness of phorbol 12-myristate 13-acetate (PMA) treatment, the conventional batch-cell transwell-migration assay may not indicate the intrinsic effect of the treatment on migration, since the treatment may also affect other cellular behavior, such as proliferation or death. In this study, the pN-level adhesion and traction forces between single leukemia cells and their microenvironment were directly measured using optical tweezers and traction-force microscopy. The effects of PMA on K562 and THP1 leukemia cells were studied, and the results showed that PMA treatment significantly increased cell adhesion with extracellular matrix proteins, bone marrow stromal cells, and human fibroblasts. PMA treatment also significantly increased the traction of THP1 cells on bovine serum albumin proteins, although the effect on K562 cells was insignificant. Western blots showed an increased expression of E-cadherin and vimentin proteins after the leukemia cells were treated with PMA. The study suggests that PMA upregulates adhesion and thus suppresses the migration of both K562 and THP1 cells in their microenvironment. The ability of optical tweezers and traction-force microscopy to measure directly pN-level cell–protein or cell–cell contact was also demonstrated.
Keywords: adhesion, migration, cell-to-cell contact, optical trapping, traction-force microscopy, protein micropillar matrix
Introduction
The regulatory mechanism of hematopoietic stem cell (HSC)-niche maintenance is still a mystifying field to be uncovered,1 and understanding the biomechanics of how HSCs or abnormal leukocytes interact with their surrounding microenvironment would help elucidate the underlying issues. Bone marrow stromal cells (BMSCs), including osteoblasts, endothelial cells, and fibroblasts (FBs), and extracellular matrix proteins (ECMPs), such as collagens, glycoproteins (fibronectin, laminins, and vitronectin), proteoglycans, and glycosaminoglycans, coexist with the SCs and leukocytes inside the BM, and they help regulate the self-renewal of HSCs and leukocytes and their release into the bloodstream.2 Cell proliferation, differentiation, and migration responses to the signal communication between HSCs, BMSCs, and ECMPs are mainly through adhesion molecules.3,4 Among those adhesion proteins, integrins and transmembrane proteoglycans are the main receptors and coreceptors for the matrix,5 while cadherins are adhesion proteins mediating cell–cell contact.6 It has been reported that low expression of E-cadherin adhesion proteins is implicated in the abnormal interaction of leukemic cells with human BMSCs (hBMSCs),7 and regulating the migration of myelogenous leukemia cells leads to a change of interaction with the BMSCs.8 Collagen is the most abundant fibrous protein within the interstitial ECM,9 and fibronectin proteins have been shown to be able to induce endothelial cell migration through β1 integrin and Src-dependent phosphorylation of FB growth-factor receptor 1.10 Treatment of abnormal HSCs can lead to a different interaction with the BMSCs and ECMPs. As such, measuring alterations in the adhesion and traction behavior of drug-treated leukemia cells with their mimicked microenvironment can provide a new strategy for therapy assessment.
Phorbol 12-myristate 13-acetate (PMA)11 has been reported to be able to make certain myeloid leukemia cells, such as K562, HL60, and THP1, to differentiate into more mature cell types.12–15 However, little is known about the treatment effect of PMA on the release of leukemia cells from the BM after undergoing such differentiation therapy.16 Therefore, the adhesion and migration of leukemia cells treated with and without PMA to a mimic ECM environment were investigated in this study. Chronic myelogenous leukemia K562 cells17 exhibit much less clumping than many other suspension cell lines during cell culture, presumably due to the downregulation of surface-adhesion molecules.18 On the other hand, acute myelogenous leukemia THP1 cells19 show rapid proliferation, which could lead to rapid expansion at location areas and hence migration. This study aimed to show that after differentiation treatment with PMA, the migration and mobility of both types of leukemia cells in the mimic microenvironment can be suppressed and a positive therapeutic outcome can be reached.
Although many batch-cell methods, such as Western blot and enzyme-linked immunosorbent assay, can detect the expression of proteins responsible for adhesion or migration, such protein expression serves only as an indirect indicator of the actual cellular adhesion or migration ability in the microenvironment. Direct measurements of cell–cell or cell–substrate interactions at the single cell level have been rare,20 despite the fact that knowing such interaction forces would help elucidate the effects of drug treatment in cell adhesion and migration. Optical tweezers21 and atomic force microscopy (AFM)22 have been established as effective tools for the measurement of cell–cell or cell–substrate interactions.20,23 In the present work, we employed optical tweezers to measure the adhesion property of leukemia cells on primary ECMPs fibronectin and collagen I, hBMSCs, and human FBs (hFBs), as well as bovine serum albumin (BSA). ECMPs and hFBs, such as hBMSCs, are important constituents of the BM microenvironment,24 which directly interacts with HSCs or leukemia cells,25 and so any change in their interaction with leukemia cells may affect the mobility and migration of the latter. As an inert protein, BSA was used as negative control to compare with other adhesion proteins like fibronectin, collagen I, or E-cadherin.
To elucidate the effect of the PMA on the traction force of leukemia cells, we employed traction-force microscopy to measure the traction force of leukemia cells on a BSA micropillar matrix fabricated using a multiphoton, photochemical cross-linking technique.26,27 BSA was chosen, as it interacts with few proteins existing on the leukemia cells, and hence such a matrix can elucidate the intrinsic effects of a drug on the cell-traction force. To evaluate further the effects of the PMA on cell metastasis, Western blot analysis was also carried out to compare E-cadherin and vimentin expression before and after PMA treatment. The downregulation of E-cadherin expression and upregulation of vimentin expression are the primary events of epithelial–mesenchymal transition, and consequently promote metastasis,28,29 while high expression of E-cadherin protein is also thought to be one of the indicators for mesenchymal–epithelial transition,30 which is believed to reduce cell metastasis and cell migration.31
Materials and methods
Cell culture
Myelogenous leukemia K562 cells and THP1 were cultured in a 25 mL culture flask with Gibco Roswell Park Memorial Institute (RPMI) 1640 medium premixed with 10% fetal bovine serum (FBS) and 1% penicillin–streptomycin, laid inside a 5% CO2 incubator (VS-9160C; Bionex, Seoul, South Korea) and maintained at a humidity of 95% and a temperature of 37°C for 48 hours before PMA treatment. In all the experiments, 1 mg/mL stock solution of the PMA was used and added to the cell-culture medium to reach a final concentration of 1 μg/mL. Approval for the use of cell lines was given by the Human Research Ethics Committee for Non-clinical Faculties of the University of Hong Kong (reference number: EA240913), who deemed patient written informed consent was not necessary.
Adhesion assay
The leukemia cells treated with and without 1 μg/mL PMA were cultured in flasks in advance for 48 hours. The cells were trypsinized for 2 minutes, centrifuged, and resuspended in fresh Gibco RPMI 1640 medium with 10% FBS. The cells were then counted with a hemocytometer to a concentration of 1×10⁶ cells/mL, and 100 μL of the culture medium containing the cells was added to each well of the 96-well microplates, which were precoated with 4 μg/mL BSA proteins, fibronectin, collagen I, and Anti-E-cadherin (Sigma-Aldrich, St Louis, MO, USA). The cells were incubated for 30 minutes for cell attachment, and the remaining suspended cells were removed. The attached cells were measured using the MTT assay at 570 nm wavelength absorbance in an Asys UVM 340 microplate reader (Biochrom, Cambridge, UK).
Transwell-migration assay
The leukemia cells treated with and without PMA were cultured for 48 hours, and the cells in the media with 10% FBS were put into fresh media without FBS and cultured further for 3 hours.32 The cells were then trypsinized and seeded at a density of 1×10⁵ cells/well in the serum-free medium in the upper inserted chambers of a CytoSelect™ 96-well cell-invasion assay (Cell Biolabs, San Diego, CA, USA), with the upper chambers precoated with 4 μg/mL BSA, fibronectin, collagen I, and anti-E-cadherin. The leukemia cells were chemoattracted by the medium containing 10% FBS in the lower chambers for 12 hours. The upper chambers were removed, and the cells in the lower chambers were measured using the MTT assay at 570 nm wavelength absorbance in the Asys microplate reader.
Optical tweezer manipulation in cell–protein/cell–cell contact
Before the experiments, BSA, fibronectin, collagen I, and anti-E-cadherin with a final concentration of 30 μg/mL were mixed with a solution containing 1% 2 μm-diameter polystyrene beads (Bangs Laboratories, Fishers, IN, USA), following a procedure described previously.23 Such a high protein concentration enabled the beads used in the optical tweezer-manipulation experiments to be covered fully with proteins,23 so that the protein–cell interactions could be characterized accurately in a repeatable fashion. In the experiments for measuring cell–protein interactions, leukemia cells with and without PMA treatment or transfected with fluorescein isothiocyanate (FITC)-labeled SiR-E-cadherin by Lipofectamine 2000 (Thermo Fisher Scientific, Waltham, MA, USA) were cultured for 48 hours in confocal dishes that were then brought into an Okolab mini-incubator placed on the stage of the optical tweezer system (Molecular Machines and Industries, Eching, Germany). The protein-coated beads were also added to the confocal dishes. In the experiments for measuring cell–cell interactions, the hBMSCs or hFBs were precultured in confocal dishes for 24 hours to enable the cells to spread well onto the substrate. K562 or THP1 cells treated with or without PMA for 48 hours were then added into the confocal dishes.
Before measurement of the cell–protein or cell–cell interactions, the maximum trapping force on either the protein-coated spheres or leukemia cells at different laser power needed to be calibrated. In the force-calibration procedure, the coated spheres or spherical leukemia cells were optically trapped and oscillated at different laser power to obtain the maximum trapping force at each laser power. At each laser power, the maximum laser trapping force Fmax was obtained by Equation 1, by oscillating the trapped sphere or cell at increasing frequency ω or amplitude Ac until it broke away from the trap:23
|
|

where η and a are the dynamic viscosity of the culture medium and radius of the sphere or cell, respectively. The maximum trapping force at different laser power was measured before the cell–protein and cell–cell interaction experiments. Adherent cells, such as hBMSCs and hFBs, would stick to the bottom of the confocal dish naturally, and some of the leukemia cells would also stick weakly to the bottom of the confocal dish. Then, in the actual interaction experiments, a protein-coated sphere or leukemia cell was brought into contact with a leukemia cell, hBMSC, or hFB for 10 seconds, and was then pulled away at a speed of 1 μm/second. By increasing the laser power until the trapped sphere or cell was completely separated from the contacting cell, the maximum binding force of the cell–protein or cell–cell was obtained from the critical laser power at which breakaway just happened. Cell viability was not affected by laser power, not only because the laser power used in the experiments was low but also because the laser duration was very short: no more than 10 seconds. At the beginning of cell–cell contact, only a very low laser power was enough for the trapped cell to be attached to another cell. Furthermore, in the cell–protein interaction experiments, only the bead was trapped by laser. Therefore, cell viability and most importantly binding-force measurement was not influenced by the laser trap.
Western blots
The K562 and THP1 cells treated with or without PMA and the non-PMA-treated K562 and THP1 cells were cultured in a 24-microwell plate in advance for 48 hours for cell attachment. The cells in the 24-microwell plate were then transfected with the FITC-labeled small-interfering RNA (siRNA) SiR-E-cadherin (CDH1 E-cadherin, sequence 5′-GACAAUGGUUCUCCAGUUG-3′; Sigma-Aldrich) and the negative-control siRNAs (sequence 5′-GGCTACGTCCAGGAGCGCA-3′; GE Healthcare, Little Chalfont, UK) by the Lipofectamine 2000 reagent (Thermo Fisher Scientific) with Opti-MEM reduced serum medium (Thermo Fisher Scientific), following the transfection procedure as stated with the reagent. After transfection, the cells were cultured overnight. The cells were then harvested in a sodium dodecyl sulfate–protease inhibitor buffer (65 mM Tris–HCL pH 6.8, 10% glycerol, 2% sodium dodecyl sulfate, 1 mM sodium orthovanadate, 1 mM sodium fluoride, 1 μg/mL aprotinin, 1 μg/mL leupeptin, 1 μg/mL pepstatin A, 1 mM phenylmethylsulfonyl) and quantified using a DC protein-assay kit (Bio-Rad Laboratories Inc, Hercules, CA, USA). The standardized samples were finally subjected to Western blot analysis. The experimental procedure followed our previous method.33 The primary antibody anti-E-cadherin was purchased from Sigma-Aldrich.
Scanning electron microscopy observation
Scanning electron microscopy was used to observe the coating effects of the protein-coated spheres. The experimental procedure used followed our previous study.23 Briefly, the protein-coated spheres were plated onto silicon wafers and washed with phosphate-buffered saline once. The spheres were dehydrated for 5 minutes in a series of increasing ethanol solutions (30%, 50%, 75%, 90%, and 100%). The samples were dried in a critical point dryer prior to examination with scanning electron microscopy (S4800 FEG; Hitachi, Tokyo, Japan).
Traction-force microscopy
Fabrication and stiffness characterization of BSA-protein micropillar matrices
In the traction-force microscopy experiments, leukemia cells were cultured on an array of BSA-protein micropillars. The protein-micropillar matrices were fabricated by a multiphoton, photochemical cross-linking technique in a confocal microscope.27,34 Before the traction-force measurement, the Young modulus E of the protein micropillars was measured by nanoindentation with AFM with a flat-end tip using a rate-jump method,35,36 in which an imposed rate jump ΔṖ of the indentation force gives rise to a rate jump  of the tip displacement, which are related by:
|
|
where a is the end radius of the AFM tip and ν is the Poisson ratio of the sample, which is assumed to be 0.5.27 After E at a given set of fabrication and reagent parameters had been obtained from Equation 2, the bending stiffness s of the protein micropillars was calculated from the formula:37
|
|

where I is the second moment of inertia of the cross section, d the diameter and L the height of each micropillar. The stiffness of the 1 μm-diameter and 6 μm-height micropillars used here was estimated to be 20.44 pN/μ·m.27
Traction-force measurement of leukemia cells on BSA-protein micropillars
In the traction-force microscopy experiments, instead of the separated ECM proteins, the inert protein BSA, which rarely interferes with most other proteins, was used to make the micropillars. The BSA micropillars are more representative, since the traction-migration behaviors are driven by the cells themselves. The leukemia cells cultured on the BSA micropillars would stretch or contract to produce traction force F to bend the protein micropillars, according to:
|
|

where δE is the elastic component of the end displacement of the micropillar, and s is the stiffness defined in Equation 3. Since the BSA-protein micropillars were viscoelastic, the total bending displacement δtotal of the micropillar would be larger than δE, and by assuming the Maxwell model for viscoelasticity,27 the δtotal is given as:
|
|

where δνis is the viscous component of the bending deformation. The total deformation δtotal is the deflection of the protein micropillar before cell detachment, and upon cell detachment the elastic component δE will be recovered, but the viscous component δνis will remain as the plastic deformation. Therefore, the elastic deformation δE was obtained as the measured difference between the bending displacement of the micropillar before and after cell detachment.27 The cells were detached from the protein micropillars by incubation with 0.25% trypsin for 15 minutes at room temperature. The traction force of a single cell is the mean value of all the bending micropillars dragged by that cell.
Statistical analysis
Quantitative analysis regarding the cell adhesion, transwell migration, cell–protein/cell-binding force and traction-force measurement are presented as mean ± standard deviation. Two-population t-tests were performed on the data of the adhesion assay, the binding-force measurement, the transwell assay, and the traction-force measurement. The results of Western blots were quantified by the software ImageJ version 1.42.
Results
Adhesion measurement of PMA-treated leukemia cells
Before discussing the single-cell manipulation experiments for adhesion and traction measurement, the use of the conventional MTT batch-cell assay to evaluate the adhesion behavior of the cells on substrates precoated with different proteins is first described. Figure 1A shows that after treatment with PMA, the K562 cells gathered together, but most of them were still suspended. However, after the PMA treatment, many of the THP1 cells were stuck to the substrate and behaved as adherent cells. To study the interaction of leukemia cells with their surrounding microenvironment, the ECMPs fibronectin and collagen I and the adhesion protein E-cadherin, which is thought to be closely related to the cell–cell junction, were investigated. From Figure 1B, we can see that the THP1 cells with PMA treatment had significantly higher absorbance values than those without PMA treatment (P<0.05), while the absorbance values of K562 cells with and without PMA treatment showed no significant difference (P>0.05). The results from the conventional adhesion assay thus suggest that treatment with PMA for 48 hours would change the adhesion property of THP1 cells but not the K562 cells. Figure 1C shows that in comparison with the BSA-substrate control, the fibronectin- and anti-E-cadherin-coated substrates helped increase the adhesion ability of K562 cells without PMA treatment (P<0.05), and the anti-E-cadherin-coated substrates helped increase the adhesion ability of THP1 cells without PMA treatment (P<0.05). Here, the previous inevitable trypsinization process may have affected the cells and their interactions with the protein-coated substrates and subsequently affected the statistical results, although any effect on viability was able to be minimized by optimizing the dose of trypsin and cell numbers, such as by minimizing proliferation in the MTT adhesion assay within a short time in most of the cases.
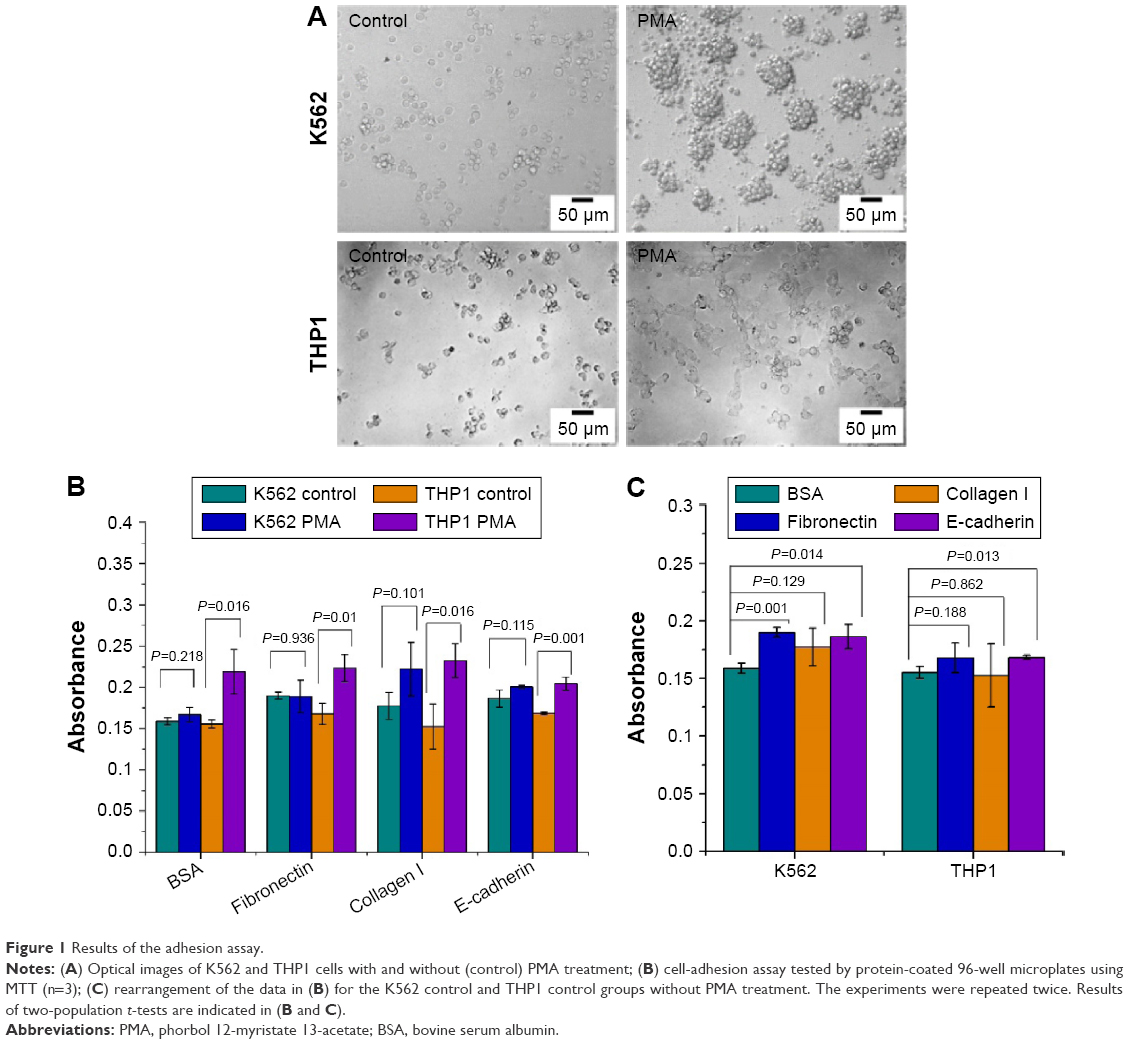 | Figure 1 Results of the adhesion assay. |
Figure 2 shows single-cell manipulation results obtained by using optical tweezers to measure the binding forces between leukemia cells and different proteins. In these experiments, polystyrene spheres were precoated with different proteins (Figure 2A), from which it can be seen that the spheres were fully covered by proteins. Then, a given sphere was trapped by the optical tweezers and brought into adhesive contact with a single leukemia cell stuck to the bottom of the confocal dish for 10 seconds. Attempts were then made to pull the sphere away from the cell at increasing laser power, and at a critical laser power the trapping force was strong enough to detach the sphere from the cell, as shown in Figure 2B. Figure 2C shows the precalibrated relations of the maximum trapping force of spheres coated with different proteins vs the laser power, from which the cell–protein binding force can be obtained from the critical laser power for cell-sphere detachment.
 | Figure 2 Binding forces between leukemia cells and protein-coated spheres, measured using optical tweezers. |
Figure 2D shows the measured binding forces between the leukemia cells and different proteins. Compared to the K562 cells, the THP1 cells treated with or without PMA showed higher binding forces with the all the proteins studied except fibronectin, and this is a direct, quantitative verification of the higher adhesion of THP1 cells that cannot be indicated clearly by the results in Figure 1. Two-population t-tests of the data in Figure 2D indicate that the PMA-treated K562 or THP1 cells exhibited significantly higher binding forces with collagen I and anti-E-cadherin proteins than those without PMA treatment (P<0.001). The results in Figure 3A and B show that after treatment with PMA for 48 hours, the expression of both E-cadherin and vimentin protein of the leukemia cells increased. These results thus suggest that PMA promoted E-cadherin protein expression in both K562 and THP1 cells, and hence their binding with anti-E-cadherin-coated spheres. In addition, in comparison with the control group (BSA protein), the binding forces of both K562 and THP1 cells with the fibronectin, collagen I, and E-cadherin proteins were measured to be significantly higher (P<0.001), as shown in Figure 2E. It can be also seen from Figure 2D that both K562 and THP1 cells transfected with SiR-E-cadherin siRNAs exhibited significantly lower binding forces with the anti-E-cadherin-coated spheres than their nontransfected counterparts.
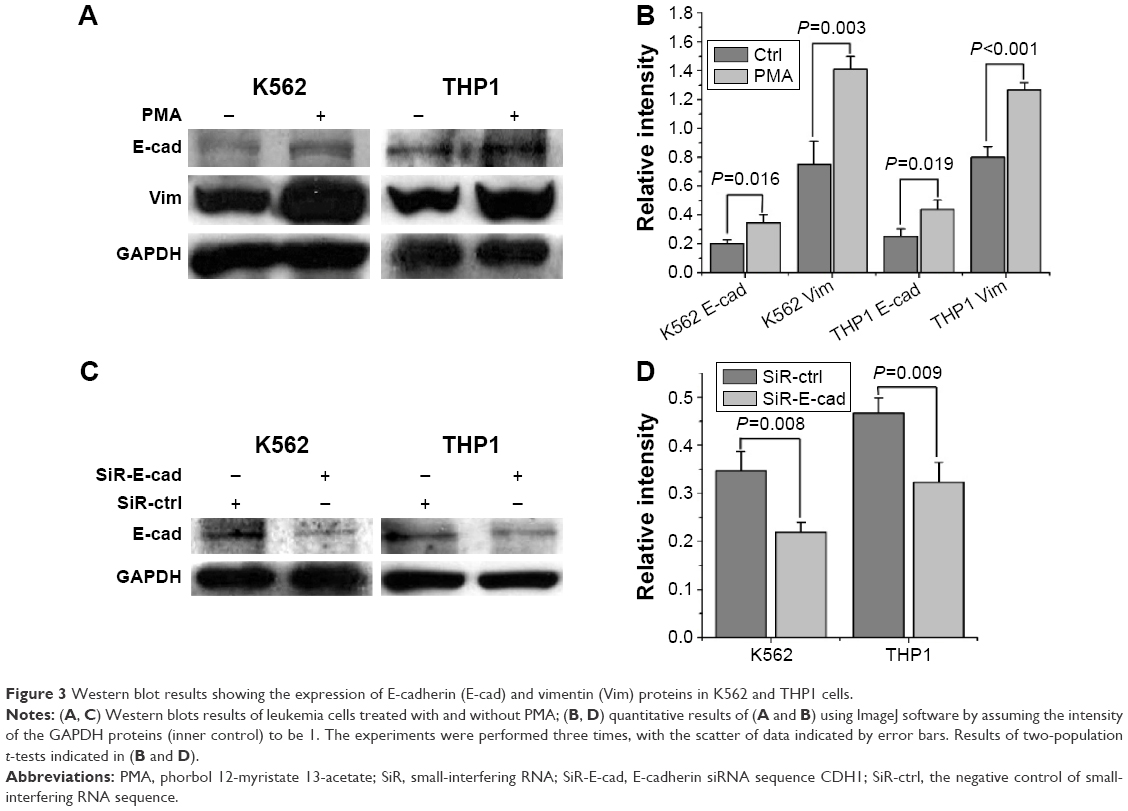 | Figure 3 Western blot results showing the expression of E-cadherin (E-cad) and vimentin (Vim) proteins in K562 and THP1 cells. |
The E-cadherin and vimentin protein expression of the leukemia cells was also directly measured by Western blots, as shown in Figure 3. The results in Figure 3C and D indicate that transfecting SiR-E-cadherin into the leukemia cells inhibited E-cadherin expression. The results in Figures 2 and 3 confirm that leukemia cells transfected with SiR-E-cadherin siRNAs interfered with the expression of E-cadherin proteins on their membrane surface, and since E-cadherin proteins bind exclusively with E-cadherin itself or with the E-cadherin antibody anti-E-cadherin, binding with the anti-E-cadherin-coated spheres became weaker. As the expression of E-cadherin protein is suppressed, the SiR-E-cadherin transfection should also reduce cell–cell contact in vivo.
In order to mimic the cell–cell interaction in the BM niche, the binding forces of K562 and THP1 cells with hBMSCs and hFBs were also measured by optical tweezers. These experiments were similar to the ones depicted in Figure 2, except that now a K562 or THP1 cell instead of a protein-coated bead was trapped by the laser and made to bind with an hBMSC or hFB. Figure 4A and B shows the force-calibration graph of trapped K562 and THP1 cells and the optical images of the cell–cell contact, respectively. In Figure 4C, the binding forces between hBMSCs and leukemia cells K562 and THP1 were measured to be 135.3 and 200.4 pN, higher than the values of 69.6 and 126.4 pN between hFBs and leukemia cells K562 and THP1, respectively. The binding forces of hBMSCs K562 and THP1 and hFBs K562 and THP1 treated with PMA increased to 201.5, 314.2, 107.5, and 175.7 pN, respectively. Two-population t-tests indicated that the binding forces of the leukemia cells treated with PMA were significantly higher than those exhibited by cells without the PMA treatment (P<0.001, except for P<0.01 in the case of the hFB THP1).
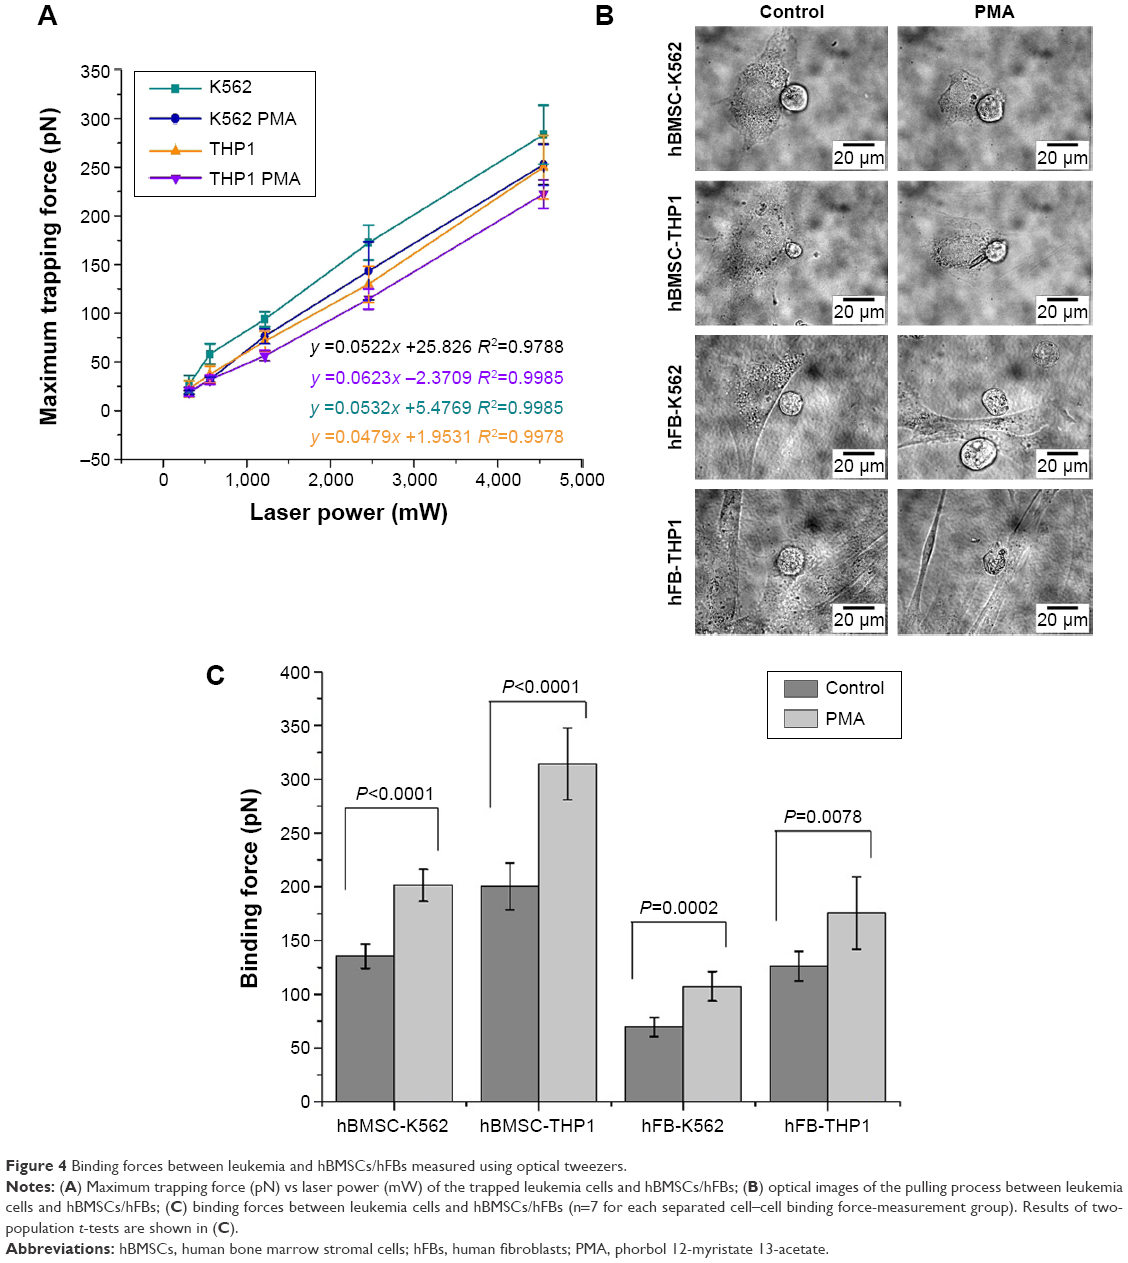 | Figure 4 Binding forces between leukemia and hBMSCs/hFBs measured using optical tweezers. |
Migration measurement of PMA-treated leukemia cells
To evaluate the migration of the leukemia cells treated with and without PMA, the leukemia cells were cultured in the upper chambers of the cell-invasion assay, which were precoated with BSA, fibronectin, collagen I, or anti-E-cadherin. Figure 5A and B shows that some of the leukemia cells stuck to the adhesion proteins of fibronectin, collagen I, or anti-E-cadherin in the upper chamber and were prevented from getting through the holes of the cell-invasion assay. The adhesion proteins studied obviously helped decrease the migration ability of the leukemia cells. However, again the batch-cell assay results in Figure 5 may not provide sufficient quantitative information of the migration. For this reason, traction-force microscopy was carried out (Figure 6). In these experiments, cells were cultured on a matrix of BSA micropillars fabricated by a multiphoton photochemical cross-linking technique in a confocal microscope. The migration behavior of the cells then caused the micropillars to bend, and the traction force responsible for the bending was then evaluated from the measured bending displacement of the micropillars, after the stiffness of the latter was carefully calibrated.
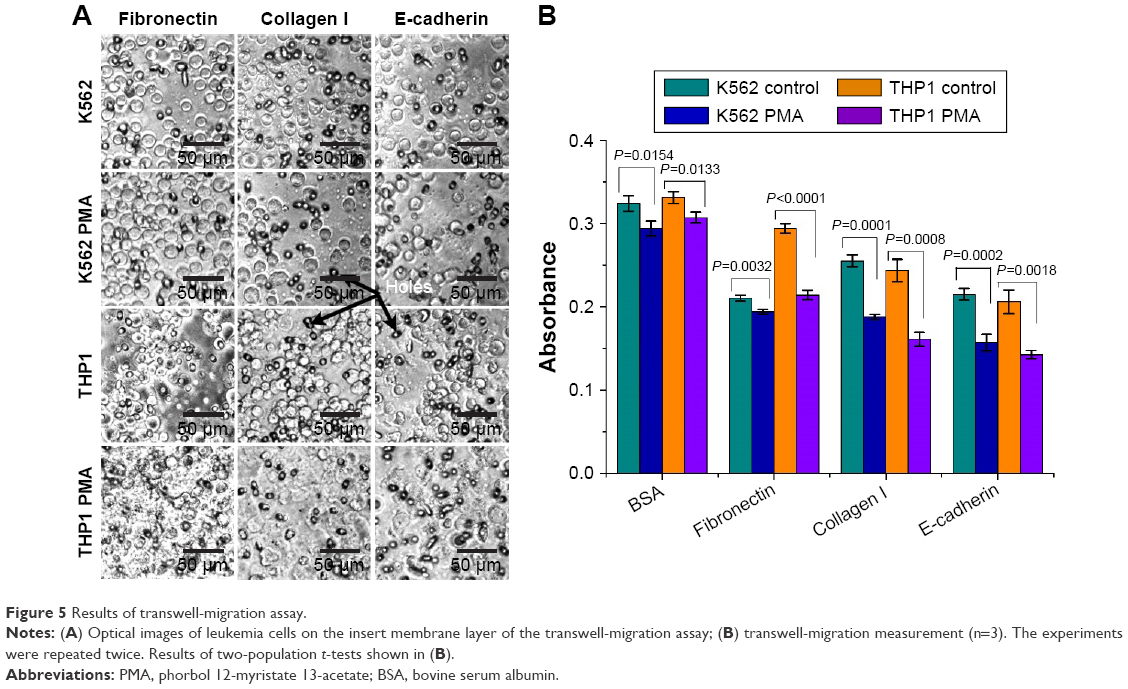 | Figure 5 Results of transwell-migration assay. |
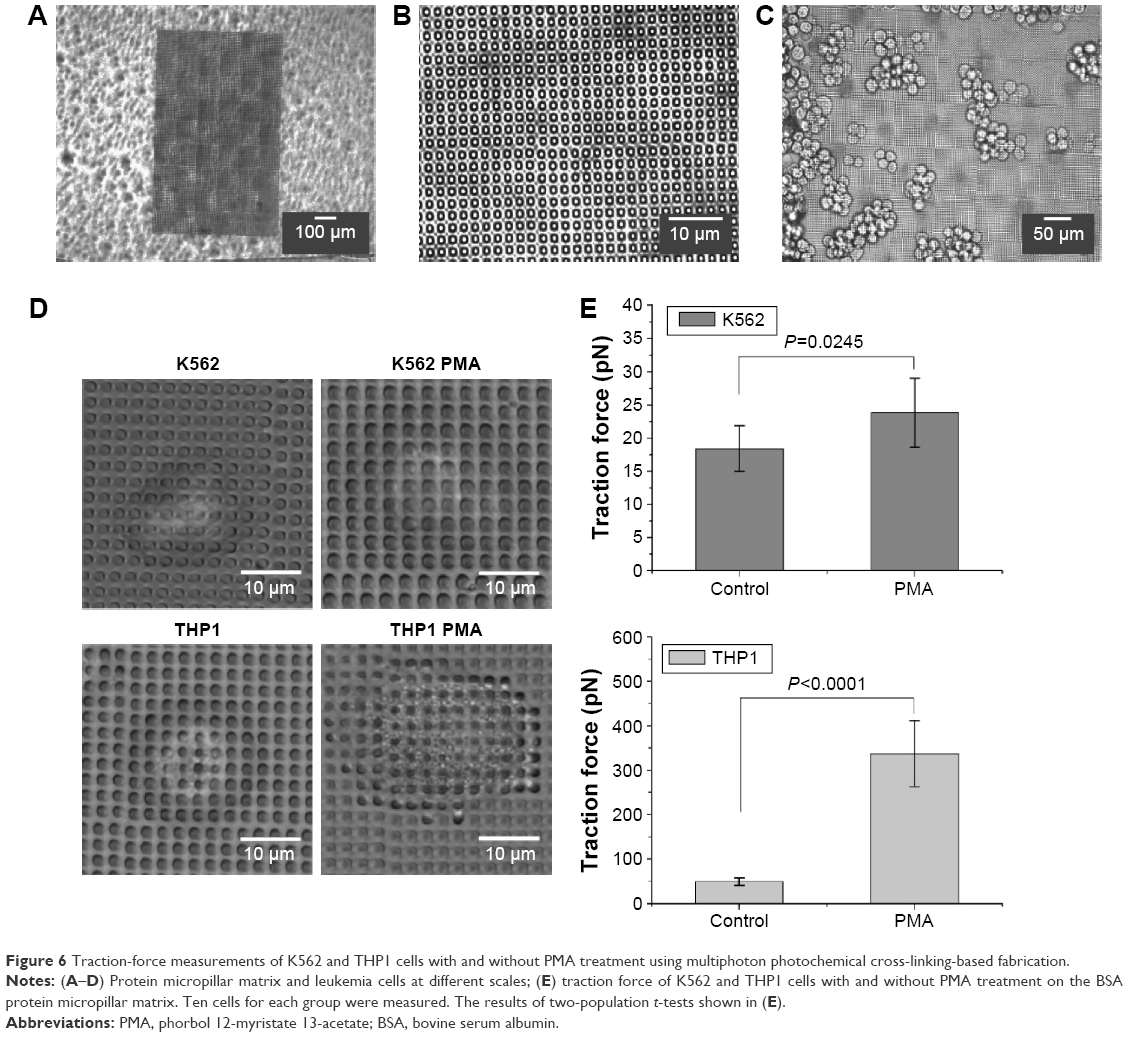 | Figure 6 Traction-force measurements of K562 and THP1 cells with and without PMA treatment using multiphoton photochemical cross-linking-based fabrication. |
Figure 6A–C shows the BSA micropillar matrix cultured with leukemia cells at different magnifications. Figure 6D shows typical K562 and THP1 cells treated with or without PMA on the BSA micropillar matrix. The results in Figure 6E show that the traction force of the THP1 cells treated with PMA on the BSA micropillar matrix was up to 337.4 pN, significantly larger than that of cells without PMA treatment (P<0.001). On the other hand, the traction force of the K562 cells treated with or without PMA also exhibited a statistically significant difference (P<0.05), although the difference was not larger than that between THP1 cells with or without PMA treatment. These single-cell results suggest that the PMA would produce insignificant effects on the migration potential of K562 cells on a BSA matrix, which would agree with the transwell-migration assay results in Figure 5B. However, the single-cell results in Figure 6E clearly indicate that PMA treatment significantly increased traction force and hence would decrease the migration potential of THP1 cells on a BSA substrate, and this contradicts the implication from the batch-cell assay results in Figure 5B, which show that the quantities of THP1 cells appearing on the other side of the transwell-migration assay were similar with or without the PMA treatment. This difference may be due to the fact that the leukemia cells in the transwell-migration assay had to be trypsinized in order to allow them to be counted at the beginning, but trypsinized nonadherent cells may not be precisely of the same state as cells in vivo. The results in Figure 6 thus indicate that the intrinsic migration ability of cells was not accurately reflected by the conventional batch-cell transwell-migration assay in Figure 5.
Discussion
Accurately knowing the detailed effects of cancer treatment is an important step in developing effective therapies for leukemia treatment. The general effectiveness of a drug is normally assessed by its effects on cells, including adhesion,38 migration,39 proliferation,40 differentiation,41 and death.42 For the specific issue of cancer metastasis, however, a desirable treatment outcome should be linked to the intrinsic ability of the drug to promote cell adhesion and suppress cell migration, so that the release of diseased leukocytes from the BM into the bloodstream would be limited.43 Therefore, accurately knowing the interaction forces between cells and cell–proteins would allow better comprehension of the potential therapeutic effect of drug candidates.44
However, many agents, such as the PMA studied here, which was used in clinical trials for hematologic malignancy,45,46 are activators in the signaling transduction pathway of PKC,47 which can affect not only the adhesion and migration behavior of cells but also their proliferation, differentiation, and death. For such agents, the conventional batch-cell adhesion assays (such as that shown in Figure 1), may not give a precise indication of the intrinsic cell adhesion and hence metastatic potential, since cell proliferation is also affected by the treatment and the cell adhesion may be affected by the trypsinization. Similarly, for transwell migration, simple measurement of the number of cells that appear on the other side of a batch-cell transwell migration (ie, Figure 5) assay may also give misleading information on the intrinsic cell-migration effect of the treatment. Also, although Western blot can be used to measure the protein markers related to cell adhesion or migration, it is an indirect method yielding only qualitative instead of quantitative indication for adhesion or migration. For such treatments that produce multiple cellular effects, the most reliable method is thus a single-cell assay that allows direct measurement of the cell adhesion or traction on a substrate coated with the cell–proteins in question. The present work illustrates that quantitative measurement of the interaction or traction forces between cells and cell–proteins can be directly made using optical tweezers or traction-force microscopy. The interaction forces measured this way provide the most direct indication of the effect of a given drug or agent on cell-adhesion or -migration properties.
The BMS microenvironment nurtures the hematopoietic and leukemia cells and secretes growth factors and matrix proteins that regulate the interaction of hematopoietic and leukemia cells with hBMSCs.48 In Figures 2 and 4, the binding forces of leukemia cells with the ECMP (fibronectin and collagen I), as well as the adhesion proteins E-cadherin, hBMSCs, and hFBs, were measured, and the results showed that the adhesion of leukemia cells was regulated by their surrounding microenvironment. The binding force measured by optical tweezers truly represents the interaction between leukemia cells and their microenvironment. Leukemia cells are thought to arise from the HSCs, caused by mutations and/or selective expression of genes that enhance their limited self-renewal capabilities.49 Leukemia cells exhibit low expression of E-cadherin, loss of homophilic adhesion,7 and decreased cell–cell interaction, which are factors that may promote their escape from the BM niche. The Western blots in Figure 3A and B show that after treatment with PMA, both K562 and THP1 cells showed higher E-cadherin protein expression. Strong adhesion between leukemia cells and E-cadherin can also be seen from Figure 2. The role of E-cadherin in cell–cell interaction was further examined by using SiRNA interference. As shown in Figure 3C and D, SiR-E-cadherin-interfered leukemia cells exhibited low expression of E-cadherin protein, as detected by Western blot, and Figure 2 shows that the optical tweezers were able to detect sensitively the reduction in binding forces with the anti-E-cadherin proteins. A high expression of the mesenchymal intermediate filament protein vimentin was also detected by Western blot after PMA treatment, which is consistent with other findings.50
Although optical tweezers21 and traction-force microscopy51 have been around for some time, there is still plenty of room for the development of new applications and experimental protocols of these techniques. In the present work, a detailed protocol for the direct measurement of cell–protein and cell–cell interactions by optical tweezers was demonstrated, in which the sphere-coating and contact procedures can make the measurement more repeatable and hence offering a more stable outcome. Furthermore, in the traction-force microscopy experiments, a novel protocol involving protein micropillar matrices27 fabricated by a multiphoton, photochemical cross-linking technique,27 combined with the rate-jump method,29 which is a far more reliable method for measuring the stiffness of viscoelastic protein pillars, enabled more accurate results to be obtained.
Finally, the observation that the transwell migration of leukemia cells driven by chemotaxis was suppressed by the ECMPs fibronectin and collagen I or anti-E-cadherin suggests that both alteration of the surrounding microenvironment and the membrane-surface proteins of leukemia cells could lead to a change of migration. The traction forces measured in Figure 6 showed that THP1 cells had much stronger interaction with the BSA substrate than the K562 cells and behaved like adherent cells. This is consistent with Figure 1A, where many THP1 cells treated with PMA were stuck to the substrate. The traction-force microscopy technique illustrated in Figure 6 can be used to study cells in contact with a substrate during migration, in order to evaluate the behavior of cells in therapy.
Conclusion
Optical tweezers and traction-force microscopy were applied to measure quantitatively the pico-Newton level mechanical forces in single cell–protein and cell–cell interactions. PMA treatment was found to promote the interaction of K562 or THP1 leukemia cells with ECMPs, BMSCs, or hFBs. The results indicate that PMA treatment increases the adhesion and decreases the migration of K562 and THP1 cells in their microenvironment.
Acknowledgments
We thank Professor AY Leung for providing the K562 and THP1 leukemia cells and Professor WW Lu for the bone marrow stromal cells. This work was supported by the Kingboard Endowed Professorship fund to AHW Ngan.
Disclosure
The authors report no conflicts of interest in this work.
References
Mendelson A, Frenette PS. Hematopoietic stem cell niche maintenance during homeostasis and regeneration. Nat Med. 2014;20(8):833–846. | ||
Vituri CL, Alvarez-Silva M, Trentin AG, Borelli P. Alterations in proteins of bone marrow extracellular matrix in undernourished mice. Braz J Med Biol Res. 2000;33(8):889–895. | ||
Bradstock KF, Makrynikola V, Bianchi A, Shen W, Hewson J, Gottlieb DJ. Effects of the chemokine stromal cell-derived factor-1 on the migration and localization of precursor-B acute lymphoblastic leukemia cells within bone marrow stromal layers. Leukemia. 2000;14(5):882–888. | ||
Moh MC, Shen S. The roles of cell adhesion molecules in tumor suppression and cell migration: a new paradox. Cell Adh Migr. 2009;3(4):334–336. | ||
Kim SH, Turnbull J, Guimond S. Extracellular matrix and cell signalling: the dynamic cooperation of integrin, proteoglycan and growth factor receptor. J Endocrinol. 2011;209(2):139–151. | ||
Nelson WJ. Regulation of cell-cell adhesion by the cadherin-catenin complex. Biochem Soc Trans. 2008;36(Pt 2):149–155. | ||
Rao Q, Wang JY, Meng J, et al. Low-expression of E-cadherin in leukaemia cells causes loss of homophilic adhesion and promotes cell growth. Cell Biol Int. 2011;35(9):945–951. | ||
Jin L, Tabe Y, Konoplev S, et al. CXCR4 up-regulation by imatinib induces chronic myelogenous leukemia (CML) cell migration to bone marrow stroma and promotes survival of quiescent CML cells. Mol Cancer Ther. 2008;7(1):48–58. | ||
Frantz C, Stewart KM, Weaver VM. The extracellular matrix at a glance. J Cell Sci. 2010;123(Pt 24):4195–4200. | ||
Zou L, Cao S, Kang NL, Huebert RC, Shah VH. Fibronectin induces endothelial cell migration through β1 integrin and Src-dependent phosphorylation of fibroblast growth factor receptor-1 at tyrosines 653/654 and 766. J Biol Chem. 2012;287(10):7190–7202. | ||
Blumberg PM. Protein kinase C as the receptor for the phorbol ester tumor promoters: sixth Rhoads Memorial Award lecture. Cancer Res. 1988;48(1):1–8. | ||
Auwerx J. The human leukemia cell line, THP-1: a multifacetted model for the study of monocyte-macrophage differentiation. Experientia. 1991;47(1):22–31. | ||
Daigneault M, Preston JA, Marriott HM, Whyte MK, Dockrell DH. The identification of markers of macrophage differentiation in PMA-stimulated THP-1 cells and monocyte-derived macrophages. PLoS One. 2010;5(1):e8668. | ||
Huo XF, Yu J, Peng H, et al. Differential expression changes in K562 cells during the hemin-induced erythroid differentiation and the phorbol myristate acetate (PMA)-induced megakaryocytic differentiation. Mol Cell Biochem. 2006;292(1–2):155–167. | ||
Padilla PI, Wada A, Yahiro K, et al. Morphologic differentiation of HL-60 cells is associated with appearance of RPTPβ and induction of Helicobacter pylori VacA sensitivity. J Biol Chem. 2000;275(20):15200–15206. | ||
Tamayo P, Slonim D, Mesirov J, et al. Interpreting patterns of gene expression with self-organizing maps: methods and application to hematopoietic differentiation. Proc Natl Acad Sci U S A. 1999;96(6):2907–2912. | ||
Lozzio CB, Lozzio BB. Human chronic myelogenous leukemia cell-line with positive Philadelphia chromosome. Blood. 1975;45(3):321–334. | ||
Jongen-Lavrencic M, Salesse S, Delwel R, Verfaillie CM. BCR/ABL-mediated downregulation of genes implicated in cell adhesion and motility leads to impaired migration toward CCR7 ligands CCL19 and CCL21 in primary BCR/ABL-positive cells. Leukemia. 2005;19(3):373–380. | ||
Tsuchiya S, Yamabe M, Yamaguchi Y, Kobayashi Y, Konno T, Tada K. Establishment and characterization of a human acute monocytic leukemia cell line (THP-1). Int J Cancer. 1980;26(2):171–176. | ||
Gou X, Wang R, Lam SS, Hou JD, Leung AY, Sun D. Cell adhesion manipulation through single cell assembly for characterization of initial cell-to-cell interaction. Biomed Eng Online. 2015;14:114. | ||
Ashkin A, Dziedzic JM, Bjorkholm JE, Chu S. Observation of a single-beam gradient force optical trap for dielectric particles. Opt Lett. 1986;11(5):288. | ||
Binnig G, Quate CF, Gerber C. Atomic force microscope. Phys Rev Lett. 1986;56(9):930–933. | ||
Zhou ZL, Tang B, Ngan AH, Dong ZN, Wu YS. Hepatitis B surface antigen-antibody interactions studied by optical tweezers. IET Nanobiotechnol. 2012;6(1):9–15. | ||
Morrison SJ, Scadden DT. The bone marrow niche for haematopoietic stem cells. Nature. 2014;505(7483):327–334. | ||
Shiozawa Y, Havens AM, Pienta KJ, Taichman RS. The bone marrow niche: habitat to hematopoietic and mesenchymal stem cells, and unwitting host to molecular parasites. Leukemia. 2008;22(5):941–950. | ||
Chan BP, Ma JN, Xu JY, Li CW, Cheng JP, Cheng SH. Femto-second laser-based free writing of 3D protein microstructures and micropatterns with sub-micrometer features: a study on voxels, porosity, and cytocompatibility. Adv Funct Mater. 2014;24(3):277–294. | ||
Tong MH, Huang N, Zhang W, et al. Multiphoton photochemical crosslinking-based fabrication of protein micropatterns with controllable mechanical properties for single cell traction force measurements. Sci Rep. 2016;6:20063. | ||
Larue L, Bellacosa A. Epithelial-mesenchymal transition in development and cancer: role of phosphatidylinositol 3' kinase/AKT pathways. Oncogene. 2005;24(50):7443–7454. | ||
Zhou Z, Zheng C, Li S, et al. AFM nanoindentation detection of the elastic modulus of tongue squamous carcinoma cells with different metastatic potentials. Nanomedicine. 2013;9(7):864–874. | ||
Wells A, Yates C, Shepard CR. E-cadherin as an indicator of mesenchymal to epithelial reverting transitions during the metastatic seeding of disseminated carcinomas. Clin Exp Metastasis. 2008;25(6):621–628. | ||
Yao D, Dai C, Peng S. Mechanism of the mesenchymal-epithelial transition and its relationship with metastatic tumor formation. Mol Cancer Res. 2011;9(12):1608–1620. | ||
Cougoule C, Le Cabec V, Poincloux R, et al. Three-dimensional migration of macrophages requires Hck for podosome organization and extracellular matrix proteolysis. Blood. 2010;115(7):1444–1452. | ||
Zhou ZL, Sun XX, Ma J, et al. Mechanical oscillations enhance gene delivery into suspended cells. Sci Rep. 2016;6:22824. | ||
Hällström W, Lexholm M, Suyatin DB, et al. Fifteen-piconewton force detection from neural growth cones using nanowire arrays. Nano Lett. 2010;10(3):782–787. | ||
Zhou ZL, Hui TH, Tang B, Ngan AH. Accurate measurement of stiffness of leukemia cells and leukocytes using an optical trap by a rate-jump method. RSC Adv. 2014;4(17):8453–8460. | ||
Zhou ZL, Ngan AH, Tang B, Wang AX. Reliable measurement of elastic modulus of cells by nanoindentation in an atomic force microscope. J Mech Behav Biomed Mater. 2012;8:134–142. | ||
Baumgart E. Stiffness: an unknown world of mechanical science? Injury. 2000;31 (Suppl 2):S-B14–S-B23. | ||
Damiano JS, Hazlehurst LA, Dalton WS. Cell adhesion-mediated drug resistance (CAM-DR) protects the K562 chronic myelogenous leukemia cell line from apoptosis induced by BCR/ABL inhibition, cytotoxic drugs, and gamma-irradiation. Leukemia. 2001;15(8):1232–1239. | ||
Voermans C, van Heese WP, de Jong I, Gerritsen WR, van der Schoot CE. Migratory behavior of leukemic cells from acute myeloid leukemia patients. Leukemia. 2002;16(4):650–657. | ||
Chung EJ, Hwang SG, Nguyen P, et al. Regulation of leukemic cell adhesion, proliferation, and survival by β-catenin. Blood. 2002;100(3):982–990. | ||
Nowak D, Stewart D, Koeffler HP. Differentiation therapy of leukemia: 3 decades of development. Blood. 2009;113(16):3655–3665. | ||
Dartsch DC, Schaefer A, Boldt S, Kolch W, Marquardt H. Comparison of anthracycline-induced death of human leukemia cells: programmed cell death versus necrosis. Apoptosis. 2002;7(6):537–548. | ||
Liao WT, Ye YP, Deng YJ, Bian XW, Ding YQ. Metastatic cancer stem cells: from the concept to therapeutics. Am J Stem Cells. 2014;3(2):46–62. | ||
Sawyers C. Targeted cancer therapy. Nature. 2004;432(7015):294–297. | ||
Han ZT, Zhu XX, Yang RY, et al. Effect of intravenous infusions of 12-O-tetradecanoylphorbol-13-acetate (TPA) in patients with myelocytic leukemia: preliminary studies on therapeutic efficacy and toxicity. Proc Natl Acad Sci U S A. 1998;95(9):5357–5361. | ||
Schaar D, Goodell L, Aisner J, et al. A phase I clinical trial of 12-O-tetradecanoylphorbol-13-acetate for patients with relapsed/refractory malignancies. Cancer Chemother Pharmacol. 2006;57(6):789–795. | ||
Nishizuka Y. The role of protein kinase C in cell surface signal transduction and tumour promotion. Nature. 1984;308(5961):693–698. | ||
Civini S, Jin P, Ren J, et al. Leukemia cells induce changes in human bone marrow stromal cells. J Transl Med. 2013;11:298. | ||
Passegue E, Jamieson CH, Ailles LE, Weissman IL. Normal and leukemic hematopoiesis: are leukemias a stem cell disorder or a reacquisition of stem cell characteristics? Proc Natl Acad Sci U S A. 2003;100 Suppl 1:11842–11849. | ||
Paulsen K, Tauber S, Timm J, et al. The cannabinoid receptors agonist WIN55212-2 inhibits macrophageal differentiation and alters expression and phosphorylation of cell cycle control proteins. Cell Commun Signal. 2011;9:33. | ||
Maskarinec SA, Franck C, Tirrell DA, Ravichandran G. Quantifying cellular traction forces in three dimensions. Proc Natl Acad Sci U S A. 2009;106(52):22108–22113. |
 © 2016 The Author(s). This work is published and licensed by Dove Medical Press Limited. The full terms of this license are available at https://www.dovepress.com/terms.php and incorporate the Creative Commons Attribution - Non Commercial (unported, v3.0) License.
By accessing the work you hereby accept the Terms. Non-commercial uses of the work are permitted without any further permission from Dove Medical Press Limited, provided the work is properly attributed. For permission for commercial use of this work, please see paragraphs 4.2 and 5 of our Terms.
© 2016 The Author(s). This work is published and licensed by Dove Medical Press Limited. The full terms of this license are available at https://www.dovepress.com/terms.php and incorporate the Creative Commons Attribution - Non Commercial (unported, v3.0) License.
By accessing the work you hereby accept the Terms. Non-commercial uses of the work are permitted without any further permission from Dove Medical Press Limited, provided the work is properly attributed. For permission for commercial use of this work, please see paragraphs 4.2 and 5 of our Terms.