")
Back to Journals » International Journal of Nanomedicine » Volume 9 » Issue 1
Nanocomplexes of an insulinotropic drug: optimization, microparticle formation, and antidiabetic activity in rats
Authors Elmowafy E, Osman R , El-Shamy AH, Awad G
Received 27 April 2014
Accepted for publication 12 June 2014
Published 18 September 2014 Volume 2014:9(1) Pages 4449—4465
DOI https://doi.org/10.2147/IJN.S66876
Checked for plagiarism Yes
Review by Single anonymous peer review
Peer reviewer comments 3
Enas Elmowafy, Rihab Osman, Abdel Hameed El-Shamy,† Gehanne AS Awad
Department of Pharmaceutics and Industrial Pharmacy, Faculty of Pharmacy, Ain Shams University, Cairo, Egypt
†Abdel Hameed El-Shamy passed away on August 25, 2013
Abstract: The aim of the present work was to test the ability of two non-diabetogenic carbohydrates to intranasally deliver the insulinotropic drug repaglinide (REP) for controlling blood glucose level. REP was loaded onto chitosan/alginate nanocomplexes (NCs) suitable for mucosal delivery and uptake. Improved stability and delivery characteristics were obtained by spray drying the selected NCs, yielding microparticles. A statistical experimental design was adopted to investigate the effects of the formulations’ variables on two critical responses: NC size and drug entrapment efficiency. Physicochemical characterizations of the network’s structures were done, and in vitro cytotoxicity and histopathological studies were conducted. The potential of the developed system to prolong the drug effect was tested on diabetic rats. The results showed that to attain particles suitable for nasal delivery, alginate should be used at its lowest level used in this study (0.6 mg/mL). A low level of chitosan (0.5 mg/mL) was needed when the drug was cation-loaded, while the high chitosan level (1 mg/mL) was more suitable when REP was anion-loaded. The best entrapment efficiency was achieved at a theoretical drug loading of 0.025 mg/mL. Discrete NCs could be rapidly recovered from the spray-dried microparticles. The cytotoxicity and histopathological studies indicated that such formulations were well tolerated. The antihyperglycemic activity of the nasally administered formulae was gradual but was significantly sustained over 24 hours, suggesting NC mucosal uptake. Nasal delivery of such dry powders achieved better glycemic control compared with the conventional oral tablets.
Keywords: nanocomplexes, microparticles, spray drying, nasal delivery, antidiabetic effect
Introduction
Nanocomplexes (NCs) comprising naturally occurring polysaccharides such as chitosan (CS) and alginate (ALG) currently receive extensive attention in mucosal drug-delivery applications. The spontaneous formation of CS/ALG NCs by the ionic gelation technique offer several advantages by allowing the production of nontoxic, organic solvent-free, homogenous NCs with controllable size, providing also efficient limited release of entrapped drugs.1
Moreover, due to their prolonged intimate contact with the mucosa, these NCs can effectively enhance the transport of drugs across well organized epithelial barriers such as nasal mucosa depending on the carrier properties.2 The reduction of the particle size (PS) to 100–300 nm could enhance the potential mucosal particle uptake.3 The ability of transiently opening the tight junctions, imparted by certain hydrophilic carriers, provides an additional efficient mean for nanocarrier paracellular transport.4 Furthermore, hydrophilic particles, by their avoidance of clearance by the reticuloendothelial system, will have prolonged circulation time with improved bioavailability at the target site.5
During NC formation, electrostatic interactions constitute the main attractive forces, but hydrogen bonding, ion dipole forces, and hydrophobic interactions frequently play a significant role in determining the ultimate structures. The properties of polyelectrolyte complexes are influenced not only by the polymer’s chemical composition, but also by secondary experimental conditions such as polyelectrolyte concentrations, mixing ratio, ionic strength, and pH.6
Achieving long-term stability of colloidal systems has always been a challenge. Moreover, owing to their small dimensions, NCs suffer from strong inter-particle adhesion and aggregation, difficult redispersion, and scalability with low reproducibility and drug-delivery efficiency.2 In this respect, NCs agglomerated in dry microparticles (MPs) are highly superior from the standpoint of improved stability and ease of handling, portability, and drug delivery.2 Recovery of NCs after delivery will confer their ultimate advantages of huge surface area and ability to surmount the cellular barriers to the delivery system.
Repaglinide (REP) is a fast-acting insulinotropic agent with an insulin release profile that mimics that of physiological glucose-stimulated insulin release. It is used in the management of type 2 diabetes, controlling both postprandial blood glucose (BG) and fasting BG levels, thereby minimizing the risk of diabetes-associated complications.7,8 Chemically, REP is a carbamoyl methyl benzoic acid derivative (Figure S1). This amphoteric drug shows rapid absorption after oral administration owing to its lipophilicity (log P, 3.97).9 REP is currently available on the market as oral conventional tablets, with a short plasma half-life (<1 hour) and low bioavailability (50%) resulting from extensive first-pass metabolism.10 Intranasal (IN) delivery of this drug would circumvent some of these drawbacks.11 The formulation of spray-dried MPs for sustained REP release has previously been demonstrated.12
The goal of this study was to encapsulate REP in CS/ALG NCs suitable for IN delivery. The selected NCs were then cospray-dried with a suitable carrier, aiming at achieving improved stability and delivery characteristics in addition to fast redispersion for subsequent NC recovery. The formulation variables were changed according to a statistically designed experiment. We hypothesized that the spray-dried MPs will be able to deagglomerate in the nasal secretions, allowing the release of REP-loaded NCs. Surface characteristics and ability of the system to easily recover the NCs were investigated using scanning electron microscopy (SEM), time-sequential morphological examinations. Their potential to provide control over the BG levels following nasal administration to diabetic rats was tested. Cytotoxicity and tolerability studies on nasal mucosal tissues were also evaluated.
Materials and methods
Materials
CS, viscosity 9 cP was sourced from Primex Ehf (Siglufjordur, Iceland); sodium ALG, from Memphis (Cairo, Egypt); REP powder and marketed tablet (Repaglinide® 1 mg), from EIPICO (Ash Sharqiyah, Egypt); leucine (LEU), from Fluka production GmbH (Buchs, Switzerland); MTT (3-(4,5-dimethylthiazol-2-yl)-2,5-diphenyl-tetrazolium bromide), HEPES buffer, fetal calf serum, gentamycin, dimethyl sulfoxide, sodium lauryl sulfate (SLS), and streptozotocin (STZ), from Sigma-Aldrich Co., St Louis, MO, USA; Minimum Essential Medium (MEM), from Lonza (Verviers, Belgium); and L-glutamine GIBCO®, from Thermo Fisher Scientific (Waltham, MA, USA).
Experimental design
An unreplicated two-level full factorial experimental design was built up to evaluate the main effects and interactions of four variables: concentrations of CS (A) at 0.5 and 1 mg/mL; ALG (B) at 0.6 and 0.8 mg/mL; REP (C) at 0.025 and 0.05 mg/mL of final dispersion; and drug placement (D) in solutions of ALG (anionic – low level) or CS (cationic – high level). The studied responses were NC PS and drug entrapment efficiency (EE%). To validate the model prediction performance, four central points were chosen according to the contour plots obtained at the minimum and maximum levels of variables C and D. Bias was determined by comparing actual and predicted values. Agreement below 30% bias was considered acceptable.13
Preparation of CS/ALG NCs in MPs
Preparation of CS/ALG NCs
CS was dissolved in an aqueous solution of 0.25% v/v acetic acid, filtered, and adjusted to pH 5 using 1 N NaOH solution. Filtered ALG solution was dripped into CS solution under moderate stirring at room temperature for 15 minutes to form plain NCs. For drug-loaded NCs, REP was dissolved in the least volume of 0.1 N NaOH or HCl and then mixed with either aqueous ALG (anion-loading) or CS (cation-loading) solutions, respectively. The resultant dispersion was centrifuged on a 10 μL glycerol layer (15,000× g, 30 minutes, 25°C) (model Z216MK, Hermle Labortechnik GmbH, Wehingen, Germany). The sediment was resuspended in water (100 μL) then freeze dried and used for subsequent differential scanning calorimetry (DSC) and Fourier transform infrared (FT-IR) studies, while the supernatant was left for determination of EE%.
Preparation of REP loaded CS/ALG NCs in MPs by spray drying
Selected REP-loaded CS/ALG NC dispersions were cospray-dried with 0.1% w/v LEU using a mini spray dryer (Nano Spray Dryer B-290; BUCHI Labortechnik AG, Flawil, Switzerland) at pump rate 4%, inlet temperature 120°C, air flow rate 400 L/h, and aspirator rate 92%. The outlet temperature ranged from 76°C to 79°C. The spray-dried powders (SDP) were collected and stored in desiccators at room temperature.
NC characterization
The dynamic light scattering technique was used to determine the average hydrodynamic diameter, polydispersity index, and zeta potential of the particles in the freshly prepared dispersions using a Zetasizer® Nano-ZS (Malvern Instruments, Malvern, UK). Drug EE% was determined in the supernatant by ultraviolet (UV) spectrophotometry (UV-1601 PC; Shimadzu, Kyoto, Japan) at 243 nm. Drug EE% was calculated as follows:
| (1) |

DSC and FT-IR
DSC and FT-IR analysis were performed on REP, CS, ALG, their physical mixture and selected NCs as described in a previous work.11
NCs in MP characterization
Spray-dried powders were evaluated as described previously.11 The spray drying process yield values were calculated by gravimetry. The fixed height cone method was adopted for calculating the angle of repose. Water content was determined by thermogravimetric analysis, using a TGA 7 (Perkin Elmer, Waltham, MA, USA). The PS, expressed as volume mean diameter, was calculated using a laser diffraction PS analyzer (Mastersizer X; Malvern Instruments Ltd) after suspending 2–3 mg of each powder in isopropanol. Drug content was evaluated by treating SDP with concentrated HCl solution to discharge the drug from NCs. After proper dilution, the drug content was determined by UV spectrophotometry at 243 nm, and the drug incorporation efficiency in the MPs was calculated by comparing the actual with the theoretical drug-loading values. In vitro REP release studies were performed by adding a suitable amount of SDP (equivalent to 1 mg REP) to 10 mL of phosphate buffered saline (PBS, pH 6.8) in tubes shaken at 30 rpm maintained at 37°C±0.5°C.11,14 At specified time intervals, samples were removed and replaced with fresh PBS. The samples were centrifuged, properly diluted as required, and analyzed spectrophotometrically to determine the concentration of REP. In vitro release profiles were analyzed using different kinetic models (zero order, first order, and Higuchi’s model), and the release mechanism using Korsmeyer-Peppas model.15
Morphological examination
Transmission electron microscopy (TEM)
Fresh NCs were observed using high resolution TEM (Jeol, Tokyo, Japan) operating at 200 kV. Time-sequential TEM images of recovered NC formulae, after suspending the MPS in PBS (pH 6.8) at different time intervals, were also carried out.
Atomic force microscopy (AFM)
Fresh and recovered NCs were visualized using Dimension 3,100 Scanning Probe Microscope (Veeco Instruments, Santa Barbara, CA, USA), equipped with NanoScope III controller as described elsewhere.16 Topographical images were plane-flattened and analyzed by the computer software Nanoscope Software version 7.3 or SPIP version 3.3.6.
SEM
Morphological characteristics of NCs in MPs were examined by SEM (Zeiss, Jena, Germany).
Suitability for nasal delivery
Ex vivo mucoadhesive strength determination
Mucoadhesion studies of NCs in MPs were carried out on freshly excised sheep nasal mucosa obtained from the local slaughterhouse using a texture analyzer (TAXT plus; Stable Micro Systems Ltd, Godalming, UK) as previously explained elsewhere.17 Peak detachment force (N) was calculated using Texture Exponent software.
Insufflator dose reproducibility
A quantitative assay was used to test the dose reproducibility of the monodose nasal insufflator (MIAT S.p.A., Milan, Italy) at two doses (5 and 10 mg). Accurately weighed amounts of selected SDP were filled into No 3 capsules and placed in the insufflator. The rubber bulb was squeezed to allow the SDP to be sprayed. After each puff, for a total of three puffs, the amount of delivered SDP was determined using weight difference by weighing the capsule before and after each actuation, and the fraction of delivered dose was calculated.18
Cytotoxicity evaluation by MTT assay
Cytotoxicity of selected formulations was determined by MTT assay on Calu-3 cells. Cells were grown in MEM medium supplemented with 10% heat-inactivated fetal calf serum, 1% L-glutamine, HEPES buffer, and 50 μg/mL gentamycin. All cells were maintained at 37°C in a humidified atmosphere (95% relative humidity) with 5% v/v CO2 (Humid CO2 incubator, SHEL LAB model 2,406; Sheldon Manufacturing Inc., Cornelius, OR, USA), and the test was performed as described elsewhere.19 SLS, REP powder, and blanks of the selected formulae were used as controls.
In vivo pharmacodynamic study
Animal handling and drug administration
For all animal studies, the experimental procedures conformed to the guidelines of the Ethical Committee of the Faculty of Pharmacy, Ain-Shams University on the use of animals. Rats were fed a normal diet and water ad libitum in a constant temperature environment of 25°C, and a period of 7 days was allowed for acclimatization of rats. Forty-two male Wistar albino rats weighing between 180 and 220 g were randomly divided into seven groups, each consisting of six rats. Induction of diabetes was performed in rats from groups 2–7.
Induction of diabetes using STZ
STZ, prepared in cold 0.01 M citrate buffer of pH 4.5, was administered intraperitoneally at a dose of 60 mg/kg.20 Blood samples were checked 72 hours post-administration using one touch glucometer (One Touch®, Select®; Life Scan Inc., Fremont, CA, USA). Rats with BG values >250 mg/dL were considered diabetic and were included in the experiment.21
Drug administration
REP was administered in a dose of 0.3 mg/kg according to the following scheme:10
- Group 1 (normal non-diabetic control) received IN normal saline. All subsequent groups consisted of diabetic rats.
- Group 2 (diabetic control group) received IN normal saline.
- Group 3 received a suspension of REP marketed tablet orally.
- Group 4–7 received formulae F2, F9, blank F2, and blank F9, respectively intranasally.
REP marketed tablet was first ground into a fine powder which was suspended in normal saline containing 0.2% w/v of carboxymethyl cellulose and was given by gavage. For nasal administration of saline, the conscious rats were held from the back in slanted position, and 30 μL of saline was administered in the nostrils using a micropipette (10–100 μL) attached with low-density polyethylene tube having 0.1 mm internal diameter. The single dose monopowder insufflator (MIAT S.p.A.) was used for dosing NCs in MP powders to groups 4–7. A short polyethylene tube was connected to the open end of the device using an adhesive tape. The powders were filled in No 3 capsules, and the tip of the prefilled insufflators was gently placed into the rat nostril. The pump was pressed allowing the powders to be aerosolized and delivered to the nasal cavity.
Blood sampling
Blood samples, obtained from the retro orbital sinuses of rats at zero time and at fixed time points (0.25, 0.5, 1, 2, 4, 6, 8, and 24 hours) were immediately placed on the glucostrips, and BG levels were determined using the glucometer.
Pharmacodynamic analysis
BG concentration of each rat, before treatment administration, was taken as the baseline level, and the antihyperglycemic activity of different treatments in terms of percentage change from baseline BG level and percentage reduction of BG level at different time points post-treatment were calculated and plotted versus time.
The following parameters were obtained: Tmin, time point of minimum glucose level (hours); and Cmin, minimum glucose level as percentage of baseline level. Both Tmin and Cmin were taken directly from the observed glucose level versus time profiles.
The area under the effect versus time curve (AUEC) values of different groups were calculated from the beginning (t0) to the end of the observation time for oral tablet (t8 h) and for nasal formulae (t24 h) from appropriate graphs using the linear trapezoidal method. The total decrease in BG level (TD%) was calculated using the following equation:22
| (2) |

where AUECc is AUEC after IN administration of normal saline to diabetic rats (control diabetic) and AUECs is AUEC of other formulations administered orally or intranasally.
Tolerability and toxicity study (histopathological study)
Nasal histopathological examinations were carried out using male Wistar albino rats weighing 180–220 g. The animals received once-daily nasal administration of plain or REP-loaded NCs in MPs for 7 days using the insufflator. For comparison, the control group received normal saline intranasally. Rats were then sacrificed, and their nasal mucosa from the bottom of the inferior meatus was dissected. The tissues were prepared, examined, and photographed using light microscope (Axiostar Plus, Zeiss) as previously described elsewhere.23
Statistical analysis
Data are expressed as mean of three or six determinations ± standard deviation or standard error. The complete setup of the 24 full factorial design statistical and factorial analysis were performed using Design-Expert® version 8.0.7.1 (Stat-Ease, Inc., Minneapolis, MN, USA). AUEC values were calculated using Graph Pad Prism software program (version 5.01; GraphPad Software Incorporated, La Jolla, CA, USA). Comparison of the mean values was performed using either Student’s t-test or ANOVA (analysis of variance) using GraphPad InStat software program. Statistical significance was set at P-value ≤0.05.
Results and discussion
In the present study, spray-dried REP-loaded NCs in MPs were prepared. A 24 full factorial experiment was designed to evaluate the effect of formulation variables on NC characteristics, and 16 formulae were prepared as shown in Table 1. NCs, prepared by the ionic gelation of CS with ALG, showing optimum size and EE% were mixed with LEU and then spray-dried.
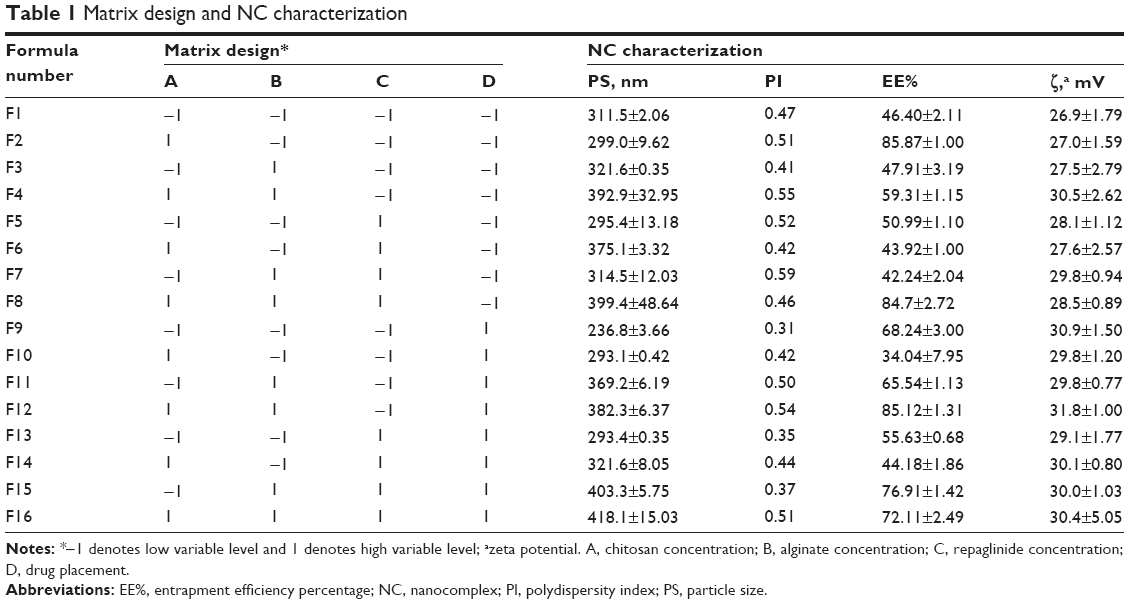 | Table 1 Matrix design and NC characterization |
NC characterization and data analysis
Table 1 shows that the EE% and PS varied greatly among the formulae, with values ranging from 34.04% to 85.87% and from 236 to 418 nm, respectively. The polydispersity index lay between 0.31 and 0.59. Positive zeta potential values ranging from +26.9 to +31.8 were recorded and attributed to CS surface free amino groups helping in mucosal adhesion and possible enhanced paracellular transport. The fitted model for the four dependent variables was the two-factor interaction (2FI) model (P<0.0001). Variable coefficients and significance are shown in Table 2. High model accuracy values (R2) of 0.8705 and 0.7936 were found with PS and EE%, respectively. A good agreement between experimental and predicted responses was observed, with estimated biases between 11.96% and 18.66% for PS and 4.86% and 13.09% for EE% (Tables S1 and S2). The obtained values were considered acceptable.13
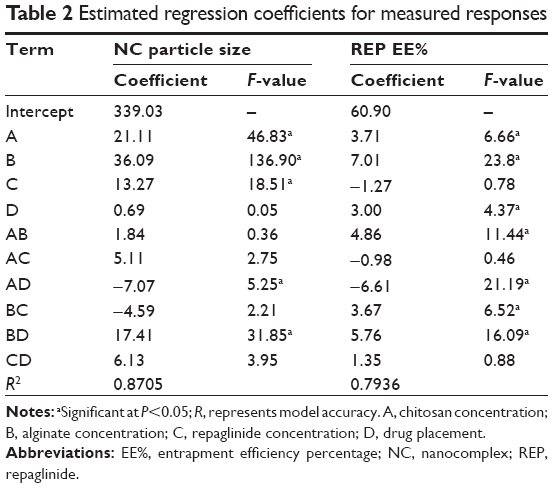 | Table 2 Estimated regression coefficients for measured responses |
Table 2 shows that increasing A and B had positive effects on both responses (P<0.05). REP-loaded NCs were formed from the electrostatic interaction between the two ionic polysaccharides: negative carboxylic groups of ALG and positive amine groups of CS.24 The increased viscosity imparted by increasing either of the polysaccharide’s concentration resulted in larger particles with a probability of a greater cross-linking density engulfing more drug.25 Shifting from anion to cation-loading did not have any significant effect on PS (P>0.05) but significantly enhanced EE% (P<0.05). Moreover, it influenced A and B effects, giving AD and BD significant interactions on both PS and EE% (P<0.05) as shown in Figures 1 and S2. The increase in PS caused by increasing ALG concentration was significantly higher in cation-loading than in anion-loading; the opposite was seen with increasing CS concentration. Moreover, the enhanced anion-loaded REP incorporation inside the NC matrices could probably be due to increasing CS concentration and viscosity. In case of cation-loading, the increase in CS solution viscosity might have hindered REP encapsulation, contributing to decreased REP entrapment. The latter case was more pronounced in the less compact complex formed at low ALG level as previously reported in the literature.26 Relating these findings with those obtained with PS, it could be concluded that the effects of BD and AD interactions on PS might also be due to increased and decreased REP incorporation, respectively.
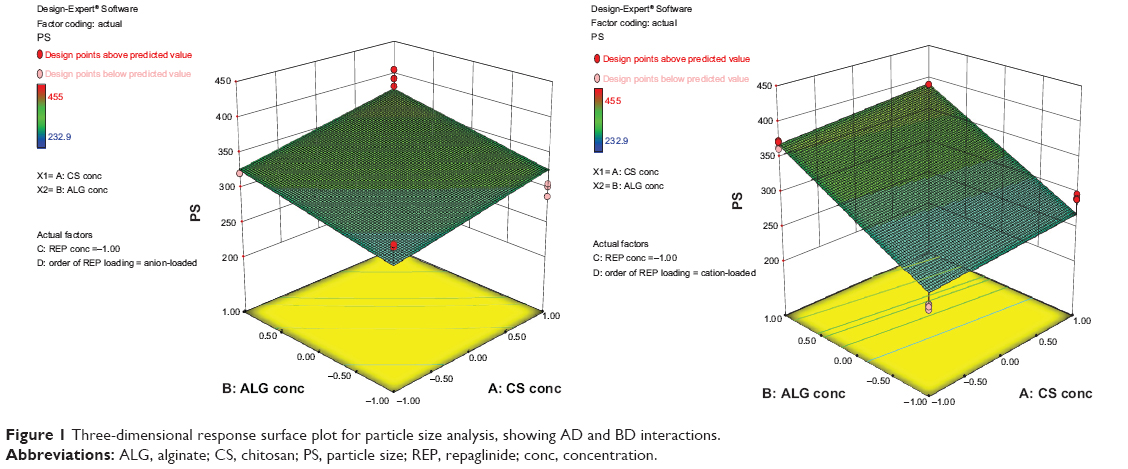 | Figure 1 Three-dimensional response surface plot for particle size analysis, showing AD and BD interactions. |
Finally, the drug concentration (C) positively affected the PS (P<0.05). Due to the amphoteric nature of REP, it acquired either a negative or positive charge in ALG and CS solutions. It can therefore either interfere with the polysaccharides complexation or become entrapped in the NCs, resulting in larger particles.27 Its non-significant effect on the EE% precludes the latter alternative. However, it had a synergistic effect with factor B (ALG concentration), resulting in enhanced EE% at high level of both factors (BC interaction).
From the previous results, F2 and F9, prepared by anion- and cation-loading respectively, were selected for further investigations as they had small PS (in the range of 200–300 nm) to allow mucosal uptake with relatively high EE% (85.87% and 68.24%, respectively).
DSC and FT-IR
As shown in Figure S3, DSC thermogram of REP:CS:ALG physical mixture was a simple superposition of peaks of the individual components. The determined peaks for the individual components in the mixture were in accordance with those reported in the literature.28–30 REP’s typical melting point was absent in all NC thermograms (Figure S3, traces E and F), irrespective of the type of loading, indicating that the drug was present as molecular dispersion in the polymer matrix. Similarly, the FT-IR spectrum of CS:ALG:REP physical mixture (Figure S4) corresponded to the superposition of the IR spectra of the individual components found to be in accordance with those previously reported in literature, indicating the absence of interactions between the formulation components.29,31,32
In the spectrum of blank CS/ALG NCs (Figure S4, trace C), ALG peaks were slightly shifted to lower frequencies (from 1,616.8 to 1,606.7 cm−1 and from 1,420.0 to 1,412.8 cm−1) after complexation with CS. CS amide peaks were also converted into a singlet band at 1,606 cm−1, while the hydroxyl group peak, with the broad absorbance at 3,366.3 cm−1, remained almost at the same position in the formed NCs. Traces F and G of Figure S4 show that the characteristic N-H stretching vibration peak of REP 3,307.5 cm−1 disappeared together with many other drug characteristic peaks in REP-loaded CS/ALG NCs, indicating the presence of a strong interaction between REP and NC matrix. Moreover, a shift to a higher wave number (+13 cm−1) was observed for the CS and ALG hydroxyl group (OH) peaks in anion loaded REP NCs (F2). In contrast, NCs containing a low level of cation-loaded REP (F9) showed a higher OH shift, amounting to (+48 cm−1). A stronger drug–NC interaction could be assumed in cation-loading than in anion-loading, justifying the higher EE% seen in the latter case. The cross-linked matrix will have different degrees of interaction resulting from intermolecular hydrogen and ionic bonding between REP and CS and leading to networks with dissimilar properties participating in different drug EE% values and eventually release profiles.
Spray-dried NCs in MPs characterization
The powders obtained after spray drying with LEU (formulae F2 and F9) had high yields (~93%) low moisture content (not more than 3%) and good powder flow with a respective angle of repose of 38.28° and 39.63°, confirming LEU positive effect.33,34 Although both powders had respective narrow span values 1.91 and 1.7, F2 showed significantly larger size than F9: volume mean diameter of 2.8 and 1.26 μm, respectively (P<0.05), suggesting suitability for nasal delivery.35 REP was highly incorporated in the SDP, with respective incorporation efficiencies of 93.19% and 94.36%. Sustained REP release after 6 hours, amounting of 61.47% and 68.62%, respectively, from F2 and F9, was found with non-significant difference between them (P>0.05) (see profiles in Figure 2). A Higuchi model was found to describe REP-release kinetics, exhibiting n values of 0.495 (Fickian) and 0.879 (non-Fickian) for F2 and F9, respectively.
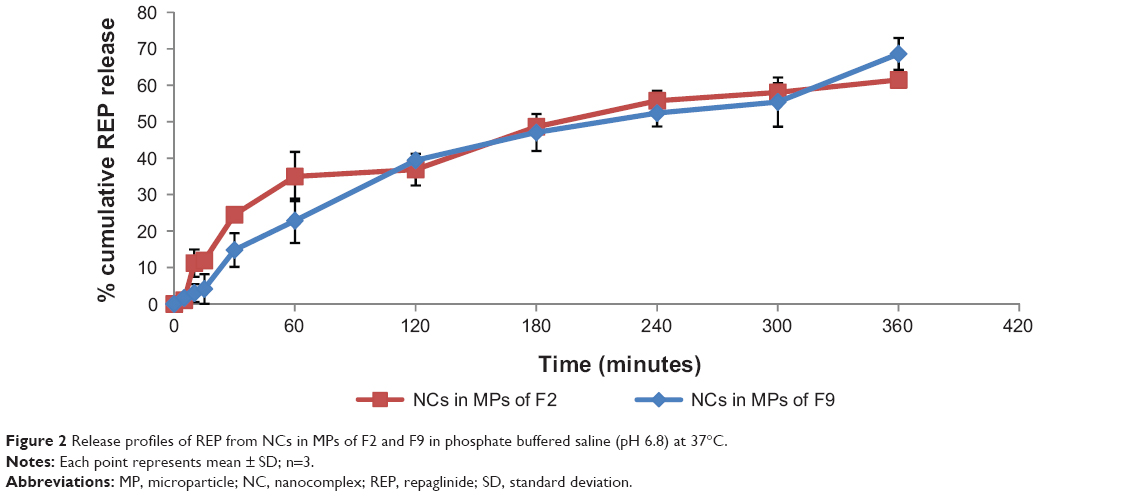 | Figure 2 Release profiles of REP from NCs in MPs of F2 and F9 in phosphate buffered saline (pH 6.8) at 37°C. |
Morphological examination
Representative SEM image of F2 (Figure 3A) shows agglomerated MPs, each measuring on average less than 5 μm. Although, they appeared as clusters, they were not fused or entangled, as confirmed by the PS analysis. The presence of LEU prevented fusion and sintering between adjacent MPs.36 It is to be noted that the freshly prepared NCs of F2 show solid spherical particles, as revealed from TEM (Figure S5). These NCs appeared aggregated in AFM (Figure 4A) due to CS nature.37 Figures 3B and S6 show time sequential TEM imaging of the recovered NCs, revealing discrete non-disintegrated NCs. This observation is also demonstrated by AFM (Figure 4B), and represents an added benefit for LEU. However, in contrast to F2, after 4 hours in PBS, F9 particles became irregular and lost their spherical shape (Figure S6). The dense network seen in F2 resulting from its higher CS content could justify the Fickian release mechanism. However, the relaxed matrix and the low CS concentration of F9 explained its non-Fickian release mechanism.
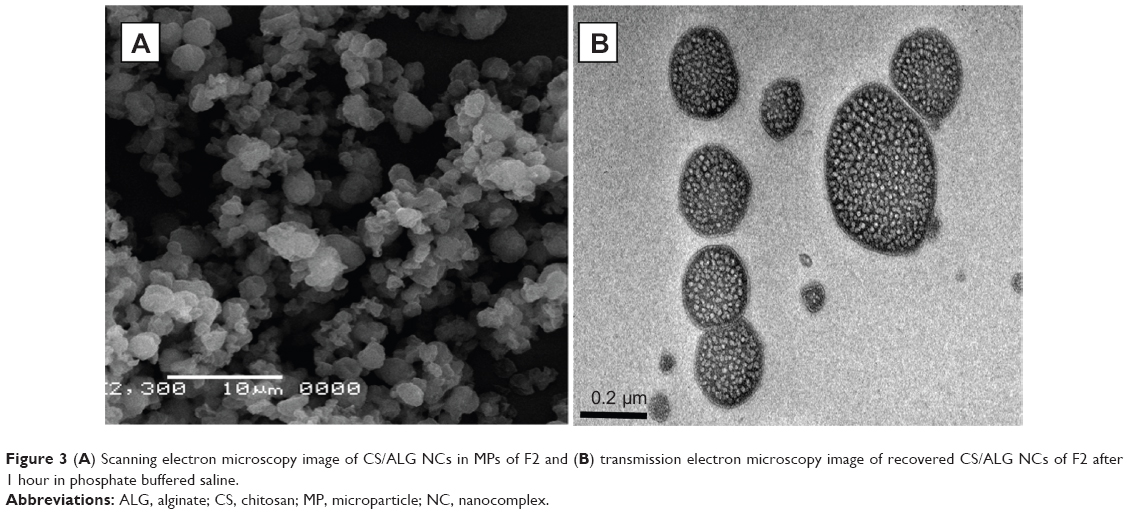 | Figure 3 (A) Scanning electron microscopy image of CS/ALG NCs in MPs of F2 and (B) transmission electron microscopy image of recovered CS/ALG NCs of F2 after 1 hour in phosphate buffered saline. |
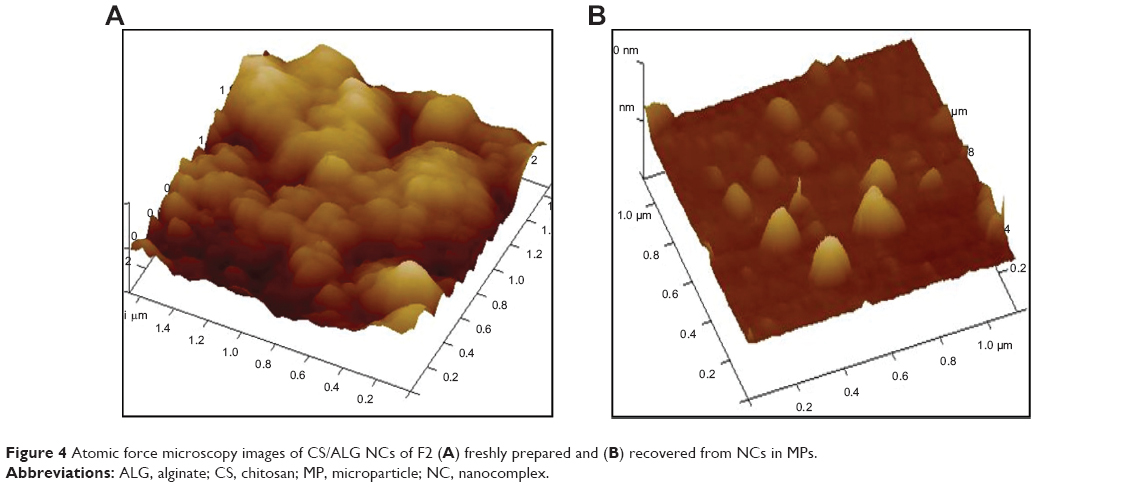 | Figure 4 Atomic force microscopy images of CS/ALG NCs of F2 (A) freshly prepared and (B) recovered from NCs in MPs. |
Suitability for nasal delivery
Ex vivo mucoadhesive strength determination
The peak detachment force of F2 was found to be significantly higher than that of F9 (P<0.05) (Figure S7), probably due to its higher CS content. In spite of the lower detachment force of REP-loaded NCs in MPs compared with the blank ones, a literature review revealed that the obtained values were comparable to those obtained in previous studies confirming the mucoadhesive properties of the prepared MPs.17,38
Insufflator dose reproducibility
The relationship between the loaded dose and the fraction of emitted dose expressed as a percentage was examined in capsules containing increasing amounts of SDP (5 and 10 mg). It was found that more than 98% of the dose was delivered from the device, with no significant difference (P>0.05) in percentage of dose delivered after three puffs for 5 and 10 mg loadings (data not shown).
Cytotoxicity evaluation by MTT assay
As shown in Figure 5, MTT assay performed on Calu 3 cells reveals that cell viabilities obtained with REP and the selected formulae at all tested concentrations were significantly higher than those obtained with the positive control (SLS) (P<0.05). REP was found to be safe up to a concentration of 500 μg/mL, while F2 and F9 were safe up to a concentration of 250 μg/mL, as confirmed by the high cell viabilities ranging from 90.32%–100%. It was only at a particle concentration of 2,000 μg/mL that the cytotoxicity of F2 was significantly higher than both F9 and REP (P<0.05), probably due to its higher CS content. Similar to previous works, blank formulae showed higher toxicity values than their drug-loaded counterparts.39
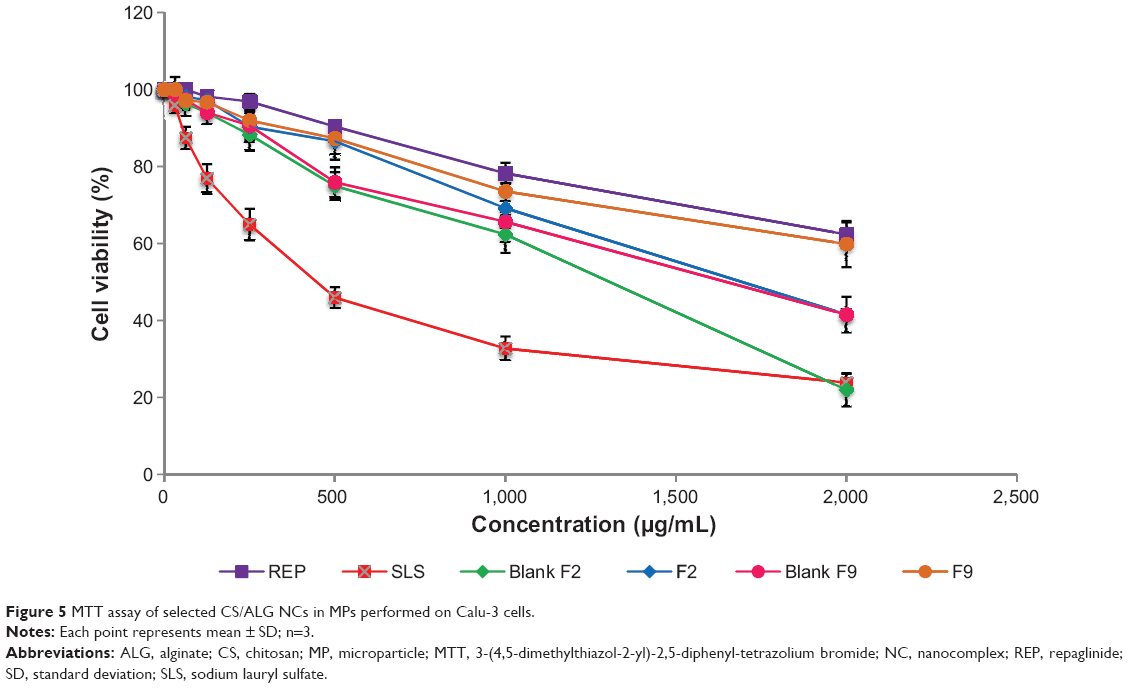 | Figure 5 MTT assay of selected CS/ALG NCs in MPs performed on Calu-3 cells. |
In vivo pharmacodynamic study
BG levels expressed as percentage from basal levels and the percentage reduction of BG after administration of different treatments versus time curves are presented in Figures S8 and 6, respectively. A 25% reduction of the BG level was considered a significant anti-hyperglycemic effect, as previously reported.40 Group 1 rats showed normal BG levels throughout the study, indicating that the animals were not stressed by the administration and blood-sampling procedures. On the other hand, extended high BG levels followed IN administration of normal saline (group 2) and blank dry powders (groups 6 and 7). It is worthy to note that BG levels did not increase after administration of the blank MPs. Thus, the non-diabetogenic nature of the selected carbohydrate polymers was evidenced, confirming their suitability as REP carriers. Following administration of REP marketed tablet, BG level gradually declined, showing a significant reduction at 2 hours, reaching maximum reduction at 4 hours, and remaining constant until 6 hours post-administration. Decrease below the significance level (<25% reduction) was seen 8 hours post-drug administration. The calculated AUEC0–8 was found to be 24,574 mg·h/dL, and the achieved total reduction of BG (TD%) was 47.56% within 8 hours. On the contrary, IN administration of F2 and F9 dry powders resulted in clear long-lasting significant BG level reduction of 47.33% and 38.00% 24 hours post-treatment administration. F9 showed a faster onset of lowering BG (0.5 hours) compared with F2 (2 hours), probably due to its higher content of drug non-entrapped in the NCs and left to provide the immediate anti-hyperglycemic effect. After 2 hours, F9 effect reached a plateau, and then the decrease in BG level rose to reach its maximum reduction value of 65% (Cmin =35%) at 6 hours. This sudden change can be explained by the loose distorted nature of the matrix seen during NCs recovery. On the other hand, a more prolonged duration of BG level reduction was seen with non-distorted F2. Besides, higher drug EE% in the NCs may have participated to the slower release. The study showed also that both drug nasal powders had slower absorption rate with Tmin of 6 hours, compared with 4 hours only for the marketed tablet. In addition, non-significantly different AUEC and TD% calculated over 24 hours were noticed for F2 and F9, with respective values of 68,767.67 and 70,012.67 for AUEC and 46.08% and 47.34% for TD% (P<0.05).
 | Figure 6 Percentage reduction in blood glucose levels after administration of oral/nasal REP formulae in rats. |
The observed sustained physiologic response to the dry powders could be explained in terms of several mechanisms. Firstly, the amount of free unassociated REP was responsible for the immediate hypoglycemic effect. Secondly, the mucoadhesive nature of the powders increased the nasal retention avoiding oral absorption and first-pass effect which follow oral administration.10 Moreover, due to the ability of CS amino group to transiently open the tight junctions, it was possible for the accumulated small NCs to pass to the systemic circulation, enhancing the drug bioavailability, reflected as a decrease in BG level. Thirdly, the possibility of the intracellular delivery of the associated REP from the recovered NCs in the nasal epithelial cells could be responsible for the sustainment of the hypoglycemic effect, to more than 24 hours. Previous literature confirmed the presence of similar CS NCs inside the nasal epithelium following their IN administration to conscious rats.41 Thus, we could expect that one-third of the oral REP dose was only required to provide equivalent hypoglycemic efficacy of the nasally administered dry powders. However, further investigations are needed to illustrate the role of the nanosized complexes in mediating the biological effect and their interaction with the nasal epithelium.
Tolerability and toxicity studies (histopathological studies)
The photomicrographs (Figures 7 and S9) showed normal histological structure of the nasal mucosa and underlying cartilage. None of the severe signs, such as appearance of necrosis, sloughing of epithelial cells, or hemorrhage were detected in any of the nasal mucosa of rats receiving either normal saline or selected blank and REP-loaded formulae. Intranasal REP-loaded NCs in MP dry powders were safe and well tolerated on the nasal mucosa.
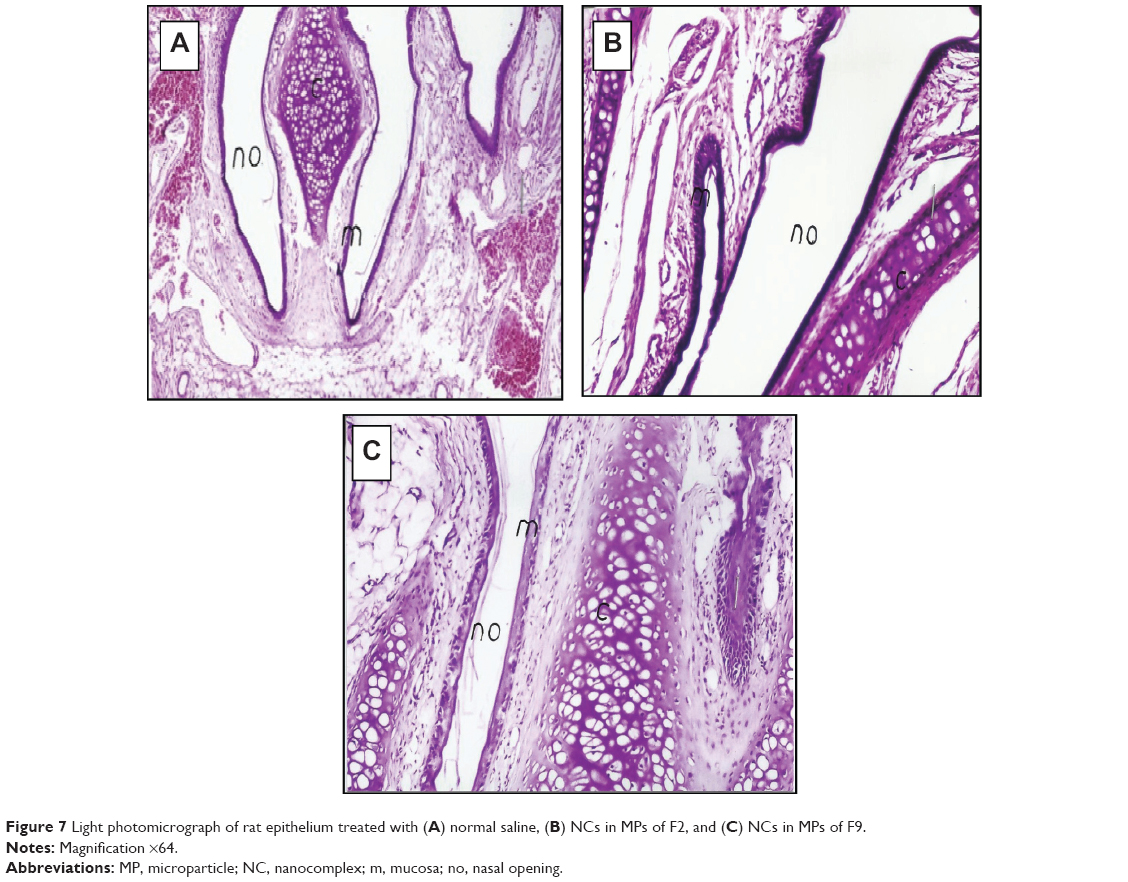 | Figure 7 Light photomicrograph of rat epithelium treated with (A) normal saline, (B) NCs in MPs of F2, and (C) NCs in MPs of F9. |
Conclusion
Dry powder MPs containing selected REP-loaded NCs were successfully prepared and optimized in terms of NC size and EE% using experimental design. Due to its amphoteric character, the drug ionization in the different pH values strongly affected its EE% and NC size. The density of the polymeric matrix and the nature of bonds affecting drug behavior in different systems were scrutinized by DSC, FT-IR, and sequential TEM for recovered particles. In vitro and in vivo experiments assessed safety and tolerability of the chosen formulae. Finally, a proven BG lowering effect in rats suggests the potential usefulness of REP IN powders as a controlled delivery system for the management of diabetes, superseding the conventionally used oral tablets. Such potential results encourage planning for future works to give evidence of the suspected mucosal particles uptake.
Acknowledgment
The authors regret to advise of the passing of Prof Abdel Hameed El-Shamy, one of the great scientists in the pharmaceutical field, prior to publication.
Disclosure
The authors report no conflicts of interest in this work.
References
Agnihotri SA, Mallikarjuna NN, Aminabhavi TM. Recent advances on chitosan-based micro- and nanoparticles in drug delivery. J Control Release. 2004;100:5–28. | ||
Takashima Y, Saito R, Nakajima A, et al. Spray-drying preparation of microparticles containing cationic PLGA nanospheres as gene carriers for avoiding aggregation of nanospheres. Int J Pharm. 2007;343(1): 262–269. | ||
Trapani A, Sitterberg J, Bakowsky U, Kissel T. The potential of glycol chitosan nanoparticles as carrier for low water soluble drugs. Int J Pharm. 2009;375(1–2):97–106. | ||
Dyer AM, Hinchcliffe M, Watts P, et al. Nasal delivery of insulin using novel chitosan based formulations: a comparative study in two animal models between simple chitosan formulations and chitosan nanoparticles. Pharm Res. 2002;19(7):998–1008. | ||
Panariti A, Miserocchi G, Rivolta I. The effect of nanoparticle uptake on cellular behavior: disrupting or enabling functions? Nanotechnol Sci Appl. 2012;5:87–100. | ||
Gubbala SK. Polyelectrolyte complex: a pharmaceutical review. Int J Pharm Biol Sci. 2012;2(3):399–407. | ||
Lund SS, Tarnow L, Stehouwer CD, et al. Targeting hyperglycaemia with either metformin or repaglinide in non-obese patients with type 2 diabetes: results from a randomized crossover trial. Diabetes Obes Metab. 2007;9(3):394–407. | ||
Makino C, Sakai H, Yabuki A. Nateglinide controlled release tablet containing compressionable enteric coated granules. Chem Pharm Bull. 2010;58(9):1136–1141. | ||
Mandić Z, Gabelica V. Ionization, lipophilicity and solubility properties of repaglinide. J Pharm Biomed Anal. 2006;41(3):866–871. | ||
Jain S, Saraf S. Repaglinide-loaded long-circulating biodegradable nanoparticles: rational approach for the management of type 2 diabetes mellitus. J Diabetes. 2009;1(1):29–35. | ||
Elmowafy E, Osman R, El-Shamy A, Awad GA. Nasal polysaccharides-glucose regulator microparticles: optimization, tolerability and antidiabetic activity in rats. Carbohyd Polym. 2014;108:257–265. | ||
Kshirsagar SJ, Patel SJ, Madgulkar AR, Bhalekar MR. Formulation and in-vitro evaluation of repaglinide microspheres prepared by spray drying technique. Lat Am J Pharm. 2011;30(4):799–803. | ||
Palazzo F, Giovagnoli S, Schoubben A, Blasi P, Rossi C, Ricci M. Development of a spray-drying method for the formulation of respirable microparticles containing ofloxacin–palladium complex. Int J Pharm. 2013;440(2):273–282. | ||
Gavini E, Hegge AB, Rassu G, et al. Nasal administration of carbamazepine using chitosan microspheres: in vitro/in vivo studies. Int J Pharm. 2006;307(1):9–15. | ||
Siepmann J, Peppas NA. Modeling of drug release from delivery systems based on hydroxypropyl methylcellulose (HPMC). Adv Drug Del Rev. 2001;48(2–3):139–157. | ||
Soliman M, Nasanit R, Abulateefeh SR, et al. Multicomponent synthetic polymers with viral-mimetic chemistry for nucleic acid delivery. Mol Pharm. 2012;9(1):1–13. | ||
Sensoy D, Cevher E, Sarici A, Yilmaz M, Ozdamar A, Bergisadi N. Bioadhesive sulfacetamide sodium microspheres: evaluation of their effectiveness in the treatment of bacterial keratitis caused by Staphylococcus aureus and Pseudomonas aeruginosa in a rabbit model. Eur J Pharm Biopharm. 2009;72(3):487–495. | ||
Patil SB, Sawant KK. Chitosan microspheres as a delivery system for nasal insufflations. Colloids Surf B Biointerfaces. 2011;84(2): 384–389. | ||
Nasr M, Awad GA, Mansour S, Taha I, Alshamy A, Mortada ND. Different modalities of NaCl osmogen in biodegradable microspheres for bone deposition of risedronate sodium by alveolar targeting. Eur J Pharm Biopharm. 2011;79(3):601–611. | ||
Abu Abeeleh M, Ismail ZB, Alzaben KR, et al. Induction of diabetes mellitus in rats using intraperitoneal streptozotocin: a comparison between 2 strains of rats. Eur J Sci Res. 2009;32(3):398–402. | ||
Pachisia N, Agrawal SS. Formulation, development and evaluation of transdermal drug delivery system of glimepiride. Int J Pharm Pharm Sci Res. 2012;2(1):1–8. | ||
Rathnam G, Balasubramani P, Saravanakumar A. Nasal drug delivery of antidiabetic drug repaglinide using degradable starch microspheres. Int J Pharm Sci Res. 2011;2(4):940–947. | ||
Bshara H, Osman R, Mansour S, El-Shamy A-H. Chitosan and cyclodextrin in intranasal microemulsion for improved brain buspirone hydrochloride pharmacokinetics in rats. Carbohyd Polym. 2014;99: 297–305. | ||
Ribeiro AJ, Silva C, Ferreira D, Veiga F. Chitosan reinforced alginate microspheres obtained through the emulsification/internal gelation technique. Eur J Pharm Sci. 2005;25(1):31–40. | ||
Xing J, Deng L, Dong A. Chitosan/alginate nanoparticles stabilized by poloxamer for the controlled release of 5-fluorouracil. J App Polym Sci. 2010;117(4):2354–2359. | ||
Papadimitriou S, Bikiaris D, Avgoustakis K, Karavas E, Georgarakis M. Chitosan nanoparticles loaded with dorzolamide and pramipexole. Carbohyd Polym. 2008;73(1):44–54. | ||
Mahmoud AA, El-Feky GS, Kamel R, Awad GE. 2011. Chitosan/sulfobutylether-β-cyclodextrin nanoparticles as a potential approach for ocular drug delivery. Int J Pharm. 2011;413(1–2):229–236. | ||
Aramă C, Nicolescu C, Nedelcu A, Monciu C-M. Synthesis and characterization of the inclusion complex between repaglinide and sulfobutylether-β-cyclodextrin (Captisol®). J Incl Phenom Macrocycl Chem. 2011;70:421–428. | ||
Ventura CA, Tommasini S, Crupi E, et al. Chitosan microspheres for intrapulmonary administration of moxifloxacin: interaction with biomembrane models and in vitro permeation studies. Eur J Pharm Biopharm. 2008;68(2):235–244. | ||
Shabbeer S, Shaheeda, Ramanamurthy KV. Formulation and evaluation of chitosan sodium alginate microcapsules of 5-fluorouracil for colorectal cancer. Int J Res Pharm Chem. 2012;2(1):7–19. | ||
Sarmento B, Ferreira D, Veiga F, Ribeiro A. Characterization of insulinloaded alginate nanoparticles produced by ionotropic pre-gelation through DSC and FTIR studies. Carbohyd Polym. 2006;66(1):1–7. | ||
Li P, Dai YN, Zhang JP, Wang AQ, Wei Q. Chitosan-Alginate nanoparticles as a novel drug delivery system for nifedipine. Int J Biomed Sci. 2008;4(3):221–228. | ||
Seville PC, Learoyd TP, Li HY, Williamson IJ, Birchall JC. Amino acid-modified spray-dried powders with enhanced aerosolisation properties for pulmonary drug delivery. Powder Technol. 2007;178(1):40–50. | ||
Kundawala AJ, Patel VA, Patel HV, Choudhary D. Influence of formulation components on aerosolization properties of isoniazid loaded chitosan microspheres. Int J Pharm Sci Drug Res. 2011;3(4):297–302. | ||
Chen KH, Di Sabatino M, Albertini B, Passerini N, Kett VL. The effect of polymer coatings on physicochemical properties of spray-dried liposomes for nasal delivery of BSA. Eur J Pharm Sci. 2013; 50(3–4):312–322. | ||
El-Gendy N, Gorman EM, Munson EJ, Berkland C. Budesonide nanoparticle agglomerates as dry powder aerosols with rapid dissolution. J Pharm Sci. 2009;98(8):2731–2746. | ||
Duhem N, Rolland J, Riva R, et al. Tocol modified glycol chitosan for the oral delivery of poorly soluble drugs. Int J Pharm. 2012;423(2):452–460. | ||
Wong CF, Yuen KH, Peh KK. An in-vitro method for buccal adhesion studies: importance of instrument variables. Int J Pharm. 1999; 180(1):47–57. | ||
Osman R, Kana PL, Awad G, Mortada N, EL-Shamy AE, Alpar O. Spray dried inhalable ciprofloxacin powder with improved aerosolisation and antimicrobial activity. Int J Pharm. 2013;449(1–2):44–58. | ||
Yadav VK, Kumar B, Prajapati SK. Shafaat K. Design and evaluation of mucoadhesive microspheres of repaglinide for oral controlled release. Int J Drug Deliv. 2011;3:357–370. | ||
Teijeiro-Osorio D, Remunan-Lopez C, Alonso MJ. New generation of hybrid poly/oligosaccharide nanoparticles as carriers for the nasal delivery of macromolecules. Biomacromolecules. 2009;10(2):243–249. |
Supplementary materials
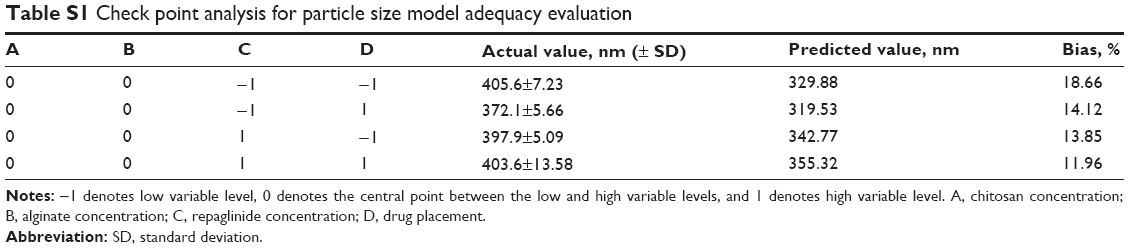 | Table S1 Check point analysis for particle size model adequacy evaluation |
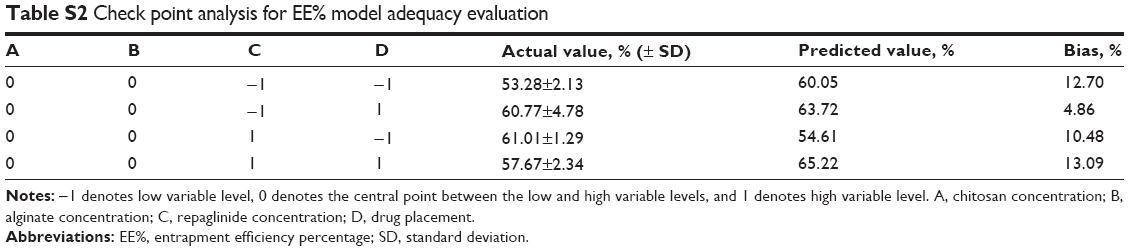 | Table S2 Check point analysis for EE% model adequacy evaluation |
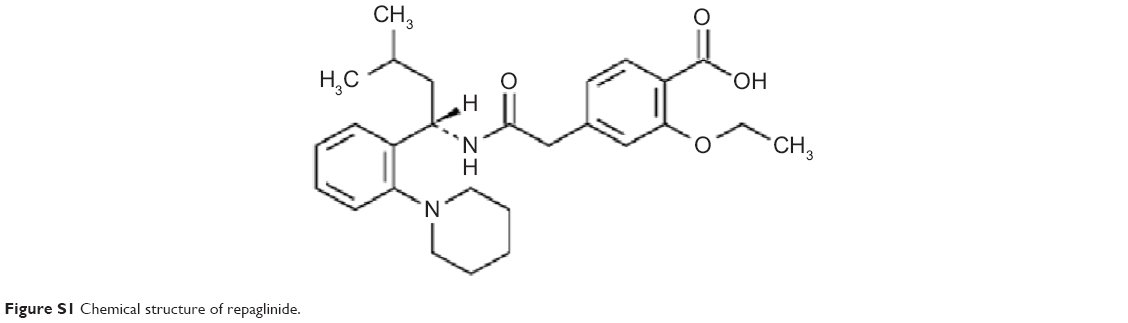 | Figure S1 Chemical structure of repaglinide. |
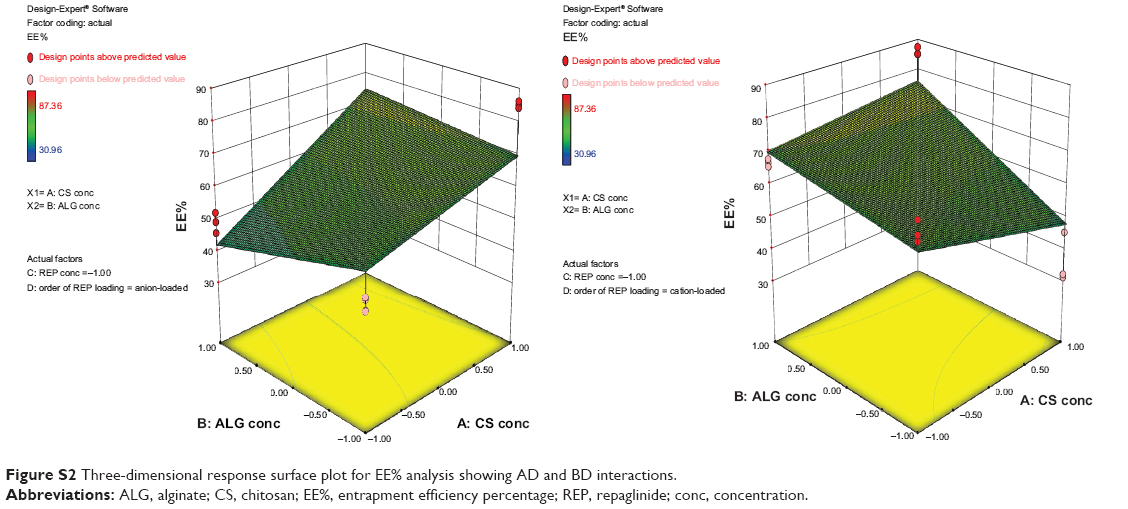 | Figure S2 Three-dimensional response surface plot for EE% analysis showing AD and BD interactions. |
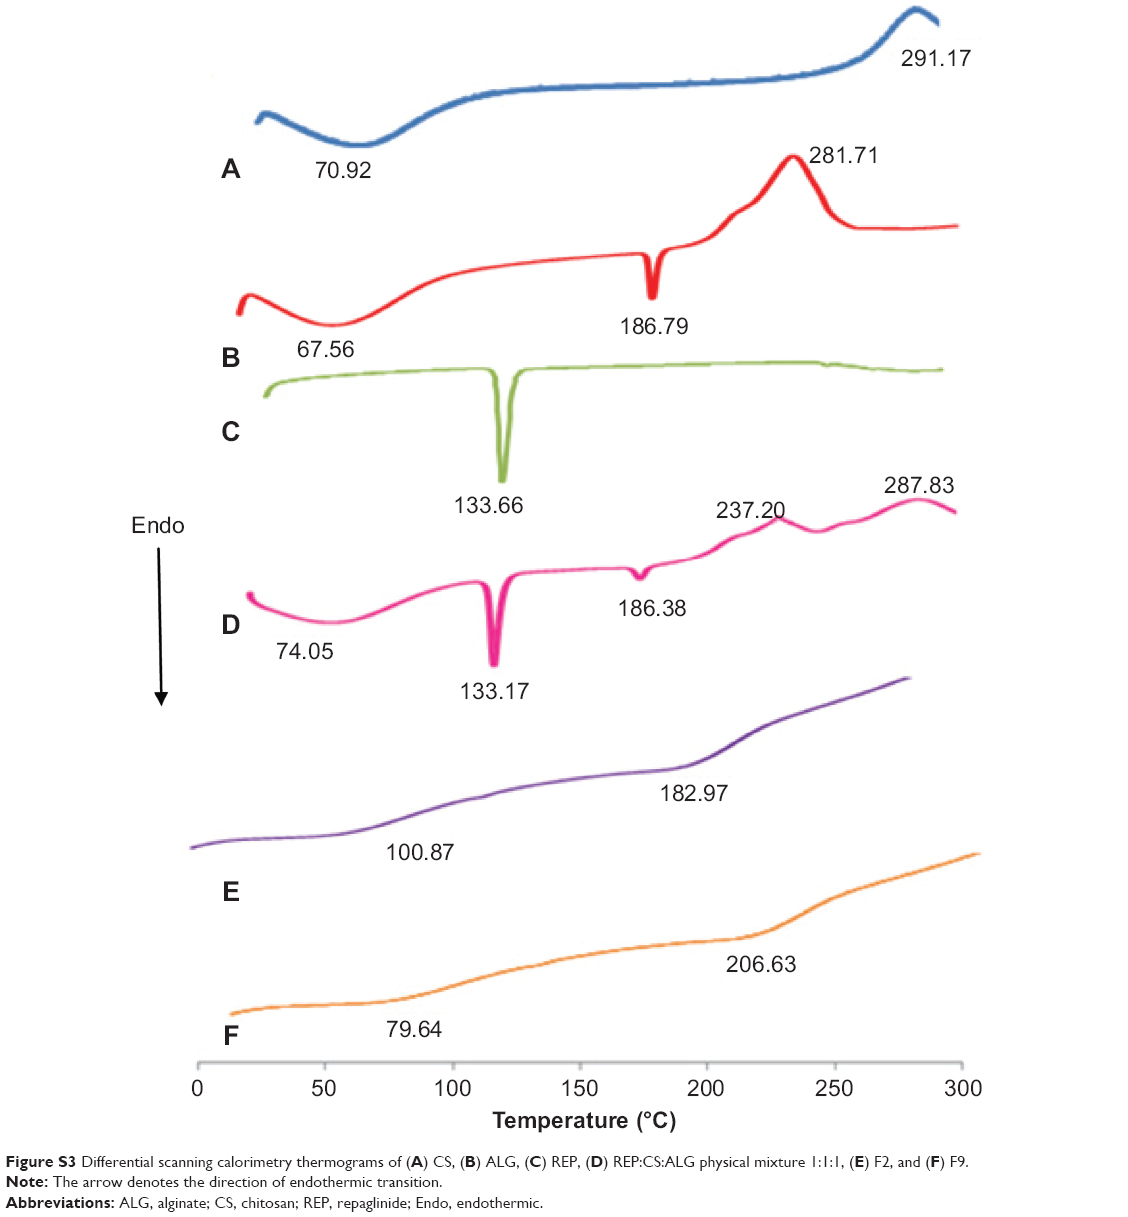 | Figure S3 Differential scanning calorimetry thermograms of (A) CS, (B) ALG, (C) REP, (D) REP:CS:ALG physical mixture 1:1:1, (E) F2, and (F) F9. |
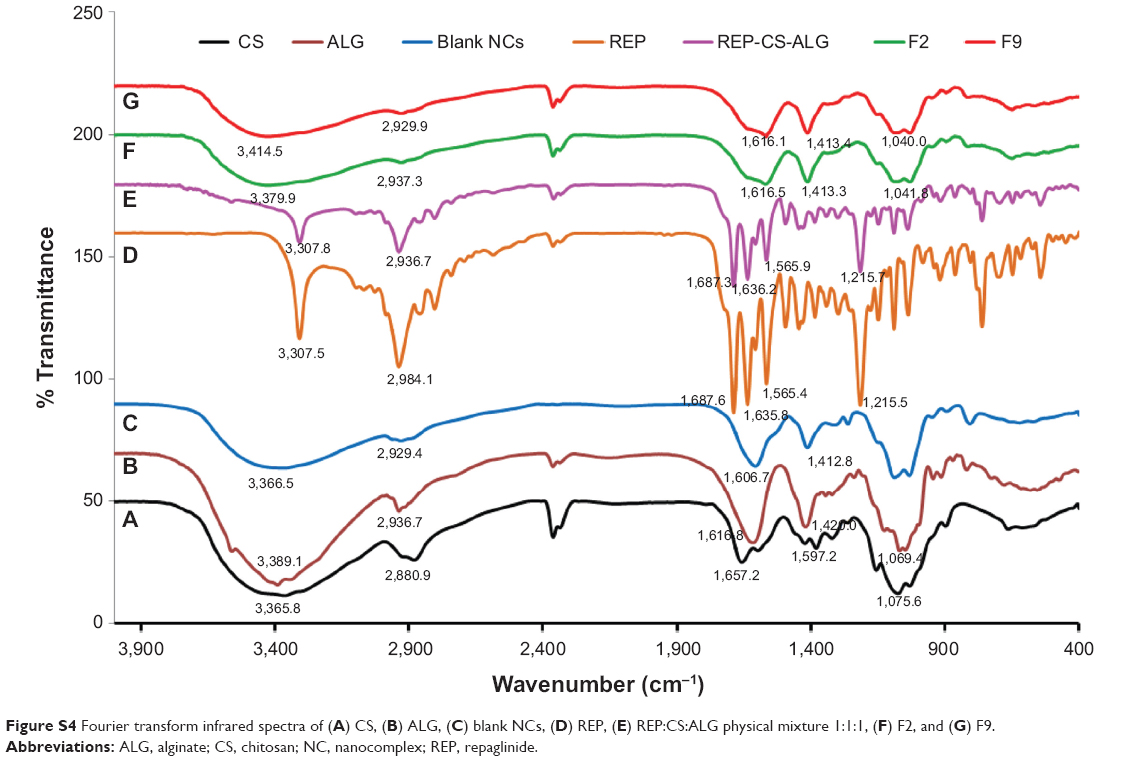 | Figure S4 Fourier transform infrared spectra of (A) CS, (B) ALG, (C) blank NCs, (D) REP, (E) REP:CS:ALG physical mixture 1:1:1, (F) F2, and (G) F9. |
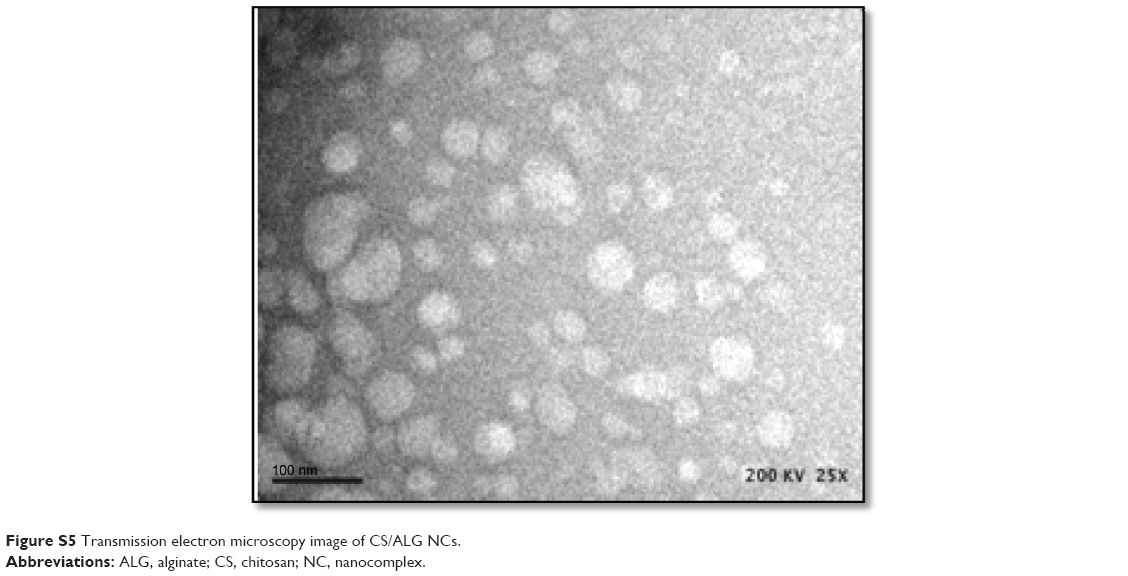 | Figure S5 Transmission electron microscopy image of CS/ALG NCs. |
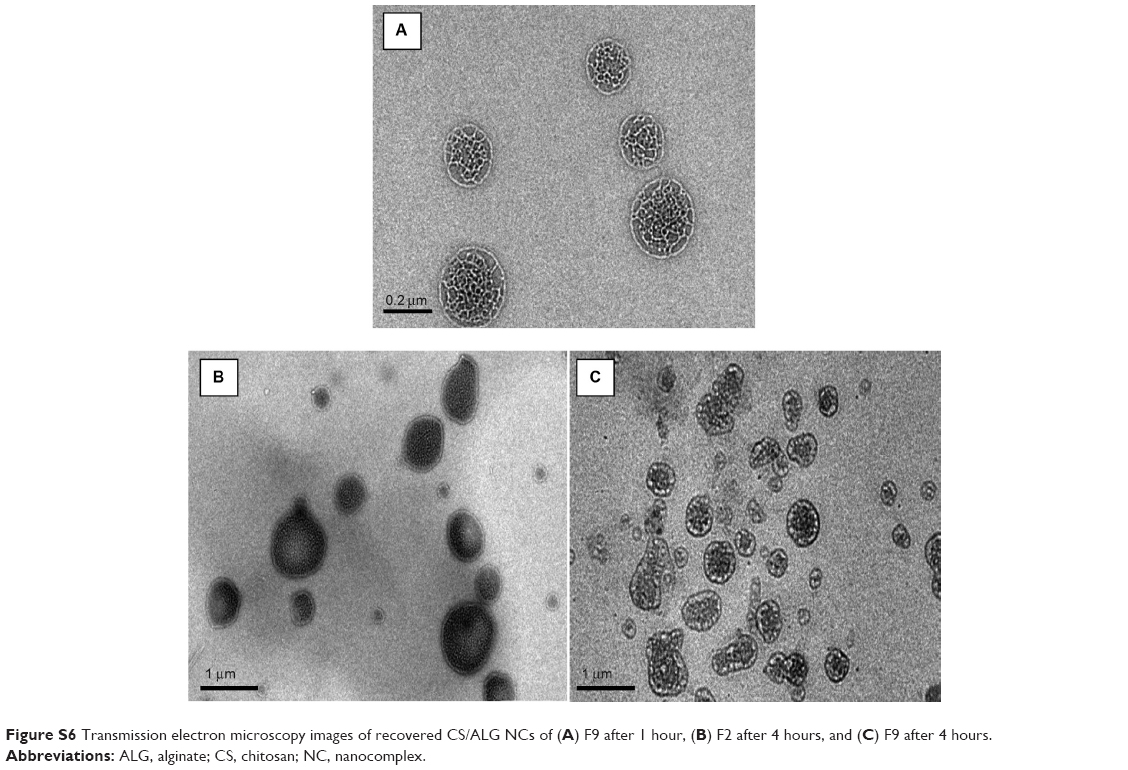 | Figure S6 Transmission electron microscopy images of recovered CS/ALG NCs of (A) F9 after 1 hour, (B) F2 after 4 hours, and (C) F9 after 4 hours. |
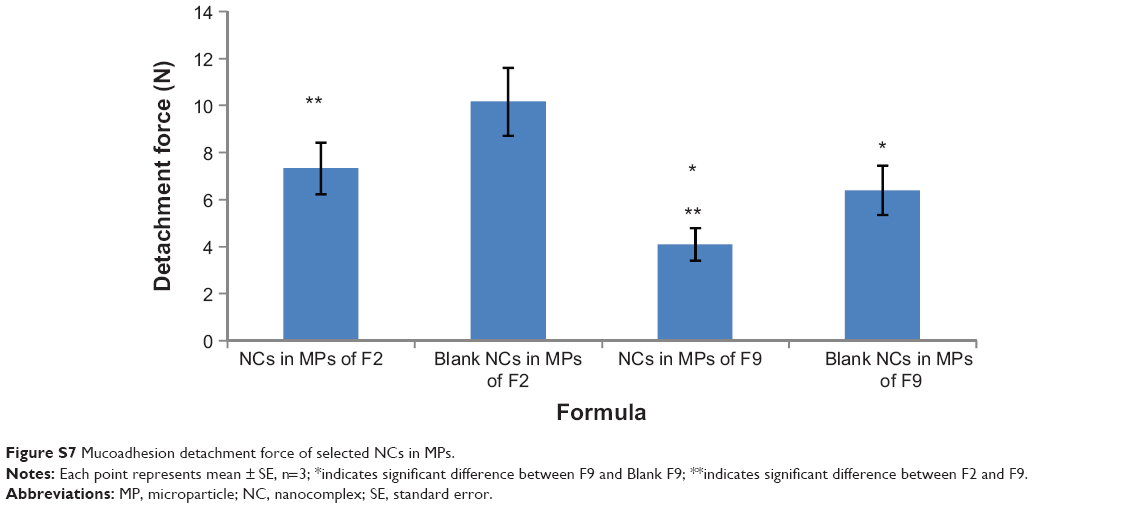 | Figure S7 Mucoadhesion detachment force of selected NCs in MPs. |
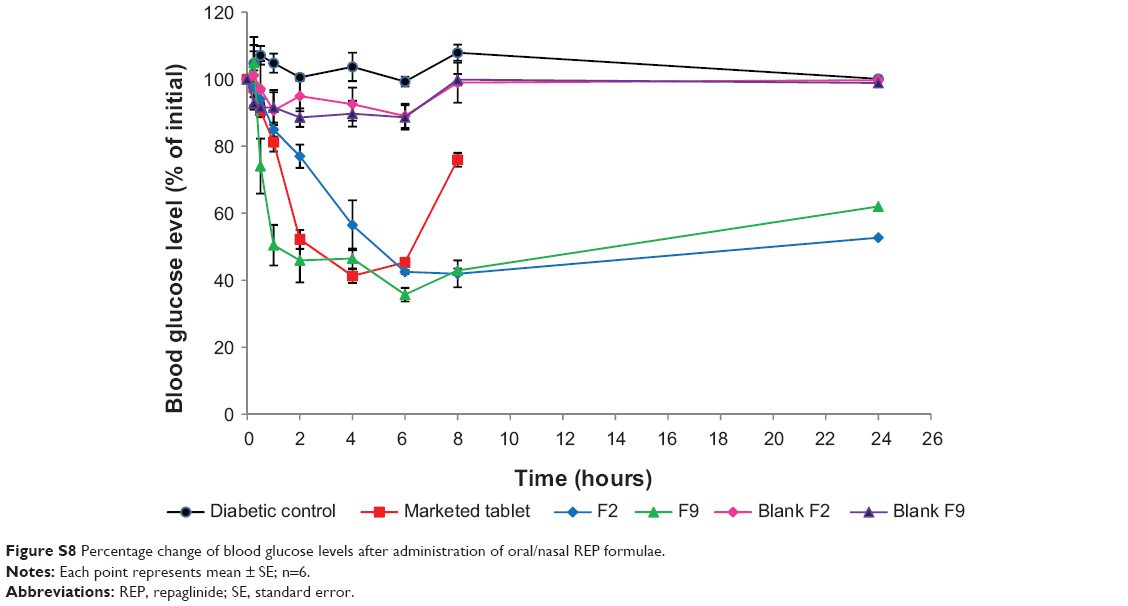 | Figure S8 Percentage change of blood glucose levels after administration of oral/nasal REP formulae. |
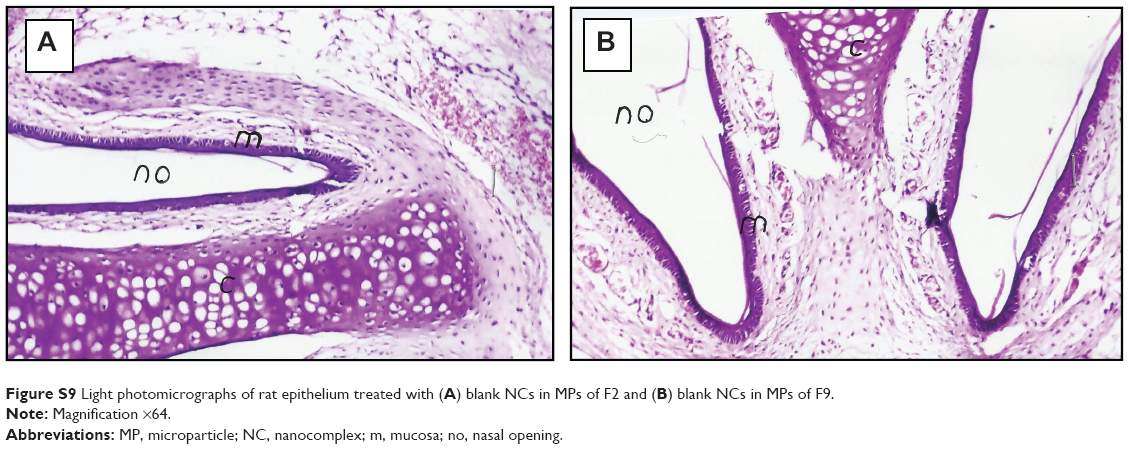 | Figure S9 Light photomicrographs of rat epithelium treated with (A) blank NCs in MPs of F2 and (B) blank NCs in MPs of F9. |
 © 2014 The Author(s). This work is published and licensed by Dove Medical Press Limited. The full terms of this license are available at https://www.dovepress.com/terms.php and incorporate the Creative Commons Attribution - Non Commercial (unported, v3.0) License.
By accessing the work you hereby accept the Terms. Non-commercial uses of the work are permitted without any further permission from Dove Medical Press Limited, provided the work is properly attributed. For permission for commercial use of this work, please see paragraphs 4.2 and 5 of our Terms.
© 2014 The Author(s). This work is published and licensed by Dove Medical Press Limited. The full terms of this license are available at https://www.dovepress.com/terms.php and incorporate the Creative Commons Attribution - Non Commercial (unported, v3.0) License.
By accessing the work you hereby accept the Terms. Non-commercial uses of the work are permitted without any further permission from Dove Medical Press Limited, provided the work is properly attributed. For permission for commercial use of this work, please see paragraphs 4.2 and 5 of our Terms.