")
Back to Journals » International Journal of Nanomedicine » Volume 14
Nano-scaled MTCA-KKV: for targeting thrombus, releasing pharmacophores, inhibiting thrombosis and dissolving blood clots in vivo
Authors Zhao S, Li Z, Huang F, Wu J , Gui L, Zhang X, Wang Y , Wang X, Peng S , Zhao M
Received 21 February 2019
Accepted for publication 23 May 2019
Published 3 July 2019 Volume 2019:14 Pages 4817—4831
DOI https://doi.org/10.2147/IJN.S206294
Checked for plagiarism Yes
Review by Single anonymous peer review
Peer reviewer comments 2
Editor who approved publication: Dr Linlin Sun
Shurui Zhao,1 Ze Li,1 Fei Huang,2 Jianhui Wu,1 Lin Gui,1 Xiaoyi Zhang,1 Yaonan Wang,1 Xiaozhen Wang,1 Shiqi Peng,1 Ming Zhao1
1Beijing Area Major Laboratory of Peptide and Small Molecular Drugs, Engineering Research Center of Endogenous Prophylactic of Ministry of Education of China, Beijing Laboratory of Biomedical Materials, College of Pharmaceutical Sciences, Capital Medical University, Beijing 100069, People’s Republic of China; 2Institute of Cancer, Xinqiao Hospital, Third Military Medical University, Chongqing, People’s Republic of China
Background: In vitro (1R,3S)-1-methyl-1,2,3,4-tetrahydro-β-carboline-3-carboxyl-Lys(Pro-Ala-Lys)-Arg-Gly-Asp-Val (MTCA-KKV) adheres activated platelets, targets P-selectin and GPIIb/IIIa. This led to the development of MTCA-KKV as thrombus targeting nano-medicine.
Methods: MTCA-KKV was characterized by nano-feature, anti-thrombotic activity, thrombolytic activity, thrombus target and targeting release.
Results: In vivo 0.01 μmol/kg of MTCA-KKV formed nano-particles less than 100 nm in diameter, targeted thrombus, released anti-thrombotic and thrombolytic pharmacophores, prevented thrombosis and dissolved blood clots.
Conclusion: Based on the profiles of targeting thrombus, targeting release, inhibiting thrombosis and dissolving blood clots MTCA-KKV is a promising nano-medicine.
Keywords: nano-particles, anti-thrombotic, thrombolytic, targeting, release
Introduction
Coronary embolism, deep venous embolism, acute pulmonary embolism, arterial embolism and cerebral vascular embolism are the leading cause of major ischemic diseases.1,2 For platelets, the activation,3,4 adhesion,5,6 release of granule contents,7–9 response to multiple agonists10–20 and aggregation21,22 are involved in the pathogenesis of embolism. The platelets of patients with heart diseases of myocardial ischemia23–26 and ischemic stroke27–30 usually have higher reactivity. The anti-platelet therapy can decrease platelet reactivity and offer a desirable approach to prevent thrombosis.31–36 However, the major bleeding events, such as intracranial hemorrhage, gastrointestinal bleeding and the recurrent ischemic events greatly attenuate the clinical outcomes of anti-platelet therapy.34–38 This led to the reports of the agents, including circulatory-cell-mediated nanotherapeutics,39 platelet aggregation inhibitor,40 microparticle-inspired clot-responsive nanomedicine,41 liposomal nanocarriers for plasminogen activators,42 defibrotide,43 harmaline,44 β-carboline-3-carboxamide,45 manzamine A46 and amino acids/peptides conjugated heterocycles.47 As the special strategies, the peptide,48,49 the integration of multiple gene-based biotechnology50 and silica glass nanofiber-based nanotechnology51 were developed. Among those special strategies (1R,3S)-1-methyl-1,2,3,4-tetrahydro-β-carboline-3-carboxyl-Lys(Pro-Ala-Lys)-Arg-Gly-Asp-Val (MTCA-KKV) was designed to adhere the activated platelets, to target P-selectin and GPIIb/IIIa, and to inhibit platelet aggregation in vitro.52 However, the therapeutic potency of MTCA-KKV in vivo remains unknown. The possibility of MTCA-KKV to form nano-species, to act on platelet, to target thrombus and thereby to affect on the therapeutic potency led to the nano-image visualization, the in vivo anti-thrombotic and thrombolytic evaluations, the thrombus target examination and the targeting release discussion been presented in this paper.
Materials and methods
Chemicals and equipments
All chemicals and solvents for this investigation were commercially available and used without further purification, unless otherwise specified. On Bruker Avance III-800 spectrometer, 1H NMR (800 MHz) and 13C NMR (200 MHz) spectra were recorded. For all NMR measurements, DMSO-d6 was the solvent and tetramethylsilane was the internal standard. ESI/MS was tested on Fourier transform ion cyclotron resonance (FT-ICR, 9.4T solariX, Bruker, USA), and dual ion source of ESI/matrix-assisted laser desorption ionization was used.
Animal and ethics
Male Sprague–Dawley rats were purchased from the Laboratory Animal Center of Capital Medical University. All evaluations were based on the protocol reviewed and approved by Ethics Committee of Capital Medical University. Committee ensured that the welfare of the rats was in accordance to the requirements of Animal Welfare Act and NIH Guide for Care and Use of Laboratory Animals. All biological data were statistically analyzed by use of ANOVA, and LSD was for multiple group comparison. Data statistics was performed with SPSS 19.0 program and P<0.05 was considered statistical significance.
MTCA-KKV and HPLC purity
According to the literature, in an environment-friendly condition, MTCA-KKV was prepared by coupling MTCA and Lys(Pro-Ala-Lys)-Arg-Gly-Asp-Val (Figure 1).52 The yields of the former and the latter were 48% and 15%, respectively. The HPLC purity of MTCA-KKV was more than 98%.
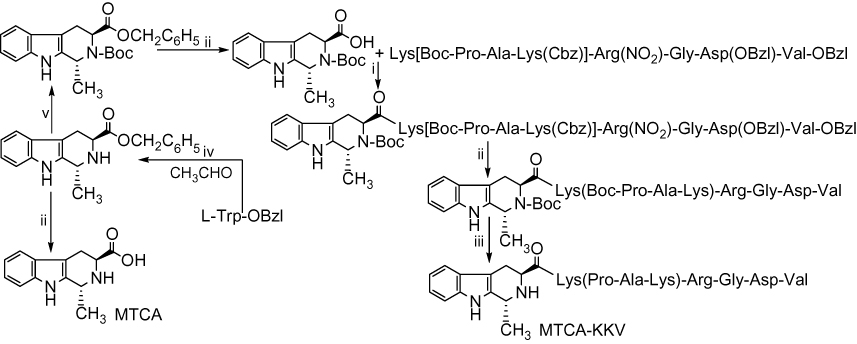 |
Figure 1 Preparation of MTCA-KKV. (i) DCC, HOBt, NMM and THF; (ii) H2, Pd/C and CH3OH; (iii) hydrogen chloride in ethyl acetate (4 M); (iv) H2SO4 (5 M), 60ºC; (v) DMF, (Boc)2O and trimethylamine. Abbreviations: DCC, dicyclohexylcarbodiimide; HOBt, N-hydroxybenzotriazole; NMM, N-methylmorpholine; THF, tetrahydrofuran; (Boc)2O, ditertbutyl dicarbonate; DMF, NN-dimethylformide; MTCA, (1R,3S)-1-methyl-1,2,3,4-tetrahydro-β-carboline-3-carboxylic acid; MTCA-KKV, (1R,3S)-1-methyl-1,2,3,4-tetrahydro-β-carboline-3-carboxyl-Lys(Pro-Ala-Lys)-Arg-Gly-Asp-Val. |
Assembly of MTCA-KKV
Energy-minimized conformation
By use of Chem Office 10.0, the structure of MTCA-KKV was converted to conformation; in MM2 force field, the energy minimization was performed and the minimum RMS was 0.001. The systematic search and BEST methods of Discovery Studio 3.5 were used to sample the energy-optimized conformations of MTCA-KKV, while the SMART minimizer was used to sample the conformation. The sampling parameters including energy threshold of 20 kcal/mol, 300 K, 200-minimization steps and 0.1 Å gradient of minimization root mean squared (RMS) were set to CHARMm force field. With an RMS deviation (RMSD) cutoff of 0.2 Å maximum 255 conformations were generated. From those conformations, the lowest energy conformation was selected to perform the related investigations.
Recording FT-ICR-MS spectrum
FT-ICR-MS spectrum of MTCA-KKV was recorded in positive electrospray ionization (ESI) mode. The qCID spectrum of 2,185.45423 m/z was measured and isolated in a window of 5 mass units. To analyze the spectral data, Software solariX and Bruker Daltonics Data Analysis were used.
Recording NOESY 2DNMR spectrum
On Bruker AvanceIII 800 MHz spectrometer, 1H NMR spectra of MTCA-KKV were recorded at 18.8 T equipped a CPQCI cryoprobe of 5 mm. The signals were observed and recorded at 800.25 MHz and 303 K, respectively. In 16 scans, the spectral width, data points, pulse width, relaxation delay and acquisition time were 16,447 Hz, 65,536, 8.78 μs, 1.0 s and 2 s, respectively. To enhance the sensitivity before Fourier Transforms, the spectrum was processed, accurately phased and baseline adjusted by applying an exponential line broadening of 0.3 Hz. By using a phase-sensitive mode having 512 points in F1 direction and 2,048 points in F2 direction, NOESY 2DNMR spectrum of MTCA-KKV was tested. In 12 scans of NOESY 2D NMR spectrum test, the relaxation delay was 2 s and the mixing time value was 0.30 s.
Testing particle size and zeta potential
On particle size analyzer (Nano-ZS90; Malvern Instruments Ltd, Malvern, UK) and Zeta Potential Plus Analyzer (Brookhaven Instruments Corp, Holtsville, NY, USA), the nano-property of MTCA-KKV in ultrapure water (pH 6.7, pH 2.0, 0.1 μM) was characterized by Tyndall effect, particle size and zeta potential. These were characterized at 25°C for 7 days (each 3 times) to reveal the effect of time on particle size and to show the application prospect of the nano-solution.
Mesoscale simulation of MTCA-KKV forming nano-particle
With ChemDraw Ultra 10.0 (Cambridge Soft) and Materials Studio 3.2 (Accelrys, Inc., USA), the structure and conformation of MTCA-KKV were generated, and then the conformation was entirely optimized with MS force module. To optimize the geometry, the maximum energy convergence and the maximum force were 2×10⁻⁵ kcal/mol and 0.001 kcal/mol/Å, respectively. At 500 K with NVT ensemble, the molecular dynamic simulation was performed till the equilibration was reached. With MS Dmol3 module, the equilibration structure was further optimized to build a rigid coarse grain model of 4 connected spherical beads. This 4-spherical-bead model was randomly distributed (density: 0.15 g/cm3) in a cubic box of 200×200×200 Å3. At 298 K with NVT ensemble, a simulation of 15,000 ps was performed.
Visualizing the nano-image of MTCA-KKV
Visualizing TEM image
The shape and size of the nanoparticles of MTCA-KKV were visualized on transmission electron microscopy (TEM, JEM-2100, JEOL, Tokyo, Japan). For this purpose, the solution (10 μM, 0.1 μM and 1 nM) of MTCA-KKV in ultrapure water of pH 6.8 was dripped onto a formvar-coated copper grid. This grid was air-dried, heated at 37°C for 14 days and observed under TEM to identify the shape and size of the nanoparticles. This observation was carried out in a randomly selected region with more than 100 species. To record 6,000–400,000× digitally enlarged TEM images an imaging plate (Gatan Bioscan Camera Model 1792, Pleasanton, CA, USA) with 20 eV energy windows was used. Each sample was tested with triplicate grids and the electron beam accelerating voltage was 80 kV.
Visualizing SEM image
The shape and size of the nanoparticles of MTCA-KKV were visualized on scanning electron microscopy (SEM, S-4800, Hitachi, Tokyo, Japan) at 50 kV. For this purpose, the solution (10 μM, 0.1 μM and 1 nM) of MTCA-KKV in the ultrapure water of pH 6.8 was lyophilized and the powders were attached to the copper plate with double-sided tape (Euromedex, Strasbourg, France). Using Joel JFC-1600 Auto Fine Coater (JEOL, Japan) at 15 kV, 30 mA and 200 mTorr (argon) for 60 s the specimens were coated with 20 nm gold-palladium. The feature and size of the nanoparticles were identified by examining more than 100 species in randomly selected region on the SEM alloy. For each sample, triplicate grids were prepared and examined. To record 100–10,000× digitally enlarged SEM images, an imaging plate (Gatan Bioscan Camera Model 1792, Pleasanton, CA, USA) was used, and the energy window was 20 eV.
Visualizing AFM image
The shape and size of the nanoparticles of the atomic force microscopy (AFM) images of the solution of MTCA-KKV in rat plasma (10 μM, 0.1 μM and 1 nM) were visualized on a Nanoscope 3D AFM (Veeco Metrology, Santa Barbara, CA, USA) in ambient condition by using a contact mode.
Measuring the interactions of MTCA-KKV with P-selectin and GPIIb/IIIa in vitro
To show the binding of MTCA-KKV on P-selectin and GPIIb/IIIa, the UV and circular dichroism (CD) spectra of them were measured. Briefly, over 250−500 nm of wavelength the UV spectra of the solution of MTCA-KKV alone (0.1 nM, in pH 6.7 ultrapure water) and plus P-selectin (8 pg/mL, 16 pg/mL and 32 pg/mL from Rat P-selectin ELISA KIT, Shanghai MLBIO Biotechnology Co. Ltd, China) or GPIIb/IIIa (200 U/mL, 400 U/mL and 800 U/mL from Rat GPIIb/IIIa ELISA KIT, Shanghai MLBIO Biotechnology Co. Ltd, China) were measured to show the change in wavelength and intensity of the maximum absorption. Similarly, over 180–350 nm of wavelength the CD spectra of P-selectin (32 pg/mL from Rat P-selectin ELISA KIT, Shanghai MLBIO Biotechnology Co. Ltd, China) alone or GPIIb/IIIa (800 U/mL from Rat GPIIb/IIIa ELISA KIT, Shanghai MLBIO Biotechnology Co. Ltd, China) alone and P-selectin (32 pg/mL) plus MTCA-KKV (0.05 nM, 0.10 nM and 0.20 nM in pH 6.7 ultrapure water) or GPIIb/IIIa (800 U/mL) plus MTCA-KKV (0.05 nM, 0.10 nM and 0.20 nM in pH 6.7 ultrapure water) were measured to show the change in wavelength and intensity of both positive and negative dichroic bands.
Visualizing the interactions of MTCA-KKV with platelet, erythrocyte and leucocyte in vitro
To know whether MTCA-KKV can adhere rat platelets, erythrocytes and leucocytes, the AFM images of resting platelets, erythrocytes and leucocytes without MTCA-KKV as well as the AFM images of resting platelets, erythrocytes and leucocytes plus MTCA-KKV (0.1 nM, in pH 6.7 ultrapure water) were visualized. For this purpose, the blood of healthy rat was sampled to separate resting platelets, erythrocytes and leucocytes by using a standard procedure. Briefly, rat blood containing 3.8% sodium citrate (citrate/blood =1/9,v/v) was centrifuged at 1,000 rpm for 10 mins to get platelet-rich plasma (PRP). Then, PRP was centrifuged at 3,000 rpm for an additional 10 mins to collect platelets. The erythrocytes and the leucocytes were isolated by following the guidance of erythrocyte and leucocyte cell separation medium kit (Solarbio, Beijing, China). AFM images were visualized on a Nanoscope 3D atomic force microscopy (AFM, Veeco Metrology, Santa Barbara, CA, USA) in ambient condition by using a contact mode.
Bioassays
Rat arterial thrombosis assay in vivo
On arterial-venous shunt-silk thread model of male Sprague−Dawley rats (220±20 g) the anti-arterial thrombosis activity of MTCA-KKV was evaluated. In brief, rats were randomly divided into groups (each 12 rats) and orally treated with NS (3 mL/kg) or MTCA (1 μmol/kg) or MTCA-KKV (0.001 μmol/kg, 0.01 μmol/kg and 0.1 μmol/kg) or aspirin (167 μmol/kg). Thirty minutes after the treatment, the rats were anesthetized with sodium pentobarbital (80.0 mg/kg, i.p.), and then their right carotid artery and left jugular vein were separated. Into a polyethylene tube, an exactly weighted silk thread of 6 cm in length was added. This polyethylene tube was filled by a solution of heparin sodium in NS (50 IU/mL), its ends were inserted into left jugular vein and right carotid artery, respectively, and the blood was allowed to flow for 15 mins via the polyethylene tube. Finally, from the polyethylene tube, the silk thread was removed, weighed and the increase of the weight of the silk thread was calculated to get the thrombus weight and represent the anti-thrombotic activity of MTCA-KKV.
Rat arterial thrombolytic assay in vivo
For arterial thrombolytic assay, male Sprague−Dawley rats (220±20 g) were used to evaluate the activity of MTCA-KKV. In brief, the rats were randomly divided into groups (each 12 rats) and orally treated with NS (3 mL/kg) or MTCA-KKV (0.01 μmol/kg) and intravenously treated with urokinase (UK, 20,000 IU/kg).
Thirty minutes after the oral treatment, the rats in NS and MTCA-KKV groups received 20% urethane (6 mL/kg, i.p.) for anesthetizing to separate the right carotid artery and the left jugular vein. To prepare thrombus, the cylindrical thrombus-supporting helix (15 circles, pitch 1.2 mm, diameter 1.0 mm) was placed in the glass tube. This glass tube was filled with 0.2 mL blood from the right carotid artery of the rat and allowed to have 15 mins coagulation for forming cylindrical thrombus. This blood clot was taken out of the glass tube, precisely weighed to record initial weight and put into the middle polyethylene tube. This tube was filled with the solution of heparin sodium in NS (50 IU/mL). Into the left jugular vein, one end of the tube was inserted, and the anticoagulant solution of heparin sodium in NS was injected via the other end of the tube. Via the tube the blood was allowed to circulate for 60 mins, the cylindrical thrombus was taken out of the tube, and precisely weighed to record final weight. The difference between the initial and final weights of cylindrical thrombus was obtained to represent the in vivo thrombolytic activity of MTCA-KKV.
Thirty minutes after the intravenous treatment, the rats in UK group received 20% urethane (6 mL/kg, i.p.) for anesthetizing to receive the same operation as the rats in NS and MTCA-KKV groups. Via the tube the blood was allowed to circulate for 60 mins, the cylindrical thrombus was taken out of the tube, and precisely weighed to record final weight. The difference between the initial and final weights of cylindrical thrombus was obtained to represent the in vivo thrombolytic activity of UK.
Results
Assembly of MTCA-KKV
Dimerization of MTCA-KKV
The nano-property of MTCA-KKV was addressed with MS and NMR spectra.53 FT-ICR-MS spectrum gives an ion peak at 1,082.60989, the mass of a monomer plus H, while the locally amplified spectrum gives an ion peak at 2,185.56405, the mass of a dimer plus Na (Figure 2A). The relationship of the monomer and the dimer was identified by qCID spectrum (Figure 2B). As seen, the qCID spectrum of the dimer (at 2,185.45423) gives an ion peak of the monomer plus H at 1,082.57256.
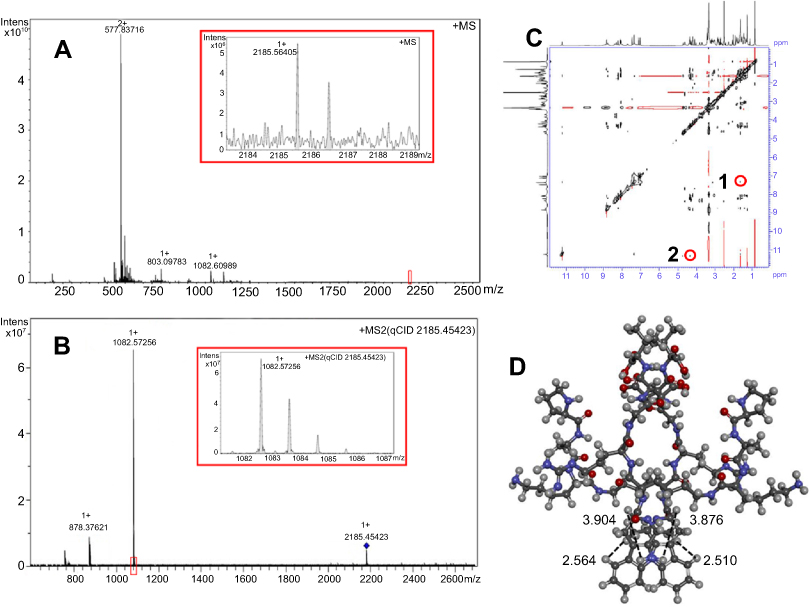 |
Figure 2 FT-ICR-MS, qCID and NOESY 2D NMR spectra of MTCA-KKV. (A) FT-ICR-MS spectrum of MTCA-KKV in aqueous solution; (B) qCID spectrum of MTCA-KKV in aqueous solution;(C) NOESY 2D NMR spectrum of MTCA-KKV in DMSO-d6; (D) energy minimized conformation of the dimer of MTCA-KKV. Abbreviations: MTCA-KKV, (1R,3S)-1-methyl-1,2,3,4-tetrahydro-β-carboline-3-carboxyl-Lys(Pro-Ala-Lys)-Arg-Gly-Asp-Val. |
To explore the manner of MTCA-KKV forming a dimer, the NOESY 2D NMR spectrum was measured.54 In Figure 2C, two interesting cross-peaks are marked with red circles. According to the knowledge of NOESY 2D NMR spectrum cross-peak 1 is resulted from the interaction of 1-methyl H of one molecule and aromatic H of carboline moiety of another molecule, while the cross-peak 2 is resulted from the interaction of 3-H of one molecule and pyrrole H of carboline moiety of another molecule (Figure 2D).
Nano-property of aqueous MTCA-KKV
To show the nano-property of aqueous MTCA-KKV, the Tyndall effect, particle size and zeta potential were measured.55 Figure 3A, C, E and G visualizes that without and with the radiation of 650 nm laser, the ultrapure water of pH 6.7 and pH 2.0 are transparent. Figure 3B and F visualizes that without the radiation of 650 nm laser, the solutions of MTCA-KKV in ultrapure water of pH 6.7 and pH 2.0 (0.1 μM) are transparent. Figure 3D and H visualizes that with the radiation of 650 nm laser, the solutions of MTCA-KKV in ultrapure water of pH 6.7 and pH 2.0 (0.1 μM) occur Tyndall effect, the character of nano-solution. Figure 3I shows that comparing to the ultrapure water of pH 2.0 the ultrapure water of pH 6.7 is more suitable for MTCA-KKV to form smaller particles. Figure 3I shows that within 7 days the size of the particles gradually increases from ~220 nm to ~340 nm, while in ultrapure water of pH 6.7 within the beginning 3 days the size of the particles closes 220 nm. Figure 3J indicates that the zeta potential on the surface of the particles of MTCA-KKV in ultrapure water of pH 6.7 is ~−25 mV.
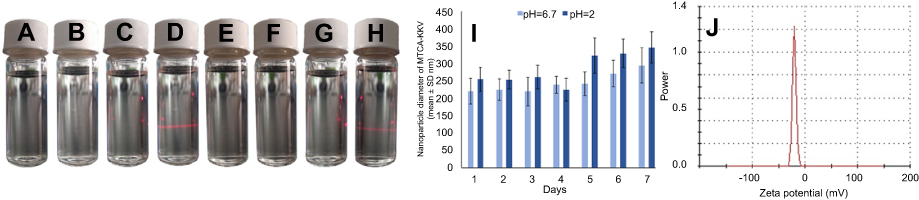 |
Figure 3 Tyndall effect, particle size and zeta potential of MTCA-KKV in ultrapure water. (A) Feature of ultrapure water of pH 6.7; (B) Feature of 0.1 μM solution of MTCA-KKV in ultrapure water of pH 6.7; (C) Feature of ultrapure water of pH 6.7 with the radiation of 650 nm laser; (D) Feature of 0.1 μM solution of MTCA-KKV in ultrapure water of pH 6.7 with the radiation of 650 nm laser; (E) Feature of ultrapure water of pH 2.0; (F) Feature of 0.1 μM solution of MTCA-KKV in ultrapure water of pH 2.0; (G) Feature of ultrapure water of pH 2.0 with the radiation of 650 nm laser; (H) Feature of 0.1 μM solution of MTCA-KKV in ultrapure water of pH 2.0 with the radiation of 650 nm laser; (I) Seven-days’ size of MTCA-KKV in pH 6.7 and pH 2.0 ultrapure water (0.1 μM); (J) Zeta potential of MTCA-KKV in pH 6.7 ultrapure water (0.1 μM). Abbreviations: MTCA-KKV, (1R,3S)-1-methyl-1,2,3,4-tetrahydro-β-carboline-3-carboxyl-Lys(Pro-Ala-Lys)-Arg-Gly-Asp-Val. |
TEM, SEM and AFM images of MTCA-KKV
To show the effect of the concentration on the nano-feature, the TEM, SEM and AFM of MTCA-KKV were imaged. TEM shows that in ultrapure water of pH 6.7 MTCA-KKV forms nano-particles of 12–187 nm in diameter, and even the concentration been decreased from 10.0 μM to 1.0 nM the diameter of most particles still falls within a range of 12–100 nm (Figure 4A–F).
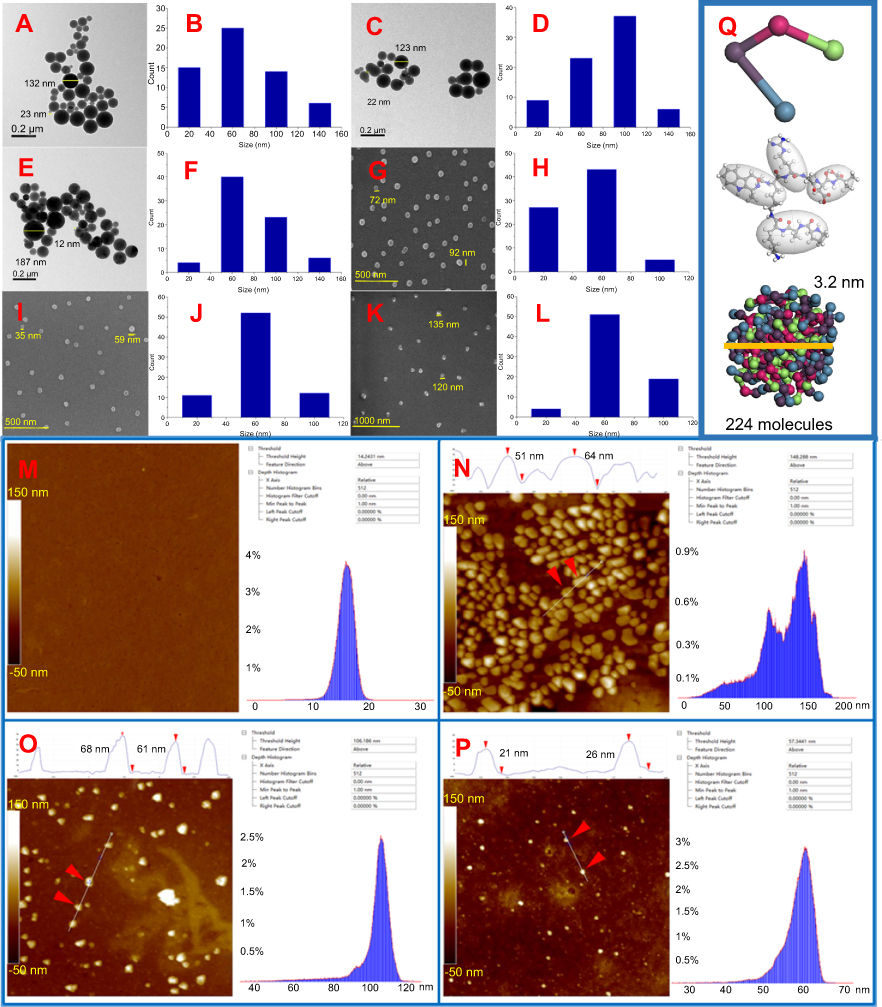 |
Figure 4 TEM, SEM and AFM images of MTCA-KKV in ultrapure water and plasma of rat. (A and B) TEM image and size distribution of particles of MTCA-KKV in ultrapure water of pH 6.7 (10.0 μM); (C and D) TEM image and size distribution of particles of MTCA-KKV in ultrapure water of pH 6.7 (0.1 μM); (E and F) TEM image and size distribution of particles of MTCA-KKV in ultrapure water of pH 6.7 (1.0 nM); (G and H) SEM image and size distribution of powders lyophilized from a solution of MTCA-KKV in pH 6.7 ultrapure water (10.0 μM); (I and J) SEM image and size distribution of powders lyophilized from a solution of MTCA-KKV in pH 6.7 ultrapure water (0.1 μM); (K and L) SEM image and size distribution of powders lyophilized from a solution of MTCA-KKV in pH 6.7 ultrapure water (1.0 nM); (M) AFM image of rat plasma; (N, O and P) AFM image and size distribution of the particles of MTCA-KKV in rat plasma (10.0 μM, 0.1 μM and 1.0 nM); (Q) MTCA-KKV’s nanoparticle predicted with mesoscale simulation software. Abbreviations: TEM, transmission electron microscopy; SEM, scanning electron microscopy; AFM, atomic force microscopy; MTCA-KKV, (1R,3S)-1-methyl-1,2,3,4-tetrahydro-β-carboline-3-carboxyl-Lys(Pro-Ala-Lys)-Arg-Gly-Asp-Val. |
SEM shows that the lyophilized powders are nano-particles of 35–135 nm in diameter. According to the legend of Figure 4G–L, 59%, 68% and 69% of the lyophilized powders are resulted from 10.0 μM, 0.1 μM and 1.0 nM aqueous solution of MTCA-KKV in the ultrapure water of pH 6.7, respectively, and the diameter of all powders is 60 nm.
AFM images of Figure 4M–P show that in rat plasma MTCA-KKV forms nano-particles of 21–68 nm in height, and the concentration does not significantly affect the particle height. At 10.0 μM, the height of most particles is 51–64 nm, at 0.1 μM, the height of most particles is 61–68 nm and at 1.0 nM, the height of most particles is 21–26 nm. Thus, even when the concentration is increased from 1.0 nM to 10.0 μM, the particle height still falls within a range of 21–68 nm.
To predict how much molecules can build a nano-particle with certain size MTCA-KKV was treated with the mesoscale simulation by optimizing conformation, forming a model of 4-spherical-beads and performing molecular dynamic simulation. Figure 4Q shows that 224 molecules can form a particle of 3.2 nm in diameter.
In vitro MTCA-KKV could bind on P-selectin and GPIIb/IIIa
The UV and CD obviously reflect the in vitro interaction between MTCA-KKV and P-selectin or GPIIb/IIIa. Figure 5A and B show that for MTCA-KKV, both P-selectin and GPIIb/IIIa concentration dependently reduce the UV absorption intensity and induce the absorption peak to have a slight hypochromatic shift.
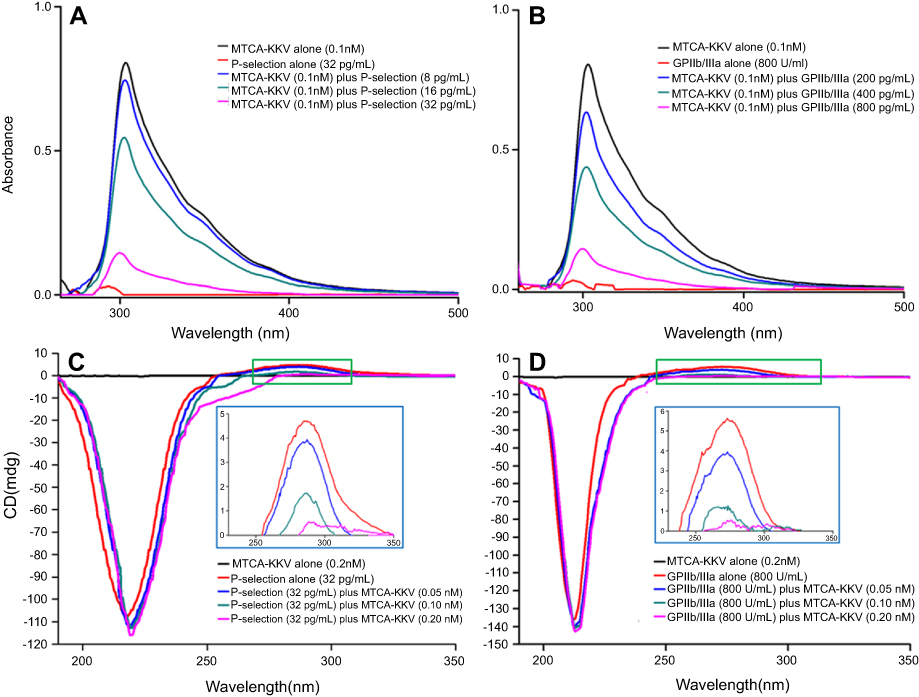 |
Figure 5 UV and CD described in vitro interaction between MTCA-KKV and P-selectin or GPIIb/IIIa. (A) P-selectin concentration dependently changes the UV of MTCA-KKV; (B) GPIIb/IIIa concentration dependently changes the UV MTCA-KKV; (C) MTCA-KKV concentration dependently changes the CD of P-selectin; (D) MTCA-KKV concentration dependently changes the CD of GPIIb/IIIa. Abbreviations: UV, ultra violet spectrum; CD, circular dichroism spectrum; MTCA-KKV, (1R,3S)-1-methyl-1,2,3,4-tetrahydro-β-carboline-3-carboxyl-Lys(Pro-Ala-Lys)-Arg-Gly- Asp-Val. |
Figure 5C and D mirrors the effect of MTCA-KKV on the CD of P-selectin and GPIIb/IIIa. As shown, MTCA-KKV concentration dependently reduces the intensity of their positive and negative bands. Besides, MTCA-KKV induces their positive and negative bands to have a slight bathochromic shift.
In vitro MTCA-KKV could adhere on platelet only
The AFM image visualizes the interaction of MTCA-KKV with rat platelets, erythrocytes and leucocytes in vitro. The AFM image visualizes that rat platelets themselves have smooth surface (Figure 6A). In the presence of MTCA-KKV (0.1 nM), however, the surface becomes uneven. A lot of nano-particles of 30–63 nm in height adhere on the surface (Figure 6B). Figure 6C and D visualizes that either rat erythrocytes themselves or rat erythrocytes with MTCA-KKV (0.1 nM) the surface is smooth. Similarly, either rat leucocytes themselves or rat leucocytes with MTCA-KKV (0.1 nM) the surface is smooth (Figure 6E and F). Thus, the nano-particles of MTCA-KKV have an intrinsic adhesion to platelets, but not erythrocytes and leucocytes.
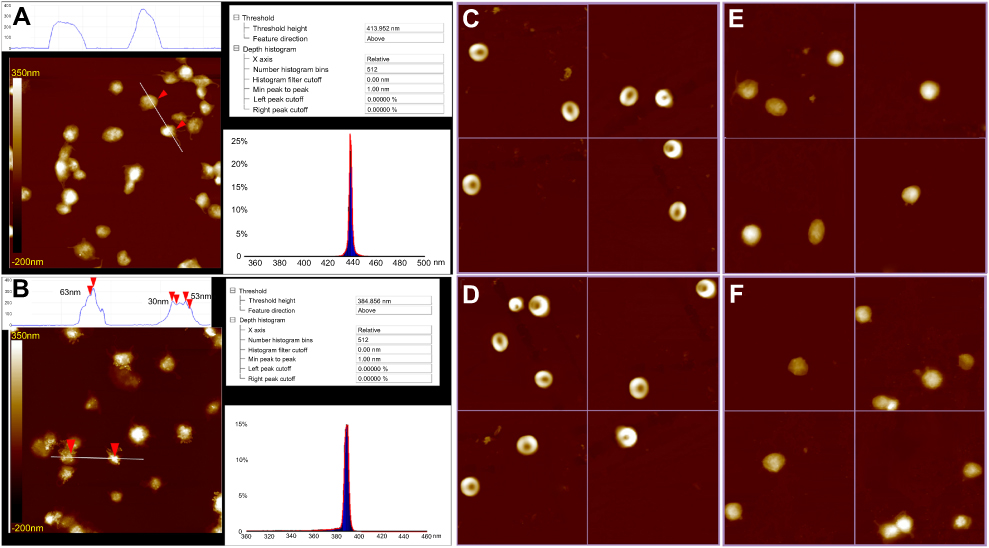 |
Figure 6 AFM feature of rat platelets, erythrocytes and leucocytes with and without MTCA-KKV. (A) AFM feature of rat platelets alone; (B) AFM feature of rat platelets with MTCA-KKV (0.1 nM, in pH 6.7 ultrapure water); (C) AFM feature of rat erythrocytes alone; (D) AFM feature of rat erythrocytes with MTCA-KKV (0.1 nM, in pH 6.7 ultrapure water); (E) AFM feature of rat leucocytes alone; (F) AFM feature of rat leucocytes with MTCA-KKV (0.1 nM, in pH 6.7 ultrapure water). Abbreviations: AFM, atomic force microscopy; MTCA-KKV, (1R,3S)-1-methyl-1,2,3,4-tetra-hydro-β-carboline-3-carboxyl-Lys(Pro-Ala-Lys)-Arg-Gly-Asp-Val. |
In vivo anti-arterial thrombosis activity of oral MTCA-KKV
The anti-arterial thrombosis activity of oral MTCA-KKV was evaluated on rat arterial-venous shunt-silk thread model. Figure 7A shows that the arterial thrombus weight of the rats orally treated with 0.001 μmol/kg, 0.01 μmol/kg and 0.1 μmol/kg of MTCA-KKV are significantly and gradually decreased. Therefore, MTCA-KKV dose-dependently inhibits arterial thrombosis. Figure 7A further shows that the arterial thrombus weight of the rats orally treated with 0.01 μmol/kg, but not 0.001 μmol/kg, of MTCA-KKV is significantly lower than that of the rats treated with NS, suggesting 0.01 μmol/kg is the minimal effective dose. Besides, the arterial thrombus weight of the rats orally treated with 0.01 μmol/kg of MTCA-KKV is equal to that of the rats orally treated with 1 μmol/kg of oral MTCA, suggesting the activity of MTCA-KKV is 100 folds of MTCA. Furthermore, the arterial thrombus weight of the rats orally treated with 0.1 μmol/kg of MTCA-KKV is equal to that of the rats orally treated with 167 μmol/kg of aspirin.
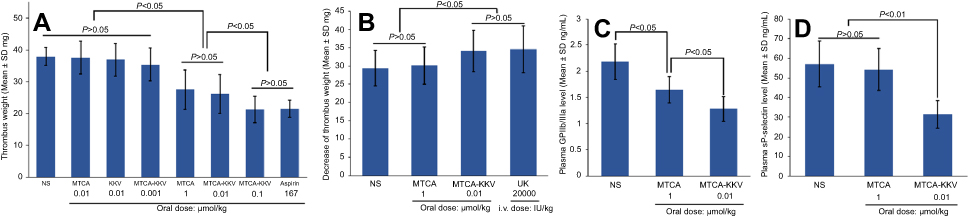 |
Figure 7 In vivo anti-arterial thrombosis and thrombolytic activity, as well as downregulation of the expression of GPIIb/IIIa and P-selectin. (A) Dose-dependently anti-arterial thrombosis activities of MTCA-KKV; (B) Thrombolytic activity of 0.01 μmol/kg MTCA-KKV; (C) GPIIb/IIIa expression of the rats treated with 0.01 μmol/kg MTCA-KKV; (D) P-selectin expression of the rats treated with 0.01 μmol/kg MTCA-KKV; n=12. Abbreviations: NS, normal saline; MTCA, (1R,3S)-1-methyl-1,2,3,4-tetrahydro-β-carboline-3-carboxylic acid; MTCA-KKV, (1R,3S)-1-methyl-1,2,3,4-tetrahydro-β-carboline-3-carboxyl-Lys(Pro-Ala-Lys)-Arg-Gly-Asp-Val. |
In vivo thrombolytic activity of oral MTCA-KKV
The thrombolytic activity of oral MTCA-KKV was evaluated on rat arterial thrombolytic model. Figure 7B shows that the decrease of thrombus weight of the rats orally treated with 0.01 μmol/kg of MTCA-KKV is significantly higher than those of the rats orally treated with NS and 1 μmol/kg of MTCA. Therefore, the oral efficacy of MTCA-KKV is 100 folds of MTCA. Figure 7B further shows that the oral efficacy of 0.01 μmol/kg of MTCA-KKV is equal to the intravenous efficacy of 20,000 IU/kg of UK.
MTCA-KKV inhibiting GPIIb/IIIa expression in vivo
The plasma GPIIb/IIIa of the rats receiving anti-arterial thrombosis assay was measured with enzyme immunoassay by following manufacturer’s instruction (Rat Platelet Membrane Glycoprotein ELISA Kit; Rapid Bio Tests Corp, USA). Figure 7C shows that the plasma GPIIb/IIIa of the rats orally treated with NS is significantly higher than that of the rats orally treated with 1 μmol/kg of MTCA, while the plasma GPIIb/IIIa of the rats orally treated with 1 μmol/kg of MTCA is significantly higher than that of the rats orally receiving 0.01 μmol/kg of MTCA-KKV. This means that the activity of MTCA-KKV inhibiting GPIIb/IIIa expression is 100-folds higher than that of MTCA. These data also mean that GPIIb/IIIa is one of the targets of MTCA-KKV to exhibit anti-arterial thrombosis and thrombolytic activities in vivo.
MTCA-KKV inhibiting P-selectin expression in vivo
The plasma P-selectin of the rats receiving anti-arterial thrombosis assay was measured with enzyme immunoassay by following manufacturer’s instruction (Rat Platelet Membrane Glycoprotein ELISA Kit; Rapid Bio Tests Corp, USA). Figure 7D shows that the plasma P-selectin of the rats orally treated with NS is equal to that of the rats orally treated with 1 μmol/kg of MTCA, and significantly higher than that of the rats orally treated with 0.01 μmol/kg of MTCA-KKV. This means that the activity of MTCA-KKV inhibiting P-selectin expression is 100-folds higher than that of MTCA. These data also mean that P-selectin is one of the targets of MTCA-KKV to exhibit anti-arterial thrombosis and thrombolytic activities in vivo.
Arterial thrombus targeting action of MTCA-KKV in vivo
The thrombus targeting action of MTCA-KKV was identified by ESI(+)-FT-MS and ESI(-)-FT-MS analyses. In this regard, the MS spectra of homogenate extracts of the organ and the arterial thrombus of NS and 0.01 μmol/kg MTCA-KKV treated rats were measured. It was found that both the ESI(+)-FT-MS and ESI(-)-FT-MS spectra of homogenate extracts of the organs and the thrombus of NS-treated rats gave no any interesting peak related to MTCA-KKV. Similarly, both the ESI(+)-FT-MS and ESI(-)-FT-MS spectra of homogenate extract of the organ of 0.01 μmol/kg MTCA-KKV treated rats also gave no any interesting peak.
However, both the ESI(+)-FT-MS and ESI(-)-FT-MS spectra of homogenate extract of arterial thrombus of 0.01 μmol/kg MTCA-KKV treated rats gave interesting peak. Figure 8A shows that the ESI(+)-FT-MS spectrum of the homogenate extract of arterial thrombus of rats treated with 0.01 μmol/kg MTCA-KKV gives four ion peaks at 253.05452 (MTCA plus H), 315.27347 (Pro-Ala-Lys plus H), 574.47932 (Lys-Arg-Gly-Asp-Val plus H) and 786.61889 (MTCA-Lys-Arg-Gly-Asp-Val plus H). Figure 8B shows that the ESI(-)-FT-MS spectrum of the homogenate extract of arterial thrombus of rats treated with 0.01 μmol/kg of MTCA-KKV gives two ion peaks at 904.58214 [Lys(Pro-Ala-Lys)-Arg-Gly-Asp-Val plus Cl] and 444.24140 (Arg-Gly-Asp-Val minus H). Therefore, MTCA-KKV only enters the arterial thrombus of the treated rats.
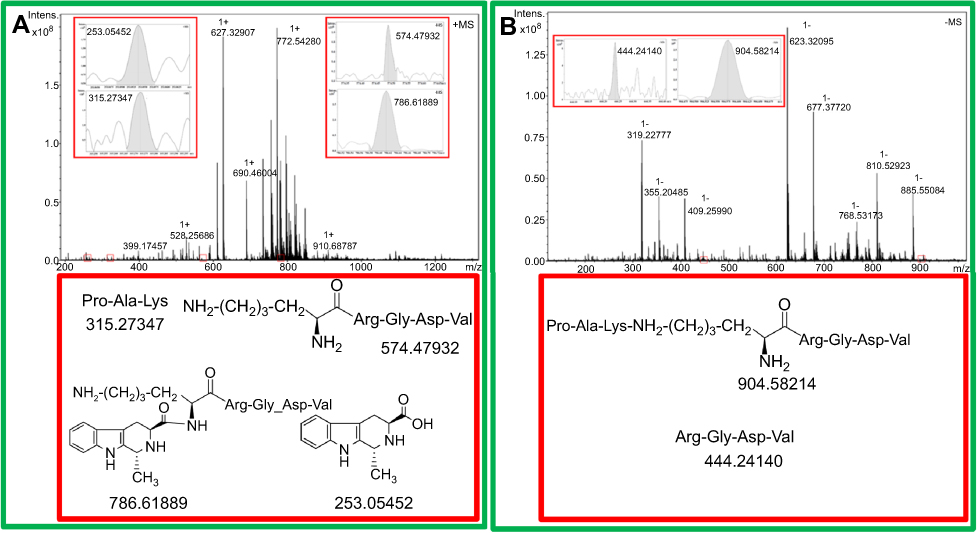 |
Figure 8 (A) ESI(+)-FT-MS spectrum of the extract of arterial thrombus of rats treated with 0.01 μmol/kg MTCA-KKV; (B) ESI(-)-FT-MS spectrum of the extract of arterial thrombus of rats treated with 0.01 μmol/kg of MTCA-KKV. Abbreviations: MTCA-KKV, (1R,3S)-1-methyl-1,2,3,4-tetrahydro-β-carboline-3-carboxyl-Lys(Pro-Ala-Lys)-Arg-Gly-Asp-Val. |
Discussion
The FT-ICR-MS spectrum gives the ion peak of the monomer plus H at 1,082.57256 and the ion peak of the dimer plus H at 2,185.56405, but the qCID spectrum of the dimer gives the ion peak of the monomer plus H. This suggests that in FT-ICR-MS condition the monomer is resulted from the dimer, in aqueous solution MTCA-KKV exists as the dimer and MTCA-KKV has further assembly potential.
The manner of MTCA-KKV forming the dimer was explored by two cross-peaks of the NOESY 2D NMR spectrum. According to the requirement of NOESY 2D NMR spectrum, the distances between the protons involved in the cross-peaks should be less than 4 Å and the dimer should have a bat-like conformation (Figure 2D).
The ability of MTCA-KKV to form nano-species was visualized by Tyndall effect, particle size and zeta potential. All data suggest that aqueous MTCA-KKV not only has nano-property and but also has distinctive application either as aqueous solution of pH 6.7 or as aqueous solution of pH 2.0.
To explore the effect of concentration on the nano-feature, MTCA-KKV was imaged with TEM, SEM and AFM. TEM shows that in ultrapure water of pH 6.7 MTCA-KKV forms nano-particles and when the concentration is decreased from 10.0 μM to 1.0 nM, the diameter of most particles still falls within a range of 20–100 nm. SEM shows that the lyophilized powder prepared from 10.0 μM, 0.1 μM and 1.0 nM of aqueous MTCA-KKV is nano-particles in diameter of 35–135 nm. This means that the lyophilized powders can be optionally used as a solid agent. AFM shows that in rat plasma and at 10.0 μM, 0.1 μM and 1.0 nM, the height of all nano-particles falls within a range of 21–68 nm. Comparing to the nano-particles in the lyophilized powders and in aqueous solution, the particles formed in rat plasma are smaller. With this sized nano-particles, MTCA-KKV can avoid the macrophage phagocytosis and could be successfully delivered in blood circulation.56
The molecular number of MTCA-KKV in an exact size nano-particle could be predicted by mesoscale simulation. Figure 4Q shows that mesoscale simulation can be generally used to predict the molecule number of the small molecule in an optional nano-particle. Thus, it is possible to quantitatively describe the molecular composition for an optional nano-particle.
The anti-arterial thrombosis assay shows that oral MTCA-KKV exhibits dose-dependent inhibition, 0.01 μmol/kg is the minimal effective dose and its activity is 1,670 folds of aspirin. The thrombolytic assay shows that at this dose MTCA-KKV also significantly decreases thrombus weight. Thus, 0.01 μmol/kg of oral MTCA-KKV possesses dual anti-thrombosis and thrombolytic actions.
The UV and CD were used to reflect the in vitro interaction between MTCA-KKV and P-selectin or GPIIb/IIIa. Figure 5A and B show that MTCA-KKV concentration dependently reduces the UV absorption intensity and induce the absorption peak to have a slight hypochromatic shift for both P-selectin and GPIIb/IIIa.
To show whether GPIIb/IIIa and P-selectin are the targets of MTCA-KKV, the UV and CD spectra were presented. Figure 5A–D evidence that in vitro MTCA-KKV concentration dependently changes the intensity and shifts position of the UV and CD of P-selectin and GPIIb/IIIa. These spectra mirror that MTCA-KKV has affinity for both P-selectin and GPIIb/IIIa. This kind affinity could lead to MTCA-KKV binding both of them.
To explain the benefits of MTCA-KKV binding GPIIb/IIIa and P-selectin, the enzyme immunoassays were performed. Figure 7C shows that at the minimal effective dose MTCA-KKV significantly decreases the level of GPIIb/IIIa in the plasma of the treated rats (when comparing to NS). Figure 7D shows that at the minimal effective dose MTCA-KKV significantly decreases the level of P-selectin in the plasma of the treated rats (when comparing to NS).
Considering both P-selectin and GPIIb/IIIa locate on the surface of the platelets, the adhesion of MTCA-KKV to rat platelet, erythrocytes and leucocytes are evidenced with AFM image. Figure 6 visualizes that on the surface of the platelets, but not erythrocytes and leucocytes, there are a lot of nano-particles of 30–63 nm in height. These nano-particles are clearly in consistent with those in rat plasma. This implies that the adhesion of the nano-particles on the platelets should result in MTCA-KKV inhibiting the expression of both P-selectin and GPIIb/IIIa, and emphasizes that both P-selectin and GPIIb/IIIa are the targets.
The zeta potential test indicates that aqueous MTCA-KKV (in pH 6.7 ultrapure water) has ~−25 mV of zeta potential. This means that the surface of the nano-particles of MTCA-KKV is surrounded by numerous negative charges. These negative charges could strongly repel each other, impede the aggregation of the nano-particles and help them to hold the small size for adhering the platelets.
The in vivo thrombus targeting action was confirmed by MS analysis. Figure 8A shows that the ESI(+)-FT-MS spectrum of the homogenate extract of thrombus of 0.01 μmol/kg MTCA-KKV-treated rats gives four ion peaks of MTCA plus H, Pro-Ala-Lys plus H, Lys-Arg-Gly-Asp-Val plus H and MTCA-Lys-Arg-Gly-Asp-Val plus H. Figure 8B shows that the ESI(-)-FT-MS spectrum of the homogenate extract of thrombus of 0.01 μmol/kg MTCA-KKV-treated rats gives two ion peaks of Lys(Pro-Ala-Lys)-Arg-Gly-Asp-Val plus Cl and Arg-Gly-Asp-Val minus H. Therefore, in vivo MTCA-KKV only enters the arterial thrombus and releases bioactive components wherein in a targeting manner.
The MS analysis leads to the hypothesis of the release pattern of MTCA-KKV in the arterial thrombus, to understanding of the in vivo actions at molecular level, and to structural correlation.
Figure 9 shows releasing way A-C. In way A, MTCA-KKV is degraded to MTCA, Lys(Pro-Ala-Lys)-Arg-Gly-Asp-Val and Pro-Ala-Lys. In way B, MTCA-KKV is degraded to MTCA, MTCA-Lys-Arg-Gly-Asp-Val and Pro-Ala-Lys, in way C, both Lys(Pro-Ala-Lys)-Arg-Gly-Asp-Val and Lys-Arg-Gly-Asp-Val are degraded to Lys-Arg-Gly-Asp-Val.
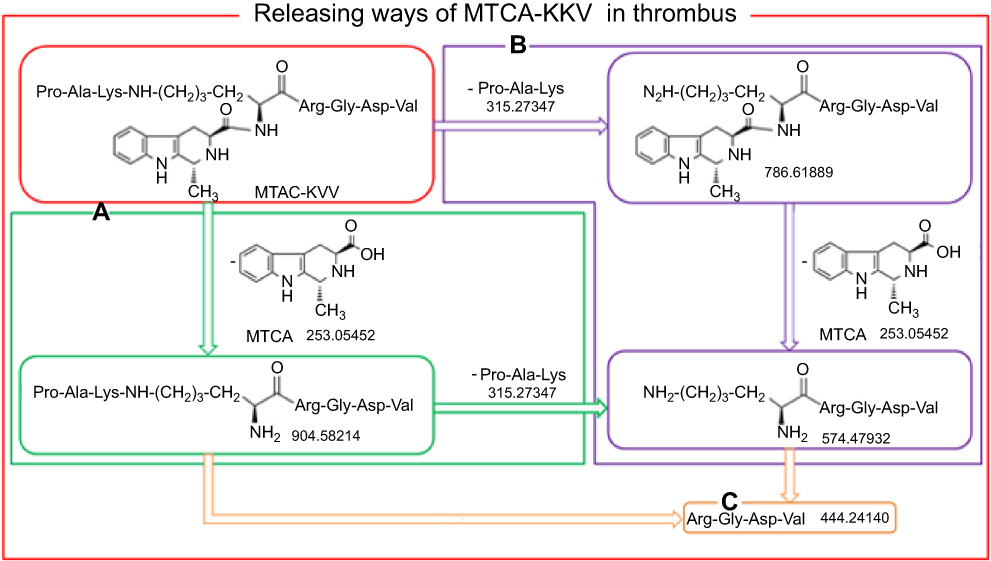 |
Figure 9 (A-C) In the arterial thrombus of the treated rats, MTCA-KKV is degraded via 3 ways to release anti-thrombosis, thrombolytic and thrombus targeting pharmacophores. Abbreviations: MTCA, (1R,3S)-1-methyl-1,2,3,4-tetrahydro-β-carboline-3-carboxylic acid; MTCA-KKV, (1R,3S)-1-methyl-1,2,3,4-tetrahydro-β-carboline-3-carboxyl-Lys(Pro-Ala-Lys)-Arg-Gly-Asp-Val. |
It is generally known that MTCA and Arg-Gly-Asp-Val are the anti-thrombotic pharmacophores, Pro-Ala-Lys is the thrombolytic pharmacophore and Arg-Gly-Asp-Val is the thrombus targeting pharmacophore. Therefore, these releasing ways demonstrate the molecular mechanism of MTCA-KKV targeting thrombus, the downregulating the expression of P-selectin and GPIIb/IIIa, inhibiting arterial thrombosis and dissolving blood clots.
Arterial and cerebral embolisms are a leading cause of major ischemic diseases. The discovery and development of anti-thrombotic and thrombolytic agents are of clinical importance. Due to high potency of inhibiting arterial thrombosis and dissolving blood clots, MTCA-KKV should attract broad clinical attention. Since the diameter of most particles in ultrapure water of pH 6.7 been less than 100 nm, aqueous MTCA-KKV could be considered as optional nano-solution. Owing to the height of all particles in rat plasma been less than 70 nm, MTCA-KKV should be safely delivered in blood circulation without the risk of macrophage phagocytosis. Because of the efficacy of selectively adhering the surface of the platelets, substantially down-regulating the expression of both P-selectin and GPIIb/IIIa, specifically releasing anti-thrombotic and thrombolytic pharmacophores in arterial thrombus, MTCA-KKV will be recommended as a thrombus targeting nano-medicine.
Conclusion
In conclusion, the self-assembly of MTCA-KKV leads to the formation of the dimers and the nano-particles. In blood circulation, the nano-particles are suitable for delivery via safely avoiding the macrophage phagocytosis, selectively adhere on the platelets and block the expression of both P-selectin and GPIIb/IIIa. By entering the thrombus, but not the health organs, MTCA-KKV releases anti-thrombotic and thrombolytic pharmacophores, thereby effectively inhibiting arterial thrombosis and dissolving arterial blood clots in the dose-dependent manner. MTCA-KKV should be a promising candidate for the development of nano-medicine. These are summarized in Figure 10.
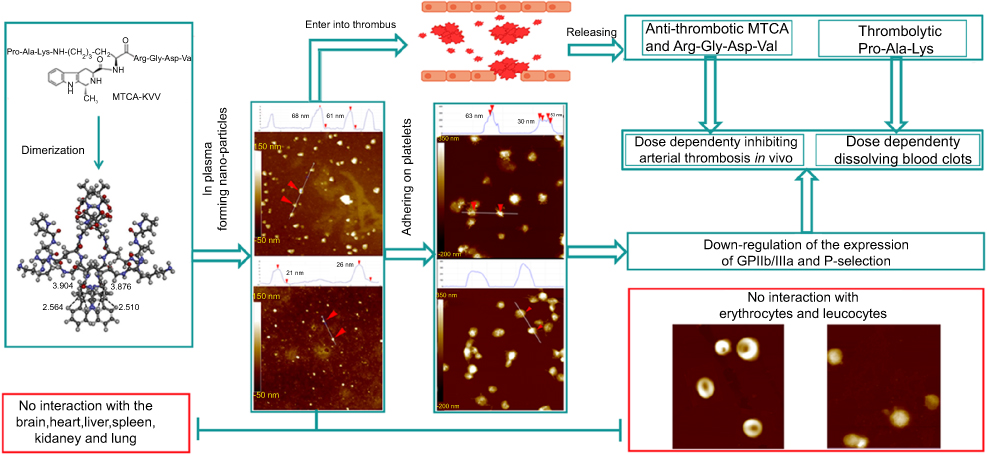 |
Figure 10 Graphic conclusion. Abbreviations: MTCA, (1R,3S)-1-methyl-1,2,3,4-tetrahydro-β-carboline-3-carboxylic acid; MTCA-KKV, (1R,3S)-1-methyl-1,2,3,4-tetrahydro-β-carboline-3-carboxyl-Lys(Pro-Ala-Lys)-Arg-Gly-Asp-Val. |
Acknowledgment
The authors thank the Special Project of China (2018ZX097201003), NSFC (81373264, 81673303 and 81572779), KZ201610025029, BNSF (7172028) and KM201810025010, KM201810025011 for financial support.
Disclosure
The authors report no conflicts of interest in this work.
References
1. Moretti A, Ferrari F, Villa RF. Pharmacological therapy of acute ischaemic stroke: achievements and problems. Pharmacol Ther. 2015;146:23–34. doi:10.1016/j.pharmthera.2014.09.003
2. Granger DN, Kvietys PR. Reperfusion therapy – what’s with the obstructed, leaky and broken capillaries? Pathophysiology. 2017;24:213–228. doi:10.1016/j.pathophys.2017.09.003
3. Bonechi C, Lamponi S, Donati A, et al. Effect of resveratrol on platelet aggregation by fibrinogen protection. Biophys Chem. 2017;222:41. doi:10.1016/j.bpc.2016.12.004
4. Bobbert P, Weikert U, Schmidt-Lucke C, et al. Platelet activation and thrombus formation relates to the presence of myocardial inflammation in patients with cardiomyopathy. J Cardiol. 2013;63(5):379–384. doi:10.1016/j.jjcc.2013.06.018
5. Tesfamariam B. Distinct characteristics of neonatal platelet reactivity. Pharmacol Res. 2017;123:1–9. doi:10.1016/j.phrs.2017.06.003
6. Spann AP, Campbell JE, Fitzgibbon SR, et al. The effect of hematocrit on platelet adhesion: experiments and simulations. Biophys J. 2016;111(3):577–588. doi:10.1016/j.bpj.2016.06.024
7. Faggio C, Sureda A, Morabito S, et al. Flavonoids and platelet aggregation: a brief review. Eur J Pharmacol. 2017;807:91–101. doi:10.1016/j.ejphar.2017.04.009
8. Ghasemzadeh M, Hosseini E. Platelet granule release is associated with reactive oxygen species generation during platelet storage: a direct link between platelet pro-inflammatory and oxidation states. Thromb Res. 2017;156:101. doi:10.1016/j.thromres.2017.06.016
9. Milioli M, Ib´A˜nezvea M, Sidoli S, et al. Quantitative proteomics analysis of platelet-derived microparticles reveals distinct protein signatures when stimulated by different physiological agonists. J Proteomics. 2015;121:56–66. doi:10.1016/j.jprot.2015.03.013
10. Lee W, Ku SK, Kim MA, Bae J-S. Anti-factor Xa activities of zingerone with anti-platelet aggregation. Activity. Food Chem Toxicol. 2017;105:186–193. doi:10.1016/j.fct.2017.04.012
11. Fan H, Li M, Yu L, et al. Effects of Danhong injection on platelet aggregation in hyperlipidemia rats. J Ethnopharmacol. 2017;212:67–73. doi:10.1016/j.jep.2017.09.015
12. Lee W, Kim MA, Park I, et al. Novel direct factor Xa inhibitory compounds from Tenebrio molitor with anti-platelet aggregation activity. Food Chem Toxicol. 2017;109:19–27. doi:10.1016/j.fct.2017.08.026
13. Ottaiano TF, Andrade SS, De OC, et al. Plasma kallikrein enhances platelet aggregation response by subthreshold doses of ADP. Biochimie. 2017;135:72–81. doi:10.1016/j.biochi.2017.01.010
14. Son YM, Jeong DH, Park HJ, Rhee MH. The inhibitory activity of ginsenoside Rp4 in adenosine diphosphate-induced platelet aggregation. J Ginseng Res. 2017;41:96–102. doi:10.1016/j.jgr.2016.01.003
15. Grundler K, Rotter R, Tilley S, et al. The proteasome regulates collagen-induced platelet aggregation via nuclear-factor-kappa-B (NFĸB) activation. Thromb Res. 2016;148:15–22. doi:10.1016/j.thromres.2016.10.009
16. Olivier CB, Weik P, Meyer M, et al. TRAP-induced platelet aggregation is enhanced in cardiovascular patients receiving dabigatran. Thromb Res. 2015;138:63–68. doi:10.1016/j.thromres.2015.10.038
17. Hally KE, La Flamme AC, Larsen PD, Harding SA. Platelet Toll-like receptor (TLR) expression and TLR-mediated platelet activation in acute myocardial infarction. Thromb Res. 2017;158:8–15. doi:10.1016/j.thromres.2017.07.031
18. Gupta S, Reviakine I. The sweeter aspects of platelet activation: A lectin-based assay reveals agonist-specific glycosylation patterns. Biochim Biophys Acta. 2014;1840(12):3423–3433. doi:10.1016/j.bbagen.2014.08.010
19. Bijak M, Dziedzic A, Saluk-Bijak J. Flavonolignans reduce the response of blood platelet to collagenMichal. Int J Biol Macromol. 2017;106:878–884. doi:10.1016/j.ijbiomac.2017.08.091
20. Tafelmeier M, Fischer A, Orsó E, et al. Mildly oxidized HDL decrease agonist-induced platelet aggregation and release of pro-coagulant platelet extracellular vesicles. J Steroid Biochem Mol Biol. 2016;169:176–188. doi:10.1016/j.jsbmb.2016.05.003
21. Honda Y, Kamisato C, Morishima Y. Prevention of arterial thrombosis by edoxaban, an oral factor Xa inhibitor in rats: monotherapy and in combination with antiplatelet agents. Eur J Pharmacol. 2016;786:246–252. doi:10.1016/j.ejphar.2016.06.011
22. Fuentes E, Palomo I. Antiplatelet effects of natural bioactive compounds by multiple targets: food and drug interactions. J Funct Foods. 2014;6(1):73–81. doi:10.1016/j.jff.2013.10.012
23. Navarese EP, Kolodziejczak M, Winter MP, et al. Association of PCSK9 with platelet reactivity in patients with acute coronary syndrome treated with prasugrel or ticagrelor: the PCSK9-REACT study. Int J Cardiol. 2016;227:644–649. doi:10.1016/j.ijcard.2016.10.084
24. Redfors B, Généreux P, Witzenbichler B, et al. Association of PCSK9 with platelet reactivity in patients with acute coronary syndrome treated with prasugrel or ticagrelor: the PCSK9-REACT study. Int J Cardiol. 2017;250:92–97. doi:10.1016/j.ijcard.2017.10.022
25. Clavijo LC, Al-Asady N, Dhillon A, et al. Prevalence of high on-treatment (aspirin and clopidogrel) platelet reactivity in patients with critical limb ischemia. Cardiovasc Revasc Med. 2018;19(5 Pt A):516–520. doi:10.1016/j.carrev.2017.10.013
26. Makowski M, Smorag I, Makowska J, et al. Platelet reactivity and mean platelet volume as risk markers of thrombogenesis in atrial fibrillation. Int J Cardiol. 2017;235:1–5. doi:10.1016/j.ijcard.2017.03.023
27. Rosafio F, Lelli N, Mimmi S, et al. Platelet function testing in patients with acute ischemic stroke: an observational study. J Stroke Cerebrovasc Dis. 2017;26(8):1864–1873. doi:10.1016/j.jstrokecerebrovasdis.2017.07.028
28. Meves SH, Schröder KD, Endres HG, Krogias C, Krüger JC, Neubauer H. Neubauer, Clopidogrel high-on-treatment platelet reactivity in acute ischemic stroke patients. Thromb Res. 2014;133(3):396–401. doi:10.1016/j.thromres.2013.10.032
29. Rao Z, Zheng H, Wang F, et al. High on-treatment platelet reactivity to adenosine diphosphate predicts ischemic events of minor stroke and transient ischemic attack. J Stroke Cerebrovasc Dis. 2017;26(10):2074–2081. doi:10.1016/j.jstrokecerebrovasdis.2017.07.028
30. Qiu L, Sun Y, Wang L, et al. Influence of CYP2C19 polymorphisms on platelet reactivity and clinical outcomes in ischemic stroke patients treated with clopidogrel. Eur J Pharmacol. 2015;747:29–35. doi:10.1016/j.ejphar.2014.11.037
31. Malhotra N, Abunassar J, Wells GA, et al. A pharmacodynamic comparison of a personalized strategy for anti-platelet therapy versus ticagrelor in achieving a therapeutic window. Int J Cardiol. 2015;197:318–325. doi:10.1016/j.ijcard.2015.06.016
32. Girotra C, Padhye M, Mandlik G, et al. Assessment of the risk of haemorrhage and its control following minor oral surgical procedures in patients on anti-platelet therapy: a prospective study. Int J Oral Maxillofac Surg. 2014;43(1):99–106. doi:10.1016/j.ijom.2013.07.004
33. Liou K, Lambros J. Delayed left ventricular apical thrombus formation following discontinuation of dual anti-platelet therapy. Heart Lung Circ. 2014;23:e237–e239. doi:10.1016/j.hlc.2013.11.013
34. Kai H, Kohro T, Fukuda K, Yamazaki T, Nagai R. Impact of systolic blood pressure on hemorrhagic stroke in patients with coronary artery disease during anti-platelet therapy: the Japanese Coronary Artery Disease (JCAD) study. Int J Cardiol. 2016;224:112–113. doi:10.1016/j.ijcard.2016.09.004
35. Cai TQ, Alexandra WL, Sitko G, et al. Platelet transfusion reverses bleeding evoked by triple anti-platelet therapy including vorapaxar, a novel platelet thrombin receptor antagonist. Eur J Pharmacol. 2015;758:107–114. doi:10.1016/j.ejphar.2015.03.073
36. Hally KE, La Flamme AC, Larsen PD, Harding SA. Toll-like receptor 9 expression and activation in acute coronary syndrome patients on dual anti-platelet therapy. Thromb Res. 2016;148:89–95. doi:10.1016/j.thromres.2016.10.026
37. Massicotte MP, Maul TM, Snyder TA, Kreuziger LB. Mechanical circulatory support and antithrombotic therapy: looking for the holy grail. Asaio J. 2017;63(1):1–4. doi:10.1097/MAT.0000000000000500
38. Boccalandro F, Dhindsa M, Subramaniyam P, Mok M. Feasibility of coronary fractional flow reserve with dual anti-platelet therapy in low risk coronary lesions without systemic anticoagulation-results of the SMART-FFR study. Cardiovasc Revasc Med. 2018:19(3):343–347
39. Burnouf T, Burnouf PA, Wu Y, Chuang E, Lu L, Goubran H. Circulatory-cell-mediated nanotherapeutic approaches in disease targeting. Drug Discov Today. 2018;23(5):934–943. doi:10.1016/j.drudis.2017.08.012
40. Kong Y, Xu C, He Z, et al. A novel peptide inhibitor of platelet aggregation from stiff silkworm, Bombyx batryticatus. Peptides. 2014;53:70–78. doi:10.1016/j.peptides.2013.12.004
41. Pawlowski CL, Wei L, Sun M, et al. Platelet microparticle-inspired clot-responsive nanomedicine for targeted fibrinolysis. Biomaterials. 2017;128:94–108. doi:10.1016/j.biomaterials.2017.03.012
42. Koudelka S, Mikulik R, Mašek J, et al. Liposomal nanocarriers for plasminogen activators. J Controlled Release. 2016;227:45. doi:10.1016/j.jconrel.2016.02.019
43. Pescador R, Capuzzi L, Mantovani M, Fulgenzi A, Ferrero ME. Defibrotide: properties and clinical use of an old/new drug. Vascul Pharmacol. 2013;59(1–2):1–10. doi:10.1016/j.vph.2013.05.001
44. Khan FA, Maalik A, Iqbal Z, Malik I. Recent pharmacological developments in β-carboline alkaloid “harmaline”. Eur J Pharmacol. 2013;721(1–3):391–394. doi:10.1016/j.ejphar.2013.05.003
45. Seabrooks L, Hu L. Insects: an underrepresented resource for the discovery of biologically active natural products. Acta Pharmaceutica Sinica B. 2017;7(4):409–426. doi:10.1016/j.apsb.2017.05.001
46. Eguchi K, Fujiwara Y, Hayashida A, et al. a marine-derived alkaloid, inhibits accumulation of cholesterol ester in macrophages and suppresses hyperlipidemia and atherosclerosis in vivo. Bioorg Med Chem. 2013;21(13):3831–3838. doi:10.1016/j.bmc.2013.04.025
47. Wang M, Rakesh KP, Leng J, et al. Amino acids/peptides conjugated heterocycles: A tool for the recent development of novel therapeutic agents. Bioorg Chem. 2018;76:113–129. doi:10.1016/j.bioorg.2017.11.007
48. Hosseinkhani H, Hosseinkhani M, Khademhosseini A, Kobayashi H, Tabata Y. Enhanced angiogenesis through controlled release of basic fibroblast growth factor from peptide amphiphile for tissue regeneration. Biomaterials. 2006;27(34):5836–5844. doi:10.1016/j.biomaterials.2006.08.003
49. Hosseinkhani H, Hiraoka Y, Li CH, et al. Engineering three-dimensional collagen-IKVAV matrixto mimic neural microenvironment. ACS Chem Neurosci. 2013;4(8):1229–1235. doi:10.1021/cn4000082
50. Jun Kameoka SSV, Liu H, And DAC, Craighead HG. Fabrication of suspended silica glass nanofibers from polymeric materials using as canned electrospinning source. Nano Lett. 2004;4(11):2105–2108. doi:10.1021/nl048840p
51. Gao S, Han L, Zhu L, et al. One-step integration of multiple genes into the oleaginous yeast Yarrowia lipolytica. Biotechnol Lett. 2014;36(12):2523. doi:10.1007/s10529-014-1634-y
52. Li Z, Huang F, Wu JH, et al. Heptapeptide-based modification leading to enhancing the action of MTCA on activated platelets, P-selectin, GPIIb/IIIa. Future Medicinal Chemistry. 2018; 10(16): 1957–1970. doi:10.4155/fmc-2018-0055
53. Wu JH, Zhu HM, Yang GD, et al. Design and synthesis of nano-scaled IQCA-TAVV as a delivery capable of anti- platelet activation, targeting arterial thrombus and releasing IQCA. Int J Nanomed. 2018;13:1139–1158. doi:10.2147/IJN.S150205
54. Wu JH, Zhu HM, Zhao M, et al. IQCA-TASS: A nano-scaled P-selectin inhibitor capable of targeting thrombus and releasing IQCA/TARGD(S)S in vivo. J Mater Chem B. 2017;5:917–927. doi:10.1039/C6TB02705A
55. Ma HP, Zhao M, Wang YJ, et al. Cholyl-L-Lysine-carboxyl butyryl adriamycin produgs targeting chemically induced liver injury. J Mater Chem B. 2017;5:470–478. doi:10.1039/C6TB02205G
56. Fujita Y, Mie M, Kobatake E. Construction of nanoscale protein particle using temperature-sensitive elastin-like peptide and polyaspartic acid chain. Biomaterials. 2009;30:3450–3457. doi:10.1016/j.biomaterials.2009.03.012
 © 2019 The Author(s). This work is published and licensed by Dove Medical Press Limited. The full terms of this license are available at https://www.dovepress.com/terms.php and incorporate the Creative Commons Attribution - Non Commercial (unported, v3.0) License.
By accessing the work you hereby accept the Terms. Non-commercial uses of the work are permitted without any further permission from Dove Medical Press Limited, provided the work is properly attributed. For permission for commercial use of this work, please see paragraphs 4.2 and 5 of our Terms.
© 2019 The Author(s). This work is published and licensed by Dove Medical Press Limited. The full terms of this license are available at https://www.dovepress.com/terms.php and incorporate the Creative Commons Attribution - Non Commercial (unported, v3.0) License.
By accessing the work you hereby accept the Terms. Non-commercial uses of the work are permitted without any further permission from Dove Medical Press Limited, provided the work is properly attributed. For permission for commercial use of this work, please see paragraphs 4.2 and 5 of our Terms.