")
Back to Journals » International Journal of Nanomedicine » Volume 13
Nano-graphene oxide composite for in vivo imaging
Authors Jang SC, Kang S, Lee JY, Oh SY, Vilian ATE, Lee I, Han Y, Park JH, Cho WS , Roh C , Huh YS
Received 3 August 2017
Accepted for publication 11 September 2017
Published 3 January 2018 Volume 2018:13 Pages 221—234
DOI https://doi.org/10.2147/IJN.S148211
Checked for plagiarism Yes
Review by Single anonymous peer review
Peer reviewer comments 2
Editor who approved publication: Professor Israel (Rudi) Rubinstein
Sung-Chan Jang,1,2,* Sung-Min Kang,1,* Jun Young Lee,3,* Seo Yeong Oh,1 AT Ezhil Vilian,4 Ilsong Lee,1,2 Young-Kyu Han,4 Jeong Hoon Park,3 Wan-Seob Cho,5,* Changhyun Roh,2,6 Yun Suk Huh1
1Department of Biological Engineering, Biohybrid Systems Research Center (BSRC), Inha University, Incheon, 2Biotechnology Research Division, 3Radiation Instrumentation Research Division, Advanced Radiation Technology Institute (ARTI), Korea Atomic Energy Research Institute (KAERI), Jeongeup, 4Department of Energy and Materials Engineering, Dongguk University, Seoul, 5Laboratory of Toxicology, Department of Medicinal Biotechnology, College of Health Sciences, Dong-A University, Busan, 6Radiation Biotechnology and Applied Radioisotope Science, University of Science and Technology (UST), Daejeon, Republic of Korea
*These authors contributed equally to this work
Introduction: Positron emission tomography (PET) tracers has the potential to revolutionize cancer imaging and diagnosis. PET tracers offer non-invasive quantitative imaging in biotechnology and biomedical applications, but it requires radioisotopes as radioactive imaging tracers or radiopharmaceuticals.
Method: This paper reports the synthesis of 18F-nGO-PEG by covalently functionalizing PEG with nano-graphene oxide, and its excellent stability in physiological solutions. Using a green synthesis route, nGO is then functionalized with a biocompatible PEG polymer to acquire high stability in PBS and DMEM.
Results and discussion: The radiochemical safety of 18F-nGO-PEG was measured by a reactive oxygen species and cell viability test. The biodistribution of 18F-nGO-PEG could be observed easily by PET, which suggested the significantly high sensitivity tumor uptake of 18F-nGO-PEG and in a tumor bearing CT-26 mouse compared to the control. 18F-nGO-PEG was applied successfully as an efficient radiotracer or drug agent in vivo using PET imaging. This article is expected to assist many researchers in the fabrication of 18F-labeled graphene-based bio-conjugates with high reproducibility for applications in the biomedicine field.
Keywords: graphene oxide, nanocomposite, imaging, radiotracer
Introduction
Cancer is a leading cause of death and remains a great challenge to global health care.1 Mortality, however, has decreased, owing to a better understanding of cancer biology, improved diagnostic methods, and early detection of cancer through screening based on imaging.2 Cancer imaging forms an essential part of cancer clinical protocols and can provide morphological, structural, metabolic, and functional information. The imaging of specific tumor targets that are associated with cancer should allow earlier diagnosis and better management of oncology patients.3
Positron-emission tomography (PET) is a highly sensitive noninvasive technology that is ideally suited for preclinical and clinical imaging of cancer biology, in contrast to anatomical approaches. The technique is a noninvasive quantitative imaging technology that can monitor presymptomatic biochemical events early in the course of a disease3–5 and improve disease detection, therapeutic monitoring, and treatment efficacy.6 The high sensitivity of the PET technique also makes it suitable for addressing questions fundamental to drug development for oncology, cardiology, neurosciences, and inflammatory diseases.7 PET is a powerful clinical imaging technique that is widely used for diagnostic applications in clinical oncology, owing to its unrivalled sensitivity and quantitative accuracy.3
PET radiotracers have been used to quantify biochemical processes in cancer patients and to fabricate bioactive molecules tagged with short-lived positron-emitting radionuclides, such as 18F (half-life [t½] 110 minutes), 11C (t½ 20 minutes), and 64Cu (t½ 12.7 hours).4,8,9 However, the limited t½ of such radiotracers (typically only a few hours) necessitates dose-on-demand production at manufacturing sites in close proximity to the PET scanners. Therefore, the synthesis of PET radiotracers does not fit the typical drug-manufacturing paradigm. To address this, regulations specifically governing the current good manufacturing practice of PET radiotracers have been developed in recent years.10–12 To achieve the best contrast for PET imaging, several key issues need to be taken into consideration, such as how to choose the appropriate isotopes as positron emitters and nanoparticles as radiotracers, what chemical reactions can be utilized to improve the labeling efficiency, and how to functionalize the nanoparticles.13
Nanomaterials have unique properties, and have attracted considerable interest in biomedical applications. Nanomaterials with diameters of 10–100 nm can be extravasated through the endothelial cell layers and interact with cell structures of various tissues, due to the enhanced permeability and retention (EPR) effect.13 General features of tumors include leaky blood vessels and poor lymphatic drainage. While imaging tracers may diffuse non-specifically, a radiotracer can extravagate into tumor tissue via the leaky vessels by the EPR effect.14,15 The size of the nanomaterials suggests that the threshold vesicle size for extravasation into tumors is ~400 nm.16 Many researchers have shown that particles with diameters <200 nm are more effective.16–18 In addition, the large surface area:volume ratio renders nanoparticles with the ability to be readily loaded with a variety of diagnostic and/or therapeutic agents as theranostics for disease detection and treatment.14
Traditional chelation methods have been used to incorporate various radionuclides on a radiotracer, but these methods are compromised by the potential for the loss of the radionuclide, due to cleavage of the linker between the particle and the chelator, decomplexation of the metal, and possible altered pharmacokinetics of the nanomaterials. This methodology, however, creates some concerns for in vivo diagnostic imaging. First, the radiometal chelator attached to nanomaterials might alter the physicochemical properties of the nanomaterials. Second, the radiometal chelator moiety may dissociate from the surface of the nanomaterials through either dissociation of the ligand from the metal core or transchelation of the metal into biological fluids, which could cause a mismatch in location between radionuclides and nanomaterials. Third, conjugation is challenging when the original surface is not conjugation-friendly. These strategies suffer from either a lack of operational simplicity or broad applicability, which has hampered translational studies and the rapid progress of PET imaging.
Functionalized graphene oxide (GO; 2-D)-based nanocomposites have attracted attention in biomedical applications in recent years, because of their unique and highly enriched physical and chemical properties,19–25 such as excellent biocompatibility, ready cellular uptake, flexible chemical modifications, unique optical properties, and thermal and electrical conductivity. In recent years, graphene-based nanomaterials have also attracted significant interest in biological fields, such as biomedicine, biosensors, drug delivery and bioimaging.
This paper describes the straightforward synthesis of intrinsically radioactive fluorinated labeled nano-GO (18F-nGO–polyethylene glycol [PEG]) by directly incorporating 18F into an nGO-PEG nanostructure with nGO-PEG as the precursor. 18F-nGO-PEG was simply synthesized by mixing GO with 18F ions to form intrinsically radiolabeled GO without the assistance of any chelators. Due to its versatile surface functionalization and high surface area, nGO can be easily functionalized by small molecules, nanoparticles, or drugs to obtain graphene-based nanomaterials for bioimaging applications. Therefore, it is important to develop reliable, chelator-free, intrinsically radioactive 18F-nGO-PEG for in vivo imaging. The functionalized nanomaterial can also be used for potential drug-delivery applications. 18F-nGO-PEG has solved the problems of aggregation of particles and loss of radioactivity previously encountered with graphene-based nanomaterials kept in physiological buffer or inserted into animals. This study demonstrates that PEGylated nGO can act as an excellent biocompatible radiotracer for loading imaging molecules, and may become a great platform to realize the imaging of tumor cells. 18F-nGO-PEG was injected subcutaneously into living animals, and excellent detection sensitivity and multicolor capability were achieved. These results offer an innovative development in ultrasensitive detection of 18F-nGO-PEG tumor uptake and the tumor imaging of biomarkers involved in cancer.
Materials and methods
Nanosized graphite powder (Nano G-400) was obtained from Graphene Supermarket (Calverton, NY, USA). PEG (six-armed PEG-NH2, 10 kDa) was obtained from SunBio (Gunpo, Republic of Korea). Potassium persulfate, phosphorous pentoxide, potassium permanganate, ferrous sulfate, potassium ferrocyanide, sulfuric acid, hydrochloric acid, hydrofluoric acid, trifluoroacetic acid (TFA), sodium hydroxide, 2′7′-dichlorofluorescein diacetate (DCF-DA), and ethyl(dimethylaminopropyl) carbodiimide (EDC) were purchased from Sigma-Aldrich (St Louis, MO, USA). 1-Chloro-2,2,2-trifluoroethyl difluoromethyl ether (isoflurane) was supplied by Terrell.
Characterization of nGO, nGO-PEG, and F-nGO-PEG
Field-emission transmission electron microscopy (TEM; JEM-2100F; JEOL, Tokyo, Japan) was performed at an accelerating voltage of 300 kV. Ultraviolet (UV)-visible spectra were recorded on a Jasco V-770. Fourier-transform infrared (FT-IR) spectra were recorded using a Jasco FT/IR-6600. X-ray diffraction (XRD; D/Max-2500; Rigaku, Tokyo, Japan) patterns were collected using CuKα radiation. X-ray photoelectron spectroscopy (K-Alpha; Thermo Fisher Scientific, Waltham, MA, USA) was performed using an Al X-ray source. Thin-layer chromatography (TLC) was performed on silica-gel 60 F254 glass plates purchased from Merck Millipore (Billerica, MA, USA). PET images were taken using micro-PET (Genesys4; Sofie Biosciences, Culver City, CA, USA).
Synthesis and functionalization of nGO, nGO-PEG, and F-nGO-PEG
Chemical exfoliation of nGO was achieved using the modified Hummers method. Chemical exfoliated nGO (10 mg) was dispersed in 1 mL water. Subsequently, 1.8 g NaOH was added to the nGO solution and the mixture heated at 55°C for 4 hours. A 37% (v:v) HCl solution (4 mL) was then added to the solution to neutralize the NaOH. The product was washed four times with deionized (DI) water to remove the salt. The as-obtained product was washed using centrifugation at 13,000 rpm for 10 minutes. PEG-NH2 (50 mg) was added to the base-treated nGO solution (10 mg/mL and 5 mL) in a 25 mL vial. The suspension was sonicated vigorously in a water bath at room temperature for 15 minutes, and 10 mg EDC was added as a catalyst. The solution was sonicated for 30 minutes at room temperature, and another 10 mg EDC was then added. Subsequently, the mixture solution was stirred overnight at room temperature. The final mixture solution was washed five or six times by repeating the centrifuging and water-addition steps, to completely remove the excess PEG and EDC in the obtained nGO-PEG solution. The 10 mg/mL nGO-PEG suspension (1 mL) was treated in a glass vial on a hotplate at 80°C for 1 hour. A 100 μL solution of hydrofluoric acid was also added to make acidic conditions. The resulting mixture was left to stand at 80°C for 1 hour. The mixture was rinsed with DI water. F-nGO-PEG was obtained for further analysis.
Toxicity assays
ROS test
To make the reactive oxygen species (ROS) test solution, in the DCFH assay 100 μL of DCFH-DA was hydrolyzed chemically to DCFH with 4 mL 0.01 N NaOH for 30 minutes in a darkroom. After adding 20 mL PBS for neutralization, 100 μL nGO and nGO-PEG each were placed separately into 100 μL HRP (2.9 unit/mL) and 100 μL of neutralized DCF-DA. The mixtures were then incubated for 15 minutes in a darkroom. The samples were then centrifuged at 13,000 rpm for 15 minutes. The supernatant fraction was dispensed in 200 μL per well of 96 wells. Absorbance was measured at 485 nm using a microplate reader.26 A blank (no nanomaterial added) and a positive control (H2O2) were used in the assay, both in triplicate. The fluorescence values obtained for the nanomaterial were converted to H2O2 equivalents against a calibration curve of H2O2 in the range of 0–9 μM of H2O2, with r2=0.98. The conversion of arbitrary fluorescence units to a biologically meaningful ROS value is desirable, and one approach used for the nanomaterial was converted to H2O2 equivalents. Because H2O2 cannot oxidize DCFH independently, the enzyme HRP was added to catalyze the generation of OH radicals. Therefore, HRP was added only when H2O2 was used as a positive control and for the standards.
Cell lines
Human breast cancer MCF7 cells were cultured in RPMI 1640 medium supplemented with 10% FBS and L-glutamine. Mouse colon cancer CT26 cells were cultured in DMEM with 10% FBS, 4 mM L-glutamine, 4,500 mg/L glucose, and sodium pyruvate. All cancer cell lines were obtained from the Korean Cell Line Bank (Seoul, Republic of Korea) and maintained at 37°C in a humidified atmosphere containing 5% CO2.
In vitro cytotoxicity assay
The MCF7 cell suspension (2 mL) was dispensed in a 24-well plate (3.98×10⁴ cells/well). Subsequently, 200 μL of different concentrations (0, 1, 10, 20, 50 μg/mL) of nGO and nGO-PEG was added to 1,800 μL of the cell-culture media and incubated for 24 hours in a humidified incubator (at 37°C, 5% CO2). Following the nGO and nGO-PEG treatments, the cells were washed with PBS and treated with 10 μL of a CCK-8 solution and 2 mL of cell-culture media in each well of the plate. Cells were incubated for 3 hours in an incubator (at 37°C, 5% CO2). The supernatant fraction was dispensed at 200 μL per well in a 96-well plate. Absorbance was measured at 450 nm using a microplate reader.
Cell-uptake test
Levels of 18F-nGO-PEG expression in two different human cancer cell lines (MCF7) and a mouse cancer cell line (CT26) were determined. Briefly, 18F-nGO-PEG uptake was measured by incubating the cells with approximately 5 μCi 18F-nGO-PEG in 2 mL serum-free medium at 37°C for 15–120 minutes. After incubation, cells were quickly washed twice with 2 mL cold PBS. Cells were detached with 200 μL of 1% sodium dodecyl sulfate and radioactivity measured using a γ-counter. 18F-nGO-PEG uptake was expressed as percentage injected dose.27
Radiolabeling of nGO-PEG with 18F
nGO-PEG was labeled with the 18F radionuclide (obtained RFT-30 MeV Cyclotron facility at the Korea Atomic Energy Research Institute, Jeongeup, Republic of Korea using a standard chloramine-T oxidation method. In recent years, the 18O(p,n)18F reaction on highly enriched 18O targets (both gaseous and H218O) has been used extensively.28 The 18F radioisotope (t½ 109.7 minutes; Iβ+ 97%; Eβ+ 0.63 MeV) is produced in a cyclotron via the 18O(p,n)18F nuclear reaction by bombarding 18O water with a high-energy proton beam, which is then delivered to the radiochemistry laboratory in a solution of 18O water to conduct the radiochemical reactions. Briefly, 100 μCi 18F and 0.1 mL trifluoroacetic acid were added to a solution of nGO-PEG (1 mg/mL, 1 mL). The mixture was then reacted in a pH 5.5 trifluoroacetic acid solution (10%) for 1 hour at 80°C to make an acidic condition. Excess 18F was removed by centrifugation filtration through the filters (0.2 μm) washing several times with a saline solution until there was no detectable radioactivity in the filtration solution. For the radiolabeling stability assay, 1 mL obtained 18F-nGO-PEG (1 mg/mL) was taken. The leftover 18F-nGO-PEG after washing was collected for γ-counting to measure the amount of 18F retained on the nGO-PEG nanoparticles.
Preparation for in vivo experiment and PET imaging
Immediately before transfection, the serum-containing medium was removed and replaced with PBS. The CT26 tumors were grown in the right thighs of nude mice (20–25 g) by injecting 107 tumor cells suspended in 100 μL PBS subcutaneously. When the tumors had grown to 10–15 mm in diameter (Figure S1), the tumor-bearing mice were injected intravenously with 100 μL 18F-nGO-PEG or 18F solution >100 μCi for PET scanning, and X-ray imaging was performed at different time points postinjection. All animal studies were conducted in compliance with animal experimental guidelines, and ethics approval was obtained from the Korea Atomic Energy Research Institute (IACUC-2015-004).
Results and discussion
Radiolabeling of nGO-PEG with 18F
Figure 1 shows a homogeneous dispersion of nGO-PEG in a solution synthesized directly from nGO using a polymeric surfactant (PEG). In this study, nGO was functionalized with PEG to improve the dispersion and their physiological stability.29,30 Carboxyl functional groups on nGO were conjugated covalently with amine-terminated PEG (10 kDa) and N-(3-dimethylaminopropyl)-N′-ethylcarbodiimide (EDC) hydrochloride. This is the most commonly used approach in our group to prepare small PEGylated nGO (50–100 nm) (Figure 1A and B).30 Compared to GO, nGO-PEG was much smaller, owing to ultrasonication involved during the PEG-conjugation step, which greatly breaks down the nanosheets. The GO surface contains oxygen functional groups (carboxyl and hydroxyl groups) bound to the radiohalide via a chemical reaction without a chelator, which was to be used as an excellent radiotracer (Figure S2). The resulting nGO-PEG exhibited excellent stability in various physiological solutions, including DI water, PBS, and cell medium. In this labeling method, 18F atoms were anchored to the defect sites or edges of the nGO-PEG sheet (Figure 1C). 18F was introduced to nGO-PEG, which can oxidize fluorine ions to F atoms to attack oxygen groups on the graphene surface via a chemical reaction. 18F has been applied widely in the PET imaging of in vivo tumor cells, because it is a γ-ray emitter. The 18F-labeled nGO-PEG exhibited a high radiolabeling yield, as well as great radiolabeling stability in an aqueous solution at room temperature. As such, the radionuclide 18F was introduced to label nGO-PEG via chemical reaction with both high efficiency and stability.
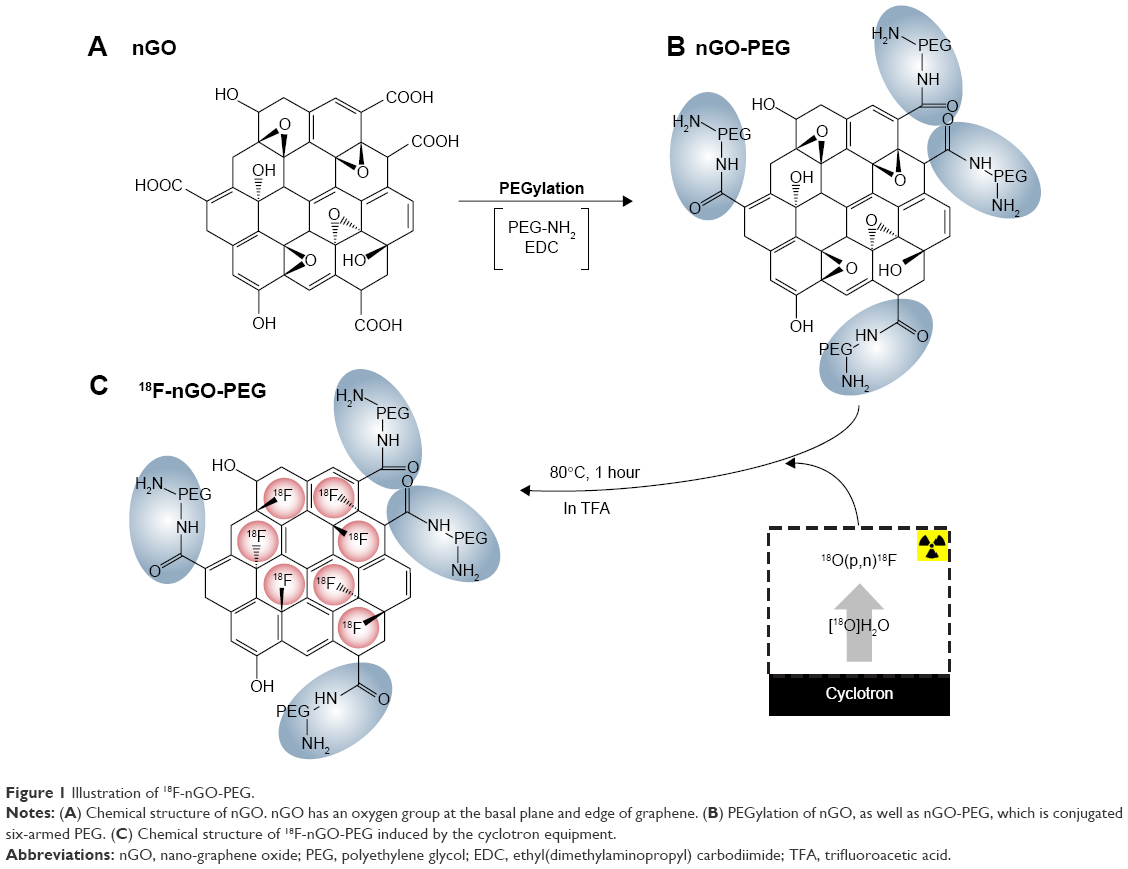 | Figure 1 Illustration of 18F-nGO-PEG. |
Studying the reaction of nGO with PEG
TEM was used to reveal the morphological characteristics of nGO and nGO-PEG. From the TEM image (Figure 2), nGO exhibited the wrinkled paper-like structure of graphene sheets with diameters of ~50–100 nm (Figure 2A and B). On the other hand, nGO-PEG revealed uniform disk morphology with a mean diameter of ~100 nm (Figure 2C and D). The as-obtained nGO-PEG showed amine-terminated PEG adsorbed on the surface of nGO.
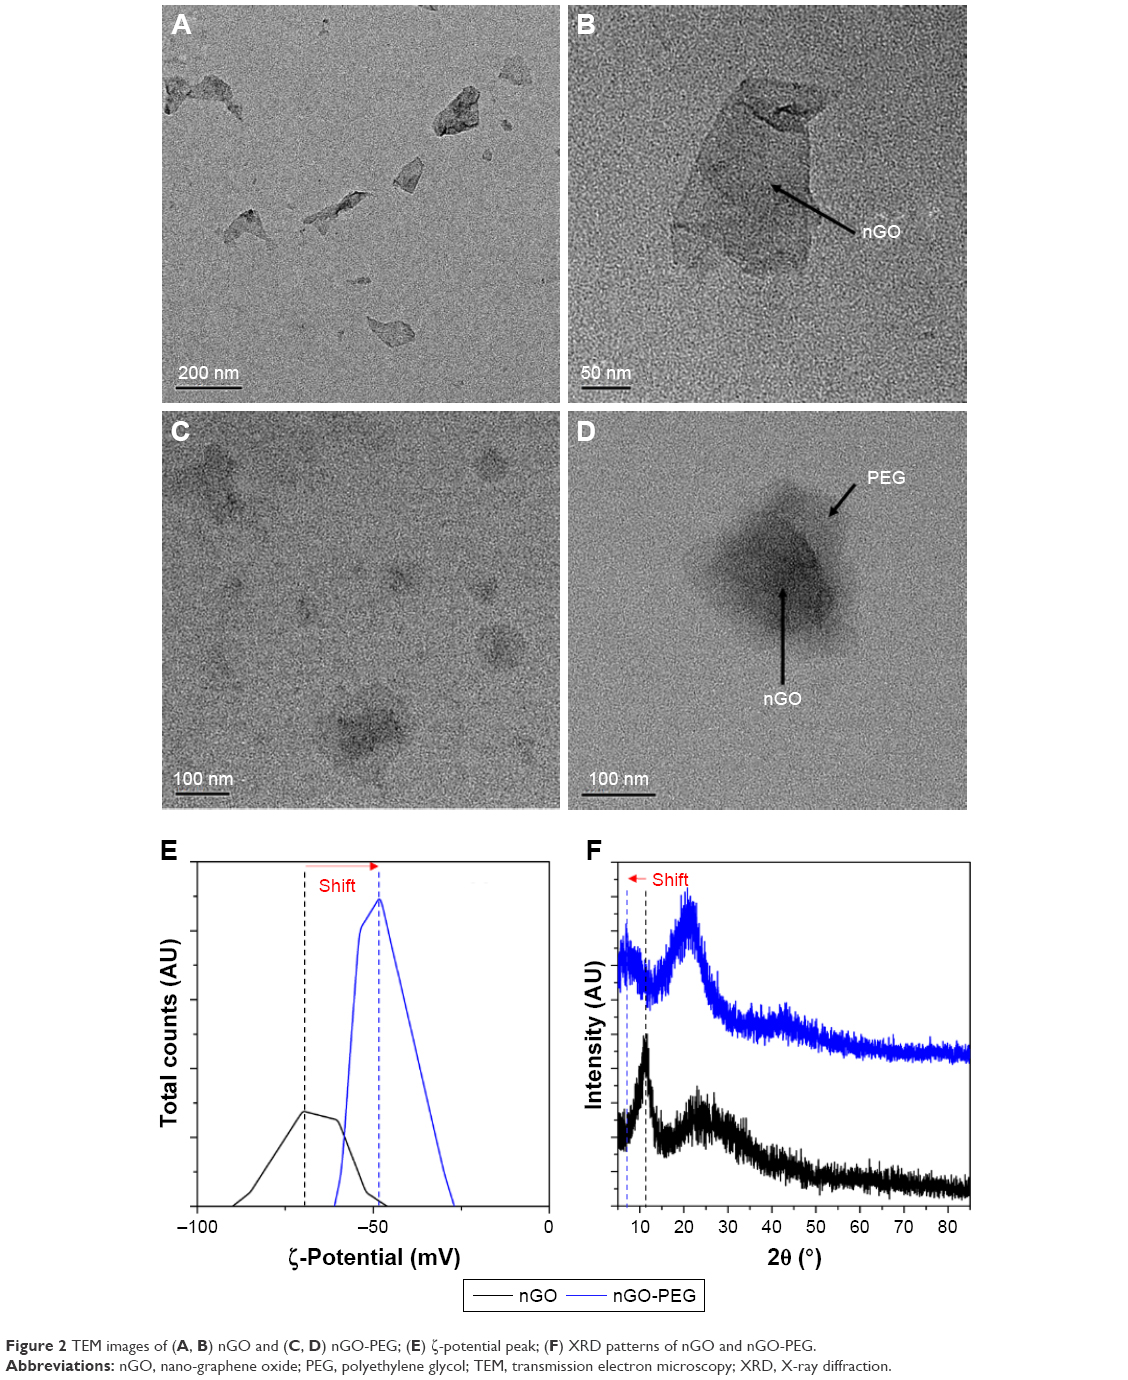 | Figure 2 TEM images of (A, B) nGO and (C, D) nGO-PEG; (E) ζ-potential peak; (F) XRD patterns of nGO and nGO-PEG. |
nGO-PEG fabricated from nGO was used to measure surface-charge changes using ζ-potential. Initially, the nGO ζ-potential change was −70 mV. This suggests that nGO has a negative charge on the surface, because nGO has a number of oxygen functional groups on the surface. After PEGylation on the nGO surface, the charge was −48 mV, which shows that the amine-terminated nGO had shifted to the positively charged direction on the final product surface (Figure 2E). The more positively charged nGO-PEG might be favorable as an anionic growth factor in bioimaging and drug carriers for delivery applications. The phase and crystal structure of nGO-PEG were characterized by XRD. The XRD pattern of nGO prepared revealed a broad reflection at 11.521°, which can be assigned to the (002) reflection of nGO (Figure 2F). The broad XRD peaks of PEG on the nGO sheet suggested that the (002)-diffraction peak shifted to a lower angle with PEG on the surface of the nGO sheets. These results suggest that the interlayer spacing becomes larger with the addition of PEG decorated on the nGO sheets. These results strongly suggest successful conjugation of PEG onto nGO.
Stability studies in physiological media and viability assay
The radiochemical stability of nGO and nGO-PEG was studied in various media, including PBS (pH 7.4) and cell-culture media. nGO-PEG was soluble in DI water, while nGO was not dispersed in PBS or DMEM.31 Therefore, nGO aggregated and precipitated in the presence of salts in the bottom of the DI water, PBS, and DMEM (Figure 3A). On the other hand, the biocompatibility of the amine-functionalized nGO-PEG was utilized. Hydrophilic PEG chains can improve nanomaterial stability in many biological solutions. This might be because amine-terminated PEG shows covalent binding to carboxylic acid groups on nGO, due to PEG being soluble in DI water, PBS, and DMEM. Among the different solvents tested, nGO in the presence of PEG was the best nanomaterial for use in PET imaging (Figure 3B). UV-visible spectra of nGO and nGO-PEG in DMEM were measured to confirm stability. The black lines indicated the initial state, and red lines were shown after centrifuge. This stability clearly suggests that nGO-PEG can be dispersed in biological environments (Figure 3C). This study is expected to help scientists in this field assemble nGO-PEG nanomaterials with high reproducibility for numerous applications in biomedicine and biotechnology.
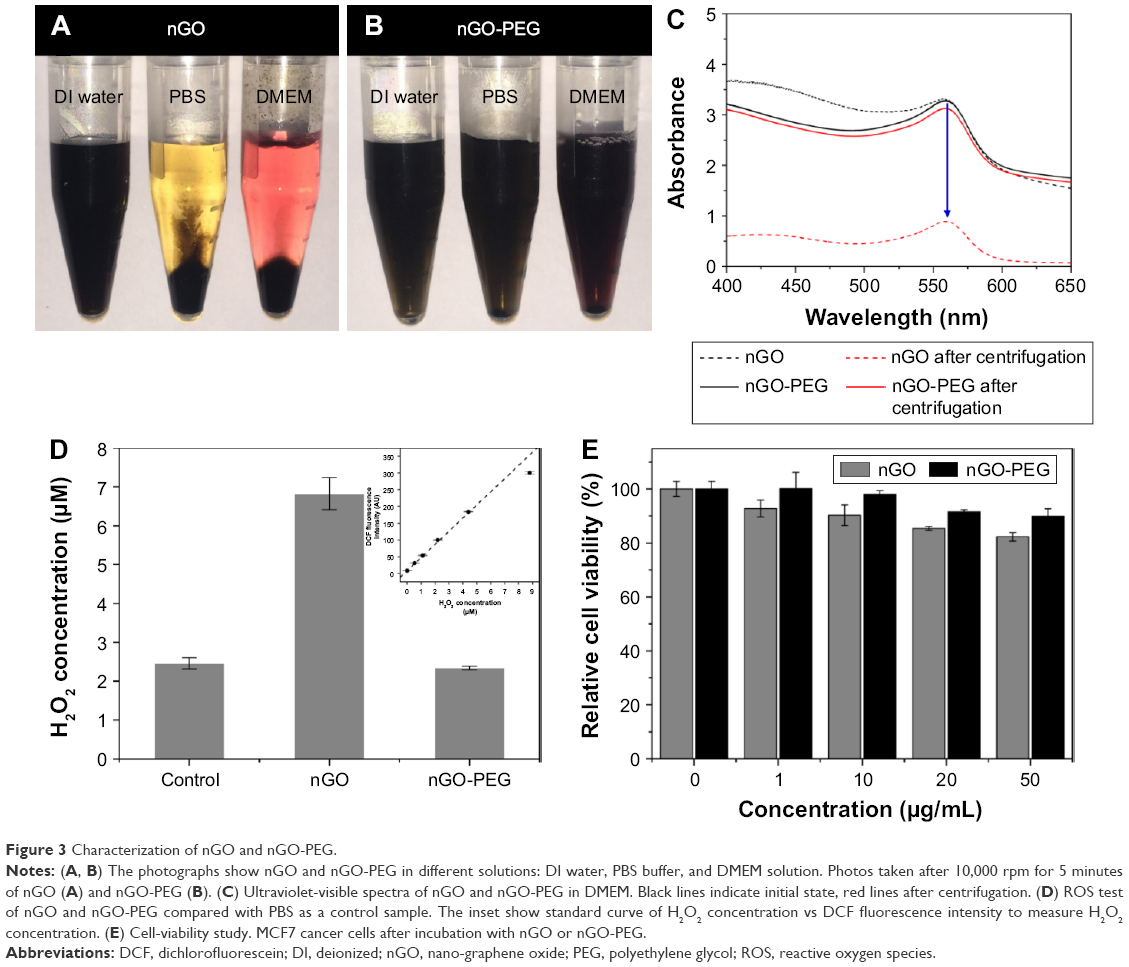 | Figure 3 Characterization of nGO and nGO-PEG. |
Toxicity of nGO-PEG in vitro
This study investigated the ability of nGO-PEG to induce the formation of intracellular ROS by monitoring the increasing fluorescence of DCF-DA. Figure 3D shows ROS levels after exposure to nGO and nGO-PEG for 2 hours relative to the untreated control. nGO showed a 2.6-fold increase in ROS relative to the controls. nGO-PEG did not induce detectable ROS formation compared to the untreated control.
The cytotoxicity of the nGO and nGO-PEG on breast cancer cells (MCF7) was examined by MTT (CCK-8). The MCF7 cells were incubated with nGO and nGO-PEG in a CO2 incubator for 24 hours. nGO-PEG significantly suppressed the proliferation of breast cancer cells, while no cytotoxicity was detected at high concentrations of nGO and nGO-PEG (Figure 3E). Interestingly, no obvious cytotoxicity appeared after 24 hours of exposure of the animal cells to a high concentration (50 μg/mL) of nGO-PEG in CCK-8. Interestingly, these results showed that nGO has higher cytotoxicity than nGO-PEG. Finally, nGO-PEG was used as a drug carrier to test cellular biocompatibility.
Measurements of F concentration on nGO-PEG
The chemical structure of the interactions between F and nGO-PEG surfaces was monitored by FT-IR spectroscopy (Figure 4A). The FT-IR spectrum of nGO showed peaks for hydroxy stretching (O−H, 3,429 cm−1), C=O stretching (carbonyl or carboxyl, 1,705 cm−1), aromatic C=C stretching (1,624 cm−1), carboxy C–O stretching (1,397 cm−1), epoxy C−O stretching (1,192 cm−1), and alkoxy C−O stretching (1,058 cm−1) as shown in black. In the red curve, the much-smaller peak at 3,429 cm−1 was because of the absence of O−H bonds after F substitution; the new peak at 2,850 cm−1 may have been due to amine bonds related to PEG-NH2. The characteristic absorption peak at 1,093 cm−1 was assigned to the vibrations of the C−F band of the F functional group bound to the edge of the nGO-PEG surface (Figure 4B). Finally, this study confirmed that before-and-after F functionalization of the nGO-PEG successfully made up the effective attached F on the surface of nGO-PEG radiotracers.
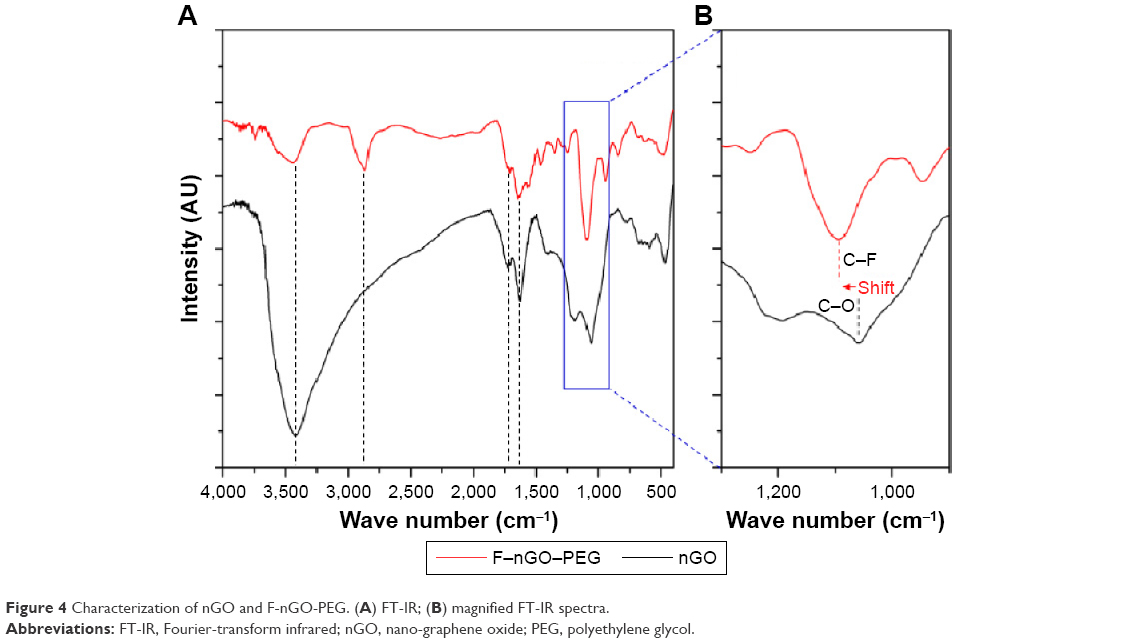 | Figure 4 Characterization of nGO and F-nGO-PEG. (A) FT-IR; (B) magnified FT-IR spectra. |
The chemical composition of fluorinated nGO and nGO-PEG materials was examined by X-ray photoelectron spectroscopy (Figure 5). The full-scan survey spectrum of F-nGO-PEG contained fluorine (F1s), carbon (C1s), and oxygen (O1s). The F1s peak intensity diminished gradually in nGO, while the C1s peak intensity increased considerably. These results show chemical exfoliation of graphite to nGO, and that the amount of fluorine diminished. The F-nGO-PEG radiotracers showed an F1s peak at approximately 725 eV, indicating the chemical content of fluorine on the radiotracer surface.
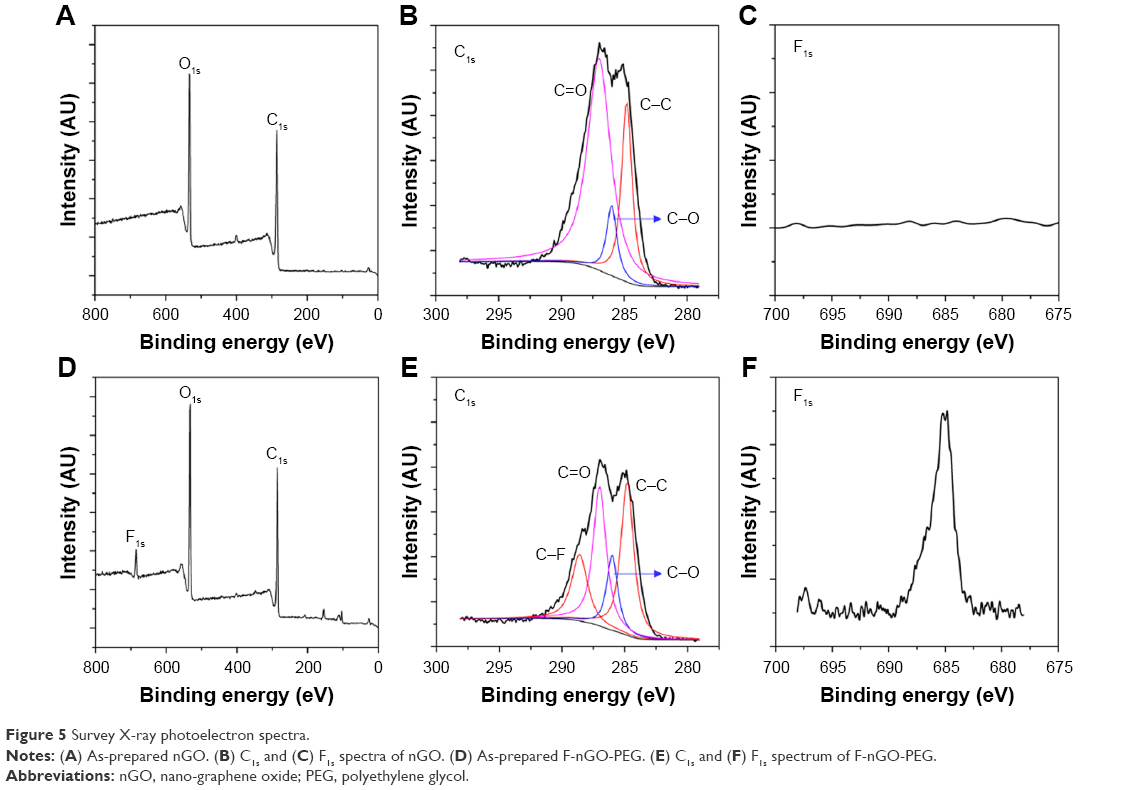 | Figure 5 Survey X-ray photoelectron spectra. |
Radio-TLC to measure radioactivity of radiolabeled nGO-PEG
The labeling reaction was monitored by radio-TLC (EtOAc:n-hexane 1:1). The radiolabeling yield of 18F-nGO-PEG was then determined at different time intervals using radio-TLC, where 18F-nGO-PEG (RF=0 mm) could be distinguished easily from free 18F (RF≈90 mm). The radiolabeling yield of 18F-nGO-PEG was >96.06% after 1 hour’s incubation, confirming the successful labeling of 18F to nGO-PEG (Figure 6A).
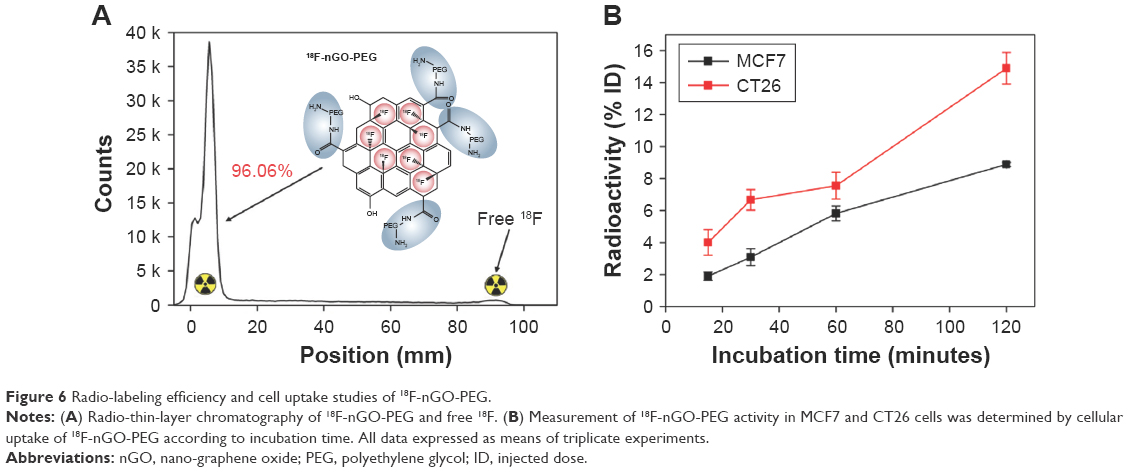 | Figure 6 Radio-labeling efficiency and cell uptake studies of 18F-nGO-PEG. |
Cell-uptake studies
To investigate in vitro cell-uptake behavior of 18F-nGO-PEG, MCF7 and CT26 cancer cells were incubated in the presence of nGO-PEG. After cells had been incubated with 18F-nGO-PEG for 120 minutes, remarkably increased cell uptake was observed (Figure 6B). For cancer cells, such as MCF7 and CT26, similar uptake behavior was observed. This demonstrated that the uptake seemed to be cancer-cell type-independent.
PET-imaging studies
Here, 18F-nGO-PEG (100 μCi per mouse) was administered intravenously into the mice and bioimaging performed using the micro-PET system (Genesys4). The free 18F-treated mice and 18F-nGO-treated mice were used as the control (Figures S3 and S4). It seemed that free 18F and 18F-nGO show PET signal in vivo biodistribution profile, with high uptake in the bladder, blood, lungs, and main vessels. No signal was observed in tumor cells under in vivo conditions. 18F-nGO-PEG was then injected intravenously into the female mice, and the image was monitored at various time points (15, 30, and 60 minutes) (Figure S5). After 15 minutes, an intact 18F-nGO-PEG tumor and bioimaging of the tumor cell were monitored (Figure 7). 18F-nGO-PEG accumulated passively in the tumor via the enhanced cell-EPR effect (Figure 7A). 18F-nGO-PEG was taken up rapidly into the early endosomes and lysosomes of CT26 tumor cells. Subsequently, 18F-nGO-PEG was injected into the tail veins of the mice and rapidly accumulated in endolysosomal compartments in vivo. Micro-PET imaging studies (Figure 7B) showed tumor-imaging signals in an in vivo biodistribution profile, with high uptake in tumor cells in the right thighs of the nude mice. A strong PET signal was observed at the tumor site, indicating efficient formation of 18F-nGO-PEG. The clear tumor image appeared within 15 minutes postinjection, suggesting that 18F-nGO-PEG accumulated rapidly in tumors through the EPR effect. Commonly, a nanomaterial (10–100 nm) can extravasate through the endothelial cell layers and interact with the cell structures of various tissues due to the EPR effect. The as-prepared 18F-nGO-PEG offers a large surface area, which can be loaded easily with a large amount of drugs with a variety of diagnostic and/or therapeutic agents as theranostics for disease detection and treatment. 18F-nGO-PEG accumulated specifically in CT26 tumor-bearing mice via the EPR effect.
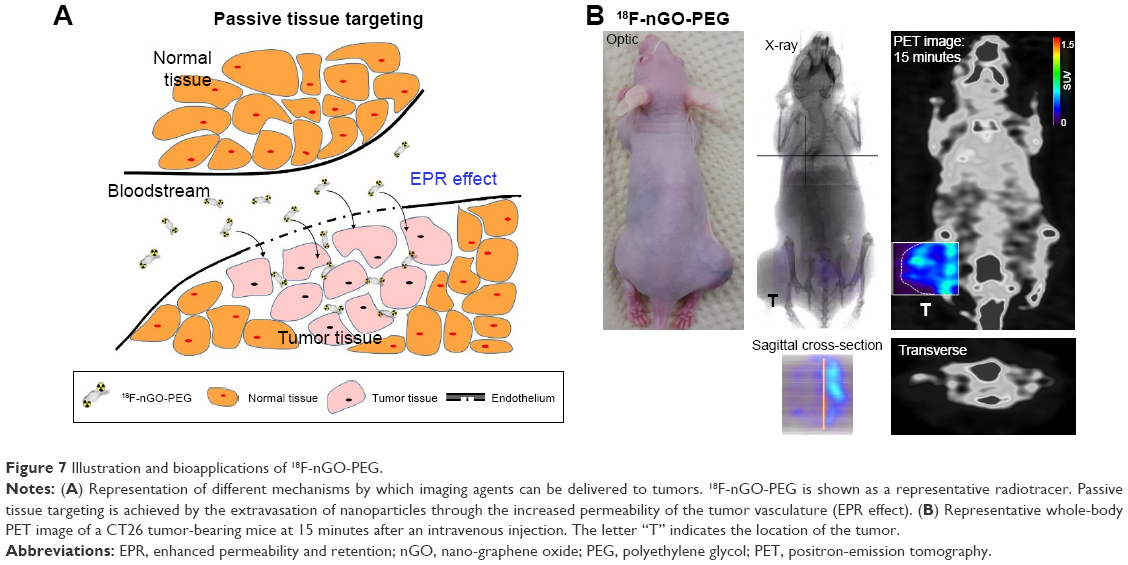 | Figure 7 Illustration and bioapplications of 18F-nGO-PEG. |
An index commonly used in clinical practice is the standardized uptake value (SUV), a normalized measure of radioactivity concentration. The SUV is now probably the most widely used method for the quantification of PET studies. The SUV represents the 18F-nGO-PEG uptake within a tumor. SUV is defined in the equation:
|
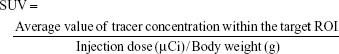
where the radioactivity concentration is taken from a region of interest (tissue) on the PET image. SUVs obtained by tracers were calculated (Table 1). SUVs were obtained from tumor regions in PET images of free 18F, 18F-nGO, and 18F-nGO-PEG. 18F-nGO-PEG SUVs were significantly higher than Free 18F or 18F-nGO. Also, SUVs of free 18F and 18F-nGO decreased over time. However, our material (18F-nGO-PEG) showed no change in tumor uptake over time. Validation of SUVs obtained from 18F-nGO-PEG against those from free 18F and 18F-nGO provide evidence that PET imaging of 18F-nGO-PEG may also be helpful. This technology is expected to be useful for many scientists in improving their understanding or detection of early stages of tumors in the biomedical field.
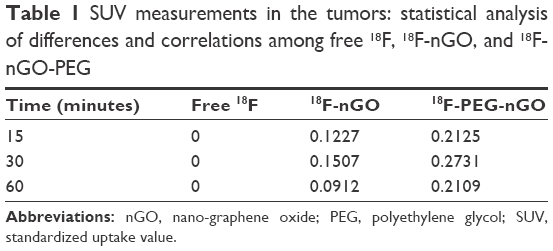 | Table 1 SUV measurements in the tumors: statistical analysis of differences and correlations among free 18F, 18F-nGO, and 18F-nGO-PEG |
Conclusion
This paper described a green approach for the fabrication of nGO-PEG by mixing nGO with PEG under basic pH conditions. The as-obtained PEGylated nGO radiotracer has excellent stability in PBS and cell medium because of its biocompatibility and outstanding membrane-forming capability of PEG. The cytotoxicity assay showed that nGO-PEG has excellent biocompatibility in animal cell lines. Based on the results, 18F-nGO-PEG is believed to be a potential radiopharmaceutical for detecting CT26 tumors and imaging tumors. The radiolabeled 18F is easily attached to the nGO-PEG surface, because it has a unique chemical structure and stability. The biocompatibility of nGO-PEG shows no obvious toxic effects on the cell. Based on this concept, radiolabeled 18F-nGO-PEG is a promising radiotracer for use in the effective detection of CT26 tumors and tracking of tumor cells through imaging. The as-assembled 18F-nGO-PEG suggests the possibility of accurate quantification, operational simplicity, lower-cost, rapid screening that is currently unachievable by PET imaging. For this approach, radiolabeling nGO-PEG could be a potential tool for the early detection of tumors and could be used extensively in drug-delivery, bioimaging, and biomedical applications.
Acknowledgments
This work was supported by the Radiation Fusion Technology Program (2015M2A2A6A02045262(3)) from the Nuclear Research R&D Program through the National Research Foundation of Korea (NRF), funded by the Ministry of Science and ICT, Republic of Korea. It was also partially supported from the Nuclear Research R&D Program (2015M2B2A4028536 and 2016M2B2A4912204) through the National Research Foundation of Korea (NRF), funded by the Ministry of Science and ICT, Republic of Korea. Special thanks is given to Dr Min Goo Hur, team leader of Cyclotron from Radiation Instrumentation Research Division and Dr Jin-Woo Lee from Safety Management Team, KAERI for their kind support in facility use.
Disclosure
The authors report no conflicts of interest in this work.
References
Jemal A, Bray F, Center MM, Ferlay J, Ward E, Forman D. Global cancer statistics. CA Cancer J Clin. 2011;61(2):69–90. | ||
Fass L. Imaging and cancer: a review. Mol Oncol. 2008;2(2):115–152. | ||
Servant A, Jacobs I, Bussy C, et al. Gadolinium-functionalised multi-walled carbon nanotubes as a T1 contrast agent for MRI cell labelling and tracking. Carbon. 2016;97:126–133. | ||
Phelps ME. Positron emission tomography provides molecular imaging of biological processes. Proc Natl Acad Sci U S A. 2000;97(16):9226–9233. | ||
Ametamey SM, Honer M, Schubiger PA. Molecular imaging with PET. Chem Rev. 2008;108(5):1501–1516. | ||
Weissleder R. Molecular imaging in cancer. Science. 2006;312(5777):1168–1171. | ||
Huiban M, Tredwell M, Mizuta S, et al. A broadly applicable [18F] trifluoromethylation of aryl and heteroaryl iodides for PET imaging. Nat Chem. 2013;5(11):941–944. | ||
Wang M, Gao M, Mock BH, et al. Synthesis of carbon-11 labeled fluorinated 2-arylbenzothiazoles as novel potential PET cancer imaging agents. Bioorg Med Chem. 2006;14(24):8599–8607. | ||
Gambhir SS. Molecular imaging of cancer with positron emission tomography. Nat Rev Cancer. 2002;2(9):683–693. | ||
Hong H, Zhang Y, Engle JW, et al. In vivo targeting and positron emission tomography imaging of tumor vasculature with 66Ga-labeled nano-graphene. Biomaterials. 2012;33(16):4147–4156. | ||
Sun X, Huang X, Yan X, et al. Chelator-free 64Cu-integrated gold nanomaterials for positron emission tomography imaging guided photothermal cancer therapy. ACS Nano. 2014;8(8):8438–8446. | ||
Choi JS, Park JC, Nah H, et al. A hybrid nanoparticle probe for dual-modality positron emission tomography and magnetic resonance imaging. Angew Chem Int Ed Engl. 2008;47(33):6259–6262. | ||
Peer D, Karp JM, Hong S, Farokhzad OC, Margalit R, Langer R. Nanocarriers as an emerging platform for cancer therapy. Nat Nanotechnol. 2007;2(12):751–760. | ||
Pham TN, Lengkeek NA, Greguric I, et al. Tunable and noncytotoxic PET/sPECT-MRI multimodality imaging probes using colloidally stable ligand-free superparamagnetic iron oxide nanoparticles. Int J Nanomedicine. 2017;12:899–909. | ||
Matsumura Y, Maeda H. A new concept for macromolecular therapeutics in cancer chemotherapy: mechanism of tumoritropic accumulation of proteins and the antitumor agent Smancs. Cancer Res. 1986;46(12 Pt 1):6387–6392. | ||
Yuan F, Dellian M, Fukumura D, et al. Vascular permeability in a human tumor xenograft: molecular size dependence and cutoff size. Cancer Res. 1995;55(17):3752–3756. | ||
Locatelli E, Gil L, Israel LL, et al. Biocompatible nanocomposite for PET/MRI hybrid imaging. Int J Nanomedicine. 2012;7:6021–6033. | ||
Torchilin VP. Recent advances with liposomes as pharmaceutical carriers. Nat Rev Drug Discov. 2005;4(2):145–160. | ||
Yang K, Li Y, Tan X, Peng R, Liu Z. Behavior and toxicity of graphene and its functionalized derivatives in biological systems. Small. 2013;9(9–10):1492–1503. | ||
Shen H, Zhang L, Liu M, Zhang Z. Biomedical applications of graphene. Theranostics. 2012;2(3):283–294. | ||
Zhang Y, Nayak TR, Hong H, Cai W. Graphene: a versatile nanoplatform for biomedical applications. Nanoscale. 2012;4(13):3833–3842. | ||
Feng L, Liu Z. Graphene in biomedicine: opportunities and challenges. Nanomedicine (Lond). 2011;6(2):317–324. | ||
Yang K, Feng L, Shi X, Liu Z. Nano-graphene in biomedicine: theranostic applications. Chem Soc Rev. 2013;42(2):530–547. | ||
Feng L, Wu L, Qu X. New horizons for diagnostics and therapeutic applications of graphene and graphene oxide. Adv Mater. 2013;25(2):168–186. | ||
Bitounis D, Ali-Boucetta H, Hong BH, Min DH, Kostarelos K. Prospects and challenges of graphene in biomedical applications. Adv Mater. 2013;25(16):2258–2268. | ||
Rastogi RP, Singh SP, Häder DP, Sinha RP. Detection of reactive oxygen species (ROS) by the oxidant-sensing probe 2′,7′-dichlorodihydrofluorescein diacetate in the cyanobacterium Anabaena variabilis PCC 7937. Biophys Res Commun. 2010;397(3):603–607. | ||
Kim KI, Jang SJ, Park JH, et al. Detection of increased 64Cu uptake by human copper transporter 1 gene overexpression using PET with 64CuCl2 in human breast cancer xenograft model. J Nucl Med. 2014;55(10):1692–1698. | ||
Hess E, Takács S, Scholten B, Tárkányi F, Coenen HH, Qaim SM. Excitation function of the 18O(p,n)18F nuclear reaction from threshold up to 30 MeV. Radiochim Acta. 2001;89(6):357–362. | ||
Zhang S, Yang K, Feng L, Liu Z. In vitro and in vivo behaviors of dextran functionalized graphene. Carbon. 2011;49(12):4040–4049. | ||
Yang K, Feng L, Hong H, Cai W, Liu Z. Preparation and functionalization of graphene nanocomposites for biomedical applications. Nat Protoc. 2013;8(12):2392–2403. | ||
Kam NWS, Liu Z, Dai H. Functionalization of carbon nanotubes via cleavable disulfide bonds for efficient intracellular delivery of siRNA and potent gene silencing. J Am Chem Soc. 2005;127(36):12492–12493. |
Supplementary materials
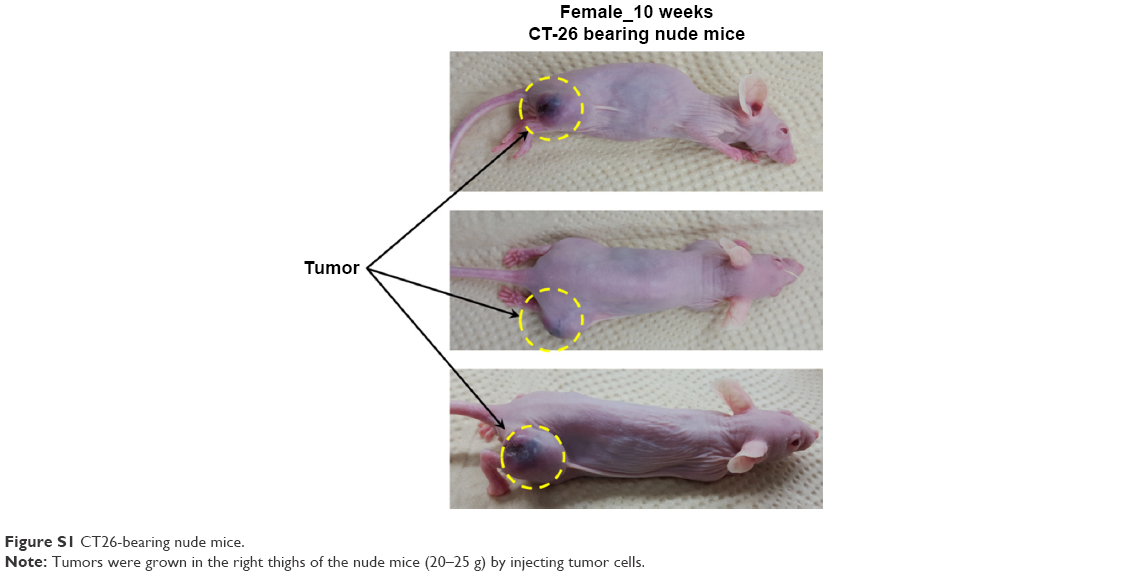 | Figure S1 CT26-bearing nude mice. |
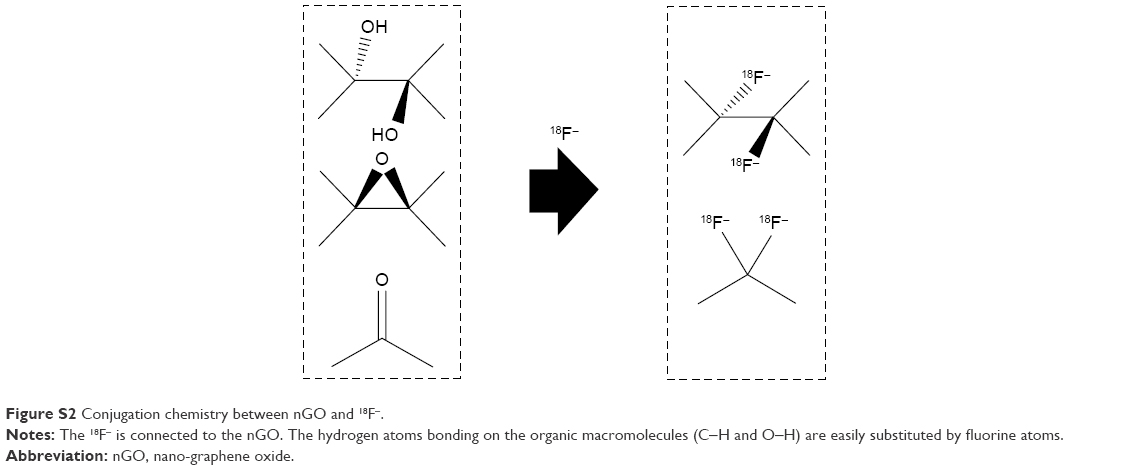 | Figure S2 Conjugation chemistry between nGO and 18F−. |
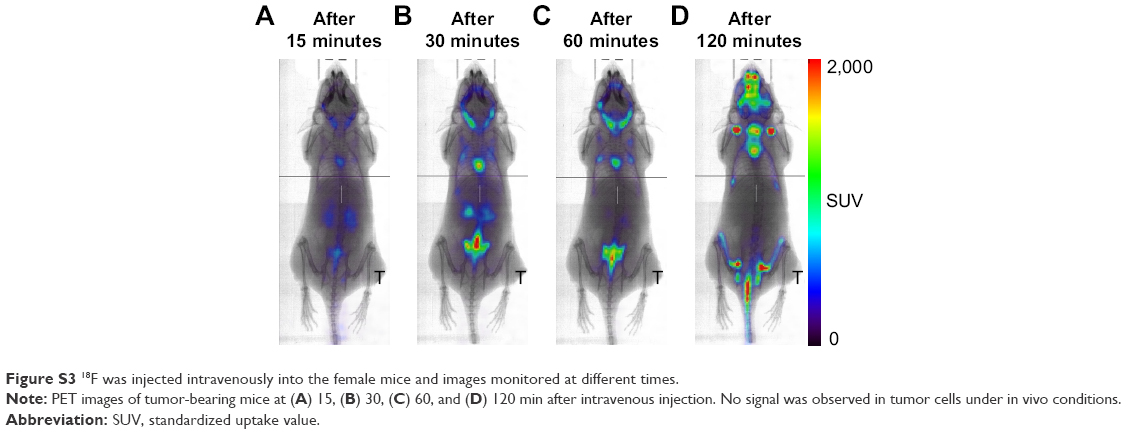 | Figure S3 18F was injected intravenously into the female mice and images monitored at different times. |
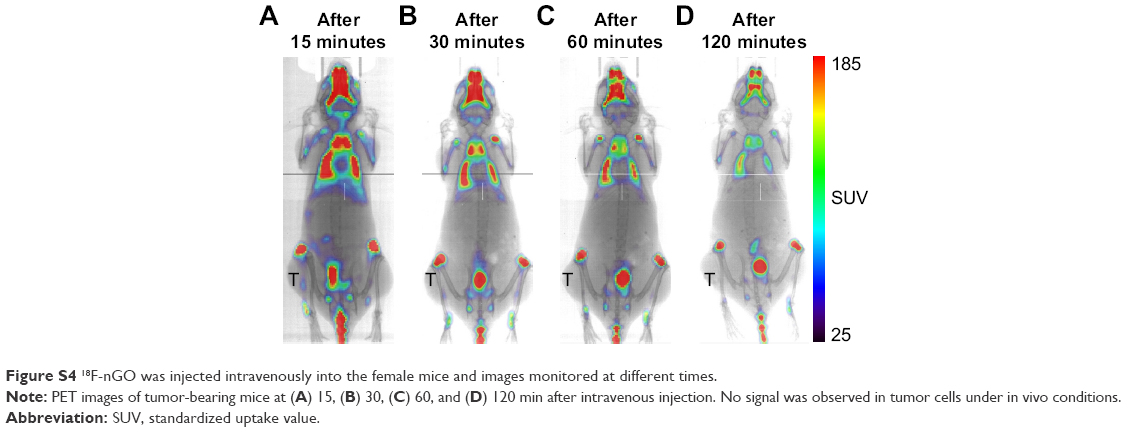 | Figure S4 18F-nGO was injected intravenously into the female mice and images monitored at different times. |
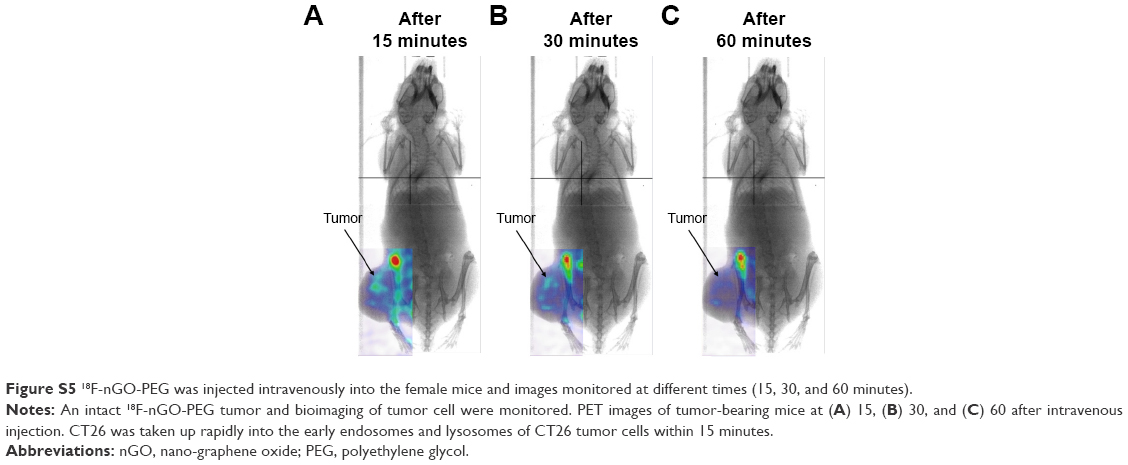 | Figure S5 18F-nGO-PEG was injected intravenously into the female mice and images monitored at different times (15, 30, and 60 minutes). |
 © 2018 The Author(s). This work is published and licensed by Dove Medical Press Limited. The full terms of this license are available at https://www.dovepress.com/terms.php and incorporate the Creative Commons Attribution - Non Commercial (unported, v3.0) License.
By accessing the work you hereby accept the Terms. Non-commercial uses of the work are permitted without any further permission from Dove Medical Press Limited, provided the work is properly attributed. For permission for commercial use of this work, please see paragraphs 4.2 and 5 of our Terms.
© 2018 The Author(s). This work is published and licensed by Dove Medical Press Limited. The full terms of this license are available at https://www.dovepress.com/terms.php and incorporate the Creative Commons Attribution - Non Commercial (unported, v3.0) License.
By accessing the work you hereby accept the Terms. Non-commercial uses of the work are permitted without any further permission from Dove Medical Press Limited, provided the work is properly attributed. For permission for commercial use of this work, please see paragraphs 4.2 and 5 of our Terms.