")
Back to Journals » International Journal of General Medicine » Volume 15
N6-Methyladenine-Related Signature for Immune Microenvironment and Response to Immunotherapy in Hepatocellular Carcinoma
Authors Ren SH , Qin YF, Qin H, Wang HD, Li GM, Zhu YL, Sun CL, Shao B , Zhang JY, Hao JP, Wang H
Received 9 December 2021
Accepted for publication 21 February 2022
Published 30 March 2022 Volume 2022:15 Pages 3525—3540
DOI https://doi.org/10.2147/IJGM.S351815
Checked for plagiarism Yes
Review by Single anonymous peer review
Peer reviewer comments 3
Editor who approved publication: Dr Scott Fraser
Shao-hua Ren,1,2 Ya-fei Qin,1,2 Hong Qin,1,2 Hong-da Wang,1,2 Guang-ming Li,1,2 Yang-lin Zhu,1,2 Cheng-lu Sun,1,2 Bo Shao,1,2 Jing-yi Zhang,1,2 Jing-peng Hao,3 Hao Wang1,2
1Department of General Surgery, Tianjin Medical University General Hospital, Tianjin, People’s Republic of China; 2Tianjin General Surgery Institute, Tianjin Medical University General Hospital, Tianjin, People’s Republic of China; 3Department of Anorectal Surgery, The Second Hospital of Tianjin Medical University, Tianjin, People’s Republic of China
Correspondence: Hao Wang, Department of General Surgery, Tianjin Medical University General Hospital, 154 Anshan Road, Heping District, Tianjin, 300052, People’s Republic of China, Tel/Fax +01186-22-60362502, Email [email protected]
Background: The prognostic value of m6A-related genes in hepatocellular carcinoma (HCC) and its correlation with the immune microenvironment still requires further investigation.
Methods: Consensus clustering by m6A related genes was used to classify 374 patients with HCC from The Cancer Genome Atlas (TCGA) database. Then we performed the least absolute shrinkage and selection operator (LASSO) to construct the m6A related genes model. The International Cancer Genome Consortium (ICGC) and Gene Expression Omnibus (GEO) datasets were used to verify and evaluate the model. ESTIMATE, CIBERSORTx, the expression levels of immune checkpoint genes, and TIDE were used to investigate the tumor microenvironment (TME) and the response to immunotherapy. Gene set enrichment analyses (GSEA), tumor-associated macrophages (TAMs), and gene-drug sensitivity were also analyzed.
Results: By expression value and regression coefficient of five m6A related genes, we constructed the risk score of each patient. The patients with a higher risk score had a considerably poorer prognosis in the primary and validated cohort. For further discussing TME and the response to immunotherapy, we divided the entire set into two groups based on the risk score. Our findings implied that the tumor-infiltrating lymphocytes (TILs) were proportional to the risk scores, which seemed to contradict that patients with higher scores had a poor prognosis. Further, we found that the high-risk group had higher expression of PD-L1, CTLA-4, and PDCD1, indicating immune dysfunction, which may be a fundamental reason for poor prognosis. This was further reinforced by the fact that the low-risk group responded better than the high-risk group to monotherapy and combination therapy.
Conclusion: The m6A related risk score is a new independent prognostic factor that correlates with immunotherapy response. It can provide a new therapeutic strategy for improving individual immunotherapy in HCC.
Keywords: hepatocellular carcinoma, N6-methyladenine, tumor immune microenvironment, immunotherapy, drug sensitivity
Introduction
Hepatocellular carcinoma (HCC) is the sixth prevalent malignancy and the third major cause of cancer-related mortality globally.1 HCC patients have a dismal prognosis since many are identified at an advanced stage of the disease. Recently, immune checkpoint inhibitors targeting programmed cell death protein 1 (PD-1) and programmed cell death ligand 1 (PD-L1) have revolutionized HCC treatment. Immune checkpoint blockade (ICB) has been a hopeful type of treatment for patients with HCC.2 ICB, however, is not beneficial to all patients. Some of the patients who received immunotherapy did not respond to ICB, while others initially responded to ICB but gradually became insensitive as the disease progressed.3–5 It is commonly believed that tumor-infiltrating lymphocytes (TILs) present in the tumor are predictive of the positive response to immunotherapies.6,7 However, an effective means of identifying the population that would best benefit from ICB treatment is still lacking. Determining the prognosis and evaluating the clinical effectiveness of novel ICB is urgently needed.
N6-methyladenosine (m6A) is the most prevalent type of RNA modification in mammals.8 This modification is mediated by a range of protein factors, including the writers, erasers, and readers.9 When it comes to the appearance and development of cancer, these m6A regulatory elements play a vital role.10–12 Several studies have revealed that the tumor microenvironment (TME) is closely related to m6A modification.13–15 For example, the m6A modification significantly reduced in the hyperimmune subtype of lung adenocarcinoma, indicating that the m6A modification may mediate immune signals and was closely related to immunotherapy responsiveness.14 In addition, a gastric cancer-related study found that m6A regulator-mediated methylation modification can predict tumor stage, TME immune activity, and patient prognosis. A lower m6A score indicated more immune cell infiltration and an enhanced response to anti-PD-1/PD-L1 immunotherapy.15 These studies suggested an essential role for m6A regulator-mediated methylation modification and m6A risk score in the TME, immunotherapy response, and survival prognosis. However, the potential role of m6A modification in HCC immune infiltration and its effect on prognosis is still unclear. Therefore, identifying the characteristics of immune infiltration mediated by a variety of m6A related genes may be helpful to screen for patients with immunotherapy benefits.
Ultimately, developing a prediction model using m6A related genes is crucial for patients with varied prognoses. Our study analyzed the correlation between the expression of the m6A related genes and tumor immune microenvironment and its prognostic value.
Methods
Data Collection, Collation, and m6A Methylation-Related Genes Selection
Firstly, the mRNA expression data (FPKM value), including 374 HCC and 50 healthy control patients, were obtained from The Cancer Genome Atlas (TCGA) -LIHC database. All data had been normalized using the fragments per kilobase of exon per million reads mapped (FPKM) method. After excluding cases with incomplete information or a short survival duration of fewer than 90 days, the mRNA expression and clinical data of 214 individuals were downloaded. The LIRI-JP dataset including 260 HCC samples from the International Cancer Genome Consortium (ICGC) database and the GSE84426 and GSE84437 dataset from the gene expression omnibus (GEO) database, were downloaded to validate our findings further.
This study conformed to the admission rules and released guidelines of TCGA, GEO, and ICGC. The data were obtained from public databases, and all patients’ identities were erased. This study was approved by the Human Ethics Committee of the Tianjin Medical University General Hospital. This study was conducted in accordance with the Declaration of Helsinki.
Eventually, we selected 13 candidate m6A related genes by searching the Gene Card database (https://www.genecards.org/) and combining the existing literature for further analysis.9,16–20
Differential Expression Analysis of the m6A Related Genes
We eliminated all repeated genes and genes whose expression value was either zero or less than 80% of the overall expression value to arrive at the candidate genes matrix. The differential expression of the 13 candidate m6A related genes between tumor and healthy tissues was computed and labeled using the R package “limma”. The visualization of differences was realized by using the heat map and the violin plot. The R package “corrplot” was used for correlation between the m6A related genes.
Cluster Analysis and Correlation of Tumor Classification with Clinical Features
The candidate gene sets of m6A related genes were expressed as feature vectors, and the samples were consistently clustered to establish multiple subgroups with the R package “consensusClusterPlus” with reps=50, pItem=0.8, pFeature=1.21 The principal component analysis (PCA) was then performed with the R package “PCA”. The relationship between the expression of the candidate m6A related genes and clinical features was shown in a heat map.
Identification of the m6A Related Genes with Patients’ Prognosis and Calculate the Risk Score
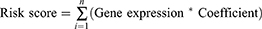
Univariate Cox analysis was used to identify the m6A related genes that impact the prognosis of HCC patients. Furthermore, the genes with p ≤ 0.001 were included in multivariate least absolute shrinkage and selection operator (Lasso) regression analysis to determine the independent prognostic genes of the patients. Calculation of the risk score was based on the m6A related genes’ expression and their coefficients. The formula for calculating risk was as follows:
The Correlation Between the Risk Score and OS, Clinical Features
The Kaplan-Meier curve and the receiver operating characteristic (ROC) curve drawn with the R package “survival” and “survival ROC” were used to evaluate the predictive value of the prognostic genes model for OS. The relationship between the risk score and clinical features was shown in a heat map.
Verifying the Risk Score is an Independent Risk Factor for Prognosis
We added clinical variables, such as age, gender, pathological grade, and cancer stage, and further examined the independent predictive role of the risk score in univariate and Cox multivariate analyses.
External Verification of the Relationship Between the Risk Score and OS and Its Application in Multiple Cancers
Additionally, the Kaplan-Meier curve is utilized to assess the predicted value of the model. The LIRI-JP dataset from the ICGC database was used as external authentication to facilitate widespread application. The GSE84426 and GSE84437 dataset from the GEO database was also used to verify the predictive value of genetic models in multiple cancers.
Enrichment Analysis of Differentially Expressed Gene (DEG) Between the High-Risk and the Low-Risk Group
Gene Ontology (GO) enrichment analysis22 was performed by the R package “org.Hs.eg.db”. Kyoto Encyclopedia of Genes and Genomes (KEGG) enrichment analyses were performed by the R package “clusterProfiler”.23
Correlation Between Immune Cell Infiltration, Tumor Immune Score, Immunotherapy-Related Genes Expression, Immunotherapy Responsiveness, and the Risk Score
To determine the correlation between multiple immune cells and the risk score, the tumor infiltration immune cells were analyzed by TIMER 2.0.
The ESTIMATE algorithm was employed to calculate each sample’s immune and stromal score by “estimate” R package. Aside from that, we also compared the difference in the expression of immunotherapy-related genes (PD-L1/CD274, CTLA4, PD-1/PDCD1) between the high-risk and low-risk group. It was shown that immunephenoscore (IPS) was an excellent predictor of response to anti-CTLA-4 and anti-PD-1 therapy.24 Therefore, the Cancer Immunome Atlas database (TCIA, https://tcia.at/home) was used to predict the efficacy of immunotherapy.
In order to further evaluate the infiltration of immune cells, we used the CIBERSORTx algorithm, which can detect the abundance of 22 immune cells and myeloid cells in the tumor microenvironment.25 We focused on the infiltration of monocytes/macrophages and the differences in the expression of macrophage-related genes in the tumor microenvironment.
Analysis of NCI-60 Drug Database with CellMiner
To clarify the influence of m6A-related signature in the prognostic model on drug sensitivity and tolerance, we downloaded transcriptome data from the CellMiner database (https://discover.nci.nih.gov/cellminer/) and FDA-certified drug sensitivity–related data. CellMiner (https://discover.nci.nih.gov/cellminer/) is a web application developed by the Genomics & Bioinformatics Group at National Cancer Institute (NCI) that facilitates systems biology through retrieval and integration of molecular and pharmacological data sets for the NCI-60 cell line panel.26,27 The Pearson correlation test was utilized to analyze the relationship between gene expression and drug sensitivity.
Statistical Analysis
All the analyses used in this study were carried out using R software (version 4.1.0). The survival curve was drawn by Kaplan-Meier and compared with the logarithmic rank test. The Chi-square test was used for correlation analysis. The immune score, interstitial score, and tumor purity were compared by analysis of variance. The Wilcox test compared the infiltration of immune cells. All tests were bilateral, and p < 0.05 was considered to be statistically significant.
Results
Characteristic of Patients
214 individuals with HCC were collected from the TCGA database, together with RNA sequencing data and comprehensive clinical information (Figure 1A). Table 1 showed the detailed characteristics of all patients.
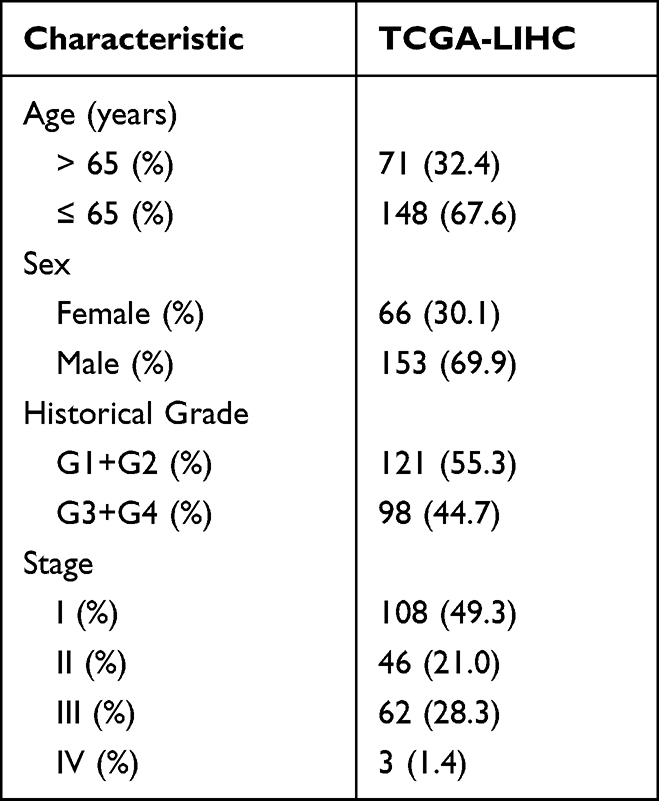 |
Table 1 Clinical Information of the Patients Included in This Study |
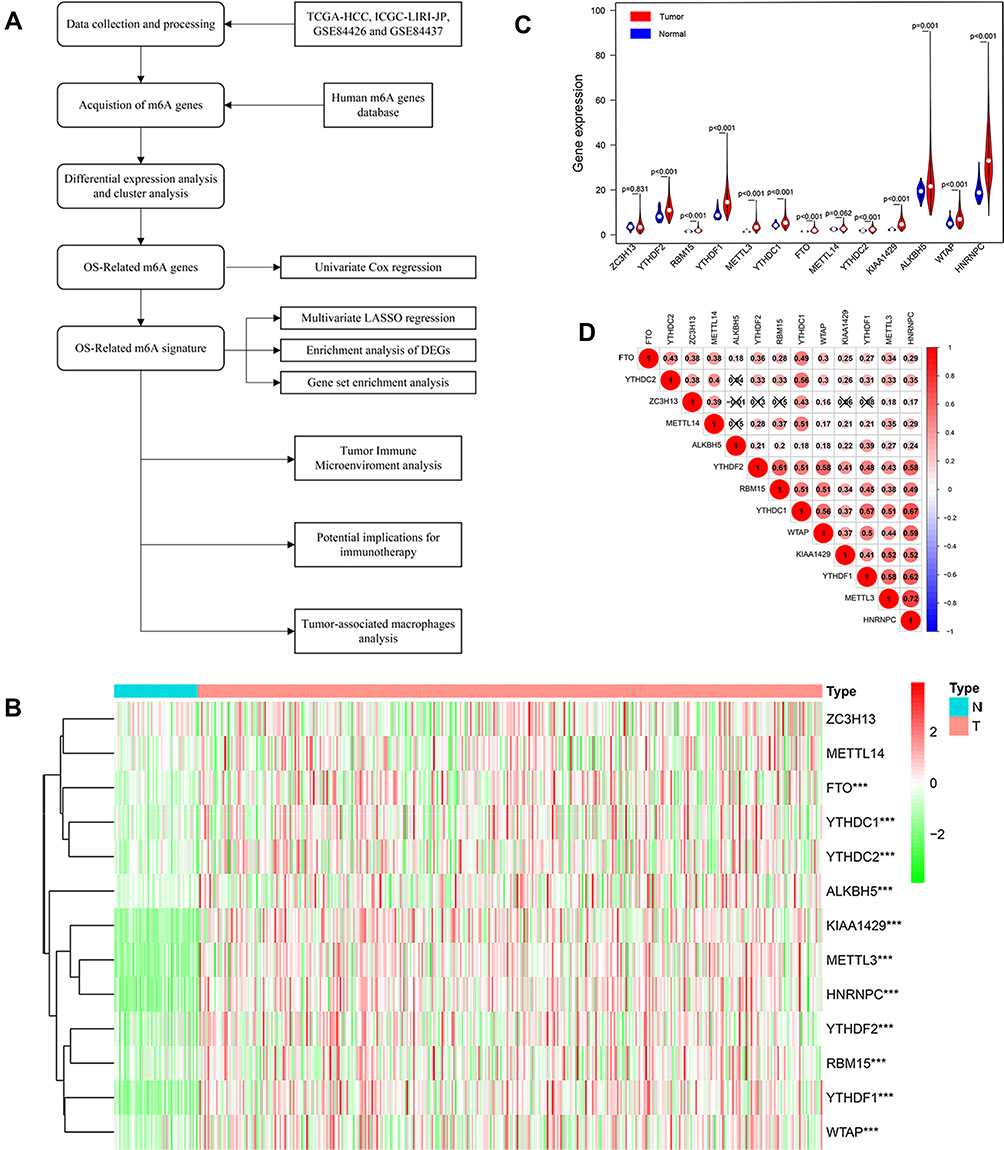 |
Figure 1 (A) Research procedure. (B and C) Heatmap and Violin plot of the m6A related genes expression between normal tissues (n = 50) and gastric tissues (n = 374) in TCGA cohort. (D) A heat map of the Spearman correlation analysis of the m6A related genes. The horizontal and vertical coordinates represent genes, and different colors represent correlation coefficients (in the diagram, blue represents positive correlation, red represents negative correlation), and the darker the color represents the two stronger correlation. “***” represents statistical significance at p < 0.001. |
Differential Expression Analysis of the m6A Related Genes
The 13 candidate m6A related genes were shown in Table 2. The heat map showed the expression patterns of the 13 genes in HCC and normal tissues (Figure 1B). It has been shown that 11 of the 13 m6A related genes vary between tumor tissues (n= 374) and normal tissues (n= 50) in the TCGA database (Figure 1C). It was suggested that the m6A related genes played an essential role in the occurrence of HCC. In order to better understand the interaction among the 13 m6A related genes, the correlation between these genes was also analyzed (Figure 1D). However, little was known about the interaction between these 13 m6A related genes, which needed to be verified by further experiments.
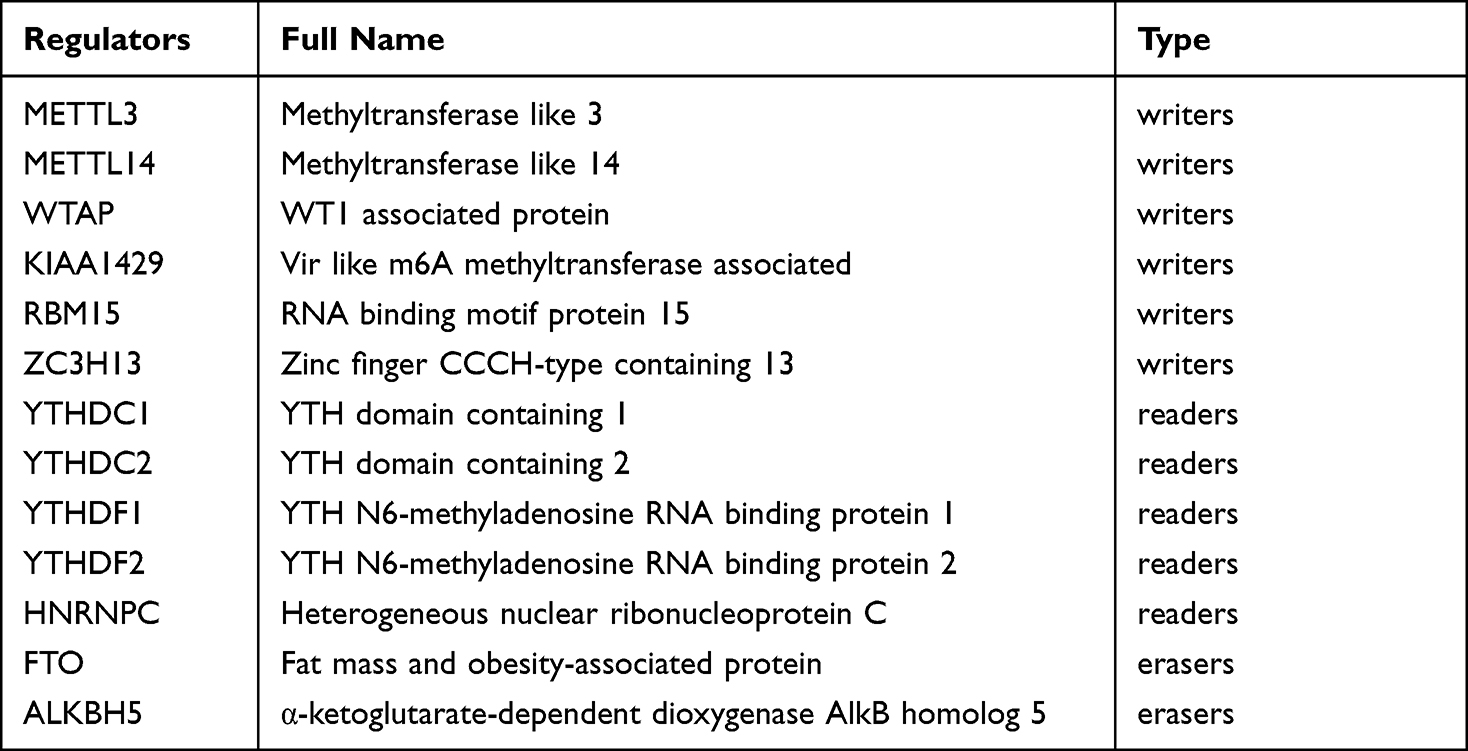 |
Table 2 The List of the 13 m6A RNA Methylation Regulatory Factors |
Consensus Clustering and Correlation of Tumor Classification with Prognosis and Clinical Features
We then performed unsupervised consensus clustering based on the expression of these 13 representative m6A related genes. It was determined that k = 2 (Figure 2A and B) had the best clustering stability from k = 2 to 9, based on the cumulative distribution function (CDF) and PCA (Supplementary Figure 1). Pathological grade (p < 0.001) were significantly different between cluster 1 and 2 (Figure 2C).
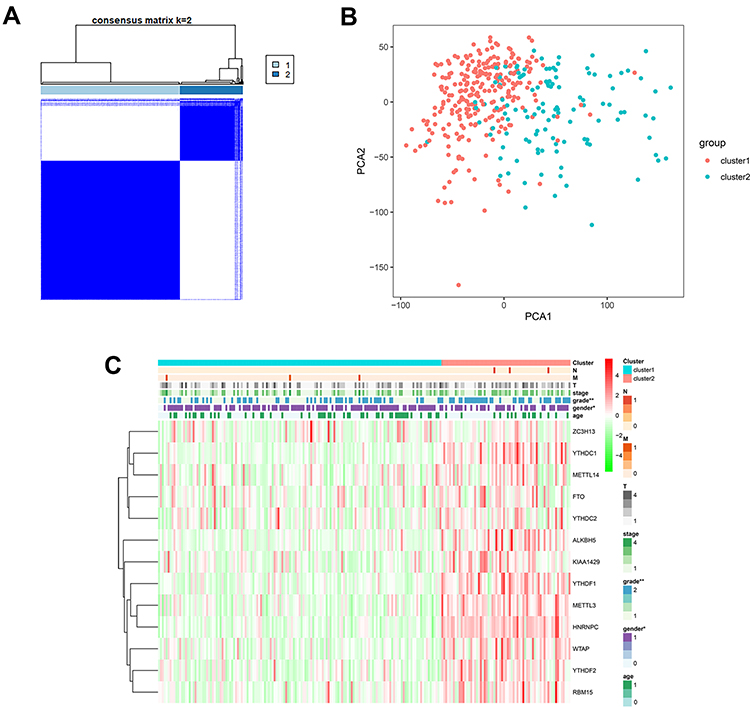 |
Figure 2 (A) Consensus cluster matrix generated by ConsensusClusterPlus R package. (B) Principal component analysis (PCA) of TCGA-LIHC patients. (C) Correlation of tumor classification with prognosis and clinical features. “*” represents statistical significance at p < 0.05, “**” represents statistical significance at p < 0.01. |
Identification of the m6A Related Genes with Patients’ Prognosis and the Correlation Between the Risk Score and Clinical Features
13 m6A related genes were included in the univariate prognostic analysis, and six significant genes were further involved in Lasso multivariate analysis (Figure 3A). Finally, five independent prognostic genes (KIAA1429, WTAP, METTL3, YTHDF1, and YTHDF2) were identified as the independent risk factors (Figure 3B and C). Table 3 showed the risk regression coefficients of the five m6A related genes. Then, the risk score of each patient was computed based on the expression value and coefficient of each independent prognostic gene. According to the median risk score, all patients were divided into the high-risk (n =107) and the low-risk (n =107) group. Furthermore, the Kaplan-Meier curve and ROC curve were drawn to evaluate the prognostic ability of the model (Figure 3D and E). We observed that the prognosis of high-risk patients was worse than those with the low-risk (HR=2.386, 95% CI=1.431–3.981, p < 0.001). The high-risk and low-risk group’s 1, 3 and 5 years survival rates were 75.5% and 94.2%, 57.4% and 78.6%, and 34.2% and 65.9%, respectively. The expression of five independent prognostic genes and the clinical features were compared between the high-risk and low-risk group (Figure 3F). Disease stage (p < 0.01) and pathological grade (p < 0.001) were significantly different between high-risk and low-risk group.
 |
Table 3 The Risk Regression Coefficients of 5 m6A-Related Genes for Establishing the Risk Score |
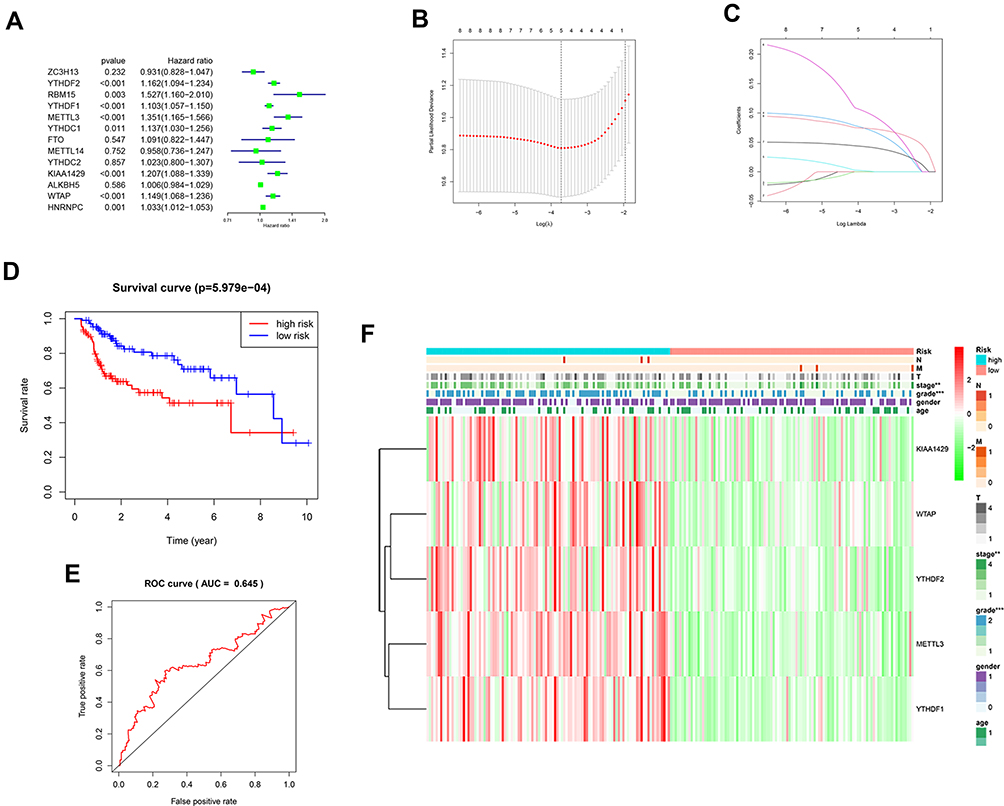 |
Figure 3 (A) Forest plot of the univariate Cox regression analysis in the m6A related genes. (B and C) LASSO regression was performed, calculating the minimum criteria. (D) Kaplan–Meier analysis of the high-risk and low-risk group in the TCGA cohort. (E) The ROC curves of the risk score in the TCGA cohort. (F) The heatmap shows the expression levels of the five m6A related genes in the low-risk and high-risk group. The distribution of clinical features was compared between the low-risk and high-risk group. “**” represents statistical significance at p < 0.01, “***” represents statistical significance at p < 0.001. |
Verifying the Risk Score is an Independent Risk Factor for Prognosis
When we did univariate and multivariate Cox regression analysis on these five independent prognostic genes, we found that their predictive significance was not impacted by clinical variables such as age, gender, pathogenic grade, or TNM stage. Univariate analysis showed that TNM stage, T stage, N stage, and risk score were all significantly correlated with OS (Figure 4A, p < 0.001, p < 0.001, p = 0.009, p < 0.001). Multivariate Cox regression analysis showed that the risk score calculated from the five genes was an independent prognostic factor (p < 0.001) (Figure 4B).
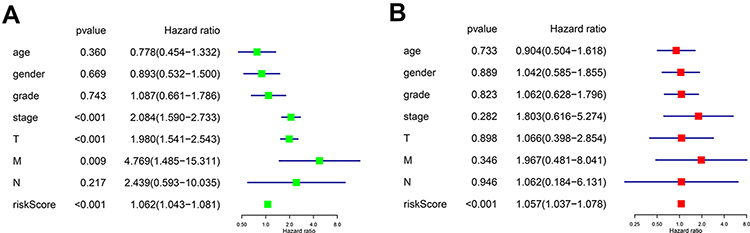 |
Figure 4 (A) Forest plot of the univariate Cox regression analysis included the risk score and the clinical features. (B) Forest plot of the multivariate Cox regression analysis included the risk score and the clinical features. |
External Verification of the Relationship Between the Risk Score and OS and Its Application in Multiple Cancers
The LIRI-JP dataset from the ICGC, including 260 HCC patients, was used to validate the predictive value of the risk score. The risk score was calculated using the same coefficient and grouped according to the median score. The survival curve showed that the OS of low-risk patients in the verification group is better than that of high-risk patients (Figure 5A, p = 4.667e-02). In addition, risk score was associated with OS in three independent multi-cancer cohorts: GSE84426 (Figure 5B, p = 5.735e-02) and GSE84437 (Figure 5C, p = 8.813e-02).
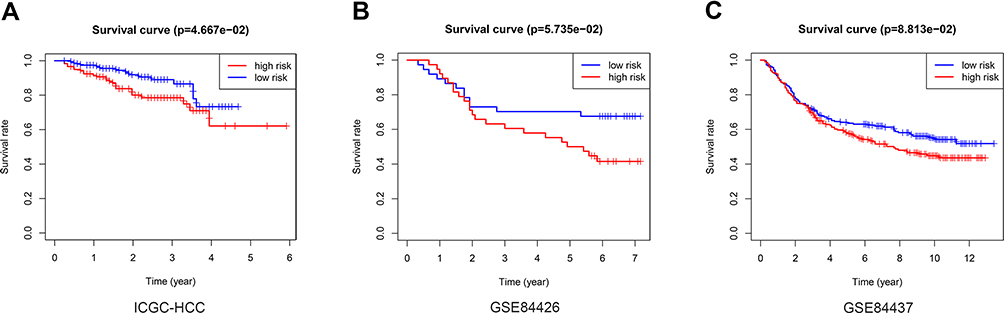 |
Figure 5 External verification of the relationship between the risk score and OS. Kaplan–Meier analysis of the high-risk and low-risk group in the ICGC cohort (A), GSE84426 cohort (B), GSE84437 cohort (C). |
Enrichment Analysis of Differentially Expressed Genes (DEG) Between the High-Risk and the Low-Risk Group
In order to better clarify the function and possible mechanism of the risk score in HCC, we further analyzed the expression patterns of the high-risk and low-risk group. The functional annotation results showed that the DEGs were mainly enriched in organelle fission, nuclear division, chromosome segregation, chromosome region, and PI3K-Akt signal pathway (Figure 6).
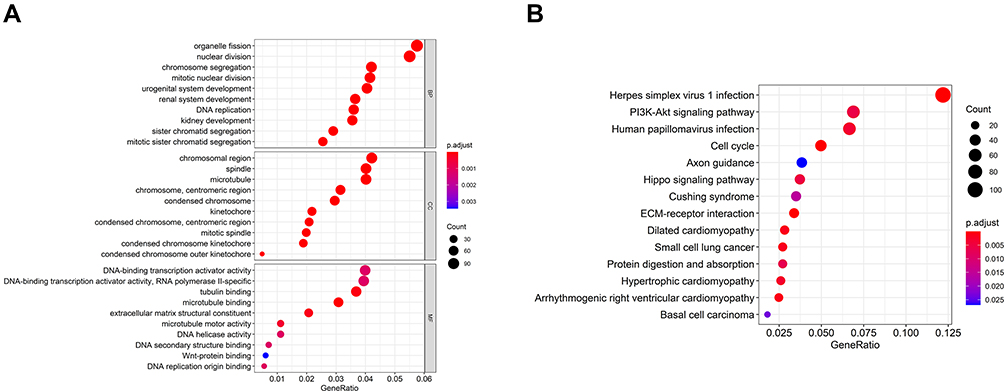 |
Figure 6 Differential and enrichment analysis of DEGs between the high-risk and low-risk score subgroup. (A) Go terms enrichment analysis of DEGs. (B) KEGG enrichment analysis of DEGs. |
Correlation Between Immune Cell Infiltration, Tumor Immune Score, Immunotherapy-Related Genes Expression, Immunotherapy Responsiveness, and the Risk Score
Subsequently, we discussed the correlation between immune cell infiltration, immunotherapy-related genes expression, tumor immune score, and risk score to explore the potential correlation between risk score and the efficacy of immunotherapy. First of all, we found that the risk score was significantly correlated with CD4+T cell (Figure 7A, p = 0.001), CD8+T cell (Figure 7B, p = 9.185e-05), B cell (Figure 7C, p = 8.839e-05), dendritic cell (Figure 7D, p = 5.108e-08), macrophage (Figure 7E, p = 1.672e-13), neutrophil infiltration (Figure 7F, p = 2.252e-10). Tumor-infiltrating immune cells were closely related to the risk score.
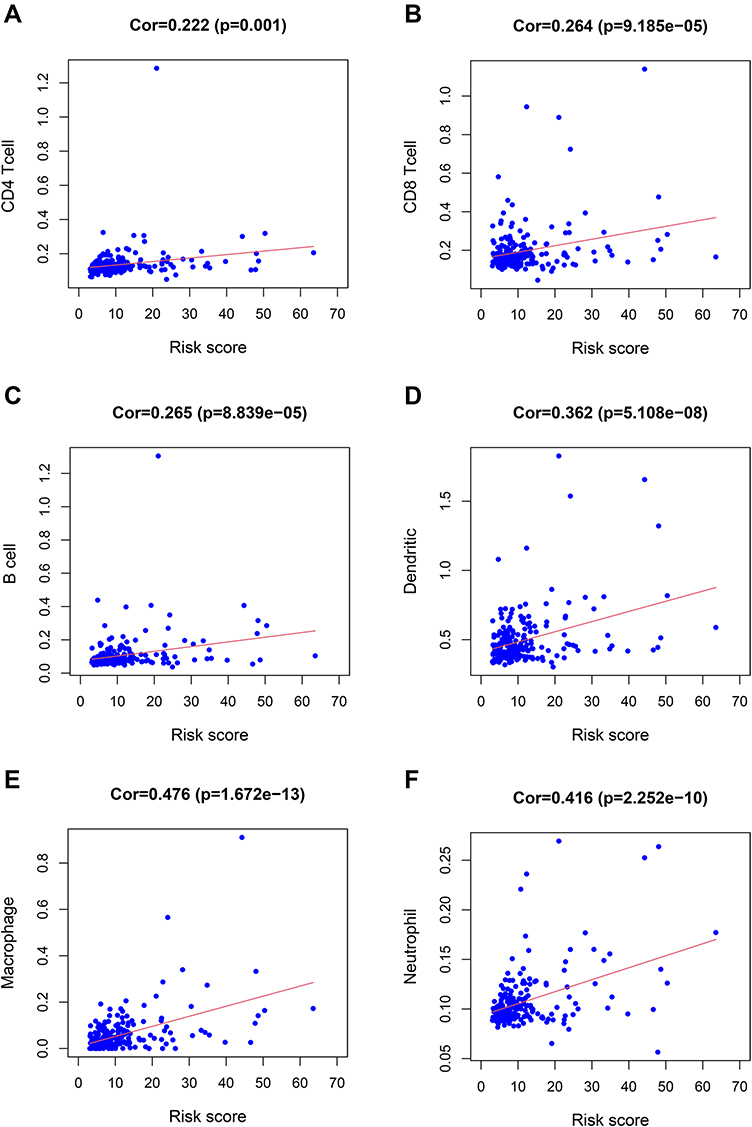 |
Figure 7 The relationship between the risk score and immune cell infiltration. The risk score was positively correlated with the infiltration of CD4+T cells (A), CD8+T cells (B), B cells (C), dendritic cells (D), macrophages (E), and neutrophils (F). |
Further, compared with the low-risk group, the immune score was significantly lower in the high-risk group (Figure 8A–C, p < 0.05, p < 0.001, p < 0.05), and the expression levels of PD-L1, CTLA-4, and PDCD1 (Figure 8D–F, p < 0.01, p < 0.001, p < 0.001) were significantly higher. The potential effect of anti-CTLA4, anti-PD-1 and combination of two drugs was better in the low-risk group (Figure 8G–I, p = 0.0012, p = 0.0029, p = 0.00094).
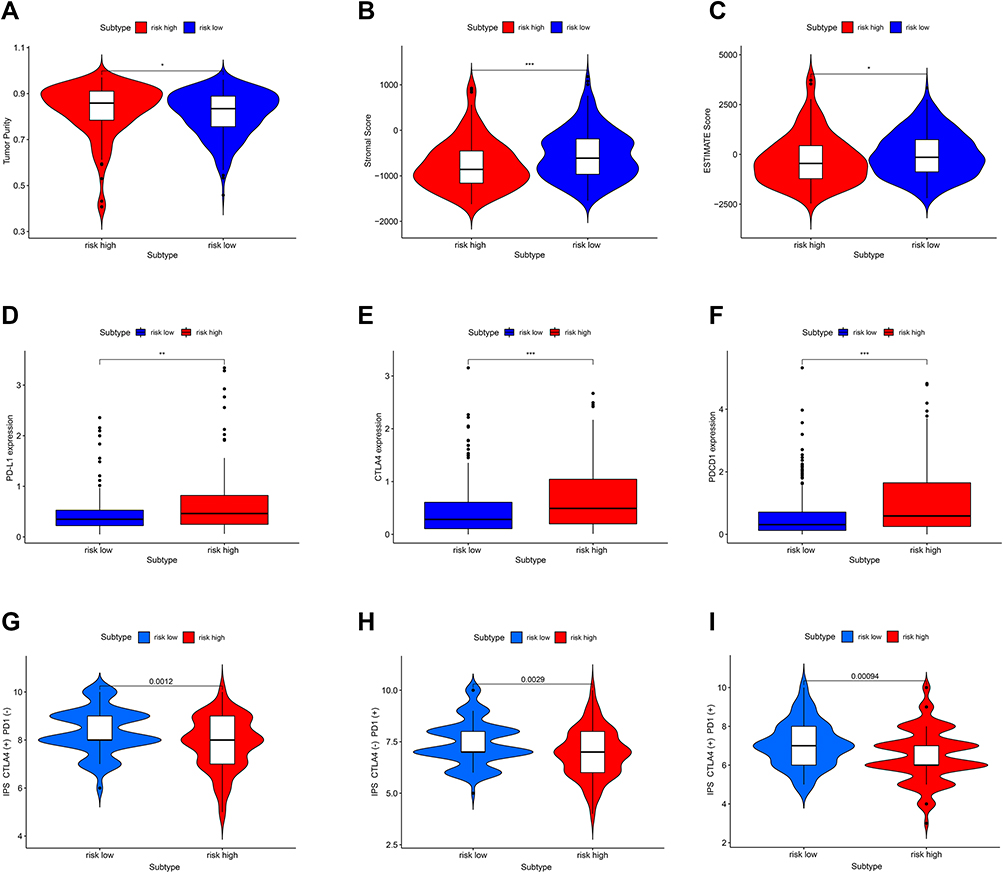 |
Figure 8 Correlation between immunotherapy-related genes expression, tumor immune score, immunotherapy responsiveness, and risk score. (A–C) The Immune score in the high-risk and low-risk group. (D–F) The PD-L1 (CD724), CTLA-4, PDCD1 expression in the high-risk and low-risk group. (G–I) The potential effect of anti-CTLA4, anti-PD-1, and a combination of two drugs in the high-risk and low-risk group. “*” represents statistical significance at p < 0.05, “**” represents statistical significance at p < 0.01, and “***” represents statistical significance at p < 0.001. |
We further analyzed the infiltration of immune cells. Interestingly, we found that the proportion of M0 macrophages (p = 8.307e-05) in tumors with the high-risk score was higher than that with the low-risk score, and the expression of CSF-1 (p < 0.001), which is closely related to the polarization and aggregation of macrophages, was significantly increased in tumors with high-risk score (Figure 9).
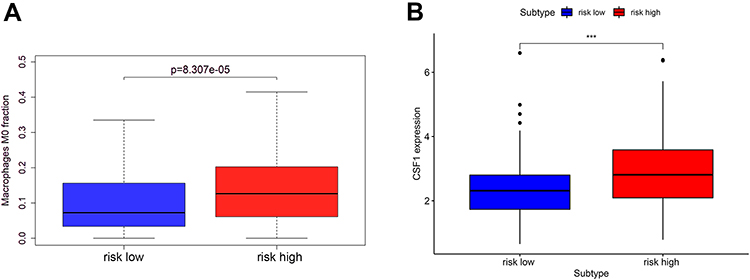 |
Figure 9 The macrophage infiltration (A) and the CSF-1 expression (B) in the high-risk and low-risk group. “***” represents statistical significance at p < 0.001. |
Analysis of NCI-60 Drug Database with CellMiner
We performed a separate drug sensitivity analysis on m6A-related signature in the prognostic model to obtain the top 16 drugs with the most significant differences. The results showed that the expression of YTHDF1 was positively correlated with the sensitivity of nelarabine. It indicates that the higher the expression of YTHDF1, the stronger the sensitivity to nelarabine. The expression of YTHDF2 was positively correlated with the sensitivity of vorinostat, but it was negatively correlated with the sensitivity of dasatinib, PF−06463922 and brigatinib. The expression of WTAP was positively correlated with the sensitivity of nelarabine, ifosfamide, lomustine and irinotecan, but it was negatively correlated with the sensitivity of vemurafenib. The higher the expression of METTL3 in HCC patients, the patient’s sensitivity to fludarabine, nelarabine, allopurinol and vorinostat is stronger. In addition, the higher the expression of KIAA1429, the patient’s sensitivity to homoharringtonine and carfilzomib is weaker (Figure 10).
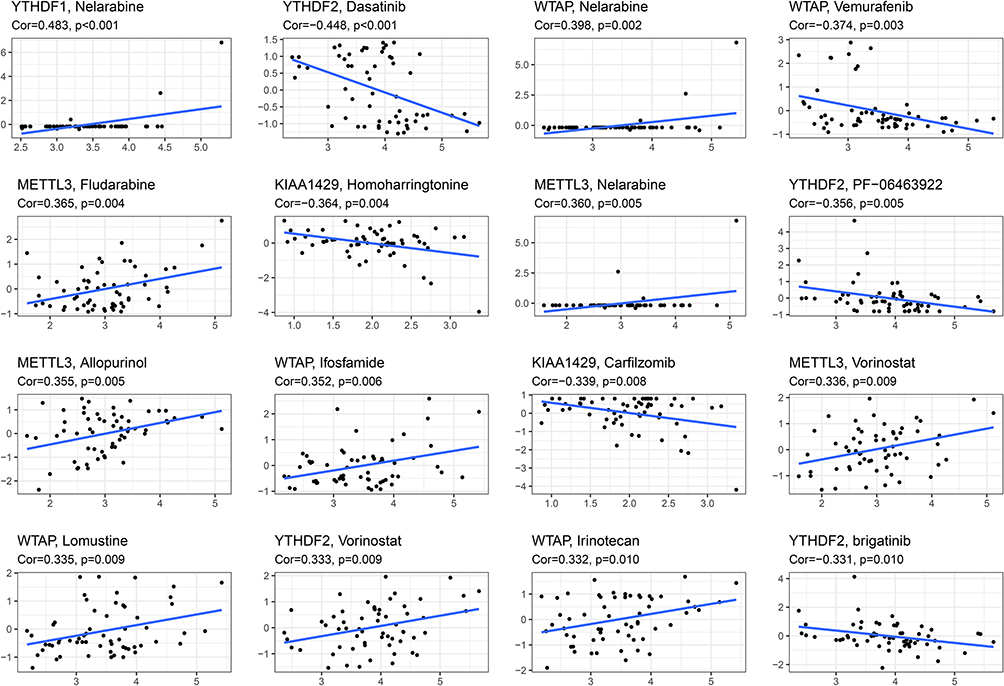 |
Figure 10 Gene–drug sensitivity analysis based on the CellMiner database; the top 16 drugs with high correlation with gene expression in m6A-related signature were screened. |
Discussion
The treatment of HCC has always been one of the most intractable problems in clinic. The liver is the largest immune-related organ, and the immune system plays a decisive role in the incidence and progression of HCC.28,29 However, there is still an absence of reliable indicators to predict HCC prognosis and treatment efficacy persists.
In this study, we identified five m6A related genes that affect the prognosis of patients by univariate and multivariate analysis. We observed that the risk score of these five m6A related genes was an independent risk factor for the prognosis and was strongly associated with clinical features and tumor immune microenvironment. These five m6A related genes were expected to become novel prognostic biomarkers, immunotherapeutic indicators, and new targets for further treatment of HCC.
At present, some studies have shown that the m6A related genes were overexpressed in tumor tissues, which were closely related to the progression of malignant tumors.15,30–32 It has also been verified in HCC.33,34 Although the WTAP protein can interact with and bind to WT1, it also participated in many other normal physiological processes, including m6A methylation, and played an important regulatory function in forming malignant tumors.35 There was evidence that the tumor-promoting enzyme METTL3, which can catalyze the production of m6A, played an essential role in tumor growth.36 SOCS2 could be silenced by METTL3 overexpression via an m6A-dependent mechanism, which could contribute to the progression of HCC.37 In addition, YTHDF2 promoted the proliferation of HCC cells when the m6A site was identified YTHDF2.38 These results suggested that the expression and modification of m6A related genes were closely related to malignant tumors’ phenotypic and progression mechanism. This result is consistent with our research results. While m6A related genes may change the mRNA levels of target genes alone, it is unknown how they affect the prognosis and survival time of patients with HCC. As part of our predictive model, we added the m6A-associated genes closely associated with the prognosis of patients with HCC.
Otherwise, m6A methylation has also been found to affect immune cells’ maturation and antigen presentation capacity and how malignancies respond to immunotherapy.39,40 The TME was the primary environment for tumor occurrence and development, a dynamic and complex system composed of various immune cells, stromal cells, cytokines, and chemokines.41,42 The intricacy of TME may be the critical factor of HCC immune escape.43,44 A previous study has shown that TILs served as a reliable prognostic biomarker for HCC immunotherapy.45 “Hot” tumors with higher TILs were more likely to benefit from immunotherapy. On the contrary, “cold” tumors with lower TILs tended to develop resistance to immunotherapy.46 Previous literature has reported that the TME cell-infiltrating characteristics under three m6A related patterns were highly consistent with the three immune phenotypes of tumors including immune-excluded, immune-inflamed and immune-desert phenotypes in gastric cancer.15 Furthermore, Jackson et al have reported that they found a close relation between m6A regulators and immune infiltration.47 A growing number of investigators believed that m6A regulators affected TME by regulating TILs, but TILs were not the only factor determining the effectiveness of immunotherapy. Thus, it is inconclusive whether m6A related genes can influence the effectiveness of therapeutic immunotherapy. Our findings implied that the risk score based on the m6A related genes was significantly associated with six major types of immune cell infiltration and ESTIMATE score, and the TILs was proportional to the risk scores, which seemed to contradict the fact that patients with higher scores had a poor prognosis.
Further, we studied other factors that may be related to immunotherapy response. The expression of immunomodulatory markers such as PD-L1 is associated with an improved response to immunotherapy.48,49 Tumor cells that expressed PD-L1 promoted immunological tolerance and immune evasion in the host.50 The expression of PD-L1 in hepatocellular carcinoma cells was linked to a poor prognosis.51 Other checkpoint molecules, including CTLA4, PDCD1, TIM3, and LAG3, were also associated with HCC resistance to immunotherapy.52 We found that the high-risk group had higher tumor purity, lower ESTIMATE score, and higher expression of PD-L1, CTLA-4, and PDCD1, indicating the immune dysfunction, which may be one of the causes for tumor immune escape and a fundamental reason for poor prognosis. This was further reinforced by the fact that the low-risk group responded better to monotherapy and combination treatment than the high-risk group.
Contrary to the traditional belief that macrophages play a host protective role in the inflammatory microenvironment, tumor-associated macrophages (TAMs) are usually associated with poor tumor prognosis.52–55 Circulating inflammatory monocytes can be recruited to tumors by various cytokines such as CSF-1, CCL2, CCL5, and VEGF.56 Once monocytes from peripheral blood are recruited into the tumor tissues, they will be rapidly differentiated into TAMs. Previous studies have found that blocking CSF-1R could reduce TAMs infiltration in tumors and, at the same time, improve the efficacy of cisplatin in breast cancer models.57 Trials on advanced solid tumor patients are now being conducted using CSF-1R-targeting drugs as monotherapy or in conjunction with immune checkpoint inhibitors.58 Meanwhile, we found that CSF-1 was more expressed in the high-risk group, and correspondingly, there was more macrophage infiltration. Perhaps this may explain the poor prognosis of the high-risk group.
Finally, drugs associating m6A related genes may have a potential role in enhancing immunotherapy. We provided some sensitive drugs associating with the five m6A related genes. Active attempts to combine these drugs with immunotherapy are reported. A Phase II trial of pembrolizumab and vorinostat in recurrent metastatic head and neck squamous cell carcinomas demonstrated excellent anti-tumor activity.59 Another study showed that irinotecan combined with immunotherapy significantly improved survival in pancreatic cancer.60 Our findings may also provide guidance for future chemotherapy combined with immunotherapy regimens for HCC.
With the implementation of precision medicine, accurate evaluation of the prognosis of patients plays a vital role in performing the individualized treatment and improving the long-term prognosis of patients. The model composed of multiple biomarkers avoids the insufficient credibility of a single biomarker model. Therefore, we identified five m6A related genes as independent prognostic factors for HCC. Our prognostic risk score works well despite its HCC-based origins when tested on various cancer kinds and data. This shows that our prognostic risk score may be used for a broader range of cancer types. However, this study also has some limitations. In the absence of data related to ICB treatment in the HCC cohort, we could not explore the relationship between ICB treatment response and risk score. Therefore, further in vitro and in vivo experiments to verify this point are warranted.
Conclusion
In summary, a five m6A related genes risk score was identified as a novel potential biomarker for HCC prognosis and effectiveness of immunotherapy. There was a strong correlation between the mRNA levels of these genes and the clinical and pathological characteristics of HCC. In addition, the m6A related genes risk score was closely related to the tumor immune microenvironment, which was of great significance for the design of individualized treatment for patients with HCC.
Acknowledgment
Shao-hua Ren, Ya-fei Qin, and Hong Qin are co-first authors for this paper.
Funding
This work was supported by grants to Hao Wang from the National Natural Science Foundation of China (No. 82071802) and the Health Commission of Tianjin (No. TJWJ2021MS004), and to Zhaobo Wang from the National Training Program of Innovation and Entrepreneurship for Undergraduates (No. BK11020220).
Disclosure
All authors declare no conflicts of interest in this paper.
References
1. Sung H, Ferlay J, Siegel RL, et al. Global Cancer Statistics 2020: GLOBOCAN Estimates of Incidence and Mortality Worldwide for 36 Cancers in 185 Countries. CA Cancer J Clin. 2021;71(3):209–249.
2. El-Khoueiry AB, Sangro B, Yau T, et al. Nivolumab in patients with advanced hepatocellular carcinoma (CheckMate 040): an open-label, non-comparative, Phase 1/2 dose escalation and expansion trial. Lancet. 2017;389(10088):2492–2502.
3. Pitt JM, Vetizou M, Daillere R, et al. Resistance Mechanisms to Immune-Checkpoint Blockade in Cancer: tumor-Intrinsic and -Extrinsic Factors. Immunity. 2016;44(6):1255–1269.
4. Llovet JM, Castet F, Heikenwalder M, et al. Immunotherapies for hepatocellular carcinoma. Nat Rev Clin Oncol. 2021.
5. Marin JJG, Romero MR, Herraez E, et al. Mechanisms of Pharmacoresistance in Hepatocellular Carcinoma: new Drugs but Old Problems. Semin Liver Dis. 2021;1:374.
6. Tumeh PC, Harview CL, Yearley JH, et al. PD-1 blockade induces responses by inhibiting adaptive immune resistance. Nature. 2014;515(7528):568–571.
7. Dong ZY, Wu SP, Liao RQ, Huang SM, Wu YL. Potential biomarker for checkpoint blockade immunotherapy and treatment strategy. Tumour Biol. 2016;37(4):4251–4261.
8. Desrosiers R, Friderici K, Rottman F. Identification of methylated nucleosides in messenger RNA from Novikoff hepatoma cells. Proc Natl Acad Sci U S A. 1974;71(10):3971–3975.
9. Wang S, Chai P, Jia R, Jia R. Novel insights on m(6)A RNA methylation in tumorigenesis: a double-edged sword. Mol Cancer. 2018;17(1):101.
10. Liu ZX, Li LM, Sun HL, Liu SM. Link Between m6A Modification and Cancers. Front Bioeng Biotechnol. 2018;6:89.
11. Davalos V, Blanco S, Esteller M. SnapShot: messenger RNA Modifications. Cell. 2018;174(2):498–498 e491.
12. He L, Li H, Wu A, Peng Y, Shu G, Yin G. Functions of N6-methyladenosine and its role in cancer. Mol Cancer. 2019;18(1):176.
13. Li H, Su Q, Li B, et al. High expression of WTAP leads to poor prognosis of gastric cancer by influencing tumour-associated T lymphocyte infiltration. J Cell Mol Med. 2020;24(8):4452–4465.
14. Xu F, Chen JX, Yang XB, et al. Analysis of Lung Adenocarcinoma Subtypes Based on Immune Signatures Identifies Clinical Implications for Cancer Therapy. Mol Ther Oncolytics. 2020;17:241–249.
15. Zhang B, Wu Q, Li B, Wang D, Wang L, Zhou YL. m(6)A regulator-mediated methylation modification patterns and tumor microenvironment infiltration characterization in gastric cancer. Mol Cancer. 2020;19(1):53.
16. Fang Q, Chen H. The significance of m6A RNA methylation regulators in predicting the prognosis and clinical course of HBV-related hepatocellular carcinoma. Molecular med. 2020;26(1):60.
17. Fu Y, Dominissini D, Rechavi G, He C. Gene expression regulation mediated through reversible m(6)A RNA methylation. Nat Rev Genet. 2014;15(5):293–306.
18. Dai D, Wang H, Zhu L, Jin H, Wang X. N6-methyladenosine links RNA metabolism to cancer progression. Cell Death Dis. 2018;9(2):124.
19. Chen XY, Zhang J, Zhu JS. The role of m(6)A RNA methylation in human cancer. Mol Cancer. 2019;18(1):103.
20. Lan Q, Liu PY, Haase J, Bell JL, Huttelmaier S, Liu T. The Critical Role of RNA m(6)A Methylation in Cancer. Cancer Res. 2019;79(7):1285–1292.
21. Wilkerson MD, Hayes DN. ConsensusClusterPlus: a class discovery tool with confidence assessments and item tracking. Bioinformatics. 2010;26(12):1572–1573.
22. Young MD, Wakefield MJ, Smyth GK, Oshlack A. Gene ontology analysis for RNA-seq: accounting for selection bias. Genome Biol. 2010;11(2):R14.
23. Yu G, Wang LG, Han Y, He QY. clusterProfiler: an R package for comparing biological themes among gene clusters. OMICS. 2012;16(5):284–287.
24. Charoentong P, Finotello F, Angelova M, et al. Pan-cancer Immunogenomic Analyses Reveal Genotype-Immunophenotype Relationships and Predictors of Response to Checkpoint Blockade. Cell Rep. 2017;18(1):248–262.
25. Newman AM, Steen CB, Liu CL, et al. Determining cell type abundance and expression from bulk tissues with digital cytometry. Nat Biotechnol. 2019;37(7):773–782.
26. Shankavaram UT, Varma S, Kane D, et al. CellMiner: a relational database and query tool for the NCI-60 cancer cell lines. BMC Genomics. 2009;10:277.
27. Reinhold WC, Sunshine M, Liu H, et al. CellMiner: a web-based suite of genomic and pharmacologic tools to explore transcript and drug patterns in the NCI-60 cell line set. Cancer Res. 2012;72(14):3499–3511.
28. Angell H, Galon J. From the immune contexture to the Immunoscore: the role of prognostic and predictive immune markers in cancer. Curr Opin Immunol. 2013;25(2):261–267.
29. Tang X, Shu Z, Zhang W, et al. Clinical significance of the immune cell landscape in hepatocellular carcinoma patients with different degrees of fibrosis. Ann Transl Med. 2019;7(20):528.
30. Zhang F, Ruan X, Ma J, et al. DGCR8/ZFAT-AS1 Promotes CDX2 Transcription in a PRC2 Complex-Dependent Manner to Facilitate the Malignant Biological Behavior of Glioma Cells. Mol Ther. 2020;28(2):613–630.
31. Sun L, Yu S, Xu H, et al. FHL2 interacts with EGFR to promote glioblastoma growth. Oncogene. 2018;37(10):1386–1398.
32. Zhou Z, Zhang J, Xu C, et al. An integrated model of N6-methyladenosine regulators to predict tumor aggressiveness and immune evasion in pancreatic cancer. EBioMedicine. 2021;65:103271.
33. Khan FS, Ali I, Afridi UK, Ishtiaq M, Mehmood R. Epigenetic mechanisms regulating the development of hepatocellular carcinoma and their promise for therapeutics. Hepatol Int. 2017;11(1):45–53.
34. Li Z, Li F, Peng Y, Fang J, Zhou J. Identification of three m6A-related mRNAs signature and risk score for the prognostication of hepatocellular carcinoma. Cancer Med. 2020;9(5):1877–1889.
35. Zhu B, Gong Y, Shen L, et al. Total Panax notoginseng saponin inhibits vascular smooth muscle cell proliferation and migration and intimal hyperplasia by regulating WTAP/p16 signals via m(6)A modulation. Biomed Pharmacother. 2020;124:109935.
36. Zhu ZM, Huo FC, Pei DS. Function and evolution of RNA N6-methyladenosine modification. Int J Biol Sci. 2020;16(11):1929–1940.
37. Lin Y, Wei X, Jian Z, Zhang X. METTL3 expression is associated with glycolysis metabolism and sensitivity to glycolytic stress in hepatocellular carcinoma. Cancer Med. 2020;9(8):2859–2867.
38. Zhong L, Liao D, Zhang M, et al. YTHDF2 suppresses cell proliferation and growth via destabilizing the EGFR mRNA in hepatocellular carcinoma. Cancer Lett. 2019;442:252–261.
39. Han D, Liu J, Chen C, et al. Anti-tumour immunity controlled through mRNA m(6)A methylation and YTHDF1 in dendritic cells. Nature. 2019;566(7743):270–274.
40. Wang H, Hu X, Huang M, et al. Mettl3-mediated mRNA m(6)A methylation promotes dendritic cell activation. Nat Commun. 2019;10(1):1898.
41. Altorki NK, Markowitz GJ, Gao D, et al. The lung microenvironment: an important regulator of tumour growth and metastasis. Nat Rev Cancer. 2019;19(1):9–31.
42. Cacho-Diaz B, Garcia-Botello DR, Wegman-Ostrosky T, Reyes-Soto G, Ortiz-Sanchez E, Herrera-Montalvo LA. Tumor microenvironment differences between primary tumor and brain metastases. J Transl Med. 2020;18(1):1.
43. Finkin S, Yuan D, Stein I, et al. Ectopic lymphoid structures function as microniches for tumor progenitor cells in hepatocellular carcinoma. Nat Immunol. 2015;16(12):1235–1244.
44. Hackl H, Charoentong P, Finotello F, Trajanoski Z. Computational genomics tools for dissecting tumour-immune cell interactions. Nat Rev Genet. 2016;17(8):441–458.
45. Ding W, Xu X, Qian Y, et al. Prognostic value of tumor-infiltrating lymphocytes in hepatocellular carcinoma: a meta-analysis. Medicine. 2018;97(50):e13301.
46. Jiang P, Gu S, Pan D, et al. Signatures of T cell dysfunction and exclusion predict cancer immunotherapy response. Nat Med. 2018;24(10):1550–1558.
47. Qu S, Chen Z, Liu B, Liu J, Wang H. N6-methyladenine-related genes affect biological behavior and the prognosis of glioma. Cancer Med. 2021;10(1):98–108.
48. Herbst RS, Soria JC, Kowanetz M, et al. Predictive correlates of response to the anti-PD-L1 antibody MPDL3280A in cancer patients. Nature. 2014;515(7528):563–567.
49. Ji RR, Chasalow SD, Wang L, et al. An immune-active tumor microenvironment favors clinical response to ipilimumab. Cancer Immunol Immunother. 2012;61(7):1019–1031.
50. Shi F, Shi M, Zeng Z, et al. PD-1 and PD-L1 upregulation promotes CD8(+) T-cell apoptosis and postoperative recurrence in hepatocellular carcinoma patients. Int J Cancer. 2011;128(4):887–896.
51. Gao Q, Wang XY, Qiu SJ, et al. Overexpression of PD-L1 significantly associates with tumor aggressiveness and postoperative recurrence in human hepatocellular carcinoma. Clin Cancer Res. 2009;15(3):971–979.
52. Cariani E, Missale G. Immune landscape of hepatocellular carcinoma microenvironment: implications for prognosis and therapeutic applications. Liver Int. 2019;39(9):1608–1621.
53. Mantovani A, Marchesi F, Malesci A, Laghi L, Allavena P. Tumour-associated macrophages as treatment targets in oncology. Nat Rev Clin Oncol. 2017;14(7):399–416.
54. Xu Q, Hu Y, Chen S, et al. Immunological Significance of Prognostic DNA Methylation Sites in Hepatocellular Carcinoma. Front Mol Biosci. 2021;8:683240.
55. Shen S, Yan J, Zhang Y, Dong Z, Xing J, He Y. N6-methyladenosine (m6A)-mediated messenger RNA signatures and the tumor immune microenvironment can predict the prognosis of hepatocellular carcinoma. Ann Transl Med. 2021;9(1):59.
56. Mantovani A, Allavena P, Sica A, Balkwill F. Cancer-related inflammation. Nature. 2008;454(7203):436–444.
57. Salvagno C, Ciampricotti M, Tuit S, et al. Therapeutic targeting of macrophages enhances chemotherapy efficacy by unleashing type I interferon response. Nat Cell Biol. 2019;21(4):511–521.
58. Mok S, Koya RC, Tsui C, et al. Inhibition of CSF-1 receptor improves the antitumor efficacy of adoptive cell transfer immunotherapy. Cancer Res. 2014;74(1):153–161.
59. Rodriguez CP, Wu QV, Voutsinas J, et al. A Phase II Trial of Pembrolizumab and Vorinostat in Recurrent Metastatic Head and Neck Squamous Cell Carcinomas and Salivary Gland Cancer. Clin Cancer Res. 2020;26(4):837–845.
60. Liu X, Jiang J, Liao YP, et al. Combination Chemo-Immunotherapy for Pancreatic Cancer Using the Immunogenic Effects of an Irinotecan Silicasome Nanocarrier Plus Anti-PD-1. Adv Sci. 2021;8(6):2002147.
 © 2022 The Author(s). This work is published and licensed by Dove Medical Press Limited. The full terms of this license are available at https://www.dovepress.com/terms.php and incorporate the Creative Commons Attribution - Non Commercial (unported, v3.0) License.
By accessing the work you hereby accept the Terms. Non-commercial uses of the work are permitted without any further permission from Dove Medical Press Limited, provided the work is properly attributed. For permission for commercial use of this work, please see paragraphs 4.2 and 5 of our Terms.
© 2022 The Author(s). This work is published and licensed by Dove Medical Press Limited. The full terms of this license are available at https://www.dovepress.com/terms.php and incorporate the Creative Commons Attribution - Non Commercial (unported, v3.0) License.
By accessing the work you hereby accept the Terms. Non-commercial uses of the work are permitted without any further permission from Dove Medical Press Limited, provided the work is properly attributed. For permission for commercial use of this work, please see paragraphs 4.2 and 5 of our Terms.