")
Back to Journals » International Journal of General Medicine » Volume 15
MYBL2 is a Novel Independent Prognostic Biomarker and Correlated with Immune Infiltrates in Prostate Cancer
Authors Jiao M, Zhang F , Teng W, Zhou C
Received 22 December 2021
Accepted for publication 17 February 2022
Published 15 March 2022 Volume 2022:15 Pages 3003—3030
DOI https://doi.org/10.2147/IJGM.S351638
Checked for plagiarism Yes
Review by Single anonymous peer review
Peer reviewer comments 2
Editor who approved publication: Dr Scott Fraser
Meng Jiao,1 Facai Zhang,2 Wei Teng,3 Chengjun Zhou1
1Department of Pathology, The Second Hospital, Cheeloo College of Medicine, Shandong University, Jinan, People’s Republic of China; 2Department of Urology, Institute of Urology, West China Hospital, Sichuan University, Chengdu, Sichuan Province, People’s Republic of China; 3College of Business, Gachon University, Seongnam, 13120, Republic of Korea
Correspondence: Chengjun Zhou, Department of Pathology, The Second Hospital of Shandong University, 247 Beiyuan Street, Jinan, Shandong, 250033, People’s Republic of China, Email [email protected]
Purpose: MYB proto-oncogene like 2 (MYBL2) is a member of the MYB family of transcription factor genes and overexpressed in many cancers. We investigated the role of MYBL2 in the malignant progression of prostate cancer (PCa) and its relationship with immune infiltrates in PCa.
Methods: Gene expression level, clinicopathological parameters, Gene Ontology (GO) and Kyoto encyclopedia of genes and genomes (KEGG) pathway, tumor immune infiltration analysis were based on The Cancer Genome Atlas (TCGA) dataset. Gene set enrichment analysis (GSEA) and single-sample gene set enrichment analysis (ssGSEA) were conducted to analyze the correlation between MYBL2 and immune infiltrates. The data processing analysis based on R language. The relationship between MYBL2 expression and immune response in PCa was analyzed on TIMER 2.0.
Results: MYBL2 was overexpressed in PCa patients, and correlated with T-stage, Gleason score, primary therapy outcome and progress free interval (PFI) event. The multivariate Cox regression analysis revealed MYBL2 was an independent risk factor for PFI (HR=1.250, 95% CI=1.016– 1.537, p=0.035). The receiver operating characteristic (ROC) curve for MYBL2 (AUC=0.887) and nomogram also confirmed the diagnostic value of MYBL2 in the treatment of PCa patients. Based on mRNA expression of MYBL2, PCa patients were divided into MYBL2-high group and MYBL2-low group, and analysis of MYBL2 associated KEGG and GO pathways using R language revealed that 6 immune-related signaling pathways were enriched in MYBL2-high expression phenotype. GSEA analysis showed that 3 hallmark gene sets related to immune response were significantly enriched in MYBL2-high group, ssGSEA analysis found that MYBL2 expression correlated with the expression of many tumor immune lymphocytes (CD8+T cells, neutrophil cells, macrophage cells and so on) and immune check point inhibitors (CD276, BTLA, TNFRSF18, HAVCR2 and CD70).
Conclusion: MYBL2 is a novel independent prognostic biomarker and MYBL2 may play a crucial role in tumor immune microenvironment of PCa.
Keywords: prostate cancer, MYBL2, bioinformatics, prognosis, tumor immune microenvironment
Introduction
PCa is still a major cause of disease and mortality among men worldwide. Nearly 1.6 million men are diagnosed with and 366,000 men die of prostate cancer each year.1,2 PCa is a biologically heterogeneous disease and despite prostate specific antigen (PSA) screening can identified PCa patients, many have already developed metastases at the time of consultation.3 Currently, there is no biomarker that can accurately predicts prognosis and metastasis in PCa patients, which delaying optimal treatment and also causing over-treatment for some patients. It is important to identify potential micro-metastases in early stage PCa patients. Recently, an international, prospective study reported that targeted screening (IMPACT study) may identify aggressive PCa among early-stage PCa patients with high genetic risk, thus increasing their chances of survival, suggesting an ad hoc screening can offer a personalized screening for patients with already known mutation.4,5 Therefore, it remains an urgent need to identify additional key driver genes that could affect the composition of the immune micro-environment in PCa and predict prognosis.
Recently, tumor immune microenvironment has received increasing attentions, and the infiltration of specific immune cells in tumor is closely related to tumor proliferation, metastasis, drug resistance and prognostic outcome of patients.6–8 With some key discoveries in immune mechanisms and the emergence of advanced molecular diagnostic platforms, immunotherapy is re-emerging as a viable option for the treatment of PCa, particularly castration resistant prostate cancer (CRPC). Besides that, the use of immune checkpoint inhibitors has recently been successfully applied to treat many solid tumors, including lymphoma,9 liver,10 gastrointestinal,11 and breast cancers,12 making the use of immunotherapy for PCa a promising endeavor.13
The MYB gene family is composed of three members: MYB, MYBL1 and MYBL2, also known as c-MYB, A-MYB, and B-MYB.14,15 In mammals, MYB expression is mainly expressed in hematopoietic cells, colonic crypts and brain,16–18 whereas MYBL1 is expressed in several regions of the developing central nervous system, germinal B-lymphocytes and reproductive systems.19 In contrast, MYBL2 is expressed in basically all proliferating cells, which plays important regulatory roles in cell cycle progression, cell survival and differentiation.20,21 In the malignant transformation of tumor cells, MYBL2 mediates the dysregulation of these properties. Indeed, MYBL2 is overexpressed in many cancers and is associated with poor patient prognosis.22 A pan-cancer statistical and experimental analysis study showed that MYBL2 is associated with the prognosis and immunotherapy of multiple cancers such as breast, liver and glioma, as an oncogene.23 Besides, previous study found that MYBL2 was associated with PCa metastasis and promotes progression of CRPC, microarray-based bioinformatic analyses revealed that MYBL2 was significantly overexpressed in prostate metastases and WISH-PC14 xenografts, derived from an androgen-independent metastatic prostate tumor.24 Moreover, MYBL2 could promote YAP1 transcriptional activity via modulating the activity of the Rho GTPases RhoA and LATS1 kinase in androgen-dependent PCa cells, facilitating castration-resistant growth and metastatic capacity. Our previous study also found that miR-30a could inhibit PCa androgen independent growth by targeting MYBL2.25,26 However, studies of MYBL2 in the immune infiltration of PCa have been virtually unreported. For these reasons, we investigated the relationship between MYBL2 and the prognosis of PCa and its correlation with immune infiltration using bioinformatics technology, so as to assess the value of MYBL2 as an oncogenic element in the diagnosis of PCa.
In our study, we found that MYBL2 is upregulated in PCa, and correlated with poor clinical characteristics and risk factors. Furthermore, MYBL2 participate in the immune response of tumor microenvironment in PCa progression. In a nutshell, our study is a pioneering statistical analysis of MYBL2 and links the overexpression of MYBL2 and poor survival rates in PCa, suggesting MYBL2 plays an important role in the immune infiltrates of PCa.
Materials and Methods
Patient Data Sets
MYBL2 expression data of pan-cancer and GTEx were obtained from TIMER2.0 database (http://timer.comp-genomics.org/).The mRNA expression data of PCa datasets (551 samples, transcriptome RNA-seq data) from the cancer genome atlas (PRAD) and clinical information were downloaded from TCGA database (https://www.cancer.gov/about-nci/organization/ccg/research/structural-genomics/tcga). Correlation of MYBL2 with CD8+T cells, neutrophil cells, macrophage cells, monocyte cells, MDSCs and Tregs in PRAD was analyzed by TIMER2.0 database (http://timer.comp-genomics.org/).
Functional Enrichment Analysis
DESeq2 package was used to explore the differential expression of mRNAs.27 The adjusted p value was applied to correct the false positive results. Adjusted p<0.05 and |log2 (Fold Change) | >1 were defined as the thresholds for the screening of differentially expressed genes (DEGs). “ClusterProfiler” and “org.Hs.eg.db” package were used to perform GO and KEGG analysis.28 In the enrichment results, top 12 pathways were considered to be meaningful pathways under the condition that adjusted p<0.05 is satisfied.
Evaluation of Diagnostic Performance
The “pROC” and “timeROC” packages were applied to evaluate the diagnostic value of MYBL2 in the univariate logistic regression analysis and univariate Cox regression analysis at a specific point in time. The sample status (PCa or normal samples) and progress free status were deemed as dependent variables in the logistic regression analysis and univariate Cox regression analysis, respectively. We could succeed to analyze and compare the diagnostic performance of MYBL2 via the areas under ROC curves (AUC).
Gene Set Enrichment Analysis (GSEA)
GSEA is a practical tool used to assess the trend in the distribution of genes of a predefined gene set ordered by their correlation with the phenotype, so as to determine their contribution to the phenotype. In the PRAD database, PCa cases were divided into two groups according to the median expression value of MYBL2 (MYBL2-high and MYBL2-low). GSEA was performed to identify related gene pathways found to be correlated with MYBL2 gene expression. For each analysis, gene set permutation was performed 1000 times. Gene sets with a normal p-value less than 5% and false discovery rate (FDR) less than 25% were considered as significantly enriched. We chose all hallmark gene sets with significant enrichment for MYBL2-high group and displayed gene sets enrichment plots.
Immune Cells Infiltration Analysis
Immune infiltration analysis of PRAD was performed by single-sample gene set enrichment analysis (ssGSEA) in the “GSVA” R package.29 Then Spearman correlation was performed to explore the association of immune cells with MYBL2 expression.
Statistical Analyses
All statistical analyses were performed with R (V 4.0.3) and R package “ggplot2”30 was used to visualize expression differences. Mann–Whitney U-test and Wilcoxon signed rank test were used to determine the differences between PCa tissues and adjacent normal tissues. The association between clinical features and MYBL2 expression were analyzed using Dunn’s test, Wilcoxon rank sum test and logistic regression. Kaplan-Meier and Log rank tests were conducted with the survminer package10 for survival analysis. Subsequently, univariate and multivariable analyses were performed using the Cox proportional hazards regression models to verify the independent prognostic factors of MYBL2 expression. ROC curve and time-dependent ROC curve was performed to detect the diagnostic value of MYBL2 using the “pROC” and “timeROC” package,31 and a nomogram was constructed to predict 3-, 5- and 10-year PFI for PCa patients. The association between MYBL2 and immune check point inhibitors were analyzed by Pearson’s test. Statistically significant difference was considered when p<0.05.
Results
MYBL2 is Overexpressed in Prostate Cancer
First, we analysed the RNA-seq data of the GTEx and TCGA databases. It showed that there were higher MYBL2 levels in 19 cancer samples compared to normal samples (Figure 1A), unpaired expression data analyses showed that the mRNA expression levels of MYBL2 in PCa tissues were significantly higher than those in normal tissues (Figure 1B), which indicated that the mRNA expression of MYBL2 was abnormally expressed across different cancer types. Then, we analysed 52 pairs of PCa tissues obtained from the TCGA databases. The level of MYBL2 was markedly higher in PCa tissues than in peritumoral tissues (Figure 1C). To further investigate the correlation between MYBL2 expression level and PCa clinical characteristics, a total of 499 patients with complete clinical and survival information were acquired from TCGA database (Table 1).
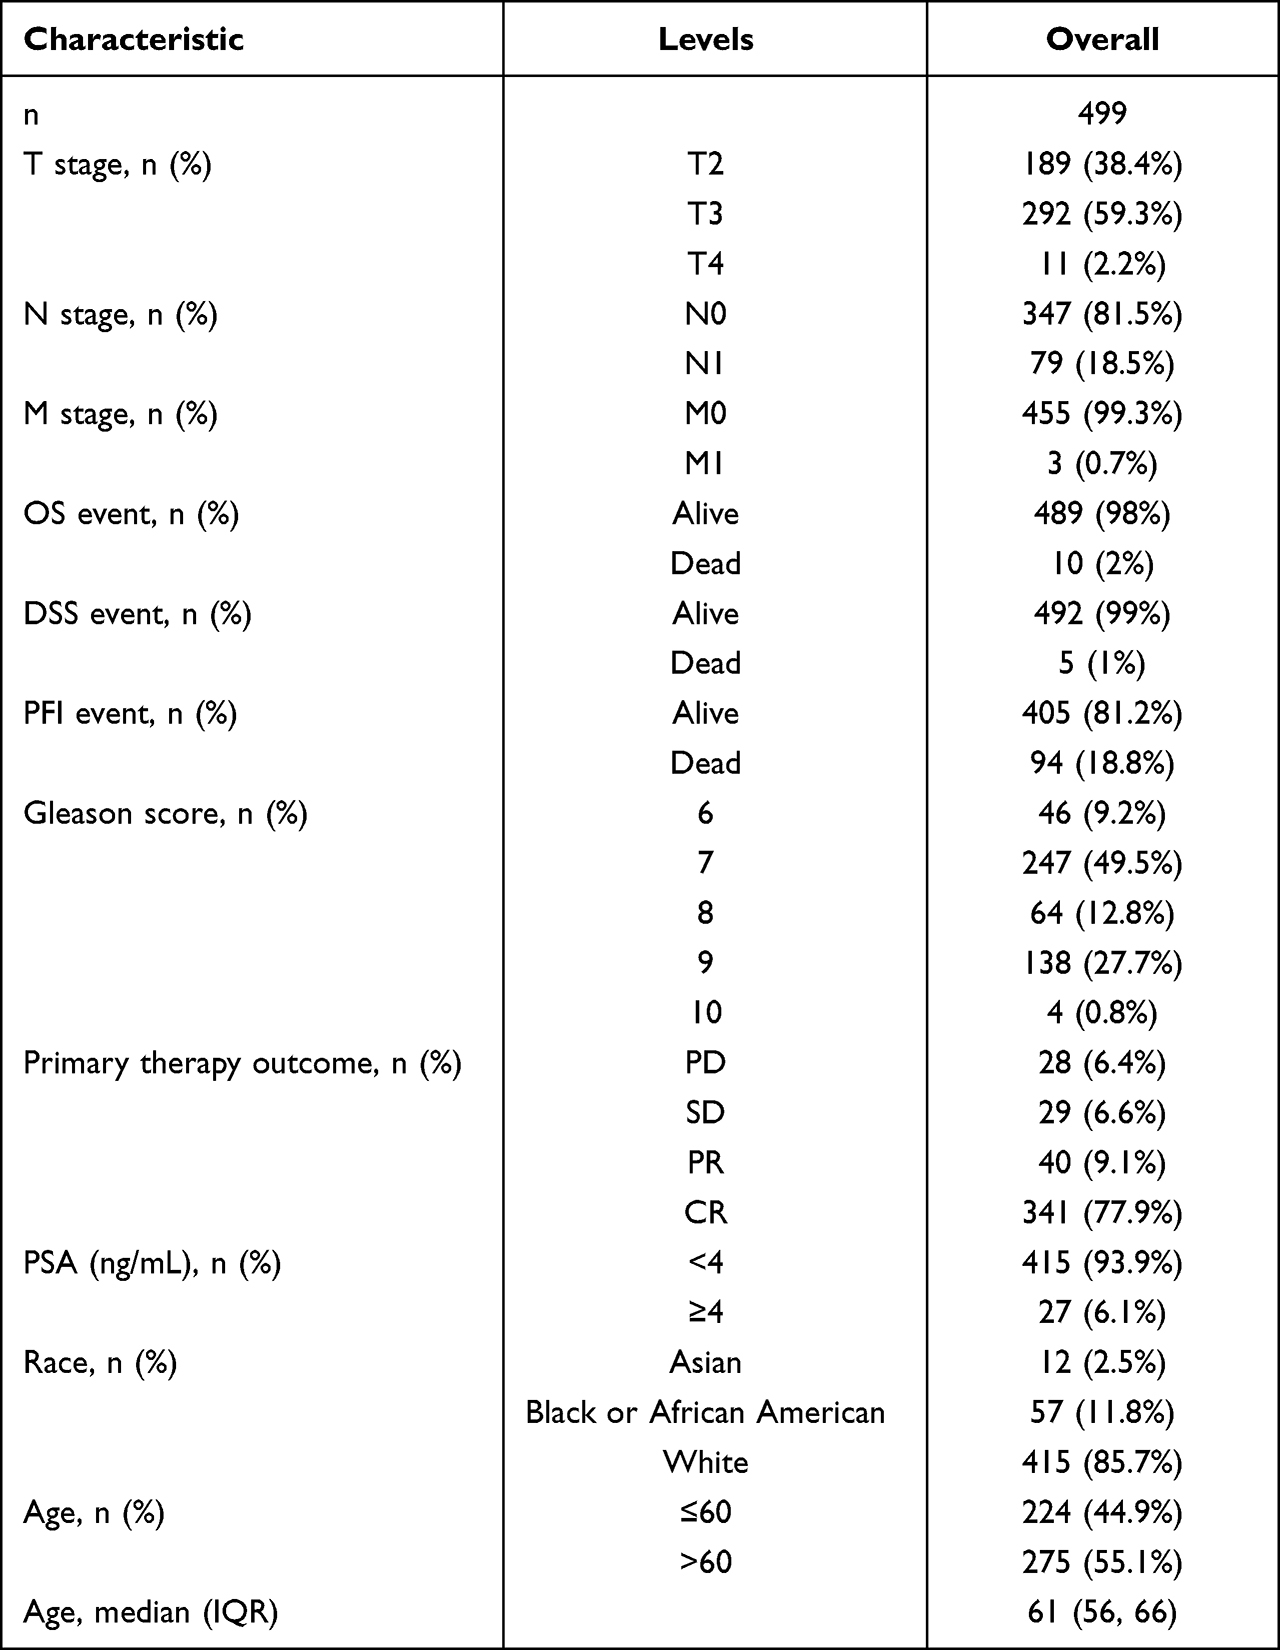 |
Table 1 The 499 Patients with Complete Clinical and Survival Information of PRAD |
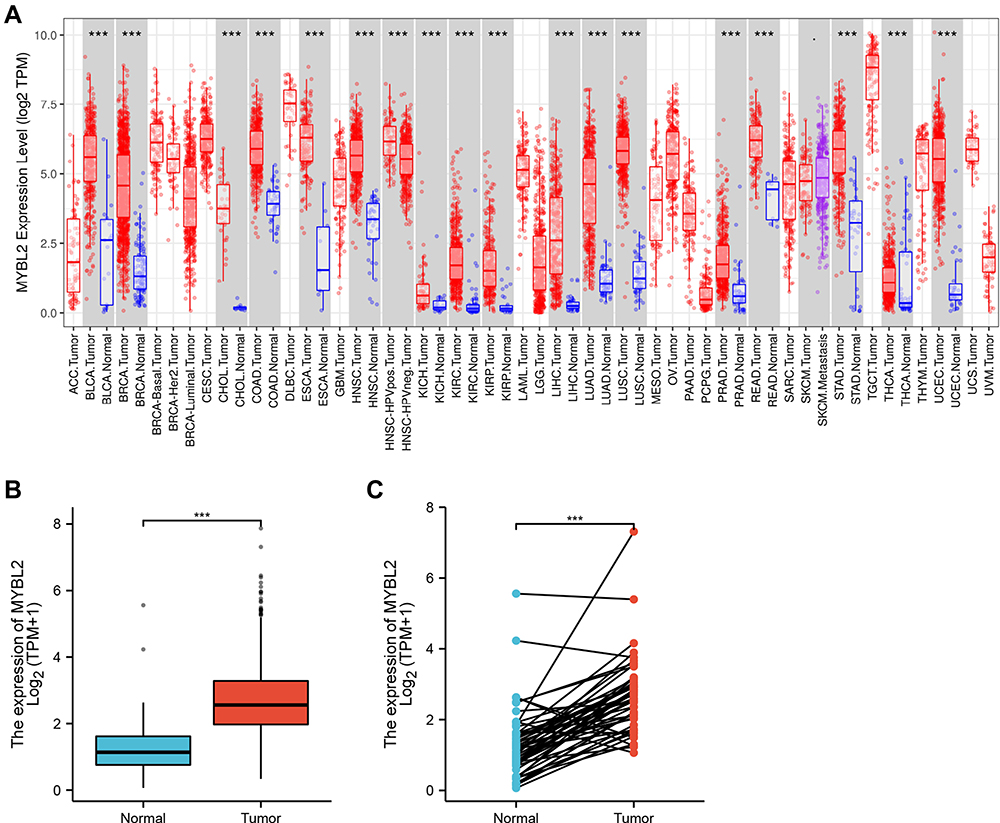 |
Figure 1 The RNA-seq data of the GTEx and TCGA databases. (A) MYBL2 expression in tumor and normal tissues in TCGA and GTEx pan-cancer data (TIMER2.0). (B) TCGA and GTEx database analysis showing MYBL2 expression in PCa samples (n=499) and normal prostate samples (n=52). (C) TCGA and GTEx database analysis showing MYBL2 expression in 52 PCa and matched-adjacent normal samples, (***p<0.001). |
MYBL2 Correlates with Tumor Progression and Adverse Prognosis in Prostate Cancer
In order to evaluate the association between MYBL2 and clinical pathological characteristics of PCa samples, we performed logistic regression analysis, Dunn’s test and Wilcoxon rank sum test. As shown in Table 2 and Figure 2A–D, higher expression levels of MYBL2 were observed in patients with high T stage (p<0.001), high Gleason score (p<0.001), worse primary therapy outcome (p<0.001) and worse PFI (p<0.001). However, no statistically significant correlation was found between the expression levels of MYBL2 and other clinical pathological characteristics, including age (p=0.263), PSA level (p=0.270), N stage (p=0.023), and M stage (p=0.600). Taken together, these results suggested that MYBL2 expression was correlated with high Gleason score, high T stage, worse primary therapy outcome and shorter PFI.
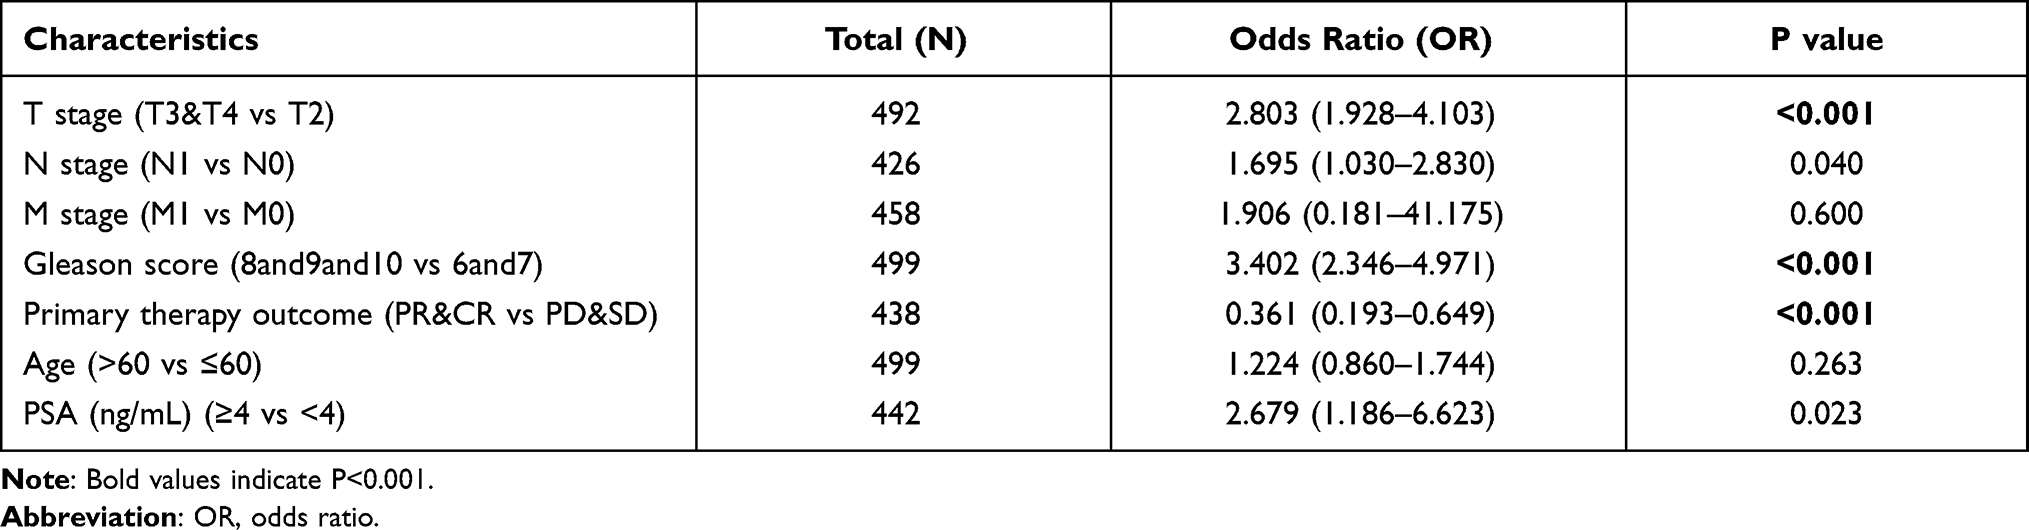 |
Table 2 Logistic Analysis of the Association Between MYBL2 Expression and Clinical Characteristics |
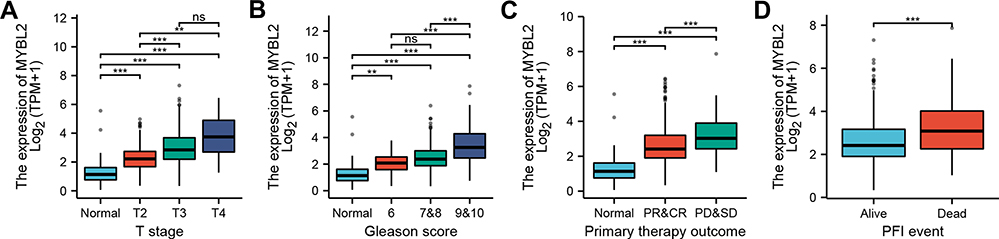 |
Figure 2 Box plot evaluating MYBL2 expression of patients with PCa according to different clinical characteristics: (A) T stage; (B) Gleason Score; (C) Primary therapy outcome; (D) PFI event, (ns p≥0.05, ** p<0.05, *** p<0.001). |
High Expression of MYBL2 is an Independent Risk Factor for Progress Free Interval
The Kaplan-Meier survival analysis showed that high MYBL2 expression was associated with poor prognosis (p<0.001), as shown in Figure 3A. Subgroup analysis by different clinical features demonstrated that high MYBL2 expression was significantly associated with poor prognosis in PCa cases more than 60 years old (p=0.026), residual tumor: R1&R2 (p<0.001), and T stage: T3&T4 (p=0.007), as shown in Figure 3B–D, which illustrated the stability and practicability of MYBL2 for diagnosis. The Univariate Cox regression analysis demonstrated that high MYBL2 expression was significantly correlated with shorter PFI (hazard ratio [HR]=1.620, 95% CI=1.373–1.912, p<0.001). The Multivariate Cox regression analysis confirmed MYBL2 gene expression was an independent risk factor for PFI in PRAD (HR=1.250, 95% CI=1.016–1.537, p=0.035), as shown in Table 3 and Figure 3E.
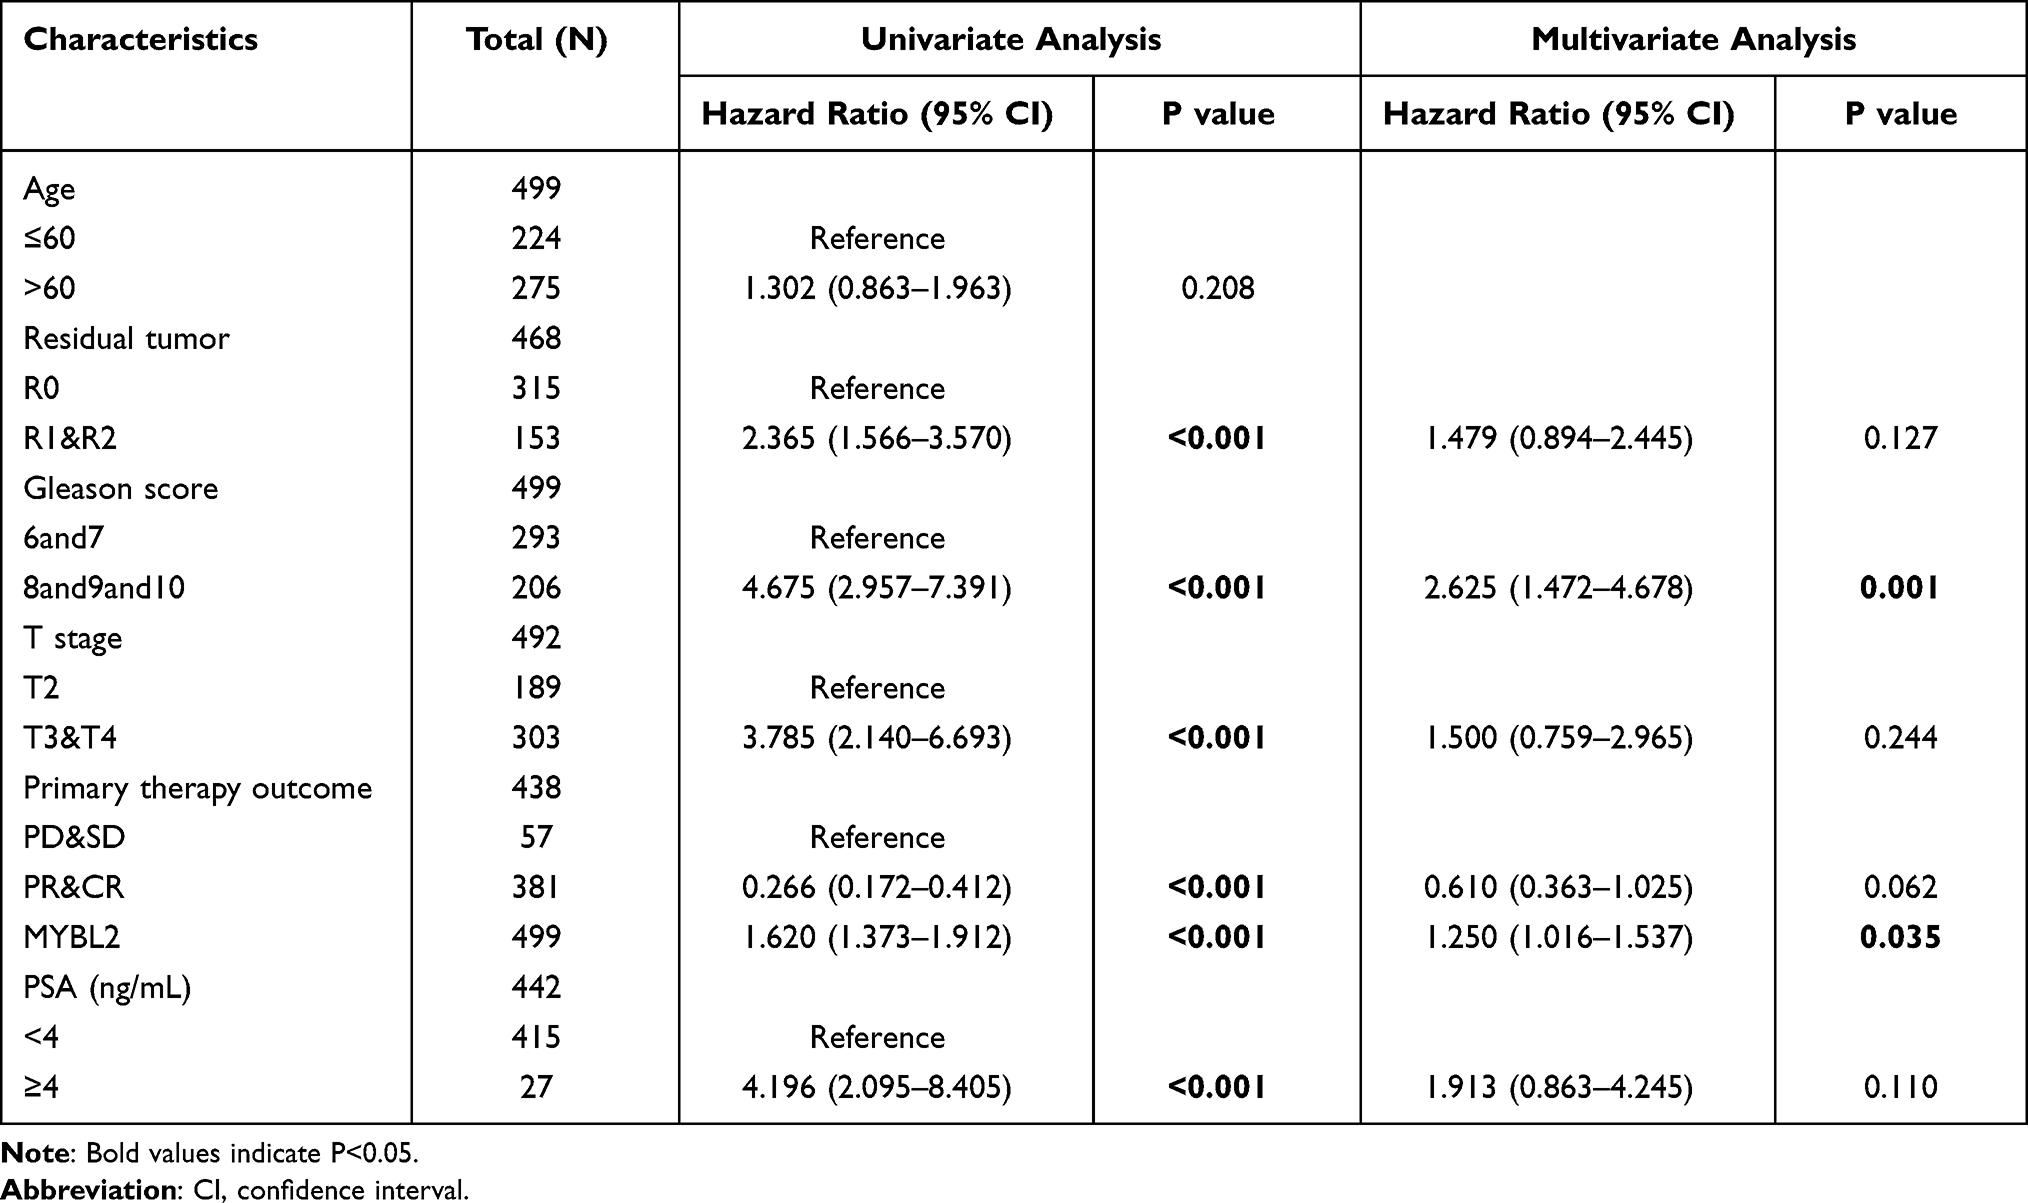 |
Table 3 Univariate and Multivariate Cox Regression Analyses of Clinical Characteristics Associated with Progress Free Interval |
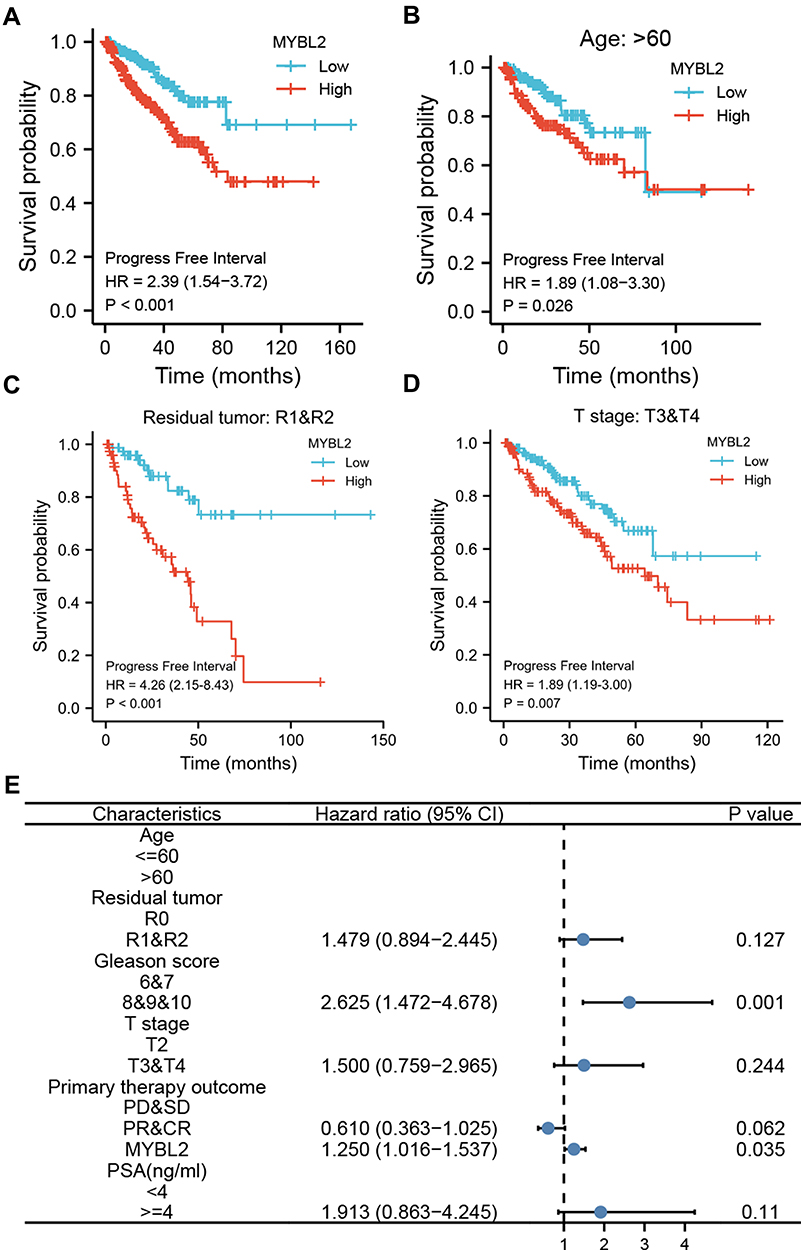 |
Figure 3 Kaplan-Meier curve for PFI in PRAD. (A) Kaplan-Meier curve for MYBL2 in all tumor patients; (B–D) Subgroup analysis for > 60 years old, Residual tumor: R1&R2, T stage: T3&T4. (E) Forest plot of the multivariate Cox regression analysis in PRAD. |
Diagnostic Value of MYBL2 in PCa
Next, the ROC curves were applied to evaluate the discriminative capability and diagnostic value of MYBL2 expression. As showed in Figure 4A, the ROC curve showed that MYBL2 had an AUC value of 0.887 (95% CI: 0.827–0.947). At a cutoff of 0.826, the sensitivity and specificity of MYBL2 were 82.7% and 84.0%, respectively. These findings indicated that MYBL2 could be a promising biomarker to differentiate PCa tissues from normal tissues. The positive predictive value was 35.2% and the negative predictive value was 97.9%. Furthermore, we also performed time-dependent ROC curves and found that the AUC value of MYBL2 had relatively good performance early on, which declined over time (Figure 4B). Then, we constructed a nomogram based on the results of the multivariate Cox proportional hazards analysis to predict the 3-, 5-, and 10-year survival probability of patients by combining the expression level of MYBL2 with clinical variables. The total score was 0–240, a high score indicates a lower likelihood of survival (Figure 4C).
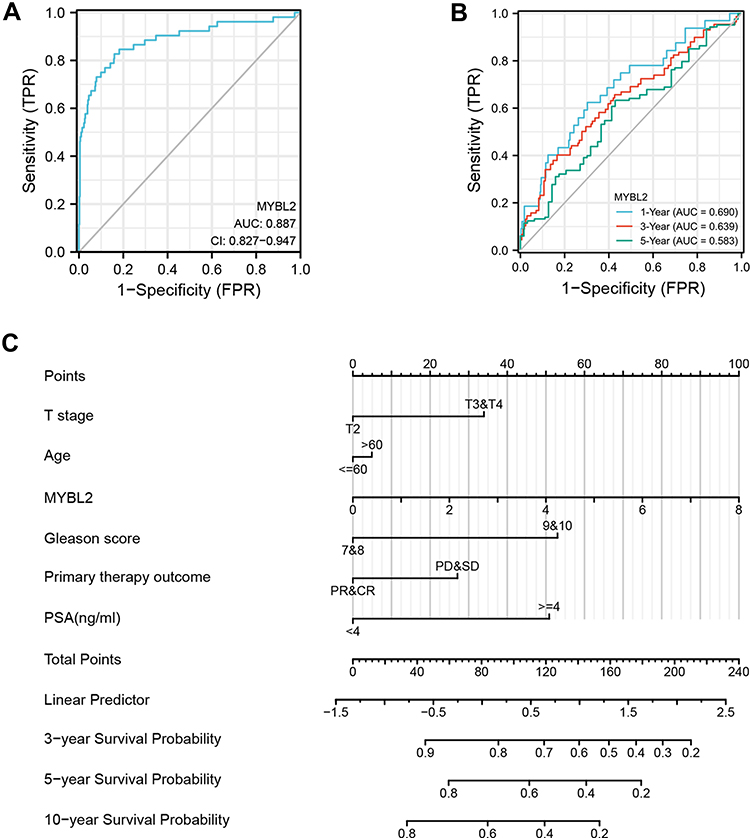 |
Figure 4 Diagnostic value of MYBL2 expression in PRAD. (A) ROC curve of MYBL2 in normal prostate tissue and PCa. (B) Time-dependent ROC curve of MYBL2 in normal prostate tissue and PCa. (C) Nomogram for predicting probability of PCa patients with 3-, 5- and 10-year PFI. |
Biological Function of MYBL2 in PCa
Next, to further confirm the underlying biological function of MYBL2 in PCa, the transcriptome data from TCGA was analyzed by functional enrichment. Differentially expressed genes (DEGs), a popular method to explore the potential biological role by enrichment analysis, are applied for the study. The samples of PCa were divided into two groups, including MYBL2-high and MYBL2-low, according to the median expression level of MYBL2. Next, we compared DEGs analysis between MYBL2-high group and MYBL2-low group with |log2FC| > 1 and adjusted P < 0.05. As shown in the volcano plot, 1129 genes were screened out and regarded as DEGs, including 680 upregulated genes and 449 downregulated genes (Figure 5A). To further determine the potential function of MYBL2, we performed a series of enrichment analyses, including KEGG pathways enrichment and GO biological function enrichment. The results indicated that most of these genes were linked to the events such as regulation of humoral immune response mediated by circulating immunoglobulin, cell cycle, retinol metabolism, ascorbate and aldarate metabolism, antigen binding, immunoglobulin receptor binding, motor activity, immunoglobulin complex and so on. Then we found that there were 6 immune-related signaling pathways enriched in MYBL2-high expression phenotype: humoral immune response mediated by circulating immunoglobulin, antigen binding, immunoglobulin receptor binding, immunoglobulin complex, complement activation and immunoglobulin complex, circulating protein activation cascade (Figure 5B and C). On the other hand, we performed GSEA using the MYBL2-high data set to identify signaling pathways that were differentially activated in PRAD. In MYBL2-high expression phenotype, 30 out of 50 gene sets were upregulated and 17 gene sets were significantly enriched at nominal p< 0.05, NES > 1.0 and FDR value < 0.25. The significantly upregulated hallmark gene sets involving in immune response were as follows: “HALLMARK_ALLOGRAFT_REJECTION” “HALLMARK_INTERFERON_ALPHA_RESPONSE” and “HALLMARK_INTERFERON_GAMMA_RESPONSE”. All enriched gene sets were shown in Table 4 and snapshot of enrichment results involving in immune response were shown in Figure 5D–F.
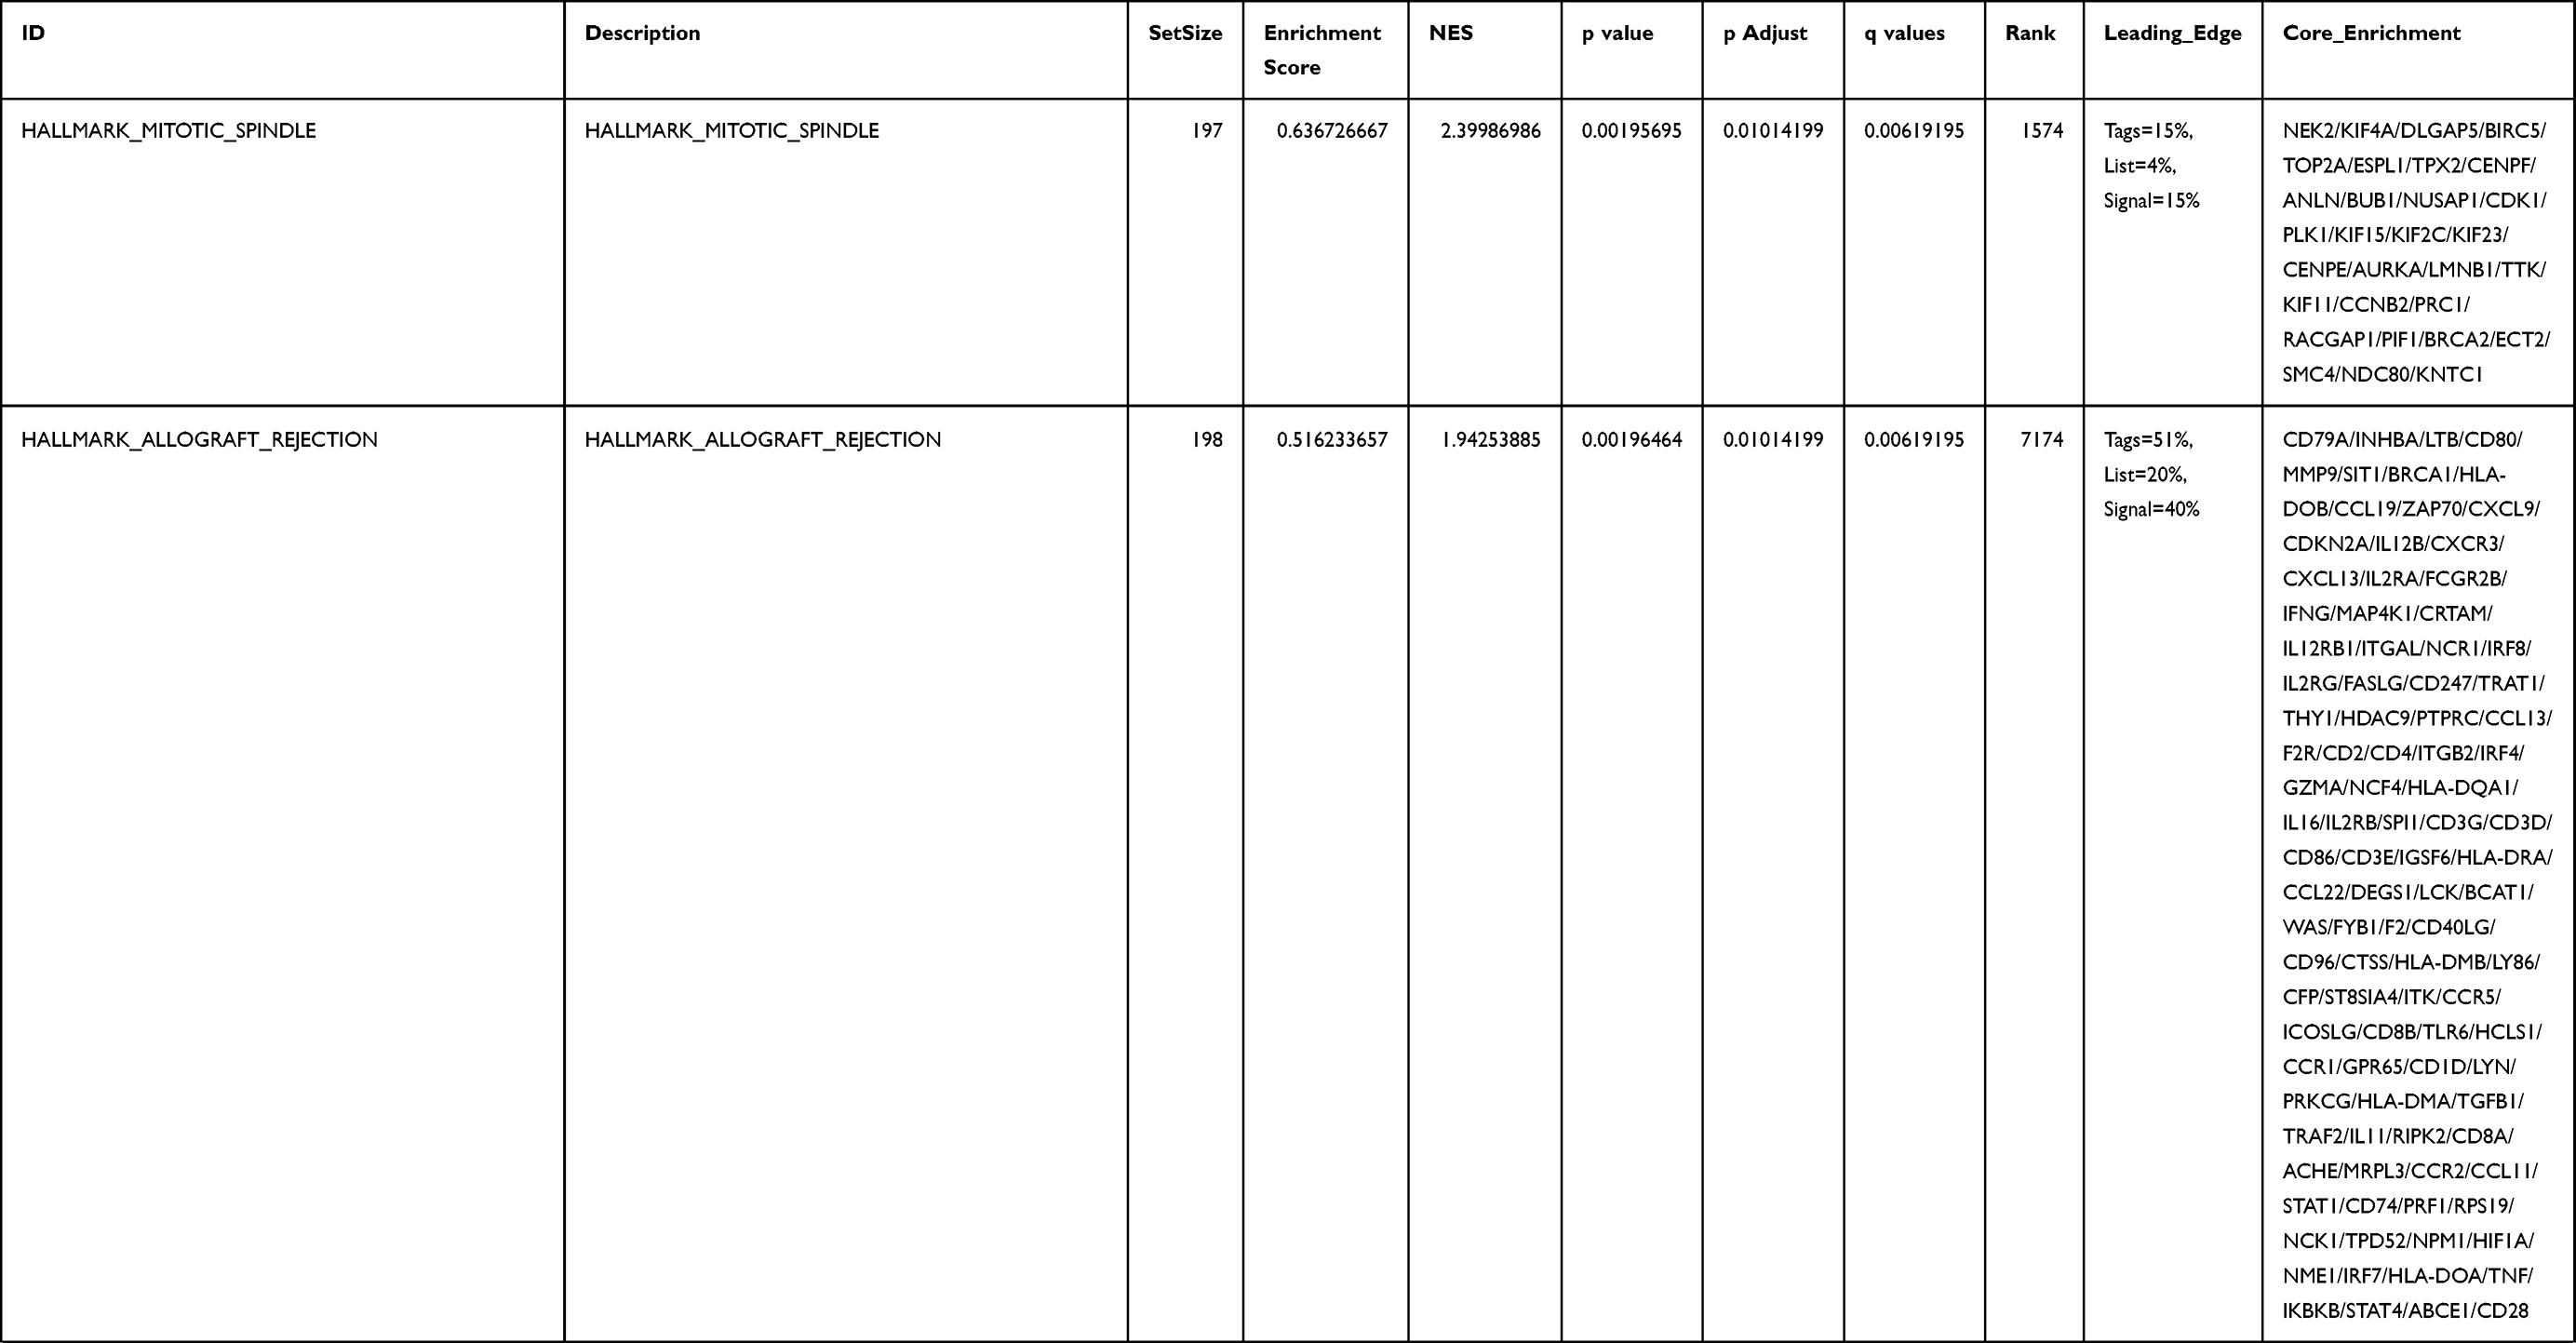 | 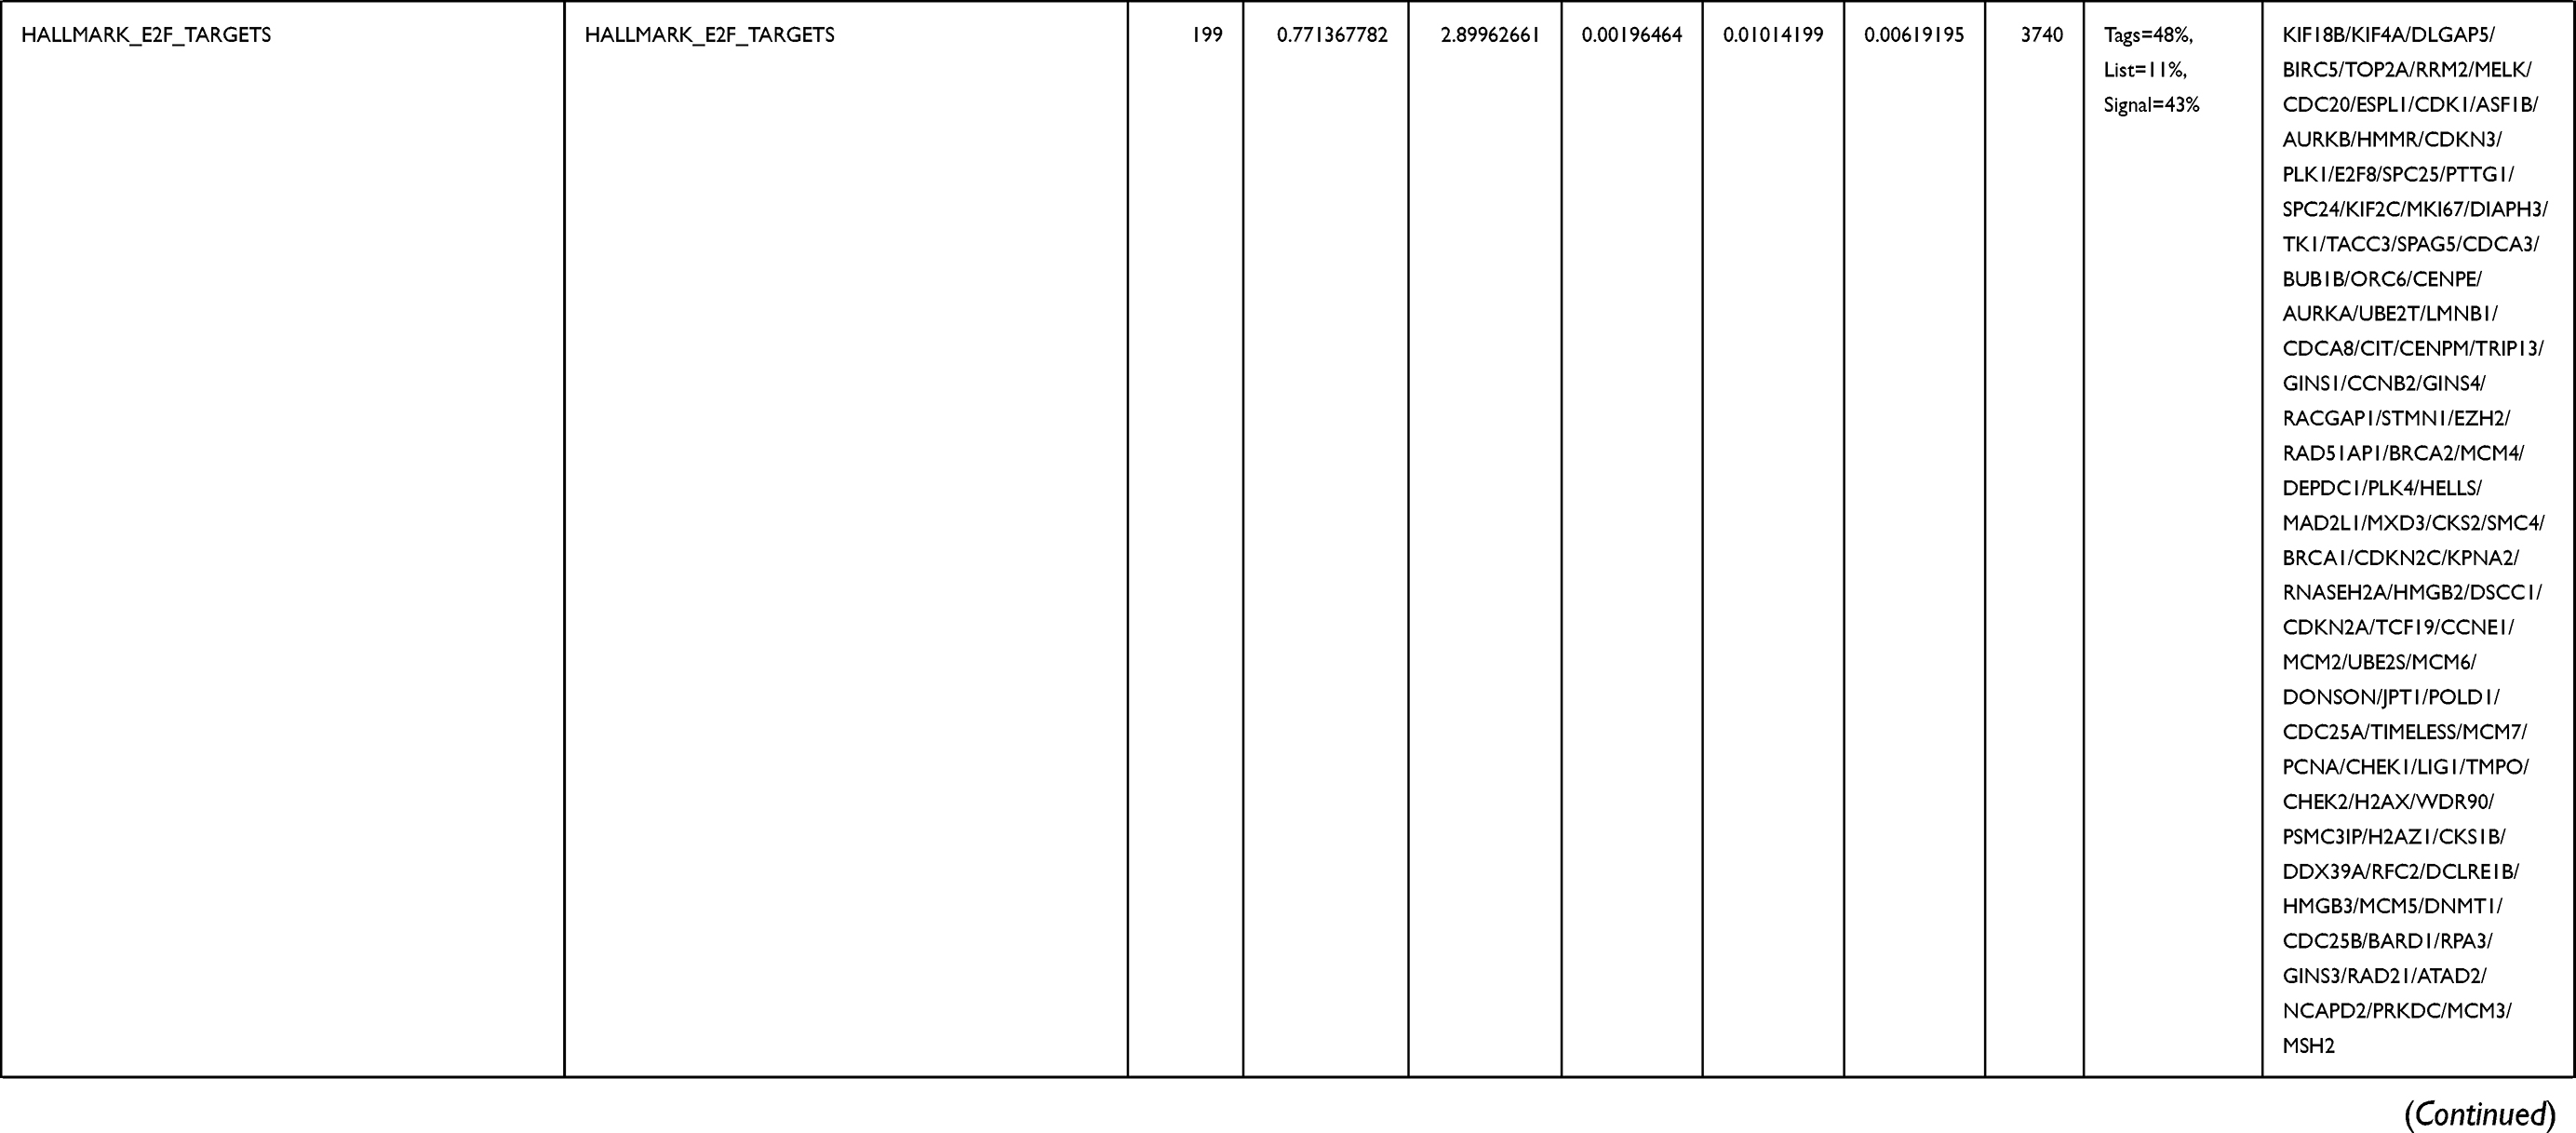 |  |  | 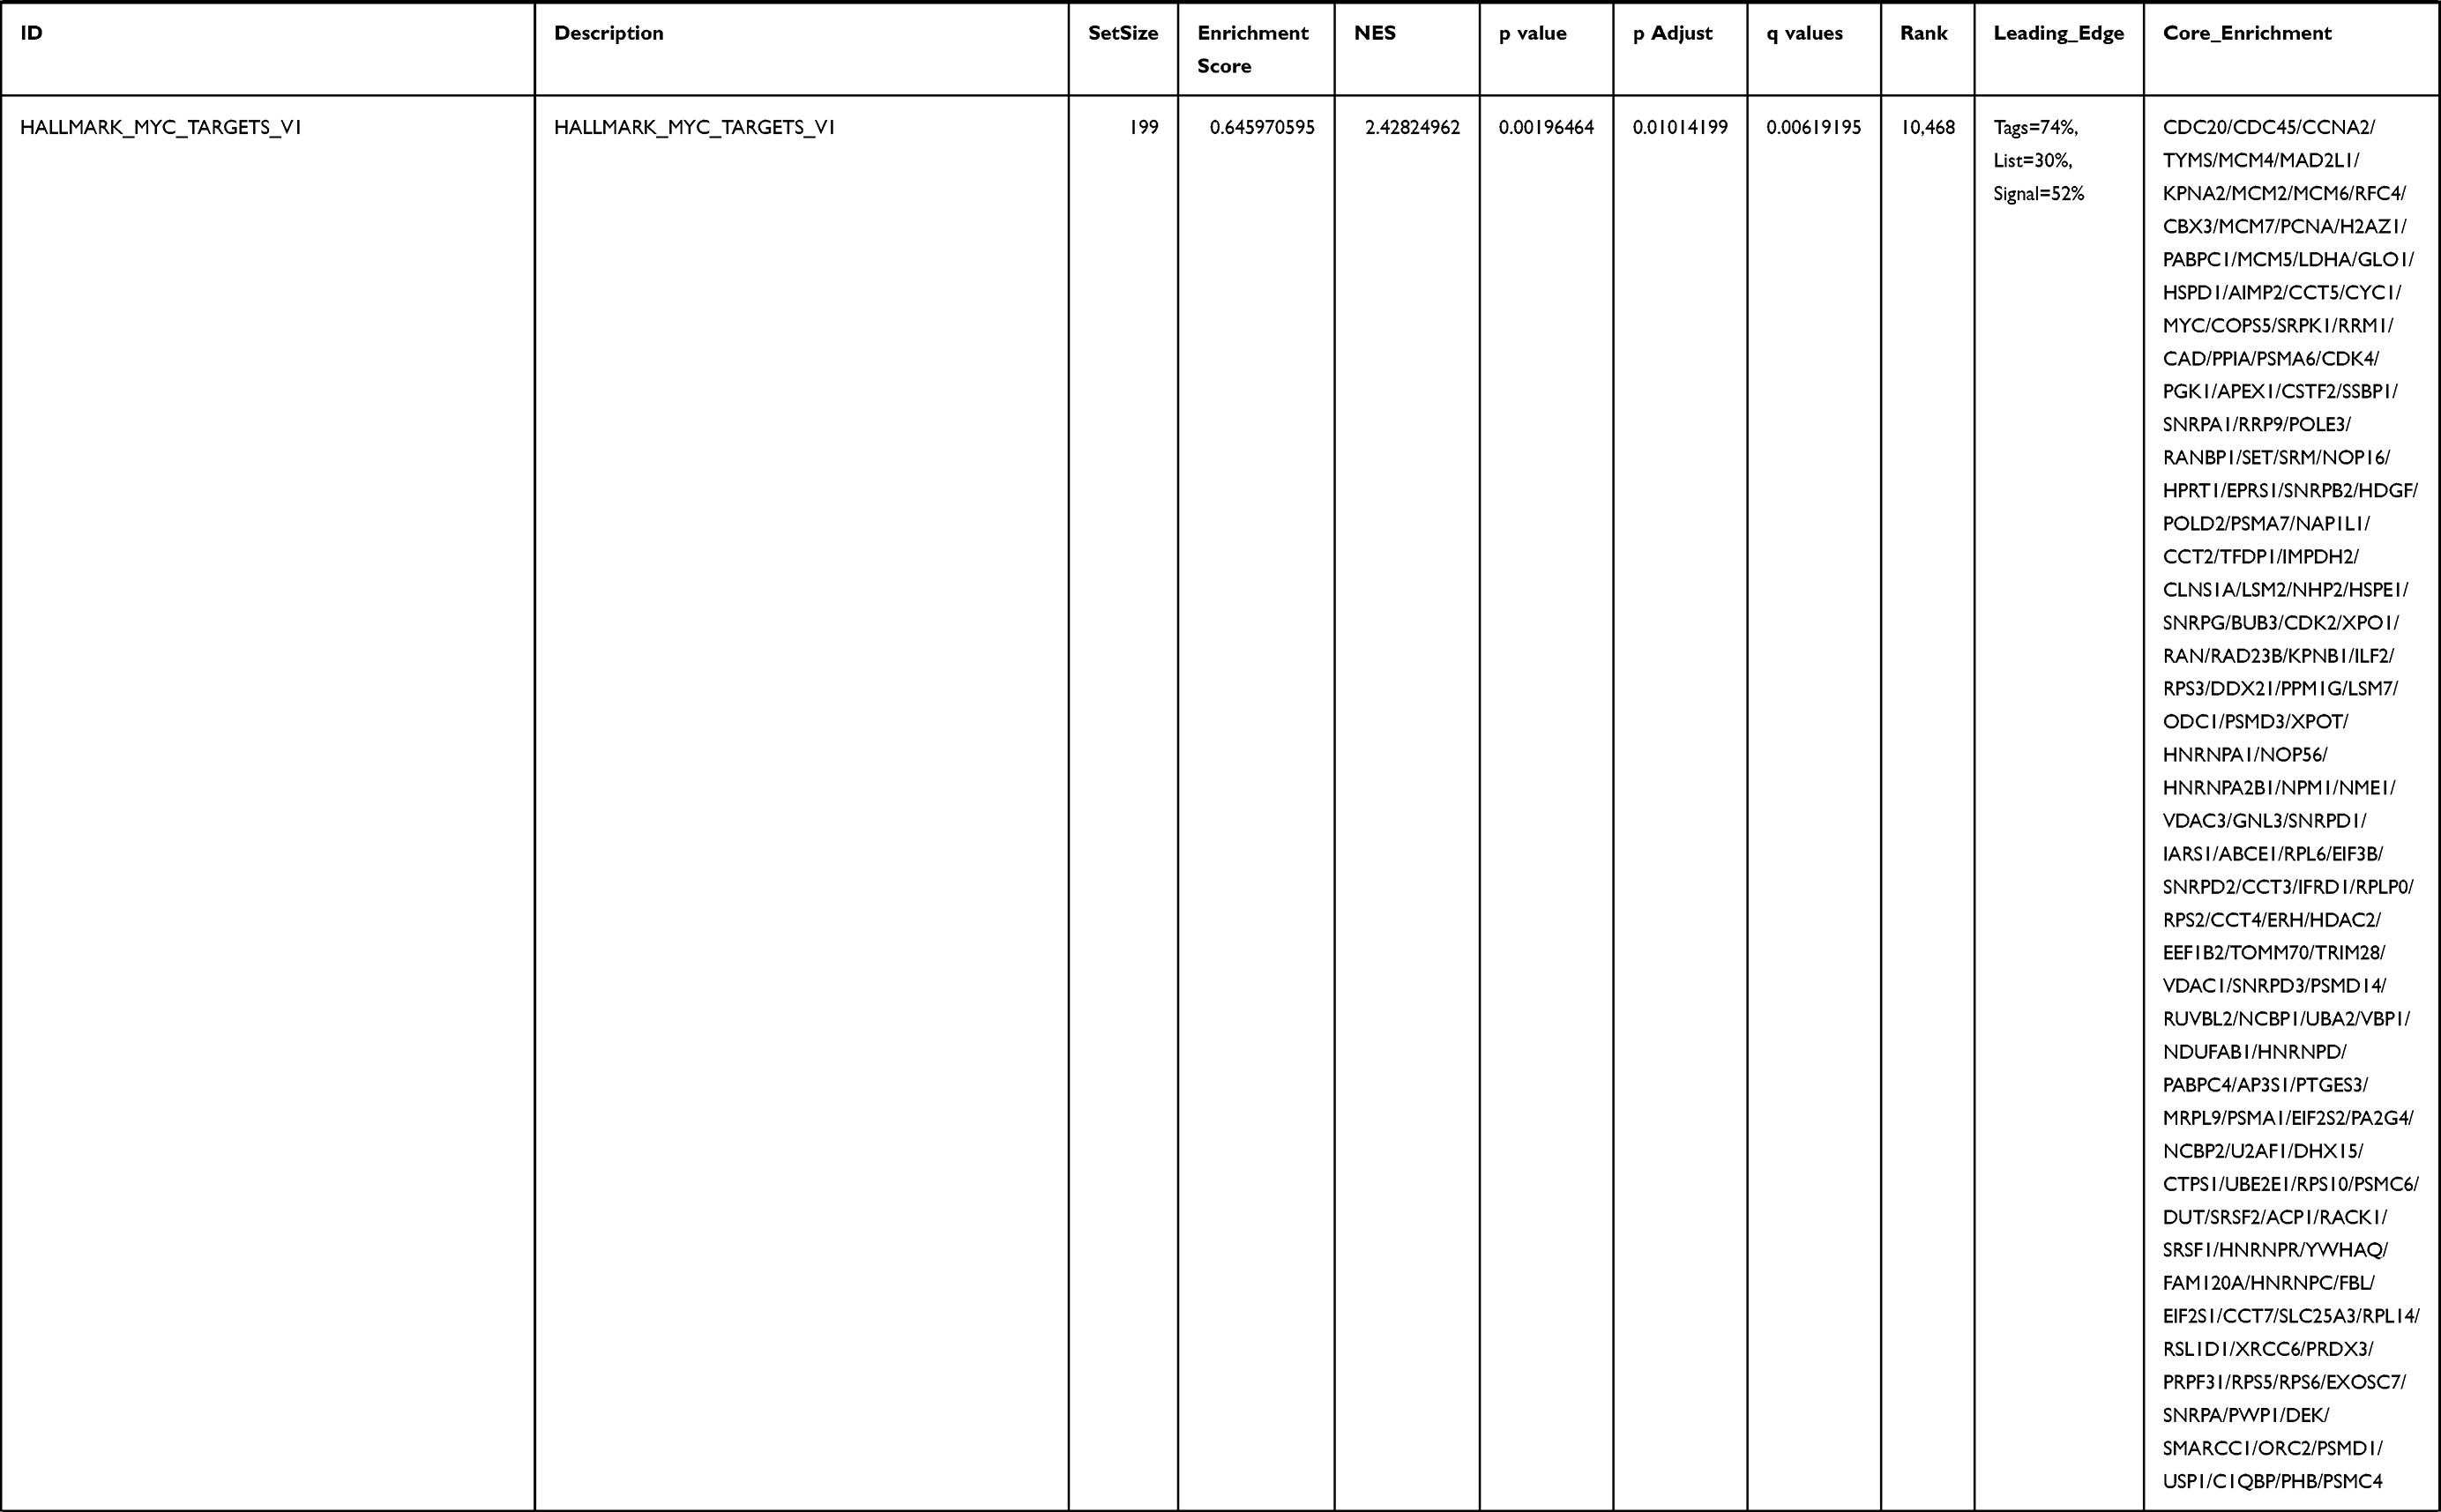 | 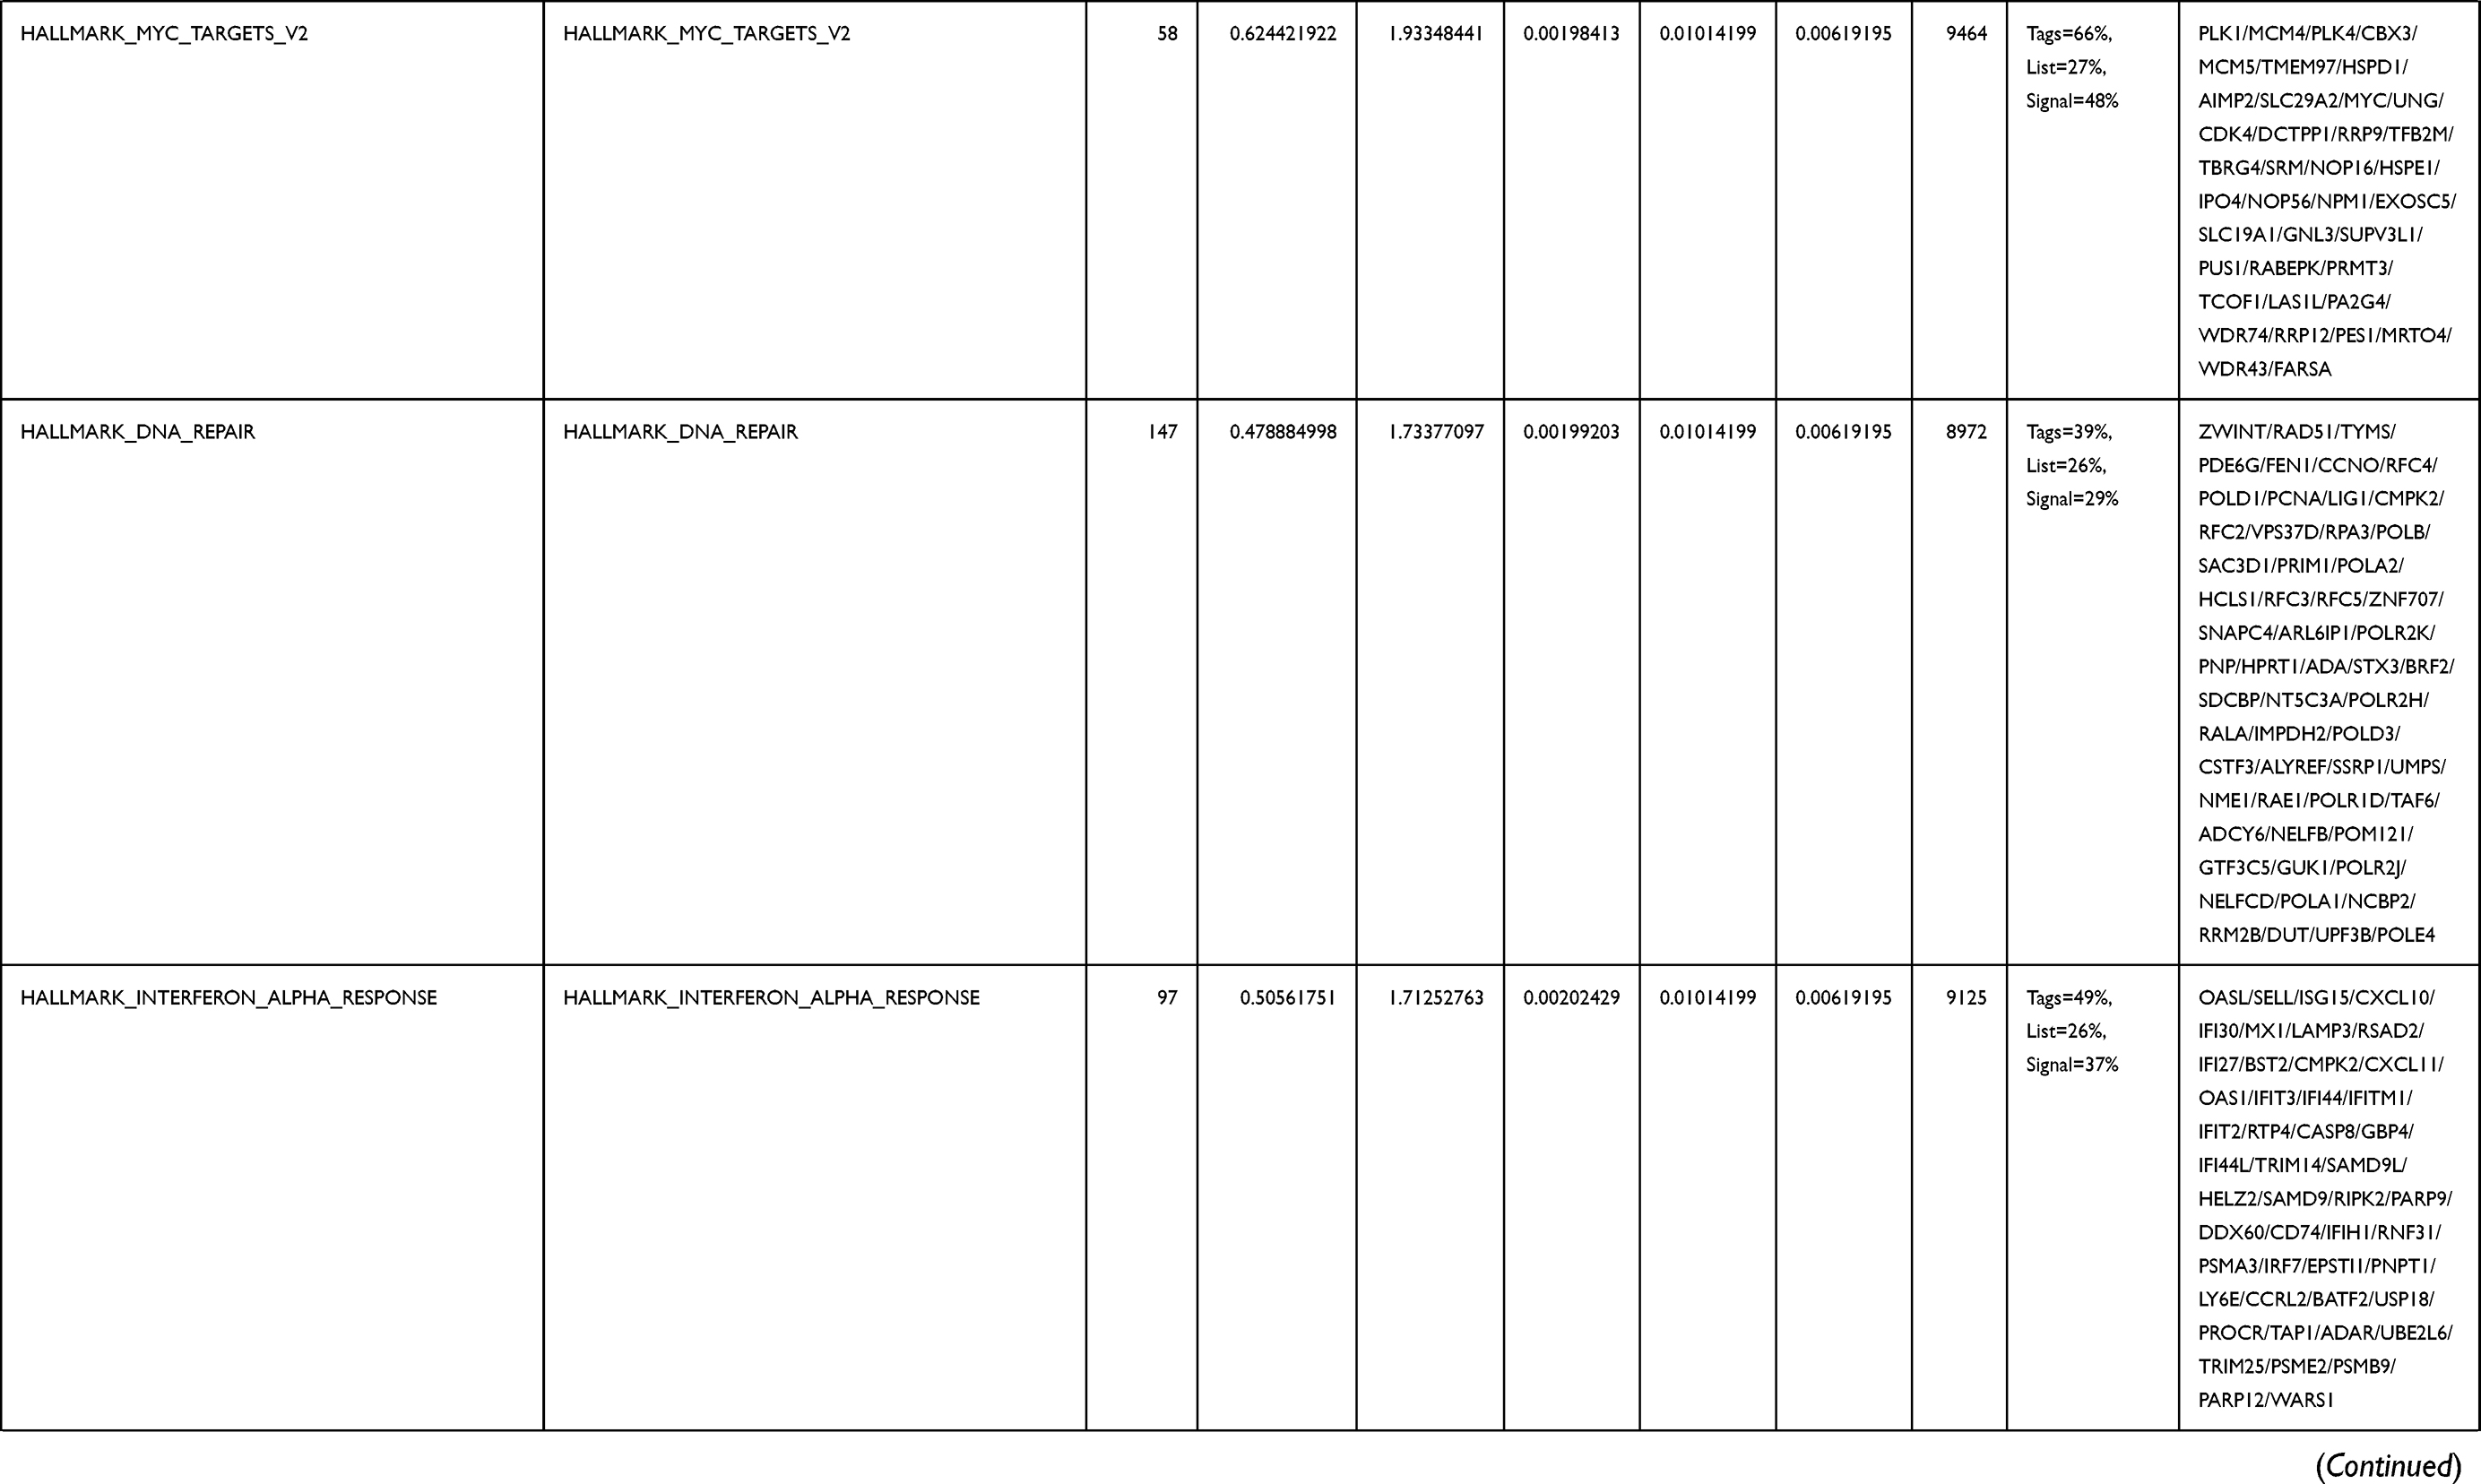 | 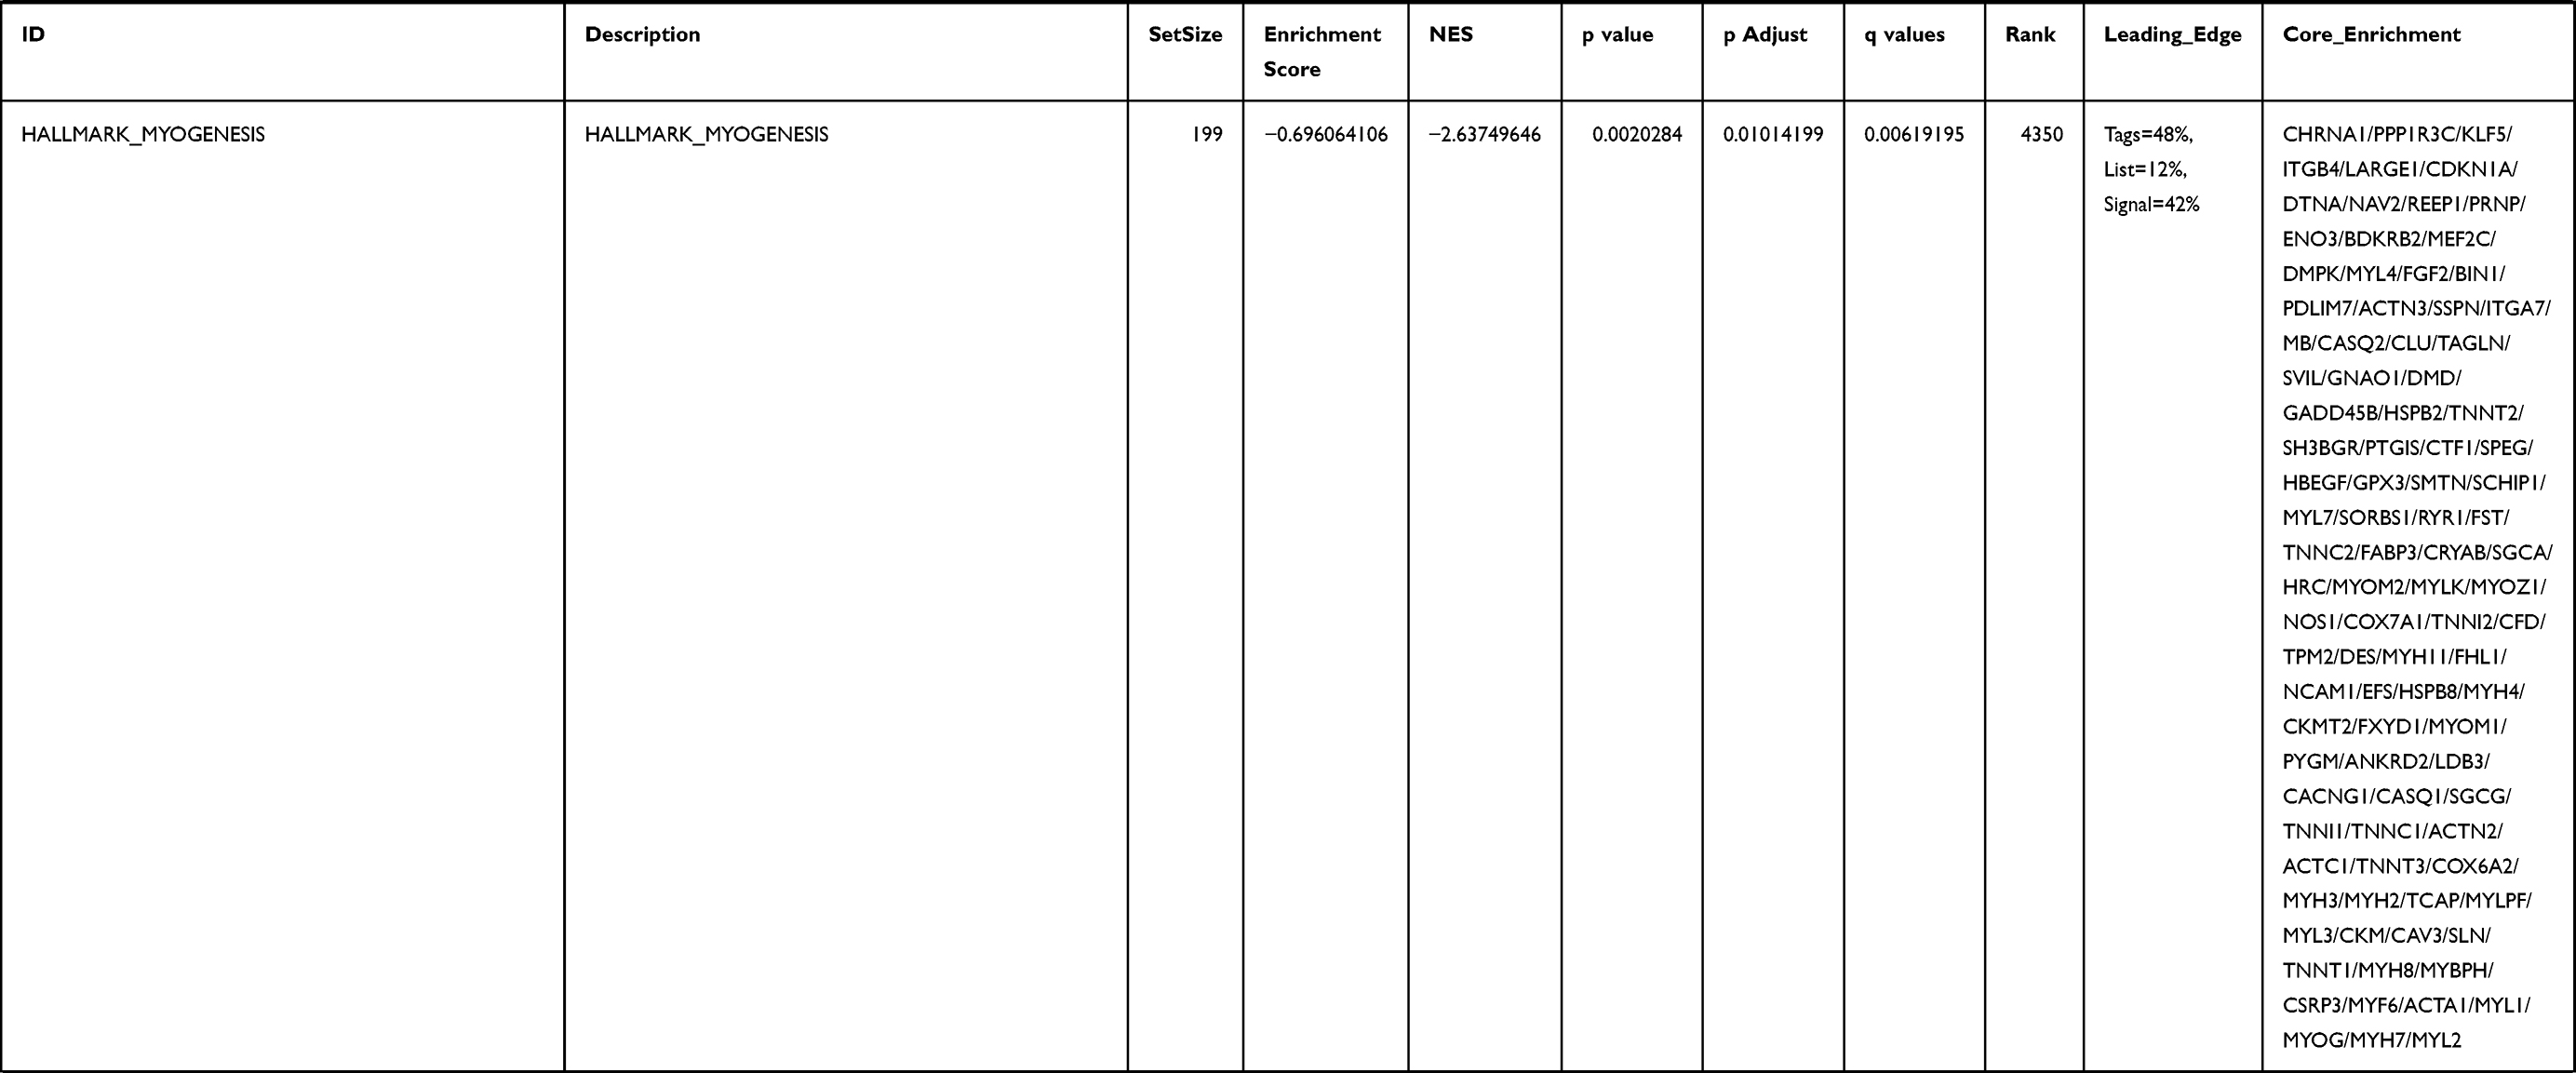 | 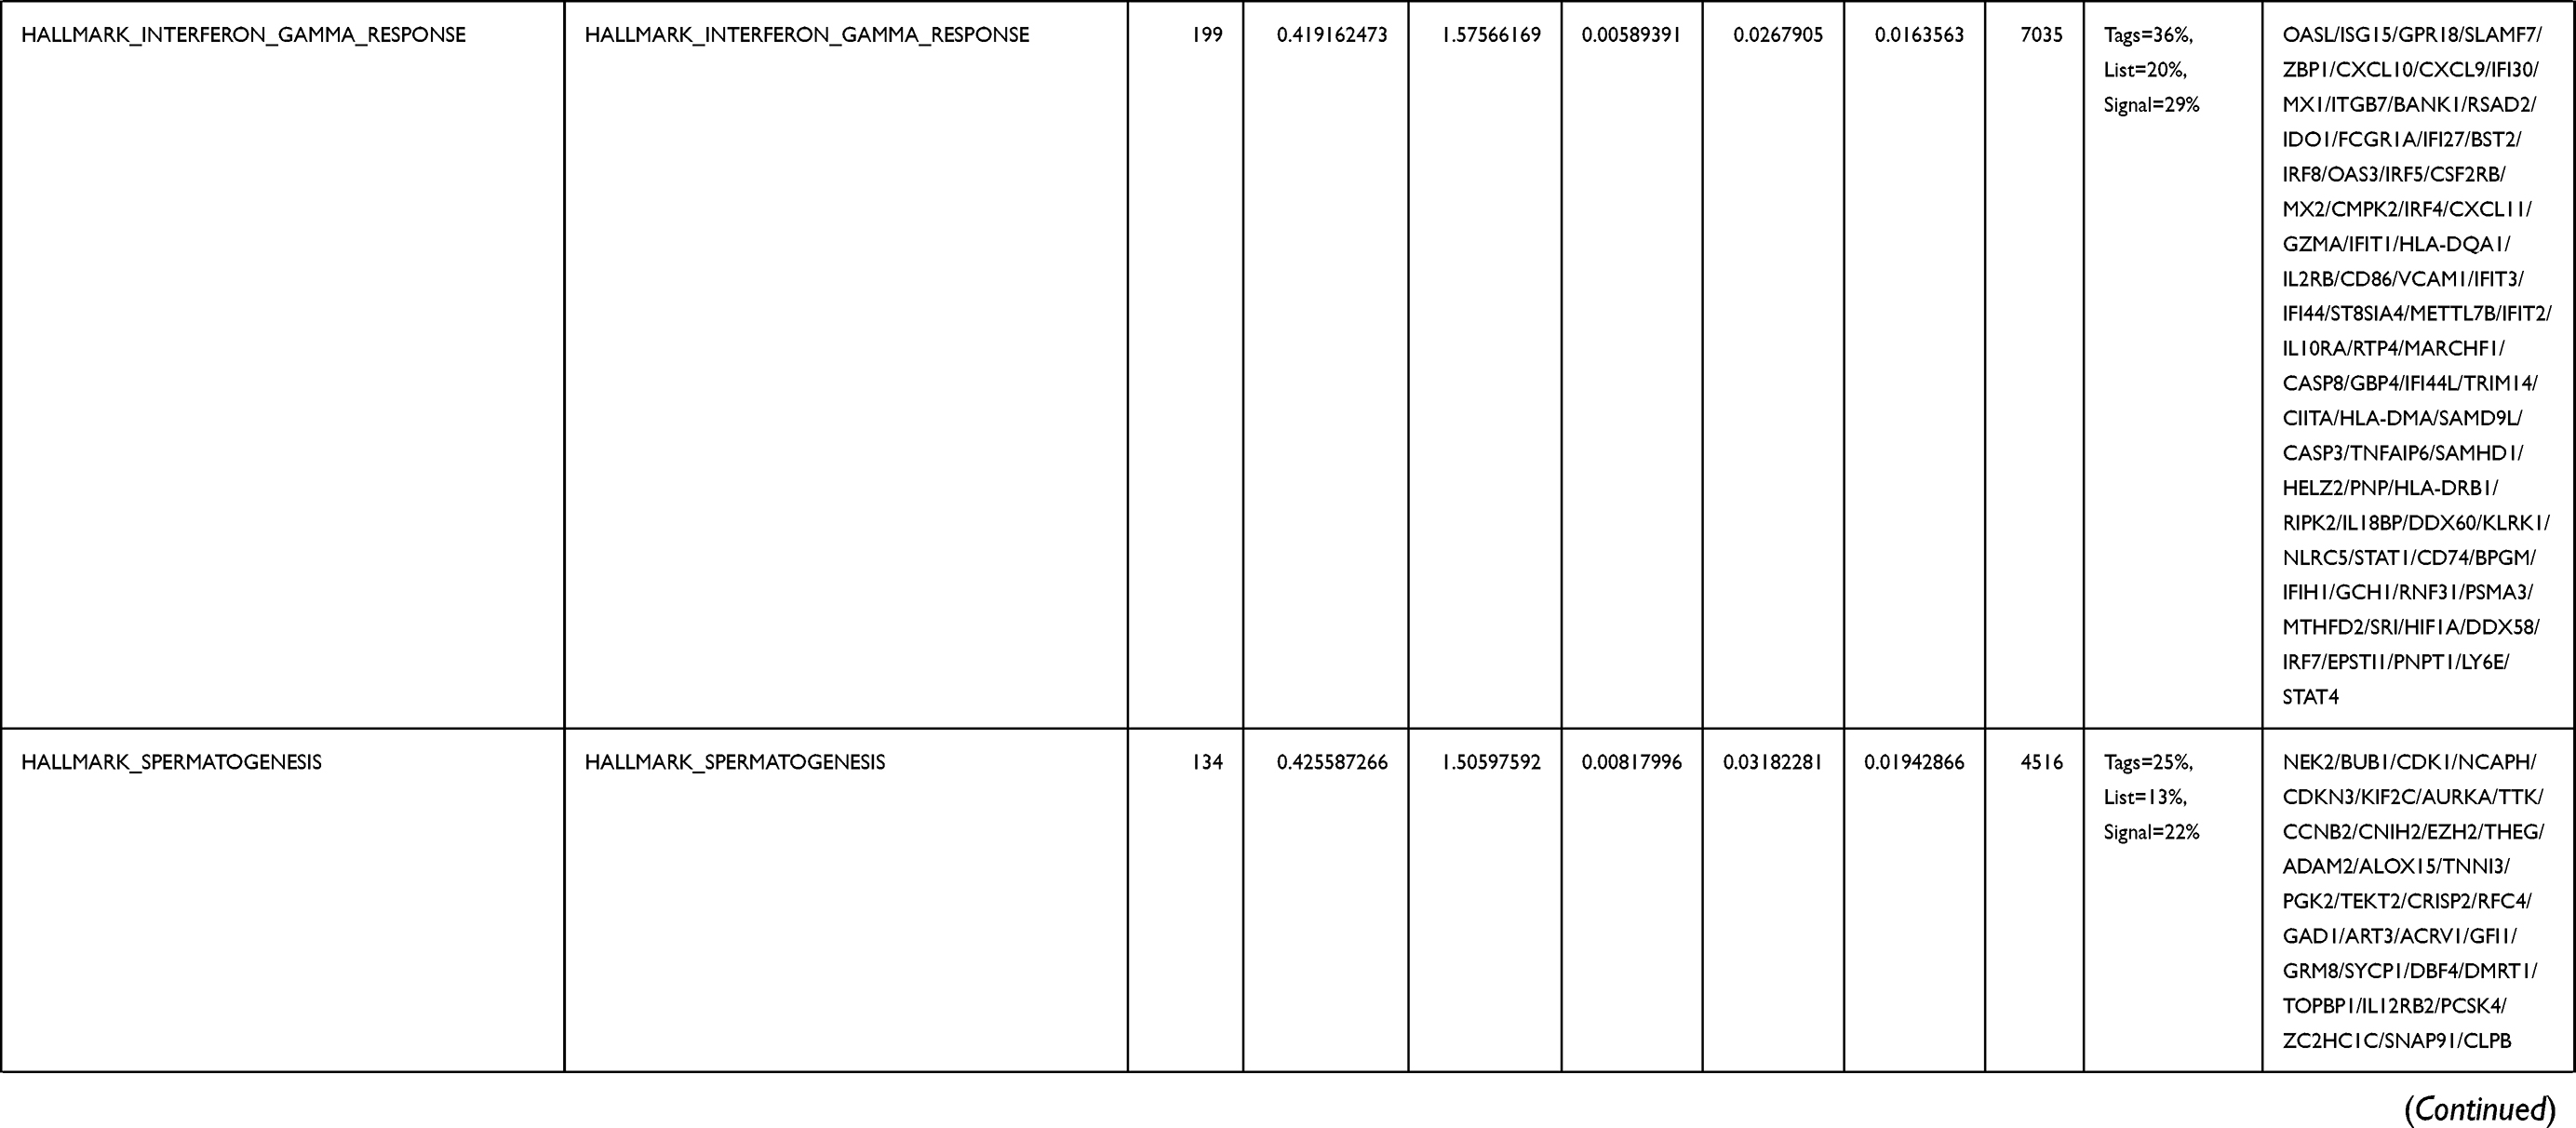 | 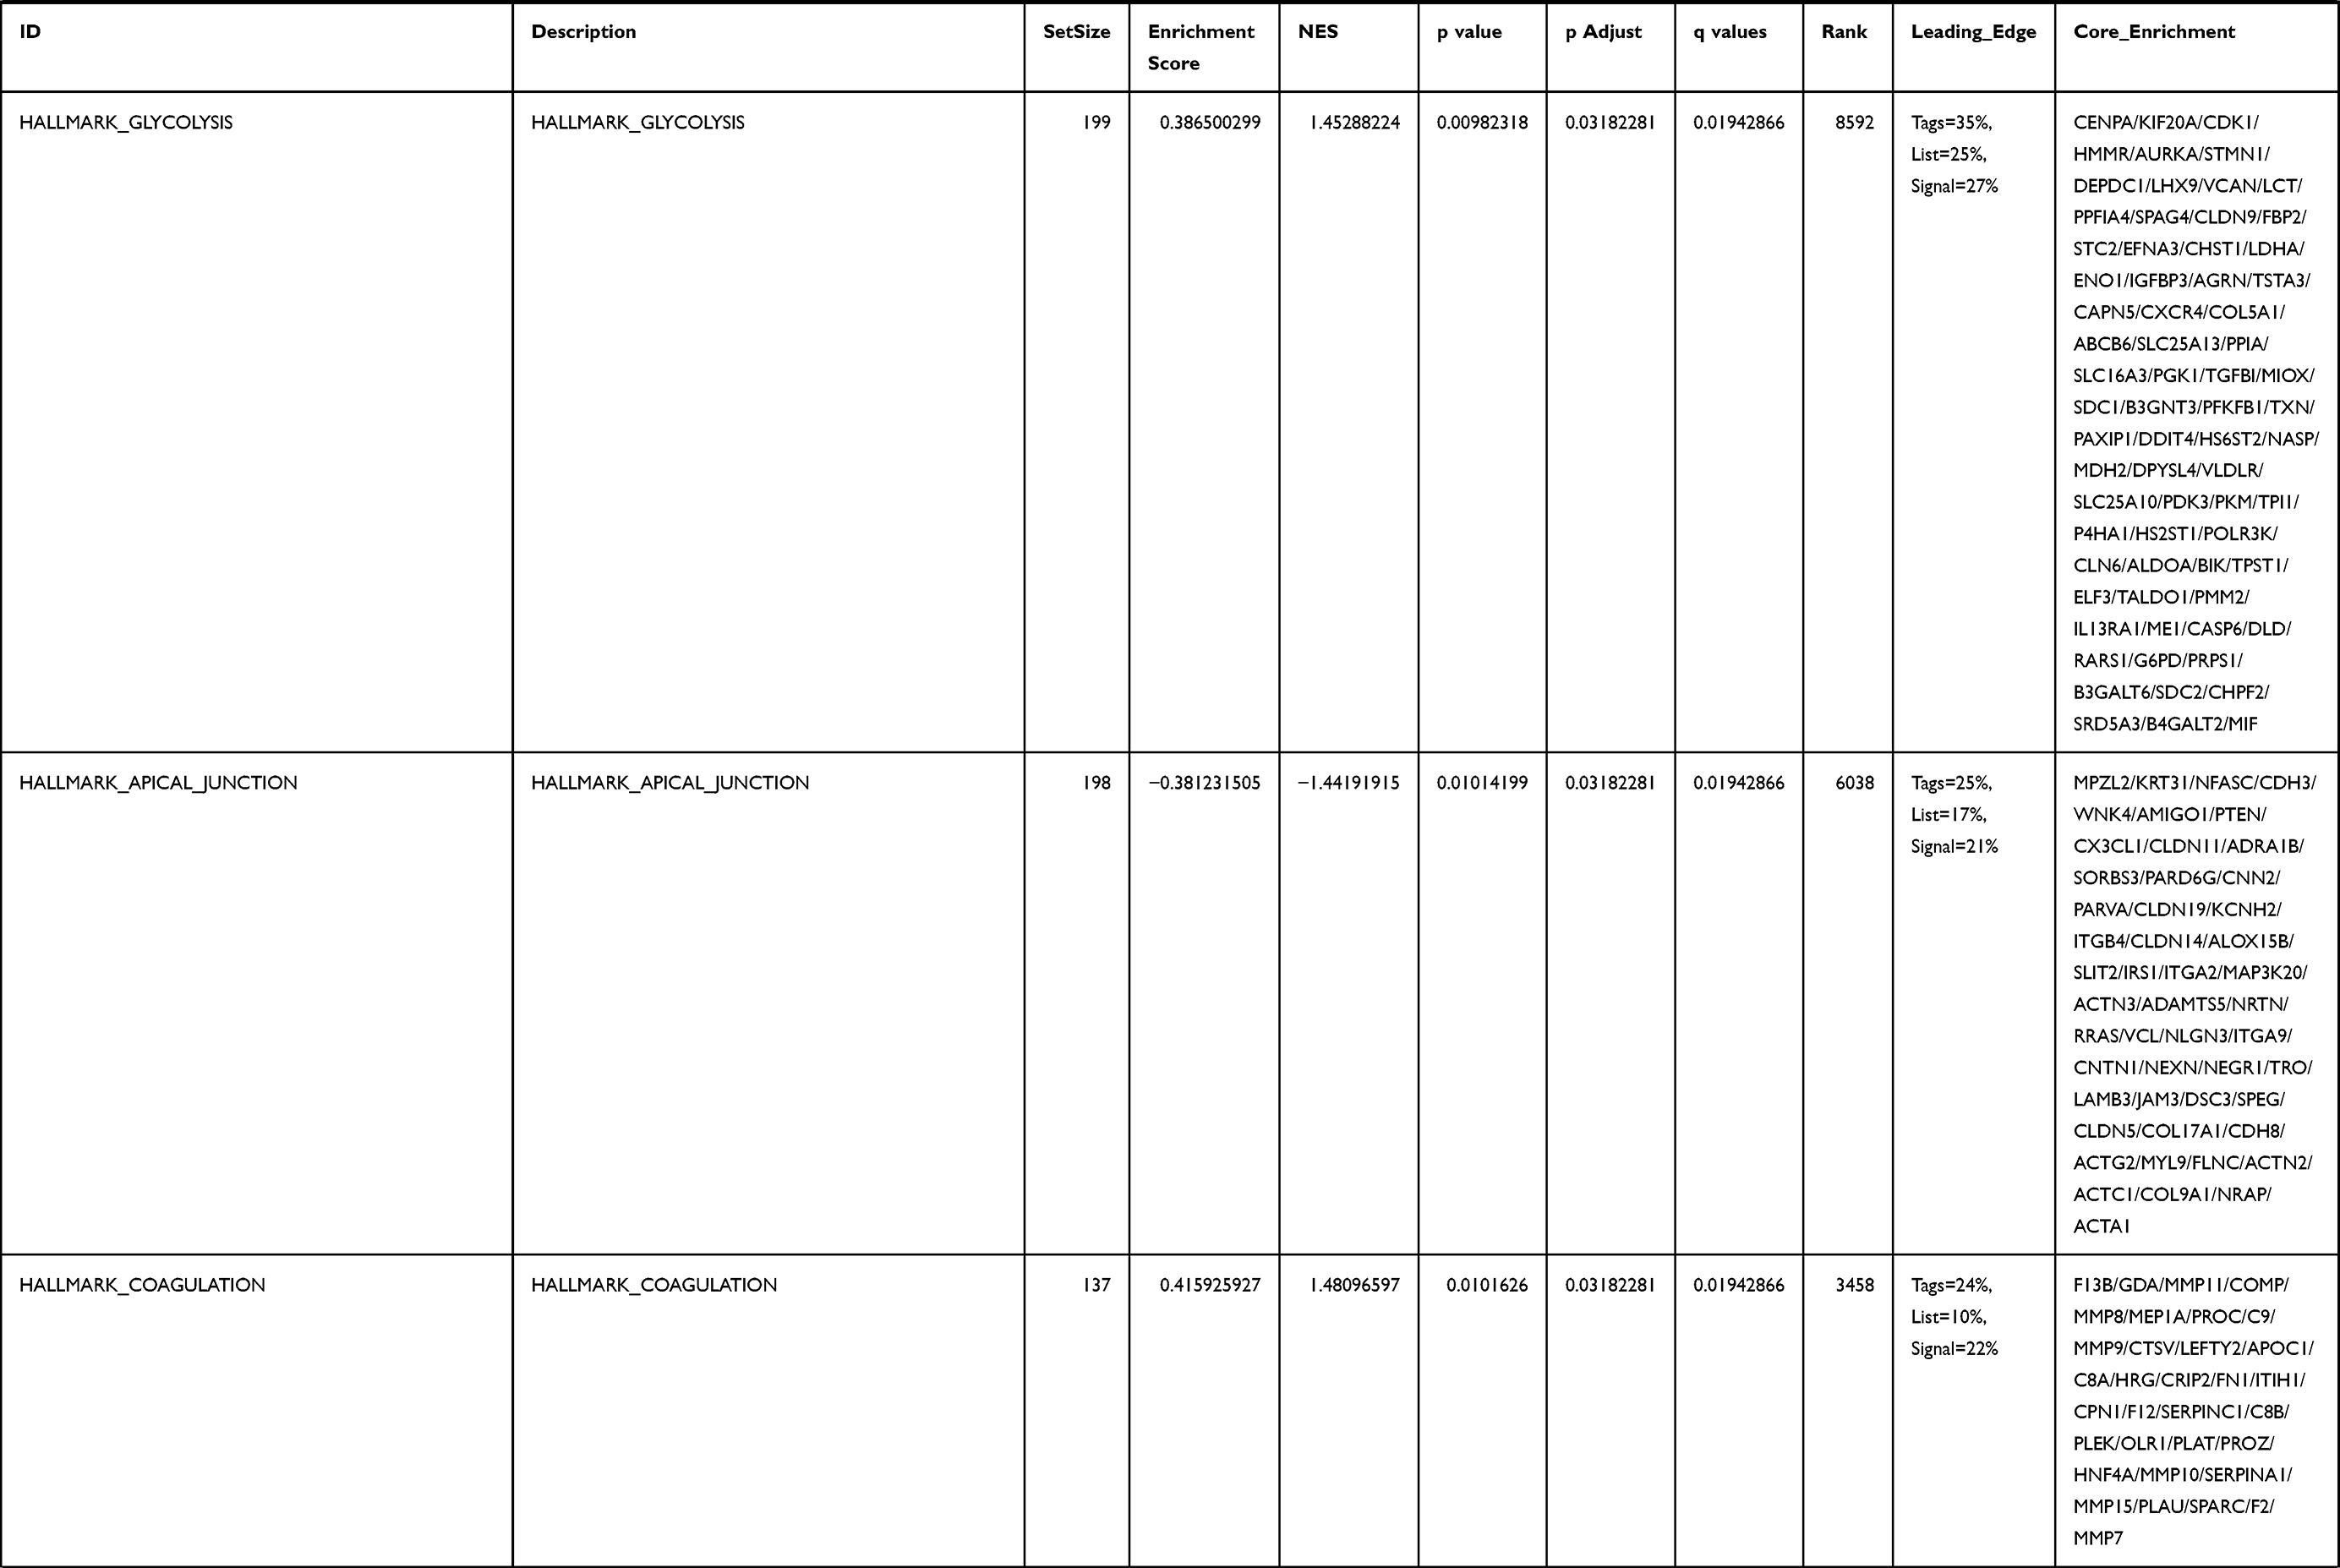 | 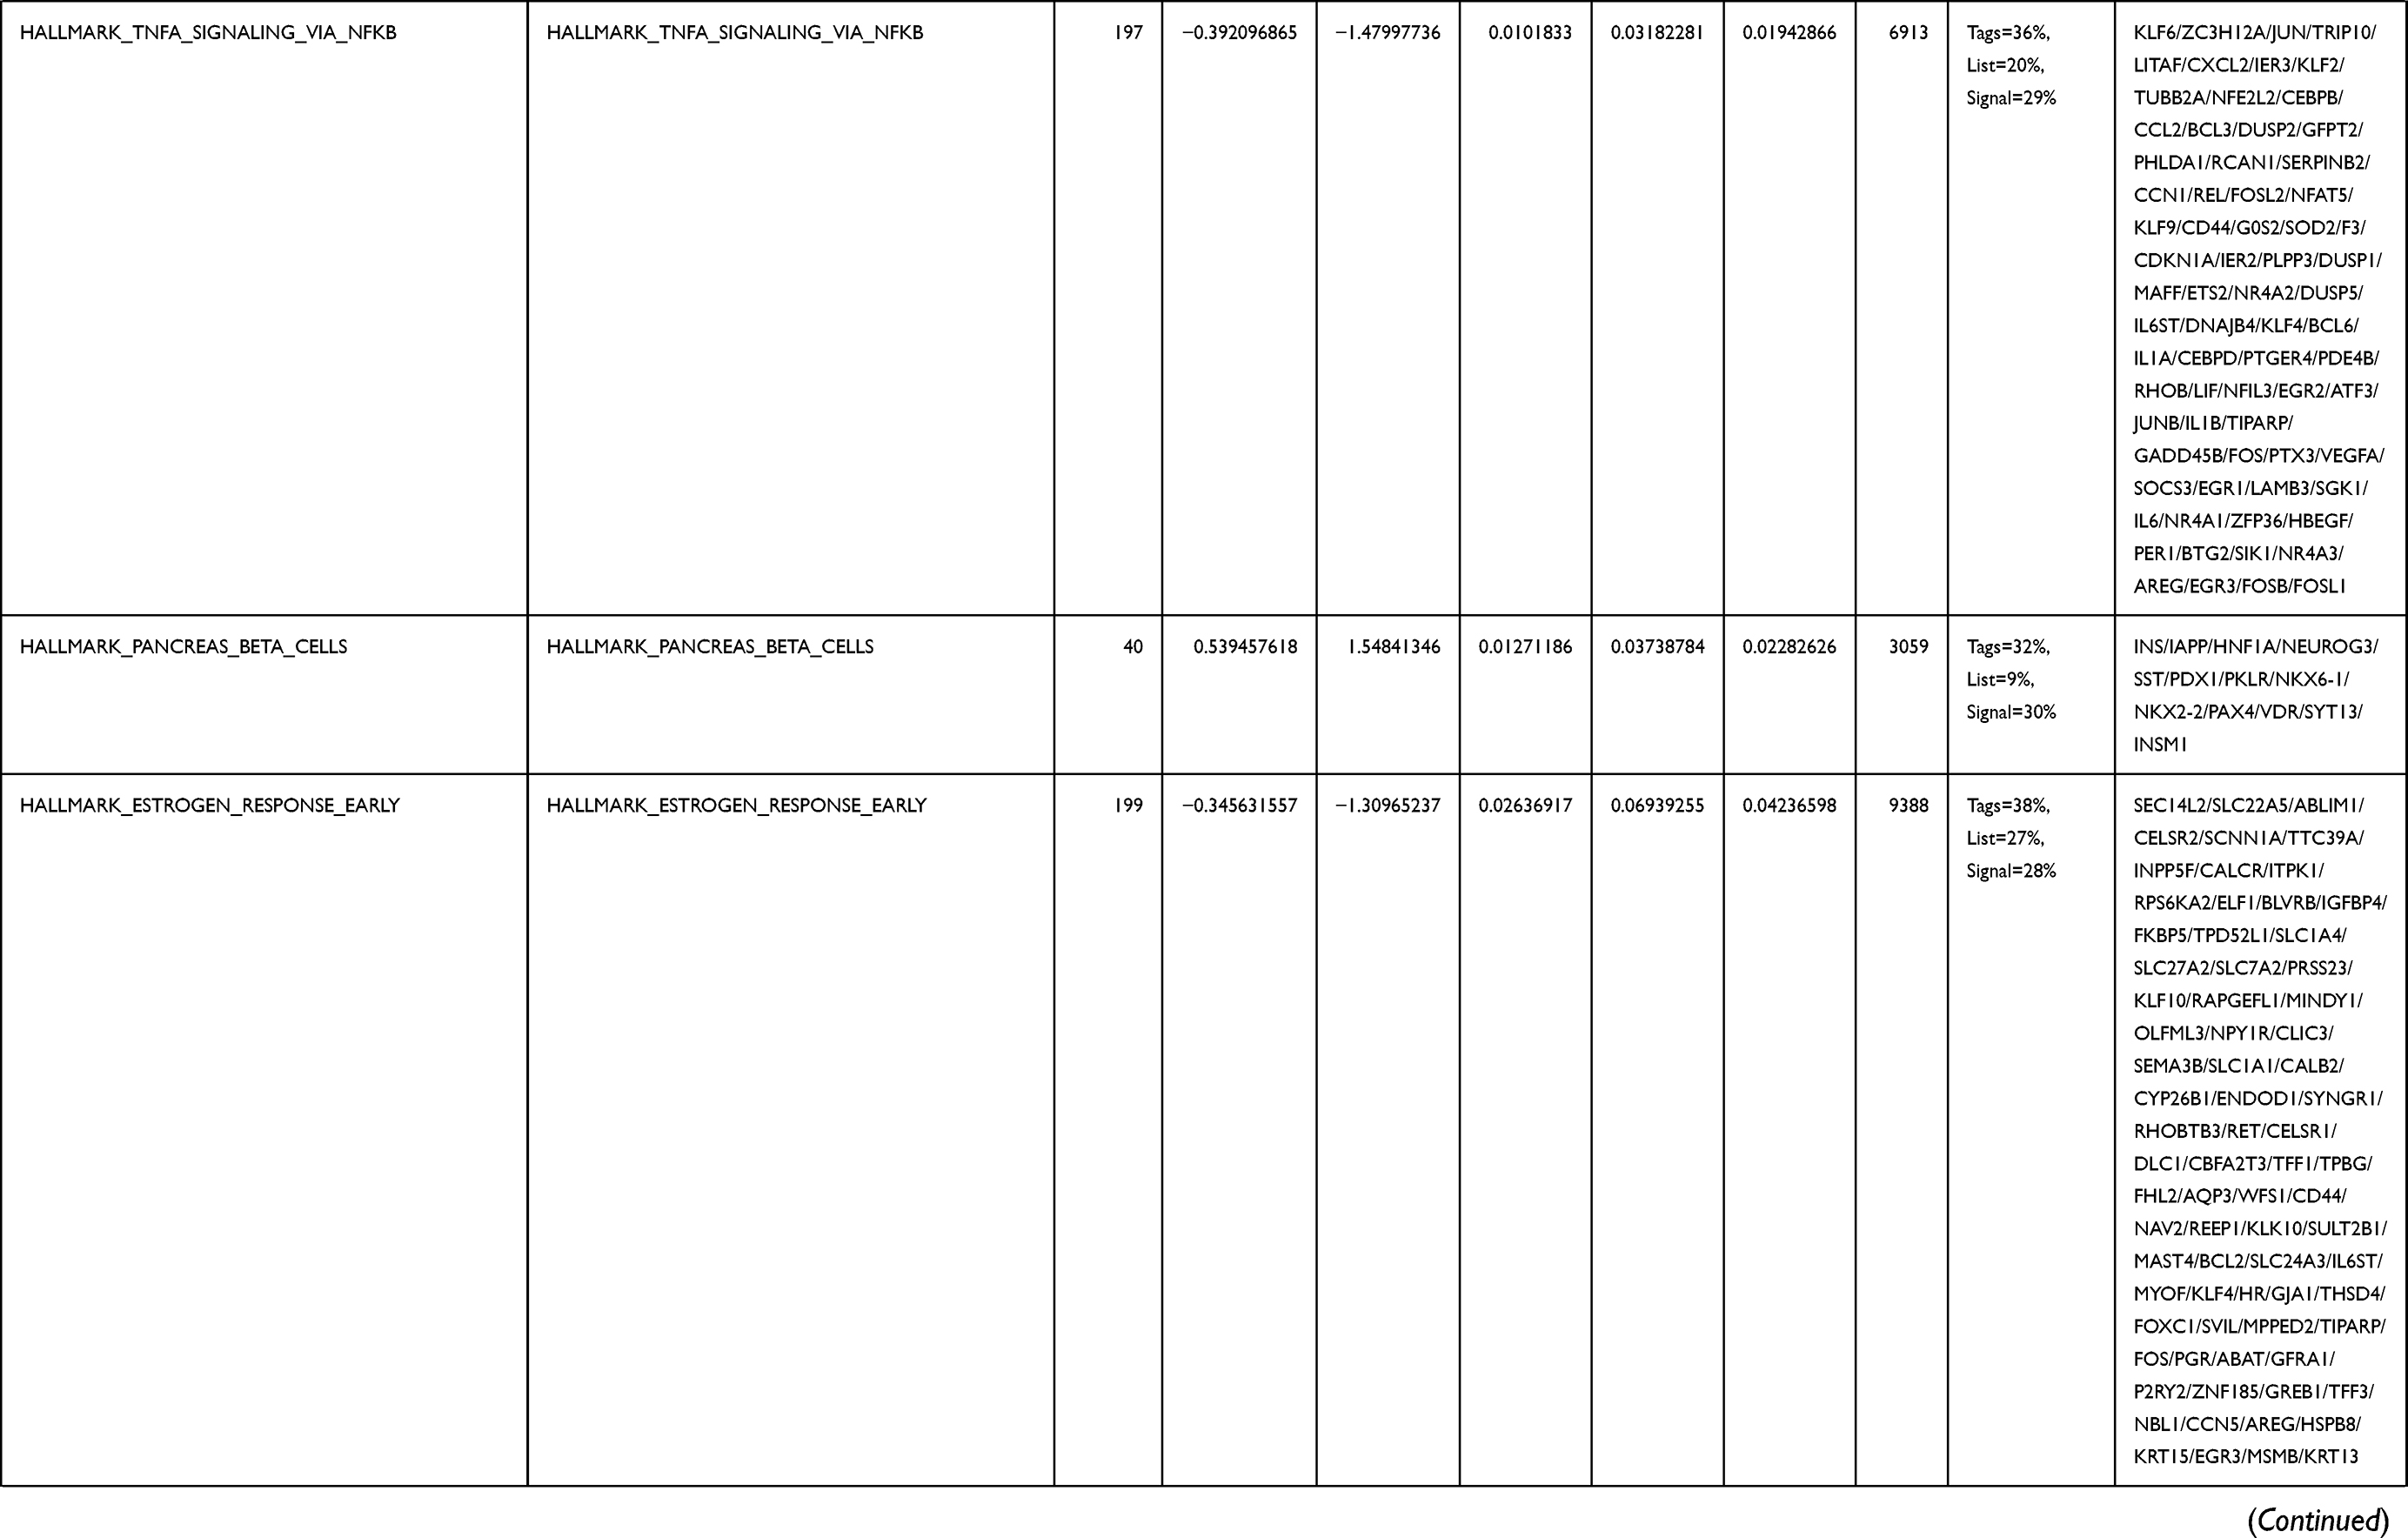 | 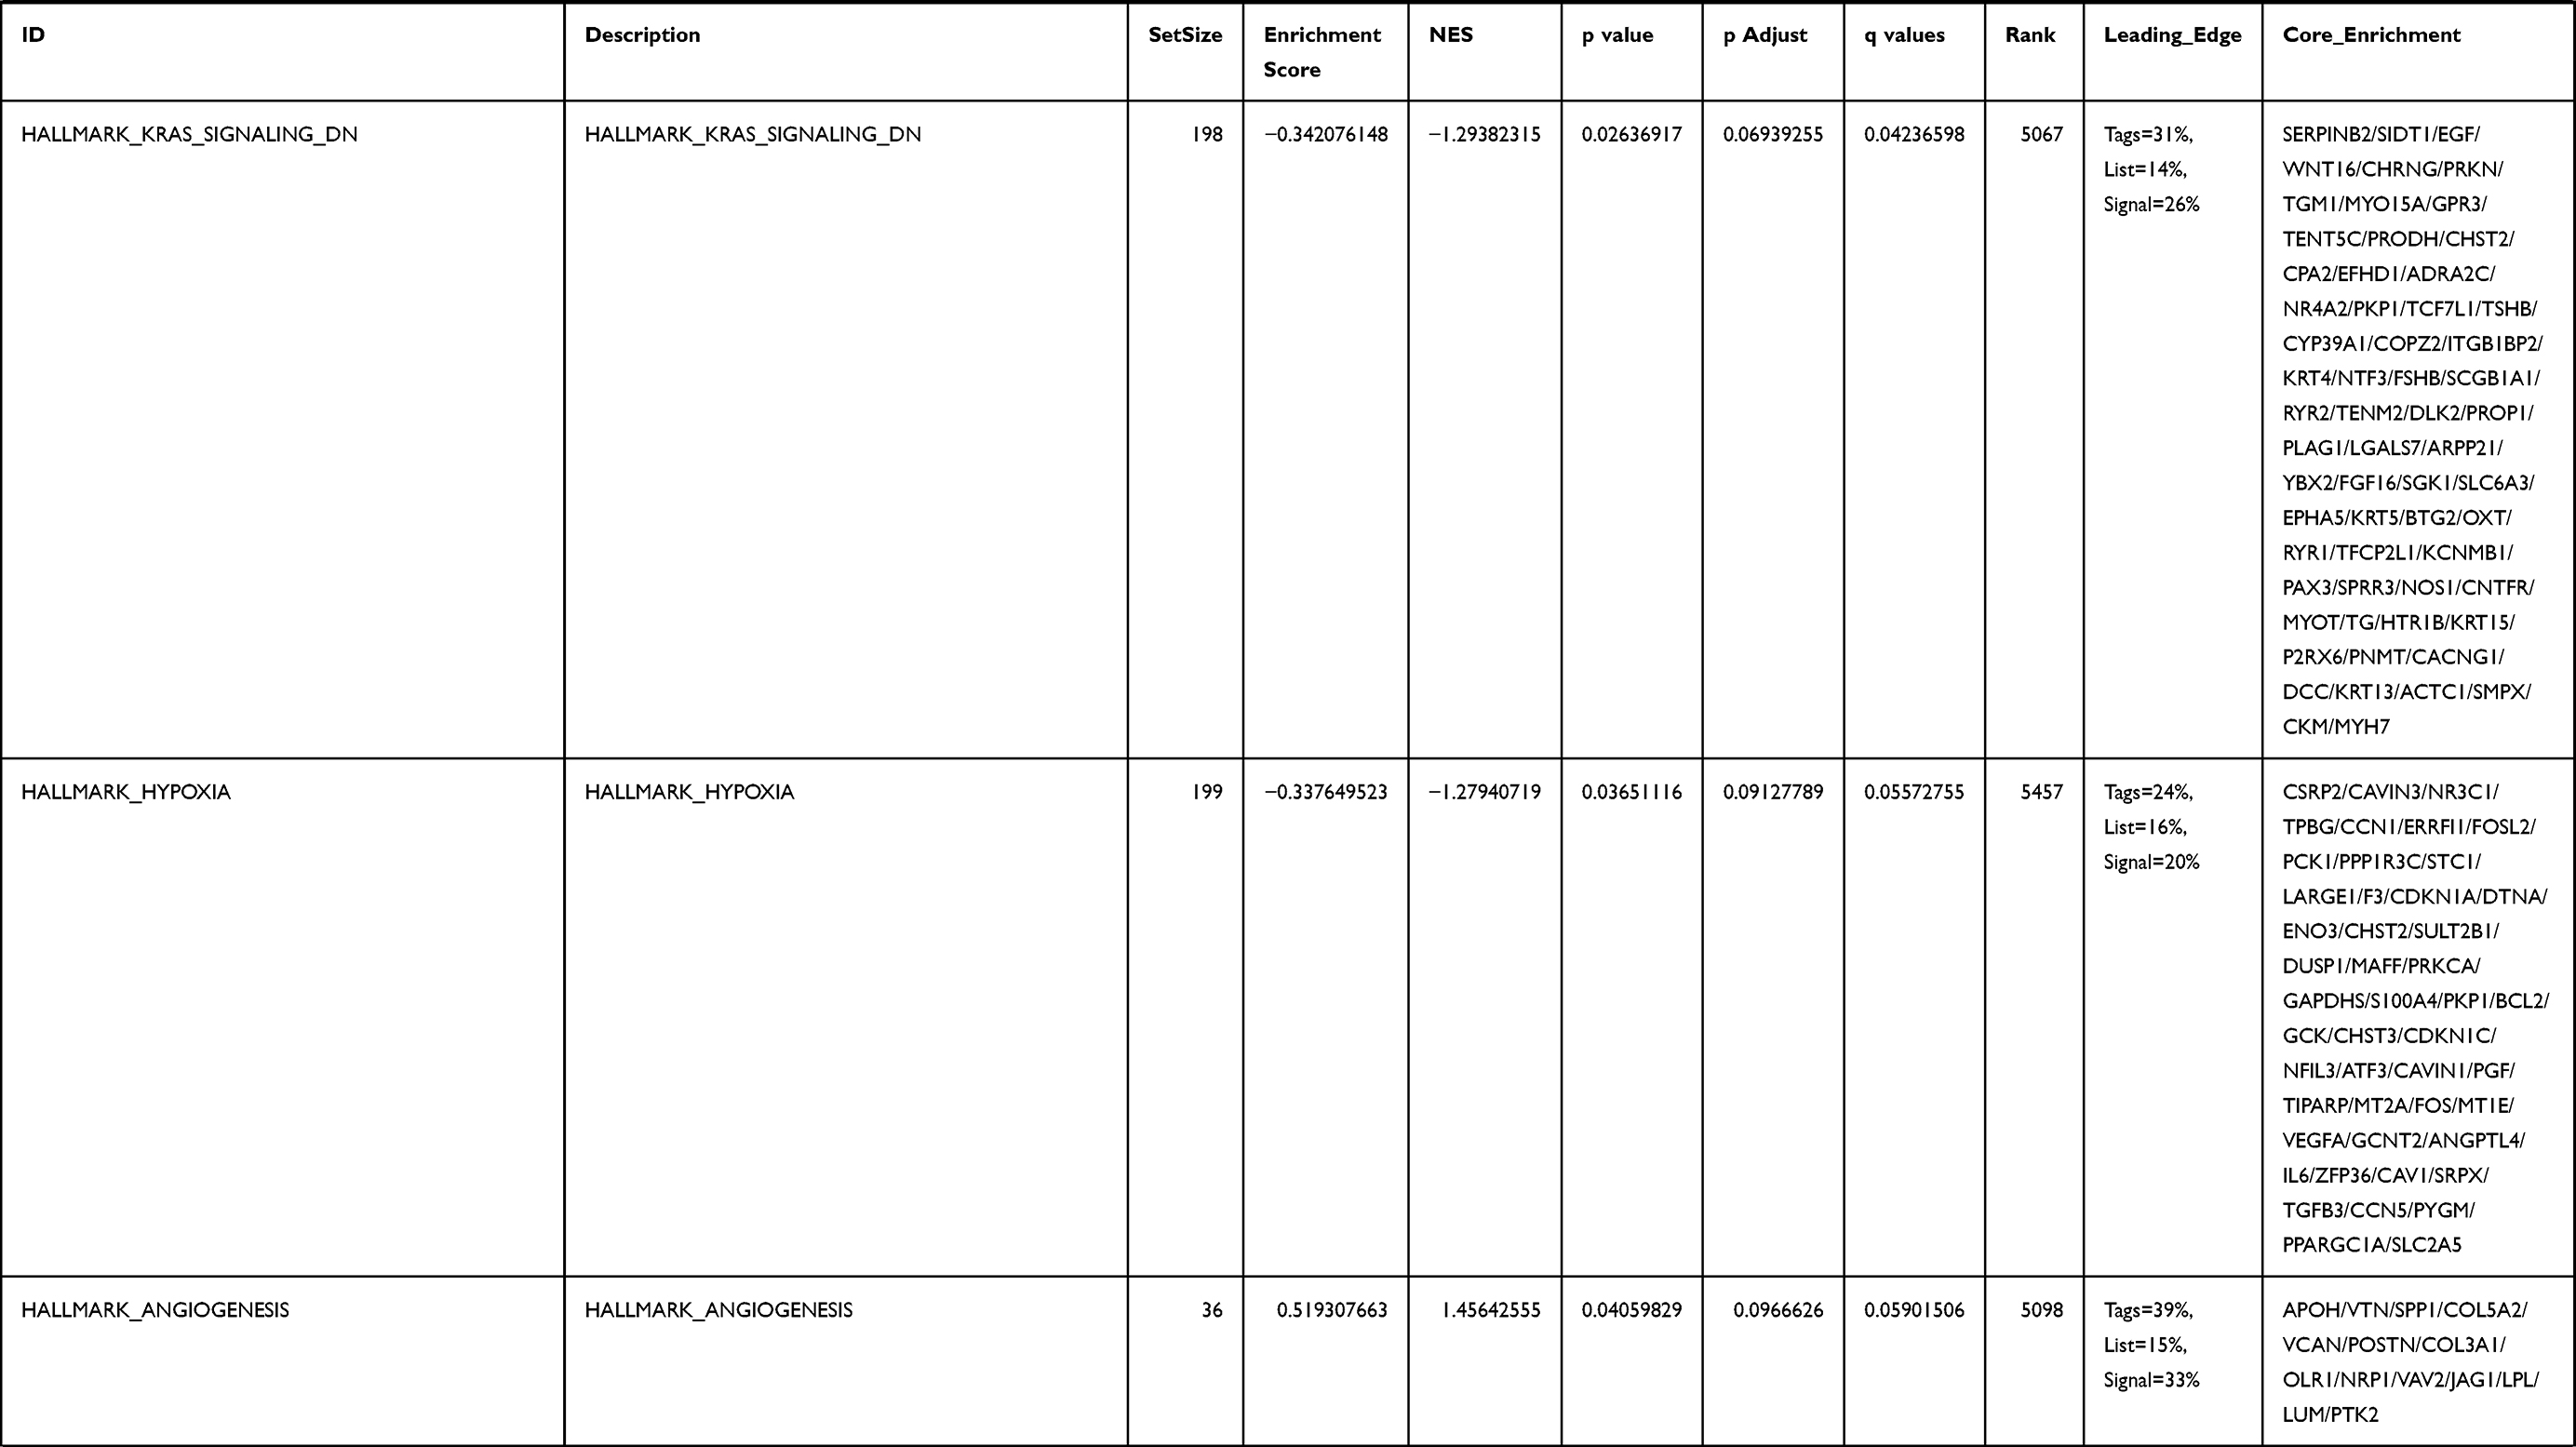 | 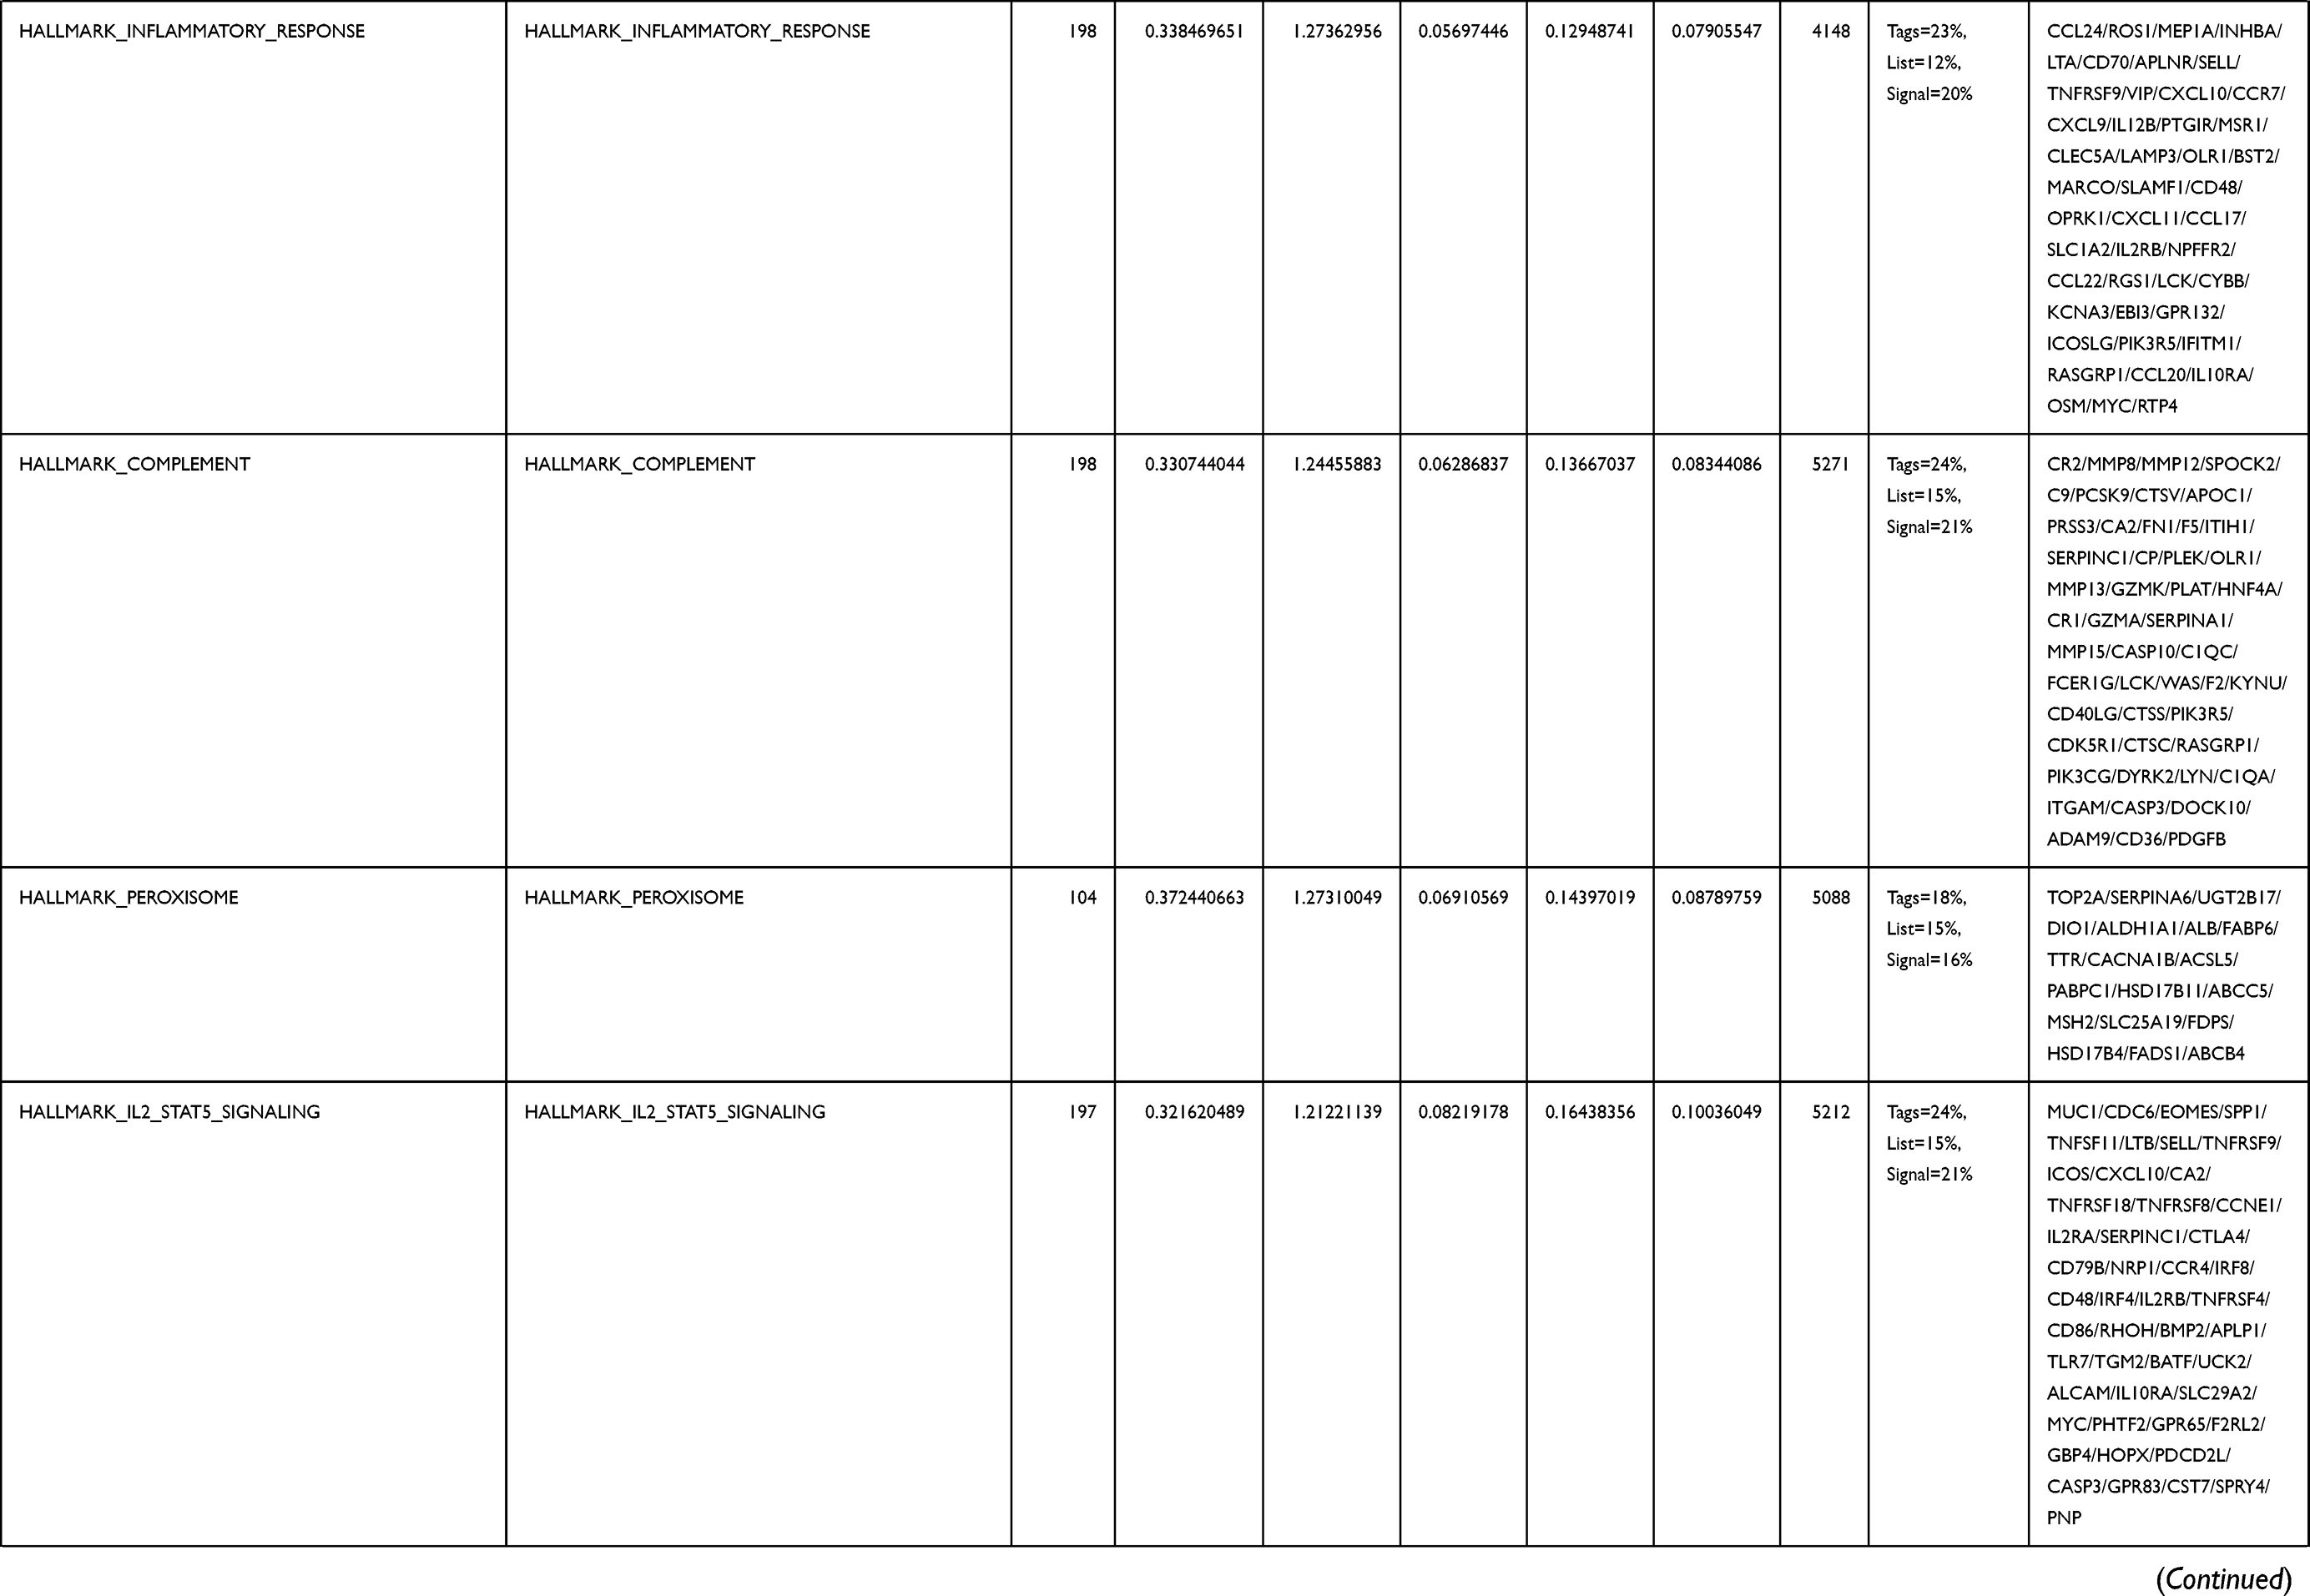 | 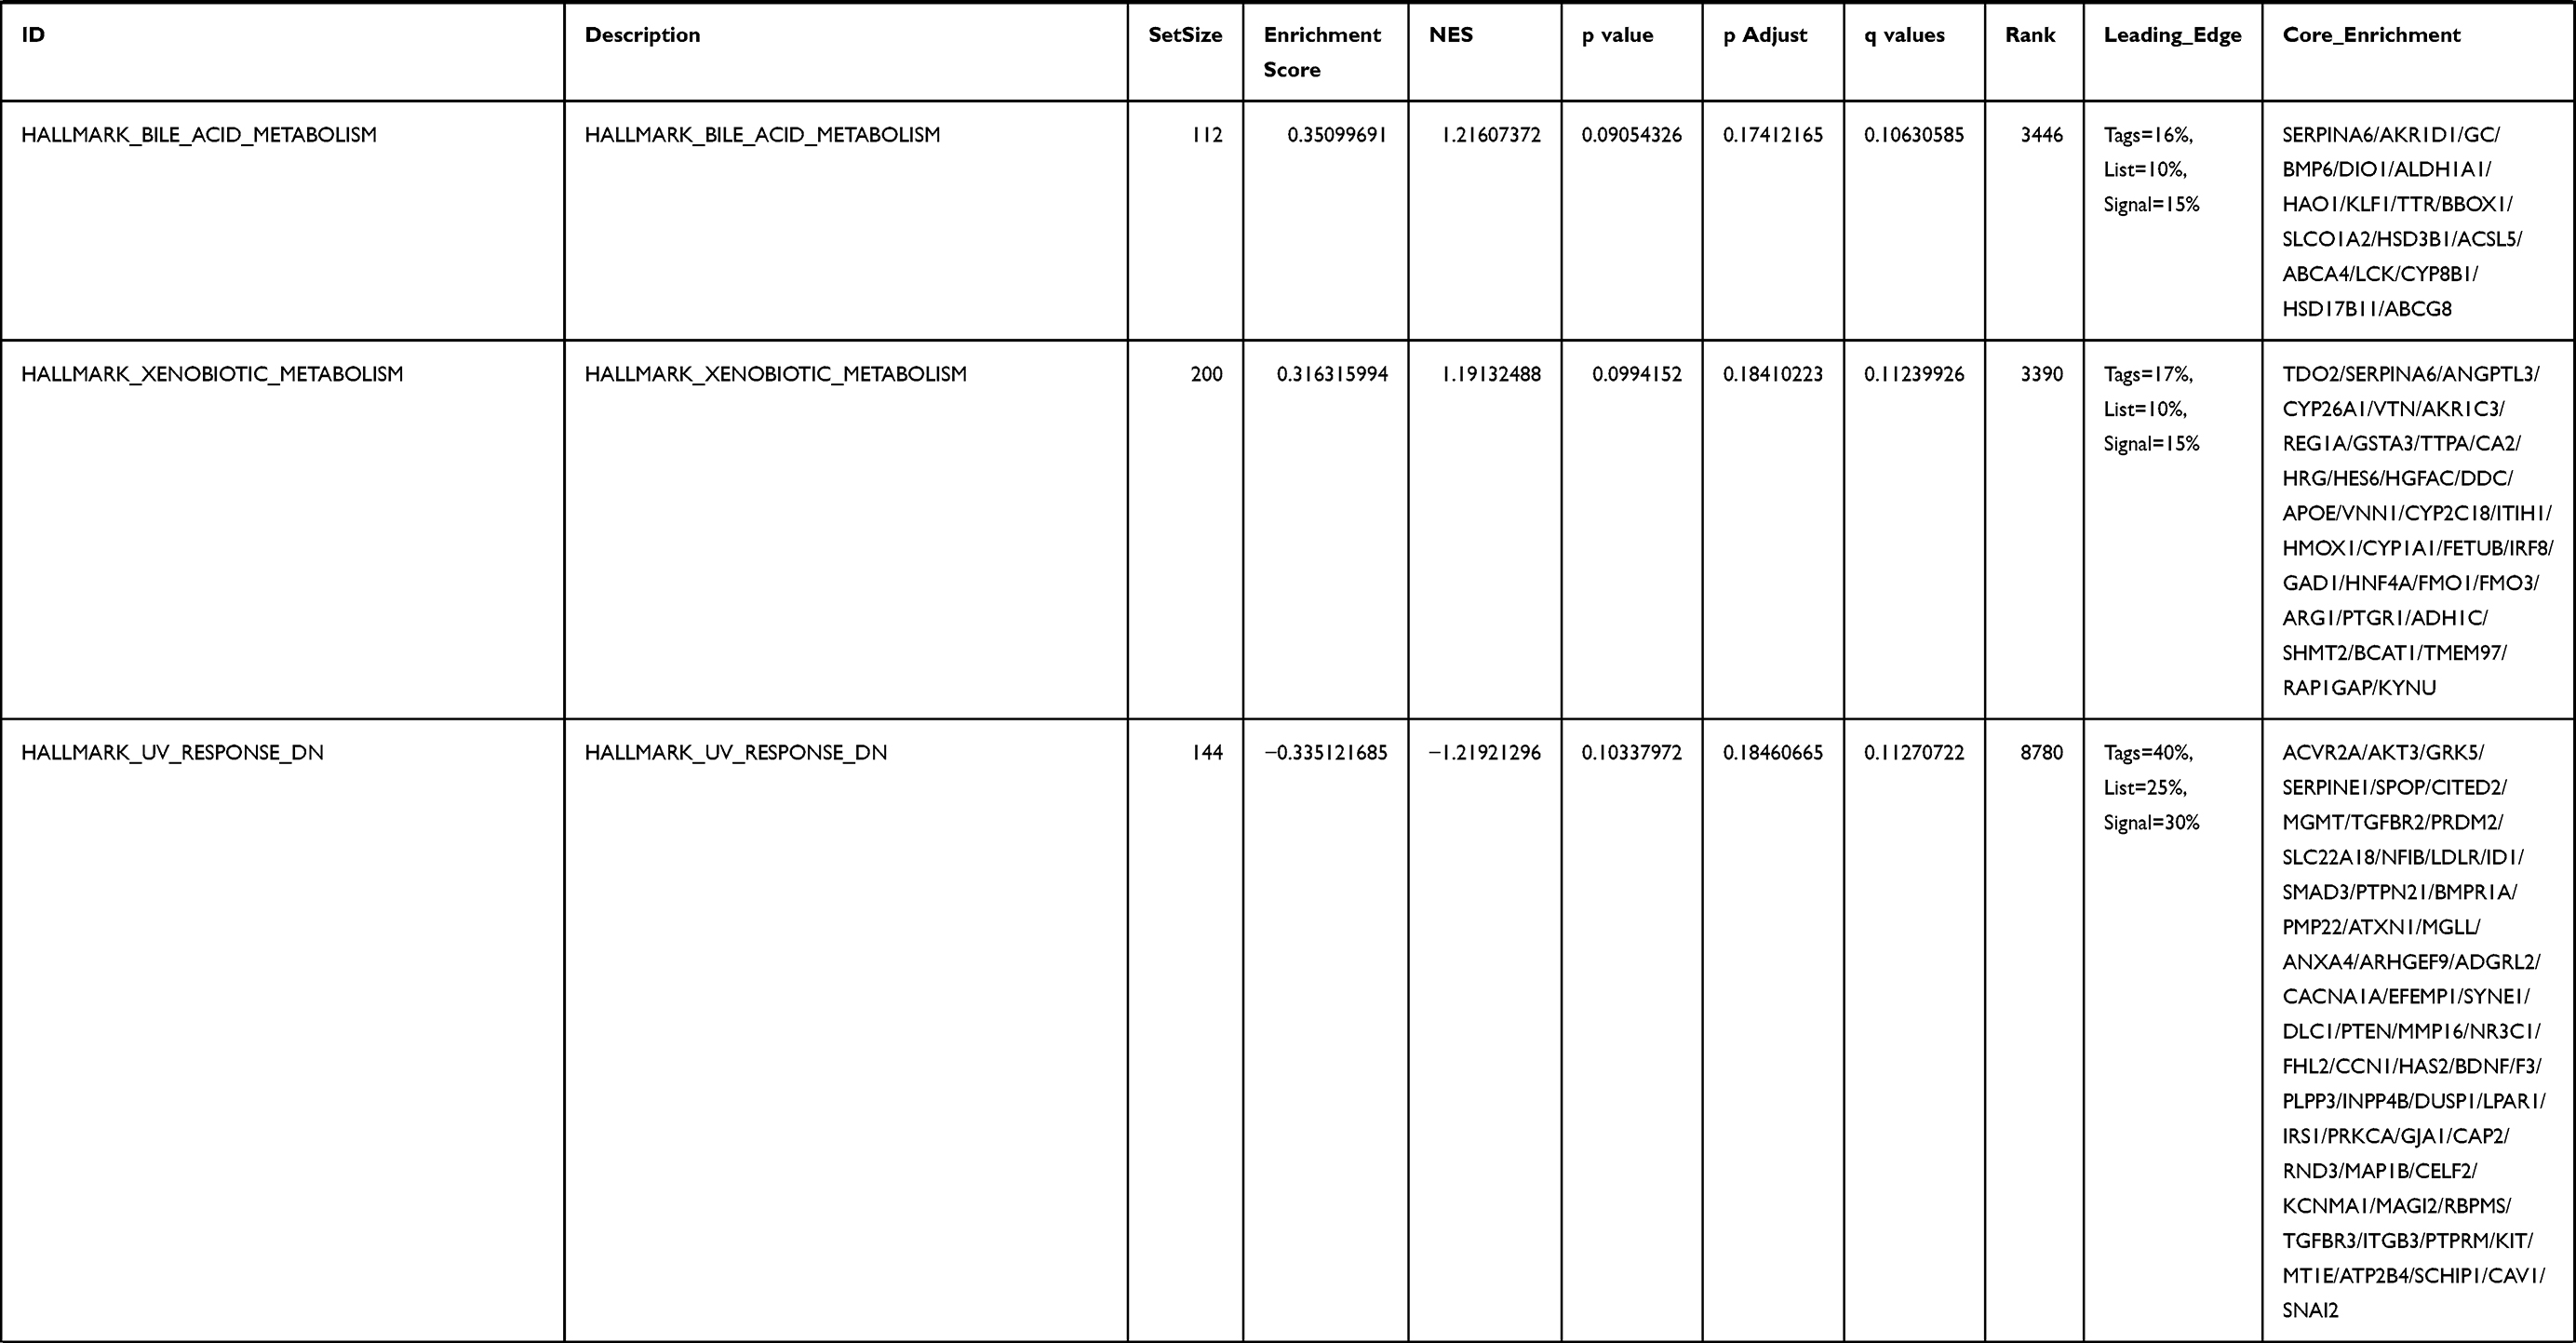 |
Table 4 Gene Sets Enriched in the MYBL2-High Expression Phenotype |
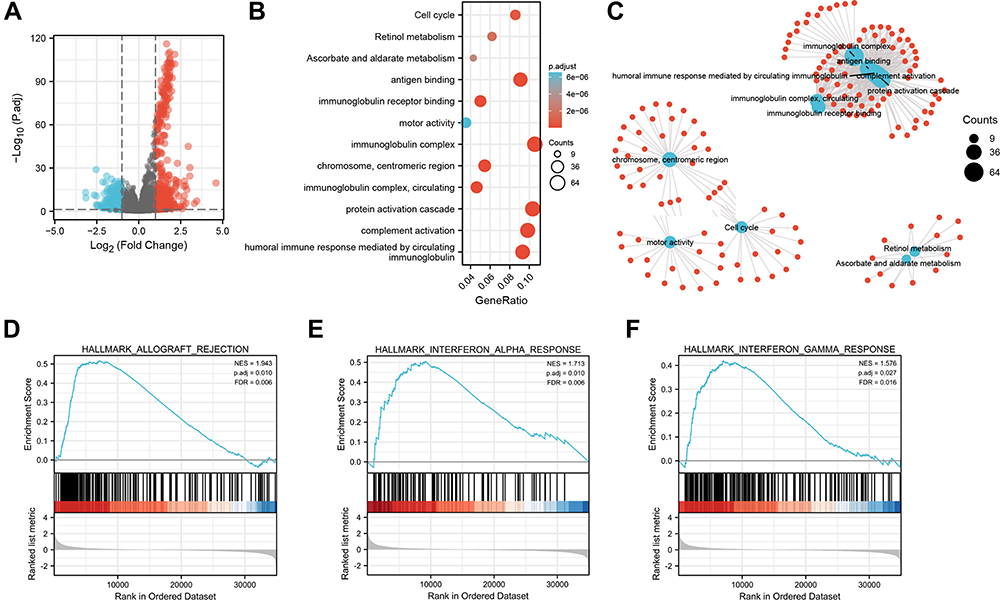 |
Figure 5 Functional inference of MYBL2 in PRAD. (A) Volcano plot analysis identifies DEGs. Red dots represent 1129 upregulated genes and blue dots represent 449 downregulated genes with the criteria set of |log2FC| > 1, adjusted p < 0.05. (B) GO term and KEGG pathways were analyzed, and 12 pathways were mapped according to the differential expression level of MYBL2. (C) Visual network diagram of gene clusters. (D–F) Up-regulated gene sets in h.all.v7.2.symbols.gmt (Gene ontology) in the group of high MYBL2 expression. Enrichment plot: (D) HALLMARK_ALLOGRAFT_REJECTION; (E) HALLMARK_INTERFERON_ALPHA_RESPONSE; (F) HALLMARK_INTERFERON_GAMMA_RESPONSE. |
Tumor-Infiltration Immune Cell Analysis of MYBL2 in TCGA Database
We further explored the association between MYBL2 and immune cell infiltration level quantified by ssGSEA in PRAD using Spearman correlation. As shown in Figure 6A, high MYBL2 expression was significantly positively correlated with infiltration levels of Treg (T cell regulatory), Th2, aDC and macrophages. To further validate our findings, the tool of TIMER 2.0 was used to analysis. There was a significant correlation between MYBL2 expression and different types of immune cells, including CD8+T cells (p=1.16e-06, Rho=−0.236), neutrophil cells (p=1.75e-05, Rho=0.209), macrophage cells (p=6.11e-10, Rho=0.297), monocyte cells (p=2.66e-06, Rho=0.228), MDSCs (myeloid-derived suppressor cells) (p=4.27e-17, Rho=0.396) and Tregs (p=4.27e-17, Rho=0.396) (Figure 6B–G). We also assess possible correlations between 14 types of immune cells, the heatmap revealed that the ratios of different tumor-infiltration immune cells were weakly to moderately correlated (Figure 6H).
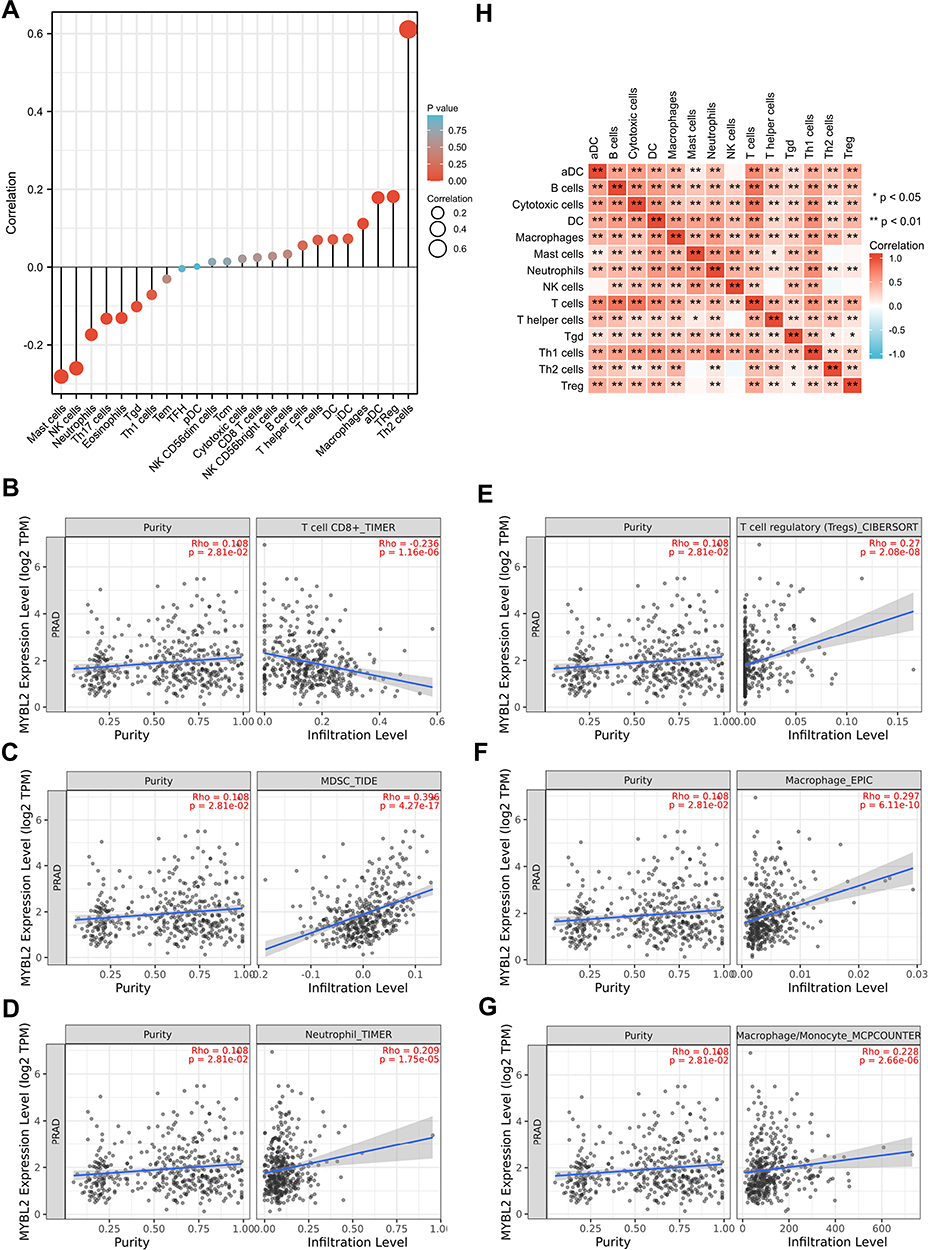 |
Figure 6 Correlations of MYBL2 expression with immune infiltration level. (A) Relations between the expression of MYBL2 and 24 types of TILs in PRAD. (B–G) The relationships between MYBL2 expression and CD8+T cells, neutrophil cells, macrophage cells, monocyte cells, MDSCs, Tregs in PRAD analyzed by the database of TIMER2.0 website. (H) Heatmap of 14 TILs in PRAD. |
Subsequently, to gain further insight into the relationship between MYBL2 expression and tumor-infiltrated immune cells, the correlation between the expression of MYBL2 and that of 45 common immune check point inhibitors (ICIs) was analyzed. In PRAD, MYBL2 expression was associated with many immune checkpoint markers, including CD276 (r=0.340, p<0.001), BTLA (r=0.291, p<0.001), TNFRSF18 (r=0.311, p<0.001), HAVCR2 (r=0.304, p<0.001) and CD70 (r=0.301, p<0.001) (Figure 7A–F).
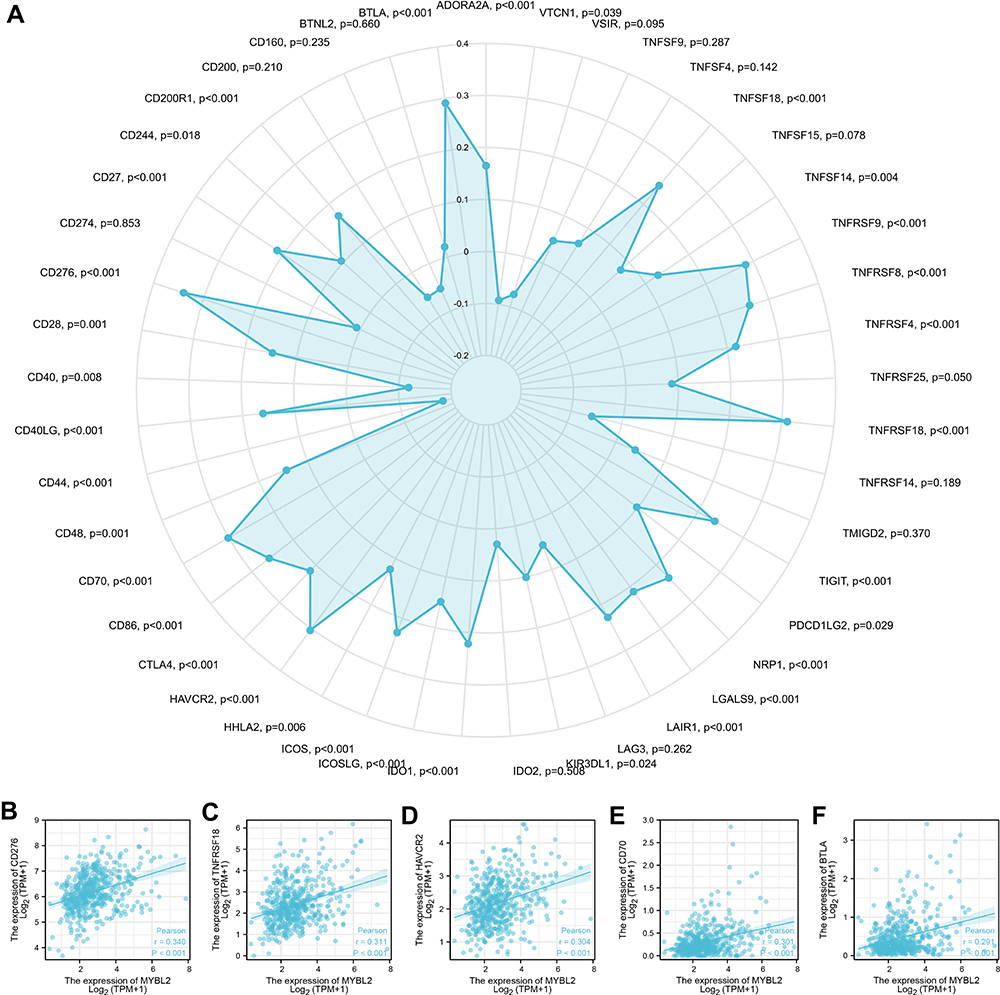 |
Figure 7 Correlations of MYBL2 expression with 45 immune checkpoint genes. (A) Correlation analysis of MYBL2 expression levels with 45 common immune checkpoint gene levels in PRAD. (B–F) MYBL2 expression was positively closely related with CD276, BTLA, TNFRSF18, HAVCR2 and CD70 in PRAD. |
Discussion
The incidence and mortality rate of prostate cancer in China has increased dramatically in recent years, becoming the sixth most common malignant tumor in men and the fourth most common in mortality.32 Prostate cancer is clinically heterogeneous, most prostate cancers progress slowly, but some grow relatively quickly and can rapidly develop bone and lymph node metastases and become resistant to androgen deprivation therapy, resulting in CRPC, for which there is a lack of effective treatment.3 The latter is the leading cause of death in prostate cancer patients. The molecular heterogeneity of PCa and the heterogeneity of the microenvironmental cell population are the underlying causes of clinical heterogeneity, which has not been systematically addressed in studies to date.33 Recent data suggested the involvement of infiltrated immune cells and related immune checkpoint molecules in the progression of prostate cancer, outlined the important roles of these cells and molecules in the initiation, progression, metastasis, and treatments of PCa.34,35 In this study, we identified MYBL2 as potential prognostic biomarker for PCa and investigated the correlation between MYBL2 and immune infiltrates in PCa.
At the year of 2020, our previous study reported that miR-30a could inhibit androgen-independent growth of PCa by targeting MYBL2.26 In the year of 2021, Li et al found that MYBL2 expression was significantly upregulated in CRPC tissues and controlled the development of castration resistance and metastatic relapse in PCa by modulating the Hippo-YAP signaling pathway.25 Based on these preliminary data, we suggested that MYBL2 may be an independent risk factor for the prognosis of PCa. In the current study, we firstly used large-scale of database resources and statistical analysis to comprehensively and systematically demonstrate that MYBL2 was a poor prognostic factor in the malignant progression of PCa. We analyzed the mRNA expression of MYBL2 in GTEx and TCGA database, founding that MYBL2 is upregulated in many tumor tissues including PRAD. The upregulated mRNA expression of MYBL2 is positively correlated with high T stage, high Gleason score, worse primary therapy outcome and worse PFI, which was broadly in agreement with previous studies.25,36,37 In light of Kaplan-Meier curves and univariate Cox regression analysis, we confirmed that high mRNA expression of MYBL2 is associated with shorter PFI. ROC curve analysis and multivariate Cox proportional hazards analysis indicated that MYBL2 could be a promising diagnostic biomarker to differentiate PCa from normal tissues in early stages of PCa and be used as an independent biomarker of poor prognosis for PCa.
Few studies have been reported on MYBL2 in the malignant progression of PCa and tumor immune microenvironment. In 2010, the FDA approved for the treatment of CRPC, offering hope for the treatment of CRPC patients.38 Lou et al demonstrated that sipuleucel T treatment recruited activated CD3+T lymphocytes to the tumor immune microenvironment and induced a local specific T lymphocyte immune response.39 Another ICI for PCa is Ipilimumab, a monoclonal antibody against cytotoxic T lymphocyte-associated antigen 4 (CTLA-4), which enhances the body’s anti-tumor immune response by increasing the proliferation and activation of T lymphocytes. It is currently approved for the treatment of metastatic melanoma, and clinical trials are underway in PCa.40 Thus, the treatment of PCa has entered the era of tumor immunotherapy. As the understanding of tumor immune microenvironment continues to improve, the ability to predict and guide immunotherapeutic responses has great potential for development.41 Our founding pioneeringly demonstrated the positive association between MYBL2 expression and tumor-infiltrating immune cells. Firstly, we identified 1129 DEGs by comparing the two groups based on MYBL2 expression and performed GO, KEGG functional enrichment analysis and GSEA analysis. The results suggested that MYBL2 was related to many immune infiltration-related pathways in PCa. Furthermore, we found several tumor infiltrating immune cells like neutrophil cells, macrophage cells, MDSCs and Tregs were correlated with the expression of MYBL2 in PCa by using ssGSEA analysis and TIMER2.0. Finally, we conducted correlation analysis of MYBL2 expression levels with over 40 common immune checkpoint gene levels in PCa. Interestingly, in PRAD, MYBL2 expression was associated with many immune checkpoint markers, including CD276, BTLA, TNFRSF18, HAVCR2 and CD70. It is important to emphasize that both MDSC and ICIs play important roles in PCa tumor progression.42,43 Lu et al proposed that combining immune checkpoint blockade with MDSC-targeted therapies would be a useful clinical path in the treatment of CRPC.35 Our study suggested a strong positive correlation between MYBL2 and the expression of both MDSC and ICIs in PCa. Accordingly, these results strongly demonstrated that MYBL2 gene may play a crucial role in PCa tumor immune microenvironment. It should also be admitted that the relationship between MYBL2 and immune infiltration microenvironment of PCa has not been clarified, and our subsequent studies will continue to explore the pathways related to MYBL2 promoting the malignant progression of PCa and its interaction with immune checkpoint markers.
Conclusion
In this study, our findings uncovered that MYBL2 could be a novel independent prognostic biomarker and correlated with immune infiltrates in prostate cancer. The role of MYBL2 in the promotion of PCa progression needs to be supplemented by subsequent experiments. In addition, the specific role of MYBL2 in relation to immune infiltration in PCa and related functioning pathways need to be further elucidated. MYBL2 may serve as a novel prognostic biomarker and provide an opportunity to drive the development of new immunotherapeutic strategies.
Ethical Statement
The TCGA and TIMER databases are publicly available, and our study was performed based on the guidelines of these databases. The research scheme complies with the requirements of scientific and ethical principles. The study was approved by the Ethics Committee of the Second Hospital of Shandong University. Written informed consent for participation was not required for this study in accordance with the national legislation and the institutional requirements. Users can download relevant data for free for research and publish relevant articles. Our research is based on open-source data, so there are no ethical issues or other conflicts of interest.
Acknowledgments
This study benefited from the Cancer Genome Atlas (TCGA) and we thank Dr. Zhang facai for the kindly guidance of bioinformatic analysis.
Author Contributions
All authors made a significant contribution to the work reported, whether that is in the conception, study design, execution, acquisition of data, analysis and interpretation, or in all these areas; took part in drafting, revising or critically reviewing the article; gave final approval of the version to be published; have agreed on the journal to which the article has been submitted; and agree to be accountable for all aspects of the work.
Funding
This work was supported by the Jinan Medical & Health Science and Technology Innovation Program Project of 2019 [201907123].
Disclosure
The authors report no conflicts of interest in this work.
References
1. Pernar CH, Ebot EM, Wilson KM, Mucci LA. The epidemiology of prostate cancer. Cold Spring Harb Perspect Med. 2018;8(12):a030361. doi:10.1101/cshperspect.a030361
2. Siegel RL, Miller KD, Fuchs HE, Jemal A. Cancer statistics, 2021. CA Cancer J Clin. 2021;71(1):7–33. doi:10.3322/caac.21654
3. Haffner MC, Zwart W, Roudier MP, et al. Genomic and phenotypic heterogeneity in prostate cancer. Nat Rev Urol. 2021;18(2):79–92. doi:10.1038/s41585-020-00400-w
4. Bancroft EK, Page EC, Brook MN, et al. A prospective prostate cancer screening programme for men with pathogenic variants in mismatch repair genes (IMPACT): initial results from an international prospective study. Lancet Oncol. 2021;22(11):1618–1631. doi:10.1016/s1470-2045(21)00522-2
5. Fasulo V, Zuradelli M, Lazzeri M. Re: a prospective prostate cancer screening programme for men with pathogenic variants in mismatch repair genes (IMPACT): initial results from an international prospective study. Eur Urol. 2022;81(2):216–218. doi:10.1016/j.eururo.2021.11.030
6. Gajewski TF, Schreiber H, Fu YX. Innate and adaptive immune cells in the tumor microenvironment. Nat Immunol. 2013;14(10):1014–1022. doi:10.1038/ni.2703
7. Lei X, Lei Y, Li JK, et al. Immune cells within the tumor microenvironment: biological functions and roles in cancer immunotherapy. Cancer Lett. 2020;470:126–133. doi:10.1016/j.canlet.2019.11.009
8. Pitt JM, Marabelle A, Eggermont A, Soria JC, Kroemer G, Zitvogel L. Targeting the tumor microenvironment: removing obstruction to anticancer immune responses and immunotherapy. Ann Oncol. 2016;27(8):1482–1492. doi:10.1093/annonc/mdw168
9. Gaballa MR, Ramos CA. Cellular immunotherapy in lymphoma: beyond CART cells. Curr Treat Options Oncol. 2020;21(3):21. doi:10.1007/s11864-020-0709-3
10. Zongyi Y, Xiaowu L. Immunotherapy for hepatocellular carcinoma. Cancer Lett. 2020;470:8–17. doi:10.1016/j.canlet.2019.12.002
11. Abdul-Latif M, Townsend K, Dearman C, Shiu KK, Khan K. Immunotherapy in gastrointestinal cancer: the current scenario and future perspectives. Cancer Treat Rev. 2020;88:102030. doi:10.1016/j.ctrv.2020.102030
12. Keenan TE, Tolaney SM. Role of immunotherapy in triple-negative breast cancer. J Natl Compr Cancer Netw. 2020;18(4):479–489. doi:10.6004/jnccn.2020.7554
13. Cha HR, Lee JH, Ponnazhagan S. Revisiting immunotherapy: a focus on prostate cancer. Cancer Res. 2020;80(8):1615–1623. doi:10.1158/0008-5472.Can-19-2948
14. Fujii K, Murase T, Beppu S, et al. MYB, MYBL1, MYBL2 and NFIB gene alterations and MYC overexpression in salivary gland adenoid cystic carcinoma. HistoPathology. 2017;71(5):823–834. doi:10.1111/his.13281
15. Cicirò Y, Sala A. MYB oncoproteins: emerging players and potential therapeutic targets in human cancer. Oncogenesis. 2021;10(2):19. doi:10.1038/s41389-021-00309-y
16. Malaterre J, Mantamadiotis T, Dworkin S, et al. c-Myb is required for neural progenitor cell proliferation and maintenance of the neural stem cell niche in adult brain. Stem Cells. 2008;26(1):173–181. doi:10.1634/stemcells.2007-0293
17. Suetaka S, Oka Y, Kunihara T, Hayashi Y, Arai M. Rational design of a helical peptide inhibitor targeting c-Myb-KIX interaction. Sci Rep. 2022;12(1):816. doi:10.1038/s41598-021-04497-w
18. Zorbas M, Sicurella C, Bertoncello I, et al. c-Myb is critical for murine colon development. Oncogene. 1999;18(42):5821–5830. doi:10.1038/sj.onc.1202971
19. Trauth K, Mutschler B, Jenkins NA, Gilbert DJ, Copeland NG, Klempnauer KH. Mouse A-myb encodes a trans-activator and is expressed in mitotically active cells of the developing central nervous system, adult testis and B lymphocytes. EMBO J. 1994;13(24):5994–6005. doi:10.1002/j.1460-2075.1994.tb06945.x
20. Martinez I, Dimaio D. B-Myb, cancer, senescence, and microRNAs. Cancer Res. 2011;71(16):5370–5373. doi:10.1158/0008-5472.Can-11-1044
21. Joaquin M, Watson RJ. Cell cycle regulation by the B-Myb transcription factor. Cell Mol Life Sci. 2003;60(11):2389–2401. doi:10.1007/s00018-003-3037-4
22. Musa J, Aynaud MM, Mirabeau O, Delattre O, Grünewald TG. MYBL2 (B-Myb): a central regulator of cell proliferation, cell survival and differentiation involved in tumorigenesis. Cell Death Dis. 2017;8(6):e2895. doi:10.1038/cddis.2017.244
23. Chen X, Lu Y, Yu H, et al. Pan-cancer analysis indicates that MYBL2 is associated with the prognosis and immunotherapy of multiple cancers as an oncogene. Cell Cycle. 2021;20(21):2291–2308. doi:10.1080/15384101.2021.1982494
24. Bar-Shira A, Pinthus JH, Rozovsky U, et al. Multiple genes in human 20q13 chromosomal region are involved in an advanced prostate cancer xenograft. Cancer Res. 2002;62(23):6803–6807.
25. Li Q, Wang M, Hu Y, et al. MYBL2 disrupts the Hippo-YAP pathway and confers castration resistance and metastatic potential in prostate cancer. Theranostics. 2021;11(12):5794–5812. doi:10.7150/thno.56604
26. Li X, Jiao M, Hu J, et al. miR-30a inhibits androgen-independent growth of prostate cancer via targeting MYBL2, FOXD1, and SOX4. Prostate. 2020;80(9):674–686. doi:10.1002/pros.23979
27. Love MI, Huber W, Anders S. Moderated estimation of fold change and dispersion for RNA-seq data with DESeq2. Genome Biol. 2014;15(12):550. doi:10.1186/s13059-014-0550-8
28. Yu G, Wang LG, Han Y, He QY. clusterProfiler: an R package for comparing biological themes among gene clusters. OMICS. 2012;16(5):284–287. doi:10.1089/omi.2011.0118
29. Hänzelmann S, Castelo R, Guinney J. GSVA: gene set variation analysis for microarray and RNA-Seq data. BMC Bioinform. 2013;14(1):7. doi:10.1186/1471-2105-14-7
30. Ito K, Murphy D. Application of ggplot2 to Pharmacometric Graphics. CPT Pharmacomet Syst Pharmacol. 2013;2(10):e79–e. doi:10.1038/psp.2013.56
31. Robin X, Turck N, Hainard A, et al. pROC: an open-source package for R and S+ to analyze and compare ROC curves. BMC Bioinform. 2011;12(1):77. doi:10.1186/1471-2105-12-77
32. Chen W, Zheng R, Baade PD, et al. Cancer statistics in China, 2015. CA Cancer J Clin. 2016;66(2):115–132. doi:10.3322/caac.21338
33. Chandrasekar T, Yang JC, Gao AC, Evans CP. Mechanisms of resistance in castration-resistant prostate cancer (CRPC). Transl Androl Urol. 2015;4(3):365–380. doi:10.3978/j.issn.2223-4683.2015.05.02
34. Wang C, Zhang Y, Gao WQ. The evolving role of immune cells in prostate cancer. Cancer Lett. 2021;525:9–21. doi:10.1016/j.canlet.2021.10.027
35. Lu X, Horner JW, Paul E, et al. Effective combinatorial immunotherapy for castration-resistant prostate cancer. Nature. 2017;543(7647):728–732. doi:10.1038/nature21676
36. Hou X, Zhang Y, Han S, Hou B. A novel DNA methylation 10-CpG prognostic signature of disease-free survival reveal that MYBL2 is associated with high risk in prostate cancer. Expert Rev Anticancer Ther. 2020;20(12):1107–1119. doi:10.1080/14737140.2020.1838280
37. Alberti C. Genetic and microenvironmental implications in prostate cancer progression and metastasis. Eur Rev Med Pharmacol Sci. 2008;12(3):167–175.
38. Di Lorenzo G, Ferro M, Buonerba C. Sipuleucel-T (Provenge®) for castration-resistant prostate cancer. BJU Int. 2012;110(2 Pt 2):E99–104. doi:10.1111/j.1464-410X.2011.10790.x
39. Lou DY, Fong L. Neoadjuvant therapy for localized prostate cancer: examining mechanism of action and efficacy within the tumor. Urol Oncol. 2016;34(4):182–192. doi:10.1016/j.urolonc.2013.12.001
40. Kwek SS, Cha E, Fong L. Unmasking the immune recognition of prostate cancer with CTLA4 blockade. Nat Rev Cancer. 2012;12(4):289–297. doi:10.1038/nrc3223
41. Binnewies M, Roberts EW, Kersten K, et al. Understanding the tumor immune microenvironment (TIME) for effective therapy. Nat Med. 2018;24(5):541–550. doi:10.1038/s41591-018-0014-x
42. Revannasiddaiah S, Gupta I, Devadas SK. Unlocking the potential with the use of check-point inhibitor immunotherapies in metastatic prostate cancer. Chin Clin Oncol. 2019;8(S1):S13. doi:10.21037/cco.2019.01.07
43. Benzon B, Glavaris SA, Simons BW, et al. Combining immune check-point blockade and cryoablation in an immunocompetent hormone sensitive murine model of prostate cancer. Prostate Cancer Prostatic Dis. 2018;21(1):126–136. doi:10.1038/s41391-018-0035-z
 © 2022 The Author(s). This work is published and licensed by Dove Medical Press Limited. The full terms of this license are available at https://www.dovepress.com/terms.php and incorporate the Creative Commons Attribution - Non Commercial (unported, v3.0) License.
By accessing the work you hereby accept the Terms. Non-commercial uses of the work are permitted without any further permission from Dove Medical Press Limited, provided the work is properly attributed. For permission for commercial use of this work, please see paragraphs 4.2 and 5 of our Terms.
© 2022 The Author(s). This work is published and licensed by Dove Medical Press Limited. The full terms of this license are available at https://www.dovepress.com/terms.php and incorporate the Creative Commons Attribution - Non Commercial (unported, v3.0) License.
By accessing the work you hereby accept the Terms. Non-commercial uses of the work are permitted without any further permission from Dove Medical Press Limited, provided the work is properly attributed. For permission for commercial use of this work, please see paragraphs 4.2 and 5 of our Terms.