")
Back to Journals » Journal of Pain Research » Volume 8
Multivariate proteomic analysis of the cerebrospinal fluid of patients with peripheral neuropathic pain and healthy controls – a hypothesis-generating pilot study
Authors Bäckryd E, Ghafouri B , Carlsson AK, Olausson P, Gerdle B
Received 16 February 2015
Accepted for publication 13 April 2015
Published 1 July 2015 Volume 2015:8 Pages 321—333
DOI https://doi.org/10.2147/JPR.S82970
Checked for plagiarism Yes
Review by Single anonymous peer review
Peer reviewer comments 5
Editor who approved publication: Dr Michael Schatman
Emmanuel Bäckryd,1,2 Bijar Ghafouri,1,2 Anders K Carlsson,1,2 Patrik Olausson,1,2 Björn Gerdle1,2
1Division of Community Medicine, Department of Medical and Health Sciences, Faculty of Health Sciences, Linköping University, Linköping, Sweden; 2Pain and Rehabilitation Centre, Anaesthetics, Operations and Specialty Surgery Centre, Region Östergötland, Linköping, Sweden
Abstract: Pain medicine lacks objective biomarkers to guide diagnosis and treatment. Combining two-dimensional gel proteomics with multivariate data analysis by projection, we exploratively analyzed the cerebrospinal fluid of eleven patients with severe peripheral neuropathic pain due to trauma and/or surgery refractory to conventional treatment and eleven healthy controls. Using orthogonal partial least squares discriminant analysis, we identified a panel of 36 proteins highly discriminating between the two groups. Due to a possible confounding effect of age, a new model with age as outcome variable was computed for patients (n=11), and four out of 36 protein spots were excluded due to a probable influence of age. Of the 32 remaining proteins, the following seven had the highest discriminatory power between the two groups: an isoform of angiotensinogen (upregulated in patients), two isoforms of alpha-1-antitrypsin (downregulated in patients), three isoforms of haptoglobin (upregulated in patients), and one isoform of pigment epithelium-derived factor (downregulated in patients). It has recently been hypothesized that the renin–angiotensin system may play a role in the pathophysiology of neuropathic pain, and a clinical trial of an angiotensin II receptor antagonist was recently published. It is noteworthy that when searching for neuropathic pain biomarkers with a purely explorative methodology, it was indeed a renin–angiotensin system protein that had the highest discriminatory power between patients and controls in the present study. The results from this hypothesis-generating pilot study have to be confirmed in larger, hypothesis-driven studies with age-matched controls, but the present study illustrates the fruitfulness of combining proteomics with multivariate data analysis in hypothesis-generating pain biomarker studies in humans.
Keywords: cerebrospinal fluid, multivariate data analysis, neuropathic pain, proteomics
Introduction
Pain medicine lacks objective biomarkers to guide diagnosis and choice of treatment.1 A thorough pain analysis can often discriminate between nociceptive and neuropathic pain, but this is one of few mechanism-based distinctions – albeit a crude one – in clinical pain medicine.2 Neuropathic pain is defined as pain caused by a lesion or disease of the somatosensory system.3 The prevalence of chronic pain with neuropathic characteristics in the general population has been estimated to be ~7%.4 Evidence-based guidelines stipulate the use of certain antidepressants (tricyclics or duloxetine), gabapentinoids, topical lidocaine, and sometimes opioids.5 In severe cases, spinal cord stimulation is a valuable option.6,7 Still, many patients do not reach adequate pain control or experience troublesome side-effects.5,8
The importance of glial cells and neuro-immunity for the development of chronic pain has recently been reviewed.9,10 Glial cells in the spinal cord play an important role in the pathophysiology of neuropathic pain, and nerve injury leads to glial activation.11–13 Glial cells then release key multifunctional cytokines (TNF-α, IL-1β, and IL-6) that initiate and orchestrate the subsequent production of downstream cytokines and other proalgesic mediators.11,12,14
Animal models of neuropathic pain have shown that numerous proteins are up- or downregulated in the spinal cord.15 However, due to experimental model heterogeneity, the proteins up- or downregulated differ strongly between different studies. In humans, the cerebrospinal fluid (CSF) is an interesting target for protein biomarker studies in neurological disorders.16 Pain biomarker candidates in earlier studies have included proteins such as cystatin C,17,18 nociceptin,19,20 and different neurotrophins.21,22 The general rationale of these studies has been to select and analyze one or a few potential proteins at a time. Given the complexity of the processes involved, with multiple protein systems interacting in manifold ways, an alternative research strategy is to explore the entire protein content (ie, the proteome) of the CSF. Recent technological advances have made such high-throughput studies feasible, and broad hypothesis-generating approaches are nowadays seen as an important complement to classical hypothesis-testing modes of research.23
The development of Omics methods (meaning large-scale data analysis for characterization and quantification of pools of biological molecules) has been paralleled by the development of statistical methods capable of handling a high number of intercorrelated substances in few individuals.24,25 Such advanced multivariate methods have been combined with proteomic technology in conditions like motor neuron diseases, Alzheimer’s disease, Parkinson’s disease,26,27 and neuropathic pain.28,29 These two pain studies,28,29 however, did not report any actual biomarker candidates; rather, they were bioinformatics-focused, complementary studies to previously published results by Conti et al.30 Human pain proteomic CSF studies that actually report biomarker candidates typically have about ten subjects per group and have hitherto used traditional univariate statistics.30,31
The aim of this observational, cross-sectional study was to explore the CSF proteome of patients with severe persistent neuropathic pain and healthy controls, using multivariate data analysis (MVDA) by projection24,25 to identify a putative proteomic fingerprint distinctive of this pain condition.
Methods
Procedures
For every subject in this study, intrathecal access was obtained by lumbar puncture with a 27 GA pencil-point Whitacre needle (BD, Franklin Lakes, NJ, USA), and a 10 mL sample of CSF was drawn in five numbered syringes of 2 mL each. Each sample was immediately cooled on ice and was transported to the Painomics® laboratory, Linköping University Hospital, was centrifuged, and was divided in aliquots and stored at −70°C until analysis.
Patients
All pain patients included in this study were also participating in a clinical trial of intrathecal bolus injections of the analgesic ziconotide (ClinicalTrials.gov identifier NCT01373983). Inclusion criteria were: 1) patient, at least 18 years of age, suffering from chronic (≥6 months) neuropathic pain due to trauma or surgery, who had failed on conventional pharmacological treatment; 2) average visual analog scale pain intensity last week ≥40 mm; 3) patient capable of judgment, ie, able to understand information regarding the drug, the mode of administration, and evaluation of efficacy and side effects; and 4) signed informed consent.
Exclusion criteria were: 1) limited life expectancy (investigator’s judgment); 2) intrathecal chemotherapy; 3) known or suspected intracranial hypertension; 4) known liver or kidney disease, defined as serum transaminases, total bilirubin, alkaline phosphatase or creatinine >1.2× upper limit of normal; 5) advanced cardio-pulmonary disease (investigator’s judgment); 6) ongoing infection, whether systemically or locally in the lumbar area; 7) coagulopathy (including medication with warfarin, clopidogrel, and heparin); 8) allergy to ziconotide or any of the excipients in the ziconotide vial; 9) history of psychiatric disorders, which in the investigator’s opinion would put the patient at risk; 10) pregnant or lactating woman; and/or 11) participation in another clinical trial during the last 30 days.
After informed consent was received, the following data were registered: basic demographic data; pain diagnosis; pain duration; present and past medical history; and concomitant medication. A medical examination was performed. All patients had at least probable neuropathic pain according to the criteria published by Treede et al,32 and all were or had been candidates for spinal cord stimulation. After CSF sampling, the patient received an intrathecal bolus injection of ziconotide according to the protocol of the clinical trial by Bäckryd et al.33
Healthy controls
Healthy controls were recruited by local advertisement at the Faculty of Health Sciences, Linköping University, Sweden, and by contacting healthy subjects from earlier studies. After informed consent was obtained, a structured interview was conducted to ensure the absence of any significant medical condition. The following areas were specifically assessed in the interview: earlier major trauma; back, joint, muscle, or skeletal disease; heart or vascular disease; lung or bronchial disease; psychiatric symptoms; neurological, ear, or eye disease; digestive tract disease; kidney, urinary, or genital disease; skin disease; tumor or cancer; endocrine disease; hematological disease; birth defects; other disease, disability, or allergy. Moreover, the presence of a known bleeding disorder was specifically inquired for. The absence of a chronic pain condition was ensured by a structured questionnaire covering sociodemographic data, presence of pain now, location of pain now, generalization of pain, presence of intermittent pain, and duration of persistent pain. The questionnaire also covered anxiety and depressive symptomatology using the Hospital Anxiety and Depression Scale;34 coping aspects (ie, catastrophizing) using the Pain Catastrophizing Scale;35 and health-related quality of life aspects using the Short Form-36 (SF-36)36 in order to ensure that the controls were healthy. Subjects were also given the possibility to make a pain drawing about pain now, pain at worst, and pain at best. Musculoskeletal pain was more deeply assessed by visual analog scale pain intensity last month for nine specific anatomical locations: neck, shoulders, arms, hands, upper back, lower back, hips, knees, and feet. Concomitant medicines were registered. A medical examination was performed, including assessment for fibromyalgia tender points.
Proteomic analysis
CSF (400 μL) from each subject was applied to an albumin and IgG depletion column (Sigma-Aldrich Co, St Louis, MO, USA). Albumin and IgG were removed according to the manufacturer’s recommendations. The samples were desalted and lyophilized as previously described.37 The protein concentration was determined according to Bradford38 and 2D-Quant kit (GE Healthcare UK Ltd, Little Chalfont, UK). The lyophilized proteins were dissolved in 0.50 mL urea sample solution according to Görg et al.39 The samples (containing 50 μg protein for analytical gels and 400 μg for a preparative gel) were applied by in-gel rehydration (according to the manufacturer’s instructions) for 12 hours using low voltage (30 V) in pH 3–10 non-linear immobilized pH gradients. The proteins were then focused for up to 32,000 Vh at a maximum voltage of 8,000 V. Immobilized pH gradients were either used immediately for second-dimensional analysis, or stored at −70°C until analyzed. The second dimension (SDS-PAGE) was conducted by using the Ettan DALTsix apparatus, as strips were loaded onto a 12.5% acrylamide gel. Gels were run simultaneously at 2.5 W per gel, 600 V, 400 mA for 30 minutes, followed by an additional 5 hours or until the blue front reached the bottom of the gel with 17 W per gel, 600 V, and 400 mA at a constant temperature of 15°C. In analytical gels, separated proteins were detected by silver staining as described previously by Shevchenko et al.40 The preparative gels were fluorescently stained according to the manufacturer’s staining protocol with SYPRO Ruby (Thermo Fisher Scientific, Waltham, MA, USA) for mass spectrometry (MS) analysis. The protein patterns of silver-stained analytical gels were analyzed as digitized images, using a charge-coupled device camera in combination with a computerized imaging 16-bit system designed for evaluation of 2-dimensional gel electrophoresis patterns. The amount of protein in a spot was assessed as background-corrected optical density, integrated over all pixels in the spot, and expressed as integrated spot optical density (SOD). In order to correct for differences in total silver stain intensity between different 2-dimensional gel electrophoresis images, the amounts of the compared protein spots were quantified as optical density for individual spot per total protein intensity of all spots in the same gel. Thereby, part-per-million values for all proteins were generated that were evaluated for differences between the groups. Spots present in at least 50% of the gels of either of the two groups were quantified.
Protein identification by mass spectrometry
Protein spots were excised and were digested with trypsin (Promega Corporation, Madison, WI, USA) as described previously.37 The trypsinated peptides were applied to mass spectrometry (LC-MS/MS or MALDI-TOF) for protein identification. The dried tryptic samples from fluorescently stained proteins were dissolved in 6 μL of 0.1% formic acid. Peptides were analyzed using an online nano-flow HPLC system (EASY-nLC; Thermo Fisher Scientific) in conjugation with the mass spectrometer HCTultra PTM Discovery System (Bruker Daltonik GmbH, Bremen, Germany).41 The dried tryptic peptides from silver-stained gel were reconstituted in 0.1% trifluoroacetic acid and mixed 1:1 with matrix (2,5-dihydroxybenzoic acid, 0.02 mg/mL) as described by Ghafouri et al.42 The samples were applied onto the target plate, analyzed using MALDI-TOF MS (Voyager-DE PRO; Thermo Fisher Scientific) with a 337 nm N2 laser set in positive mode, reflector mode, delayed extraction, and instruments settings as defined previously.42 LC-MS/MS spectra were processed by Bruker Daltonik DataAnalysis 3.4, and resulting MS/MS data were searched in NCBInr and SwissProt databases on the MASCOT server (http://www.matrixscience.com/cgi/search_form.pl?FORMVER=2&SEARCH=MIS). Database search parameters were set as follows: the enzyme trypsin was used; up to one missed cleavage was allowed; fixed modifications included were carbamidomethylation of cysteine and oxidation of methionine; mass tolerance for MS precursor ion was 0.8 Da and for MS/MS fragment ion was 0.6 Da; and charge states were varied. Criteria for identification of a protein were at least three peptides of the protein should be identified with a MASCOT score over 25 and an expectation value <1. The mass list generated from the major peaks of the MALDI spectra was submitted to a database search (NCBInr or SWISS-PROT) using MS-FIT search engines. Restrictions were placed on species (human), mass tolerance (50 ppm), maximum missed cleavages by trypsin (up to 1), and cysteine modification by carbamidomethylation.
Statistics
Each proteomic sample can generate the quantification of hundreds or even thousands of potentially mutually interacting proteins. Traditional univariate statistical methods can quantify level changes of individual substances but disregard interrelationships between them and thereby ignore system-wide aspects. Therefore, we used MVDA by projection. For MVDA computations, SIMCA-P+ version 13.0 (Umetrics AB, Umeå, Sweden) was used.
Conceptually, the reader can imagine a multidimensional space where each protein is a dimension (“k” dimensions). Each subject (patient or control) will be a point in this k-dimensional space. Due to a combination of technological development (rendering high k) and practical/economic constraints (leading to a low number of subjects “n”), today’s data tables in the Omics field often have a low subject-to-variable ratio (n<<<k). Classical regression techniques, such as multiple linear regression (MLR) or logistic regression (LR), which were developed in the early days of the 20th century, are not suited for such high-dimensional and multi-collinear data. Hence, today’s data table often breaks one of the underlying assumptions behind MLR and LR, namely that the predictor (X) variables are fairly independent. MLR and LR also assume that a high subject-to-variable ratio is present (eg, >5), and they have difficulties coping with missing data.24
Due to the above-mentioned drawbacks of classical regression techniques (with regression coefficients becoming unstable and their interpretability breaking down), the modern MVDA method of orthogonal partial least squares (OPLS) regression was used instead. OPLS can handle subject-to-variable ratios of <1, and copes well with both multicollinearity and missing data. OPLS is a recent, easier-to-interpret modification of partial least squares. In this study, both OPLS and OPLS-discriminant analysis (OPLS-DA) were used. In OPLS-DA, the outcome variable (Y) is nominal, eg, patient or healthy control.24,25,43 The MVDA workflow and the reporting of parameters necessary for evaluating model quality were in accordance with the paper published by Wheelock and Wheelock.25 For all MVDA analyses, data were log-transformed when needed (using the SIMCA-P+ function “auto transform selected variables as appropriate”), and scaling to unit variance was applied.24,25
First, the data were overviewed by principal components analysis (PCA), which is the foundation of all latent variable projection methods. PCA entails the definition of only a few latent variables that describe the underlying structure in the data. The latent variables (called principal components, or PC) are uncorrelated to each other, and they summarize and simplify the data, separating information from noise and enabling researchers to find relevant patterns in the data. Optimal model dimensionality (ie, number of PCs) is determined by cross-validation, which is a practical and a reliable way to test the significance of a PCA model; this is default in SIMCA-P+. Hence, PCA can be viewed as a form of multivariate correlation analysis. PCA also enables the identification of outliers and deviant subgroups. A PC relates to each original variable by a loading (p), which has a value between −1 and +1. Variables with high loadings (ignoring the sign) are considered to be of large or moderate importance for the PC under consideration. Variables that have high loadings (with positive or negative sign) on the same PC are intercorrelated. Two plots are generated from the PCA analysis: The score plot illustrates the relationships between the subjects, using PCs as axes in a two- or three-dimensional coordinate system and representing each subject by a dot. The complementary loading plot describes the relationships between variables.24,25,43
After data overview with PCA, OPLS-DA was used to regress (predict) group membership, ie, to find which variables were responsible for class discrimination (patient or healthy control). Hence, the outcome variable (Y) was nominal (patient or healthy control), whereas the predictor variables (Xs) where numerical (relative quantification of each measured protein by SOD). In SIMCA-P+, optimal model dimensionality (ie, the number of latent variables) is by default determined by cross-validation, which is a practical and reliable way to test the significance of the model. The R2 value indicates how well the model explains the dataset, and cross-validated Q2 is a measure of the predictive power of the model. If R2 is substantially greater than Q2 (a difference >0.3 is mentioned in the literature24), the robustness of the model is poor, implying overfitting.25 Moreover analysis of variance of cross-validated predictive residuals (CV-ANOVA), which is a SIMCA-P+ diagnostic tool for assessing model reliability, was also computed. CV-ANOVA measures the significance of the observed group separation and provides a familiar P-value metric for the model.25
The importance of the variables can be measured as a variable influence on projection (VIP) value. This indicates the relevance of each X-variable pooled over all dimensions and Y-variables – the group of variables that best explain Y. Variables with VIP ≥1.0 and having a 95% confidence interval not including zero are usually considered significant, but in this study VIP ≥1.5 was used for OPLS-DA. The direction of the relationship (positive or negative) was determined by sign of the corresponding loading. In addition to OPLS-DA, OPLS was also used in patients (n=11) with age as outcome (Y) variable, rendering an age-VIP. Age-VIP <1 or having a 95% confidence interval including zero was taken to indicate a low risk of an association between protein and patient age.24,25,43
For traditional univariate statistics, all computations were made using IBM SPSS® Statistics version 20, and the results in the text and tables are generally given as median values (range) or proportions. Mann–Whitney U test, Fisher’s exact test, and Spearman’s rho for correlation were used as appropriate, and P<0.05 (two-sided test) was considered significant. As many variables were analyzed, one should be aware of the problem of multiple testing, ie, a high risk of Type I errors (false positives). Changing the significance level, eg, with a Bonferroni correction, was considered to be too conservative in the current exploratory study, because of the corresponding risk increase of Type II errors (false negatives).25
Ethics
The healthy controls protocol was approved by the Regional Ethics Committee in Linköping (RECL), Sweden. The clinical trial, from which patient data were derived, was conjointly approved by the Swedish Medical Products Agency and by the RECL. The clinical trial was monitored by the Linköping Academic Research Centre and was conducted according to the standards of Good Clinical Practice (GCP). All lumbar punctures were performed by a specialist in anesthesiology (EB).
Results
Data overview
A data table consisting of eleven patients, eleven healthy controls, and SOD from 260 protein spots was generated. The data table was overviewed by unsupervised PCA (2 PCs, R2=0.29, Q2=0.06) to check for multivariate outliers. No strong outlier was found by Hoteling’s T2 statistic (T2 Critical 99%). Distance to model in X-space (DModX) identified two non-serious borderline moderate outliers, which hence were not excluded from further analysis.24 Patients and healthy controls characteristics are shown in Tables 1 and 2.
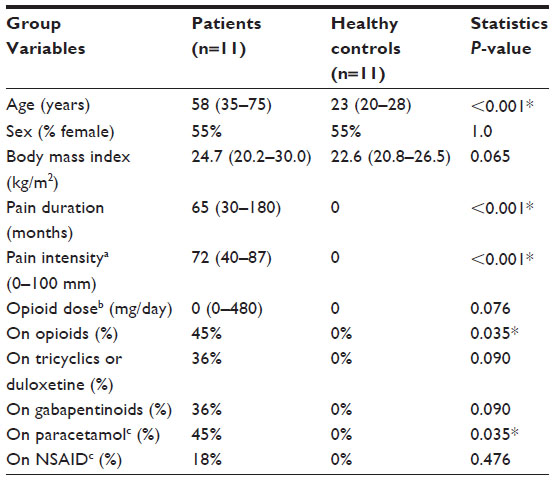 | Table 1 Overview of patients and healthy controls |
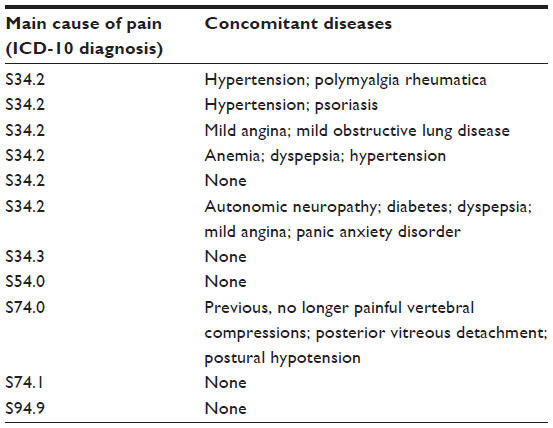 | Table 2 Detailed neuropathic pain patient characteristics (n=11) |
Regression of class discriminating proteins
In order to identify proteins discriminating between patients and healthy controls, an OPLS-DA regression model with three latent variables (one predictive interclass and two orthogonal intraclass) was computed. The model had an excellent fit (R2=0.99) and a good predictivity (Q2=0.70). Hence, clear class separation was achieved (Figure 1), and using CV-ANOVA, the model was shown to be highly significant (P=0.005). VIP computations led to the identification of 36 proteins highly associated with class discrimination (VIP ≥1.5), ie, discriminating between patients and healthy controls.
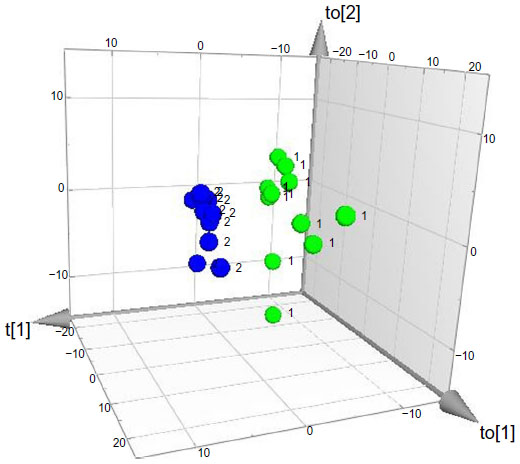 | Figure 1 Three-dimensional score plot of group membership orthogonal partial least squares – discriminant analysis. |
Due to the possible confounding effect of age, a three-latent-variables OPLS regression model was computed for patients (n=11), with age as outcome (Y) variable (R2=0.99 and Q2=0.78). Out of 36 class-discriminating proteins, four were excluded due to a possible confounding effect of age (haptoglobin alpha chain, Ig gamma-1, plasminogen isoform, and unknown protein). Hence, 32 proteins were finally selected as being potential biomarkers (Table 3).
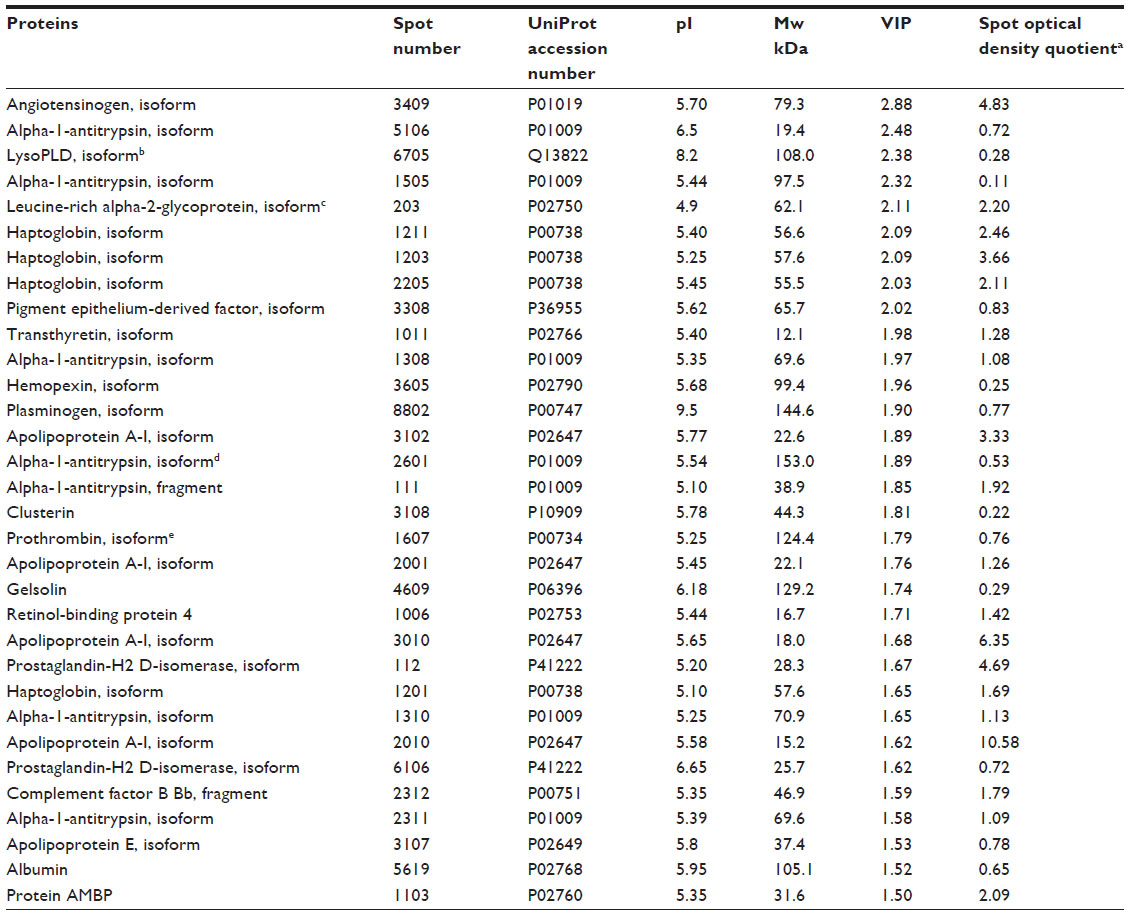 | Table 3 Proteins highly discriminating patients from healthy controls, in descending order of importance according to variable influence on projection (VIP) |
Protein identification
The OPLS-DA analysis showed that seven protein spots had VIP ≥2 and no missing values (Table 3). The spots were excised from the gel, in-gel digested by trypsin, and identified by mass spectrometry. The seven proteins were: one isoform of angiotensinogen, two isoforms of alpha-1-antitrypsin, three isoforms of haptoglobin, and one isoform of pigment epithelium-derived factor (PEDF).
Angiotensinogen (spot 3409)
As underlined in the “Discussion” section, angiotensinogen should not simplistically be thought of as only a vasoactive substance, as it is produced locally in the central nervous system.44 In the present study, the isoform spot 3409 of angiotensinogen was significantly upregulated in patients (Figure 2A, P<0.001), and had the highest discriminatory power between patients and healthy controls (Table 3). In total, five angiotensinogen isoforms were identified, and total angiotensinogen (ie, the sum of the five isoforms) did not differ between groups (P=0.533). Isoform spot 3409 represented 46% (median value) of total angiotensinogen in patients, compared to 12% in controls (P=0.001), indicating a shift in the balance between angiotensinogen isoforms.
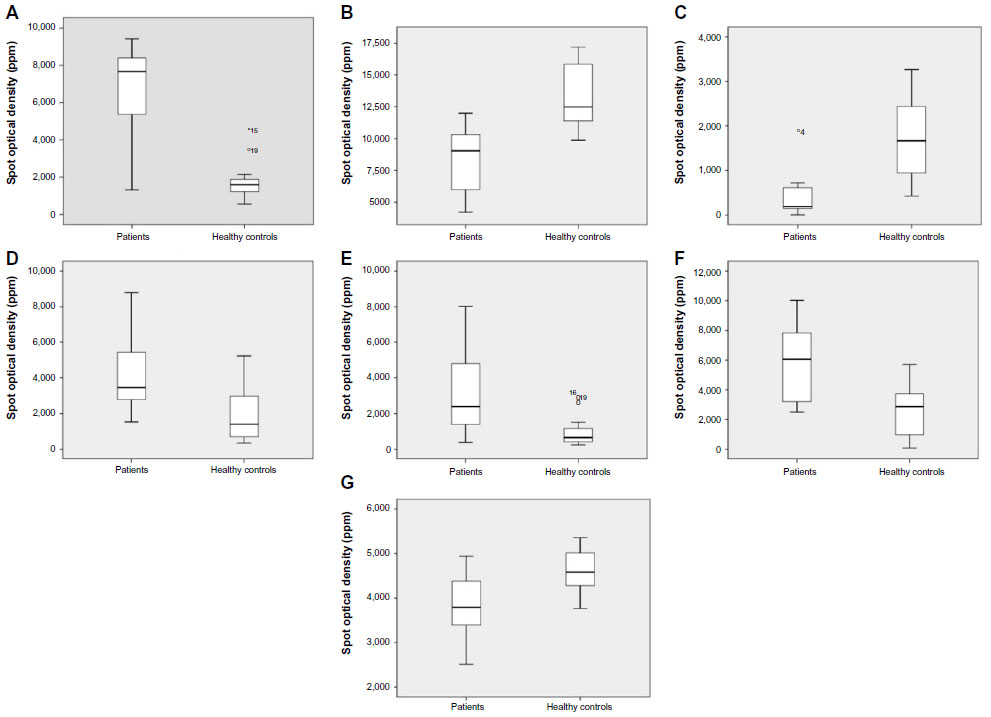 | Figure 2 Spot optical densities in parts per million (ppm) for the seven most discriminating protein spots (patients vs healthy controls). |
To investigate a possible confounding effect of hypertension, a new OPLS-DA was computed after exclusion of the three patients having a hypertension diagnosis (Table 2). Even then, angiotensinogen isoform spot 3409 had the highest VIP of all, and it was of the same magnitude (VIP =2.6). Moreover, with hypertension patients excluded, a significant group difference still existed according to traditional statistics (P=0.002).
To investigate a possible confounding effect of opioid medication, a new OPLS-DA was computed after exclusion of patients taking opioids. Even then, angiotensinogen isoform spot 3409 had the highest VIP of all (VIP =2.97). Moreover, with patients on opioids excluded, both groups still differed by traditional statistics (P<0.001). No correlation between age and spot 3409 was found in patients (n=11, Spearman’s rho =0.05, P=0.884).
Alpha-1-antitrypsin (spots 5106 and 1505)
Two out of 20 identified isoforms of this protein had VIP ≥2, and these two were downregulated in patients (Figure 2B and C; P=0.001 and P=0.002, respectively). According to the location on the gels, five subgroups of alpha-1-antitrypsin were identified. Spot 1505 belonged to a subgroup of four isoforms, and it represented 10% (median value) of these four isoforms in patients, compared to 55% in controls (P<0.001). Total alpha-1-antitrypsin of this subgroup did not differ between patients and healthy controls (P=0.2). Spot 5106, probably a degradation fragment, did not belong to any subgroup.
Haptoglobin (spots 1211, 1203, and 2205)
Three out of five identified isoforms of haptoglobin had VIP ≥2, and they were upregulated in patients (Figure 2D–F; P=0.008, P=0.013, and P=0.013, respectively). These three isoforms together represented 68% (median value) of total haptoglobin in patients, compared to 48% in controls (P=0.019). Total haptoglobin differed between patients and healthy controls (P=0.006).
PEDF (spot 3308)
One out of five identified isoforms of this protein had VIP ≥2; spot 3308 was downregulated in patients (Figure 2G, P=0.013). Spot 3308 represented 31% (median value) of total PEDF in patients, compared to 35% in controls (P=0.053). Total PEDF did not differ between patients and healthy controls (P=0.309).
Final statistical model based on seven proteins
A final OPLS-DA model was computed on the above-mentioned seven proteins. The model had one intra-class latent variable, had a good fit (R2=0.83), and had a high predictivity (Q2=0.78). Hence, clear class separation was achieved with these seven variables, and the model was shown to be highly significant by CV-ANOVA (P<0.001). A typical two-dimensional gel highlighting these seven proteins is shown in Figure 3.
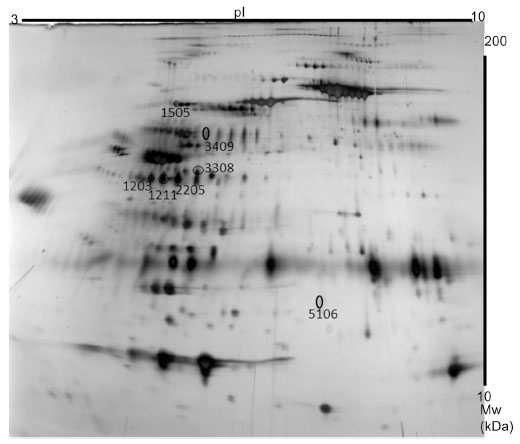 | Figure 3 Typical two-dimensional gel electrophoresis map. |
Pain networks interaction analysis
In order to analyze our results from a systems biology perspective,45 the four genes coding for the above-mentioned seven proteins were entered into a human Pain Networks search (http://www.painnetworks.org, accessed June 9, 2015).46 Using “AGT SERPINA1 HP SERPINF1” as an entry for query genes (AGT codes for angiotensinogen, HP for haptoglobin, SERPINA1 for alpha-1-antitrypsin, and SERPINF1 for pigment epithelium-derived factor), and using the “physical” filtering option (ie, only including interactions with evidence of the proteins physically touching), an interaction map was generated (Figure 4). The map features two known pain-related genes (highlighted in grey in Figure 4): 1) MME codes for neprilysin, which is important for the destruction of opioid peptides,47 and MME interacts with AGT (codes for angiotensinogen); 2) APOE codes for apolipoprotein E, an isoform of which (spot 3107) has VIP =1.53 (Table 3) and interacts with haptoglobin (Figure 4 and as per Salvatore et al48).
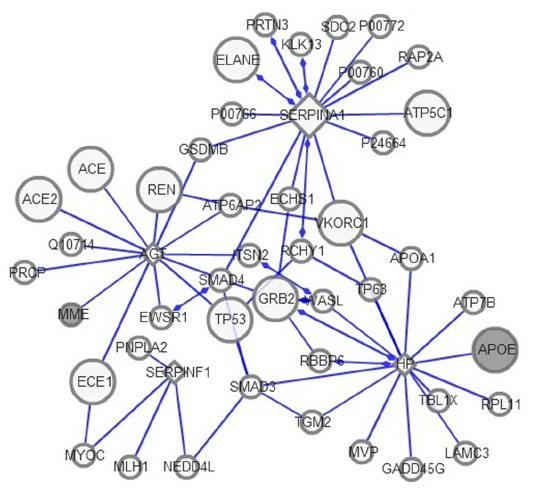 | Figure 4 Interaction map for the four genes coding for the seven proteins having the highest discriminatory power between patients and healthy controls. |
Discussion
Using advanced multivariate techniques, seven highly up- and downregulated proteins in the CSF of patients with peripheral neuropathic pain due to trauma or surgery have been identified. These seven proteins had high discriminatory power to distinguish patients from healthy controls. The protein having the highest discriminatory power between groups was an isoform of angiotensinogen, which was up-regulated in patients.
The results from this hypothesis-generating pilot study have to be confirmed in larger, hypothesis-driven studies with age-matched controls. Nevertheless, the present report indicates a future possibility that a panel of multiple biomarkers will be able to shed light upon the mechanisms involved in neuropathic pain. We think that the systems biology approach presented in this study reopens the field of “pain biomarker” research in humans, the ultimate aim being to find biomarkers useful for diagnostic purposes and choice of treatment. Instead of today’s focus on symptom relief, a better understanding and assessment of different pain mechanisms will perhaps in the future enable clinicians and researchers to develop disease-modifying therapies for chronic pain (as opposed to mere symptom relief).
The central nervous system (CNS) has a local renin–angiotensin system (RAS), and astrocytes synthesize angiotensinogen.44 Investigation of the CSF/plasma ratio of angiotensinogen has confirmed local production in the CNS,49 and the RAS has recently been convincingly linked to the pathophysiology of neuropathic pain.50–55 In this context, it is noteworthy that when searching for neuropathic pain biomarkers with a purely explorative methodology, it was indeed a RAS protein that had the highest discriminatory power between patients and controls in the present study. Hence, our results are in agreement with several other recent lines of evidence, suggesting a role for the RAS in the pathophysiology of neuropathic pain.50–55 Given that angiotensinogen is synthesized by astrocytes, one might speculate that our findings perhaps indicate glial activation in human neuropathic pain.56,57 Although many animal studies have shown glial activation in neuropathic pain models, direct evidence for glial involvement in humans has hitherto been almost nonexistent.57
In the current study, it was a specific isoform of angiotensinogen that was elevated in patients, not total angiotensinogen. Further research is needed to elucidate the mechanisms behind the increase of this particular isoform of angiotensinogen. Indeed, the present study highlights the importance of taking post-translational modifications (PTMs) into account in biomarker studies. It is becoming increasingly clear that PTMs are important in both health and disease. For instance, post-translational glycosylation patterns are said to be an extremely sensitive indicator of intracellular conditions, and the field of glycoproteomics is emerging as an important contributor in the search for biomarkers in different medical conditions.58 The glycosylation form of a protein can be altered significantly because of diseases such as cancer, inflammatory conditions, and neurodegenerative disorders.59–61 For example, the role of glycosylation on alpha-1-antitrypsin has recently been reviewed.60 Hence, PTM patterns are probably important when trying to identify the molecular “fingerprints” of different pain conditions. Other important forms of PTMs include acetylation, deamidation, hydroxylation, nitration, palmitoylation, phosphorylation, sulfation, and ubiquitination.62,63 Hence, looking only at total levels of a particular protein is probably too simplistic in many instances. The current study does not explore the specific PTMs involved, ie, we do not know the exact chemical nature of the isoforms that we have found. We are currently attempting to ascertain these PTMs. Characterization of the chemical nature of the protein isoforms, determination of their origin, and mapping the relationship between these isoforms and other interacting proteins may all lead to a deeper understanding of the pathophysiology of this pain condition.
Both alpha-1-antitrypsin and haptoglobin are well-known plasma acute phase proteins,60,64 but there is also evidence that they can be synthesized in the CNS.64–68 Interestingly, under certain circumstances, astrocytes may synthesize haptoglobin68 and perhaps alpha-1-antitrypsin,66 as well as other proteins discriminating between groups in this study, eg, clusterin69 and apolipoprotein E70 (Table 3). More research is needed to elucidate the source of different isoforms of alpha-1-antitrypsin and haptoglobin, as well as the complex interplay between different PTMs in health and disease.
One isoform of PEDF was downregulated in patients in the current study. It is noteworthy that PEDF has been described as having (among other things) a neuroprotective effect from degeneration due to overexcitation (excitotoxicity) by glutamate.71 In 2005, Conti et al30 found that three isoforms of PEDF were significantly downregulated in patients with non-painful peripheral neuropathies compared to healthy controls; the same isoforms were also lowered in patients with painful peripheral neuropathies, albeit not significantly. However, in contrast to the present study, Conti et al used traditional univariate statistics, thereby disregarding possible system-wide aspects.30
All in all, this study reflects the hypothesis-generating power of proteomics, especially when combined with MVDA. Two-dimensional gel proteomics is a well-known analytical method with high resolution, good reproducibility, and good quantitative analysis capability; it is particularly suited for mapping PTM patterns.72,73 On the one hand, the major limitations of two-dimensional gel techniques have to do with the fact that only more abundant proteins are detected, and on the other hand, with the fact that “extreme proteins” (extremely basic or acidic, extremely small or big) fall outside the isoelectric point (pI)/molecular weight (Mw) range of detection (in this study, 8–250 kDa for Mw and 3–10 for pI).72,73 For instance, a neuropeptide like beta-endorphin falls outside the range of detection of the present study. Other methods are needed to study CSF neuropeptides, eg, a Luminex technology kit.74
The use of MVDA, which includes taking the internal correlation structure of the data set into account, mitigates but does not (in our opinion) completely eliminate the problem of multiple testing. Hence, it is important to emphasize the explorative and hypothesis-generating nature of our findings. Confirmatory, hypothesis-driven studies are warranted, including longitudinal studies concerning the early development of neuropathic pain; the data of our study pertain to a late phase of neuropathic pain. Another important possibility is to reverse-translate these findings into animal models, where it is easier to control for confounding factors.
An important interpretive issue is the possibility of age, comorbidities, and/or concomitant medication acting as confounding factors. Notably, our healthy controls were markedly younger. This is of course a major drawback; it would have been better to have age-matched controls. For practical reasons, this was not possible, reflecting the limitations and difficulties inherent in clinical translational research as opposed to, eg, animal experiments. The fact that CSF is the body fluid studied is of course part of the problem – collecting CSF is in itself not complicated, but the invasive nature of the procedure is an obvious limitation. Using “surrogate normals”75 would have been an option, eg, patients with non-painful diagnoses undergoing surgery in spinal anesthesia, but then another potential confounding effect would have been introduced (ie, these controls would not have been healthy, which does not seem to be a trivial problem).75 Instead, it was chosen to focus on young, healthy subjects, who were age-matched for other pain conditions than chronic neuropathic pain. Hence, this study compares two extremes: patients with severe neuropathic pain intractable to conventional treatment on the one hand, and on the other hand, controls who are “very healthy”. It could be argued that in a hypothesis-generating study like this one, maximizing differences between groups is an advantage, especially when practical constraints limit the number of subjects. Subsequent age-matched confirmatory studies will then have to assess particular protein candidates. Still, even though we took age into account by excluding proteins that were age-related in patients, there is no avoiding the fact that the potential confounding effect of age is a major weakness of this study.
It is generally acknowledged that there is an increase in CSF protein concentrations with age (especially for plasma-derived proteins), and this is interpreted to be due to either a decline of the integrity of the blood–brain barrier or to a decreased CSF turnover.76 However, it is very important to remember that our study quantifies protein levels in a relative (not absolute) manner, the same amount of protein being used for each gel. Moreover, in a study by Zhang et al, less than 10% out of more than 300 identified CSF proteins were more than 20% up- or downregulated in older individuals (66–85 years of age) compared to younger individuals (22–36 years of age).77 Hence, we do not think our results can be dismissed outright as a confounding effect of age, although this of course remains as a possibility.
A related concern is the possible confounding effect of comorbidities and concomitant medication. This was investigated closely in relation to our main result, namely angiotensinogen spot 3409, and neither hypertension nor opioid medication seemed to explain the differences between groups. Hypertension was the only comorbidity that involved more than one patient, and five out of eleven patients had no comorbidity at all.
For such a many-faceted condition as peripheral neuropathic pain, we consider it unlikely that one specific biomarker will be found. Moreover, peripheral neuropathic pain itself should probably not be viewed as a single category. Instead of a single protein approach, we think that in line with modern systems biology,45 the way forward is to try to establish patterns of a number of discriminating proteins, ie, a “multiple protein fingerprint” characteristic for a distinctive pain mechanism. Moreover, reporting a list of proteins is not in itself enough; it is also important to elucidate whether some of these proteins might interact in a common pathophysiological pathway. As an example of this, we used the web-tool Pain Networks, finding interesting, hypothesis-generating interactions indicating the possibility that our panel of seven proteins might participate in a common pathophysiological pathway. The proteins presented (Table 3) can be used in conjunction with, eg, Pain Networks in order to investigate other possible interactions than the ones we have presented.
We conclude that this study illustrates the fruitfulness of combining proteomics with MVDA in hypothesis-generating pain biomarker studies in humans. It has to be stressed that the present paper is a very preliminary study, and the results presented – even though partially in agreement with other studies – need to be validated in new data sets of similar patients and age-matched controls. Many more exploratory and confirmatory studies are needed in different pain conditions and at different time points in order to hopefully achieve the vision of mechanism-based pain diagnoses and treatments.
Acknowledgments
This study was funded by the Swedish Research Council, the Swedish Council for Working Life and Social Research (grant number 2010-0913), the County Council of östergötland (Sinnescentrum), and the Hälsofonden foundation.
Disclosure
The authors report no conflicts of interest in this work.
References
Borsook D, Becerra L, Hargreaves R. Biomarkers for chronic pain and analgesia. Part 1: the need, reality, challenges, and solutions. Discov Med. 2011;11(58):197–207. | |
Woolf CJ; American College of Physicians; American Physiological Society. Pain: moving from symptom control toward mechanism-specific pharmacologic management. Ann Intern Med. 2004;140(6):441–451. | |
Jensen TS, Baron R, Haanpää M, et al. A new definition of neuropathic pain. Pain. 2011;152(10):2204–2205. | |
Bouhassira D, Lanteri-Minet M, Attal N, Laurent B, Touboul C. Prevalence of chronic pain with neuropathic characteristics in the general population. Pain. 2008;136(3):380–387. | |
de Leon-Casasola O. New developments in the treatment algorithm for peripheral neuropathic pain. Pain Med. 2011;12 Suppl 3:S100–S108. | |
Compton AK, Shah B, Hayek SM. Spinal cord stimulation: a review. Curr Pain Headache Rep. 2012;16(1):35–42. | |
Jeon Y, Huh BK. Spinal cord stimulation for chronic pain. Ann Acad Med Singapore. 2009;38(11):998–1003. | |
Baron R, Binder A, Wasner G. Neuropathic pain: diagnosis, pathophysiological mechanisms, and treatment. Lancet Neurol. 2010;9(8):807–819. | |
Grace PM, Hutchinson MR, Maier SF, Watkins LR. Pathological pain and the neuroimmune interface. Nature Rev Immunol. 2014;14(4):217–231. | |
Ren K, Dubner R. Interactions between the immune and nervous systems in pain. Nat Med. 2010;16(11):1267–1276. | |
Vallejo R, Tilley DM, Vogel L, Benyamin R. The role of glia and the immune system in the development and maintenance of neuropathic pain. Pain Pract. 2010;10(3):167–184. | |
Miller RJ, Jung H, Bhangoo SK, White FA. Cytokine and chemokine regulation of sensory neuron function. Handb Exp Pharmacol. 2009(194):417–449. | |
Watkins LR, Milligan ED, Maier SF. Mechanisms of glial activation after nerve injury. In: Basbaum AI, Bushnell MC, editors. Science of Pain. Oxford: Elsevier; 2009:429–433. | |
Gosselin RD, Suter MR, Ji RR, Decosterd I. Glial cells and chronic pain. Neuroscientist. 2010;16(5):519–531. | |
Niederberger E, Geisslinger G. Proteomics in neuropathic pain research. Anesthesiology. 2008;108(2):314–323. | |
Roche S, Gabelle A, Lehmann S. Clinical proteomics of the cerebrospinal fluid: Towards the discovery of new biomarkers. Proteomics Clin Appl. 2008;2(3):428–436. | |
Mannes AJ, Martin BM, Yang HY, et al. Cystatin C as a cerebrospinal fluid biomarker for pain in humans. Pain. 2003;102(3):251–256. | |
Eisenach JC, Thomas JA, Rauck RL, Curry R, Li X. Cystatin C in cerebrospinal fluid is not a diagnostic test for pain in humans. Pain. 2004;107(3):207–212. | |
Brooks H, Elton CD, Smart D, Rowbotham DJ, McKnight AT, Lambert DG. Identification of nociceptin in human cerebrospinal fluid: comparison of levels in pain and non-pain states. Pain. 1998;78(1):71–73. | |
Raffaeli W, Samolsky Dekel BG, Landuzzi D, et al. Nociceptin levels in the cerebrospinal fluid of chronic pain patients with or without intrathecal administration of morphine. J Pain Symptom Manage. 2006;32(4):372–377. | |
Capelle HH, Weigel R, Schmelz M, Krauss JK. Neurotrophins in the cerebrospinal fluid of patient cohorts with neuropathic pain, nociceptive pain, or normal pressure hydrocephalus. Clin J Pain. 2009;25(8):729–733. | |
Lundborg C, Hahn-Zoric M, Biber B, Hansson E. Glial cell line-derived neurotrophic factor is increased in cerebrospinal fluid but decreased in blood during long-term pain. J Neuroimmunol. 2010; 220(1–2):108–113. | |
Biesecker LG. Hypothesis-generating research and predictive medicine. Genome Res. 2013;23(7):1051–1053. | |
Eriksson L, Byrne T, Johansson E, Trygg J, Vikström C. Multi- and Megavariate Data Analysis: Basic Principles and Applications. 3rd ed. Malmö: MKS Umetrics AB; 2013. | |
Wheelock AM, Wheelock CE. Trials and tribulations of omics data analysis: assessing quality of SIMCA-based multivariate models using examples from pulmonary medicine. Mol Biosyst. 2013;9(11):2589–2596. | |
Mazzara S, Cerutti S, Iannaccone S. Application of multivariate data analysis for the classification of two dimensional gel images in neuroproteomics. J Proteomics Bioinform. 2011;4(1):16–21. | |
Nordén B, Broberg P, Lindberg C, Plymoth A. Analysis and understanding of high-dimensionality data by means of multivariate data analysis. Chem Biodivers. 2005;2(11):1487–1494. | |
Cannistraci CV, Ravasi T, Montevecchi FM, Ideker T, Alessio M. Nonlinear dimension reduction and clustering by Minimum Curvilinearity unfold neuropathic pain and tissue embryological classes. Bioinformatics. 2010;26(18):i531–i539. | |
Pattini L, Mazzara S, Conti A, Iannaccone S, Cerutti S, Alessio M. An integrated strategy in two-dimensional electrophoresis analysis able to identify discriminants between different clinical conditions. Ex Biol Med (Maywood). 2008;233(4):483–491. | |
Conti A, Ricchiuto P, Iannaccone S, et al. Pigment epithelium-derived factor is differentially expressed in peripheral neuropathies. Proteomics. 2005;5(17):4558–4567. | |
Liu XD, Zeng BF, Xu JG, Zhu HB, Xia QC. Proteomic analysis of the cerebrospinal fluid of patients with lumbar disk herniation. Proteomics. 2006;6(3):1019–1028. | |
Treede RD, Jensen TS, Campbell JN, et al. Neuropathic pain: redefinition and a grading system for clinical and research purposes. Neurology. 2008;70(18):1630–1635. | |
Bäckryd E, Sörensen J, Gerdle B. Ziconotide Trialing by Intrathecal Bolus Injections: An Open-Label Non-Randomized Clinical Trial in Postoperative/Posttraumatic Neuropathic Pain Patients Refractory to Conventional Treatment. Neuromodulation. Epub 2015 Apr 16. | |
Zigmond AS, Snaith RP. The hospital anxiety and depression scale. Acta Psychiatr Scand. 1983;67(6):361–370. | |
Sullivan MJ, Bishop SR, Pivik J. The pain catastrophizing scale: development and validation. Psychol Assess. 1995;7(4):524–532. | |
Sullivan M, Karlsson J, Ware JE Jr. The Swedish SF-36 Health Survey – I. Evaluation of data quality, scaling assumptions, reliability and construct validity across general populations in Sweden. Soc Sci Med. 1995;41(10):1349–1358. | |
Ghafouri B, Tagesson C, Lindahl M. Mapping of proteins in human saliva using two-dimensional gel electrophoresis and peptide mass fingerprinting. Proteomics. 2003;3(6):1003–1015. | |
Bradford MM. A rapid and sensitive method for the quantitation of microgram quantities of protein utilizing the principle of protein-dye binding. Anal Biochem. 1976;72:248–254. | |
Görg A, Drews O, Lück C, Weiland F, Weiss W. 2-DE with IPGs. Electrophoresis. 2009;30 Suppl 1:S122–S132. | |
Shevchenko A, Wilm M, Vorm O, Mann M. Mass spectrometric sequencing of proteins silver-stained polyacrylamide gels. Anal Chem. 1996;68(5):850–858. | |
Olausson P, Gerdle B, Ghafouri N, Larsson B, Ghafouri B. Identification of proteins from interstitium of trapezius muscle in women with chronic myalgia using microdialysis in combination with proteomics. PLoS One. 2012;7(12):e52560. | |
Ghafouri B, Karlsson H, Mortstedt H, Lewander A, Tagesson C, Lindahl M. 2,5-Dihydroxybenzoic acid instead of alpha-cyano-4-hydroxycinnamic acid as matrix in matrix-assisted laser desorption/ionization time-of-flight mass spectrometry for analyses of in-gel digests of silver-stained proteins. Anal Biochem. 2007;371(1):121–123. | |
Wold S, Sjöström M, Eriksson L. PLS-regression: a basic tool of chemometrics. Chemometr Intell Lab Syst. 2001;58(2):109–130. | |
Paul M, Poyan Mehr A, Kreutz R. Physiology of local renin-angiotensin systems. Physiol Rev. 2006;86(3):747–803. | |
Antunes-Martins A, Perkins JR, Lees J, Hildebrandt T, Orengo C, Bennett DL. Systems biology approaches to finding novel pain mediators. Wiley Interdiscip Rev Syst Biol Med. 2013;5(1):11–35. | |
Perkins JR, Lees J, Antunes-Martins A, et al. PainNetworks: A web-based resource for the visualisation of pain-related genes in the context of their network associations. Pain. 2013;154(12):2586. e1–e12. | |
Poras H, Bonnard E, Dange E, Fournie-Zaluski MC, Roques BP. New orally active dual enkephalinase inhibitors (DENKIs) for central and peripheral pain treatment. J Med Chem. 2014;57(13):5748–5763. | |
Salvatore A, Cigliano L, Carlucci A, Bucci EM, Abrescia P. Haptoglobin binds apolipoprotein E and influences cholesterol esterification in the cerebrospinal fluid. J Neurochem. 2009;110(1):255–263. | |
Brettschneider J, Hartmann N, Lehmensiek V, Mogel H, Ludolph AC, Tumani H. Cerebrospinal fluid markers of idiopathic intracranial hypertension: is the renin-angiotensinogen system involved? Cephalalgia. 2011;31(1):116–121. | |
Anand U, Facer P, Yiangou Y, et al. Angiotensin II type 2 receptor (AT2 R) localization and antagonist-mediated inhibition of capsaicin responses and neurite outgrowth in human and rat sensory neurons. Eur J Pain. 2013;17(7):1012–1026. | |
Rice AS, Dworkin RH, McCarthy TD, et al. EMA401, an orally administered highly selective angiotensin II type 2 receptor antagonist, as a novel treatment for postherpetic neuralgia: a randomised, double-blind, placebo-controlled phase 2 clinical trial. Lancet. 2014; 383(9929):1637–1647. | |
Smith MT, Lau T, Wallace VC, Wyse BD, Rice AS. Analgesic efficacy of small-molecule angiotensin II type 2 receptor antagonists in a rat model of antiretroviral toxic polyneuropathy. Behav Pharmacol. 2014; 25(2):137–146. | |
Finnerup NB, Baastrup C. Angiotensin II: from blood pressure to pain control. Lancet. 2014;383(9929):1613–1614. | |
Marion E, Song OR, Christophe T, et al. Mycobacterial toxin induces analgesia in buruli ulcer by targeting the angiotensin pathways. Cell. 2014;157(7):1565–1576. | |
Nemoto W, Nakagawasai O, Yaoita F, et al. Angiotensin II produces nociceptive behavior through spinal AT1 receptor-mediated p38 mitogen-activated protein kinase activation in mice. Mol Pain. 2013;9(1):38. | |
Mika J, Zychowska M, Popiolek-Barczyk K, Rojewska E, Przewlocka B. Importance of glial activation in neuropathic pain. Eur J Pharmacol. 2013;716(1–3):106–119. | |
Tiwari V, Guan Y, Raja SN. Modulating the delicate glial-neuronal interactions in neuropathic pain: promises and potential caveats. Neurosci Biobehav Rev. 2014;45:19–27. | |
Hua S, An HJ. Glycoscience aids in biomarker discovery. BMB Rep. 2012;45(6):323–330. | |
Drake PM, Cho W, Li B, et al. Sweetening the pot: adding glycosylation to the biomarker discovery equation. Clin Chem. 2010;56(2):223–236. | |
McCarthy C, Saldova R, Wormald MR, Rudd PM, McElvaney NG, Reeves EP. The role and importance of glycosylation of acute phase proteins with focus on alpha-1 antitrypsin in acute and chronic inflammatory conditions. J Proteome Res. 2014;13(7):3131–3143. | |
Pan S, Chen R, Aebersold R, Brentnall TA. Mass spectrometry based glycoproteomics – from a proteomics perspective. Mol Cell Proteomics. 2011;10(1):R110.003251. | |
Karve TM, Cheema AK. Small changes huge impact: the role of protein posttranslational modifications in cellular homeostasis and disease. J Amino Acids. 2011;2011:207691. | |
Rogowska-Wrzesinska A, Le Bihan MC, Thaysen-Andersen M, Roepstorff P. 2D gels still have a niche in proteomics. J Proteomics. 2013;88:4–13. | |
Chang KH, Tseng MY, Ro LS, et al. Analyses of haptoglobin level in the cerebrospinal fluid and serum of patients with neuromyelitis optica and multiple sclerosis. Clin Chim Acta. 2013;417:26–30. | |
Pendyala G, Trauger SA, Kalisiak E, Ellis RJ, Siuzdak G, Fox HS. Cerebrospinal fluid proteomics reveals potential pathogenic changes in the brains of SIV-infected monkeys. J Proteome Res. 2009;8(5):2253–2260. | |
Gollin PA, Kalaria RN, Eikelenboom P, Rozemuller A, Perry G. Alpha 1-antitrypsin and alpha 1-antichymotrypsin are in the lesions of Alzheimer’s disease. Neuroreport. 1992;3(2):201–203. | |
Jesse S, Lehnert S, Jahn O, et al. Differential sialylation of serpin A1 in the early diagnosis of Parkinson’s disease dementia. PLoS One. 2012;7(11):e48783. | |
Lee MY, Kim SY, Choi JS, et al. Upregulation of haptoglobin in reactive astrocytes after transient forebrain ischemia in rats. J Cereb Blood Flow Metab. 2002;22(10):1176–1180. | |
Cordero-Llana O, Scott SA, Maslen SL, et al. Clusterin secreted by astrocytes enhances neuronal differentiation from human neural precursor cells. Cell Death Differ. 2011;18(5):907–913. | |
Morikawa M, Fryer JD, Sullivan PM, et al. Production and characterization of astrocyte-derived human apolipoprotein E isoforms from immortalized astrocytes and their interactions with amyloid-beta. Neurobiol Dis. 2005;19(1–2):66–76. | |
Craword SE, Fitchev P, Veliceasa D, Volpert OV. The many facets of PEDF in drug discovery and disease: a diamond in the rough or split personality disorder? Expert Opin Drug Discov. 2013;8(7):769–792. | |
Rabilloud T. Two-dimensional gel electrophoresis in proteomics: old, old fashioned, but it still climbs up the mountains. Proteomics. 2002; 2(1):3–10. | |
Rabilloud T, Lelong C. Two-dimensional gel electrophoresis in proteomics: a tutorial. J Proteomics. 2011;74(10):1829–1841. | |
Bäckryd E, Ghafouri B, Larsson B, Gerdle B. Do low levels of beta-endorphin in the cerebrospinal fluid indicate defective top-down inhibition in patients with chronic neuropathic pain? A cross-sectional, comparative study. Pain Med. 2014;15(1):111–119. | |
Schutzer SE, Liu T, Natelson BH, et al. Establishing the proteome of normal human cerebrospinal fluid. PLoS One. 2010;5(6):e10980. | |
Chen CP, Chen RL, Preston JE. The influence of ageing in the cerebrospinal fluid concentrations of proteins that are derived from the choroid plexus, brain, and plasma. Exp Gerontol. 2012;47(4):323–328. | |
Zhang J, Goodlett DR, Peskind ER, et al. Quantitative proteomic analysis of age-related changes in human cerebrospinal fluid. Neurobiol Aging. 2005;26(2):207–227. |
 © 2015 The Author(s). This work is published and licensed by Dove Medical Press Limited. The full terms of this license are available at https://www.dovepress.com/terms.php and incorporate the Creative Commons Attribution - Non Commercial (unported, v3.0) License.
By accessing the work you hereby accept the Terms. Non-commercial uses of the work are permitted without any further permission from Dove Medical Press Limited, provided the work is properly attributed. For permission for commercial use of this work, please see paragraphs 4.2 and 5 of our Terms.
© 2015 The Author(s). This work is published and licensed by Dove Medical Press Limited. The full terms of this license are available at https://www.dovepress.com/terms.php and incorporate the Creative Commons Attribution - Non Commercial (unported, v3.0) License.
By accessing the work you hereby accept the Terms. Non-commercial uses of the work are permitted without any further permission from Dove Medical Press Limited, provided the work is properly attributed. For permission for commercial use of this work, please see paragraphs 4.2 and 5 of our Terms.