")
Back to Journals » Drug Design, Development and Therapy » Volume 15
Multivariate Assessment for Bioequivalence Based on the Correlation of Random Effect
Received 7 May 2021
Accepted for publication 18 August 2021
Published 23 August 2021 Volume 2021:15 Pages 3675—3683
DOI https://doi.org/10.2147/DDDT.S318576
Checked for plagiarism Yes
Review by Single anonymous peer review
Peer reviewer comments 4
Editor who approved publication: Professor Manfred Ogris
Hyungmi An,1 Dongseong Shin2,3
1Institute of Convergence Medicine, Ewha Womans University Mokdong Hospital, Seoul, Korea; 2Department of Pharmacology, Gachon University College of Medicine, Incheon, Korea; 3Clinical Trials Center, Gachon University Gil Medical Center, Incheon, Korea
Correspondence: Dongseong Shin
Department of Pharmacology, Gachon University College of Medicine, 21, Namdong-daero 774 Beon-gil, Namdong-gu, Incheon, 21565, Korea
Tel +82-32-460-9459
Fax +82-32-460-9443
Email [email protected]
Background and Objective: Bioequivalence tests are fundamental step in assessing the equivalence in bioavailability between a test and reference product. In practice, two separate linear mixed models (LMMs) with random subject effects, which have an area under the concentration-time curve (AUC) and the peak concentration (Cmax) as the responses, have become the gold standard for evaluating bioequivalence. Recently, Lee et al developed a multivariate hierarchical generalized linear model (HGLM) for several responses that modeled correlations among multivariate responses via correlated random effects. The objective of this study was to apply this multivariate analysis to the bioequivalence test in practice and to compare the performance of multivariate HGLM and separate LMMs.
Methods: Three pharmacokinetic datasets, fixed-dose combination (naproxen and esomeprazole), tramadol and fimasartan data were analyzed. We compared the 90% confidence interval (CI) for the geometric mean ratio (GMR) of a test product to a reference product using the multivariate HGLM and two conventional separate LMMs.
Results: We found that the 90% CIs for the GMRs of both AUC and Cmax from the multivariate HGLM were narrower than those from the separate LMMs: (0.843, 1.152) vs (0.825, 1.177) for Cmax of esomeprazole in fixed-dose combination data; (0.805, 0.931) vs (0.797, 0.941) for Cmax in tramadol data; (0.801, 1.501) vs (0.762, 1.578) for Cmax and (1.163, 1.332) vs (1.009, 1.341) for AUC in fimasartan data, consistent with the random subject effects from two separate LMMs being highly correlated in the three datasets (correlation coefficient r = 0.883; r = 0.966; r = 0.832).
Conclusion: This multivariate HGLM had good performance in the bioequivalence test with multiple endpoints. This method would provide a more reasonable option to reduce the 90% CI by adding correlation parameters and thus an advantage especially in evaluating the bioequivalence of highly variable drugs with broad 90% CIs.
Keywords: bioequivalence test, correlated multiple responses, multivariate random effects model, H-likelihood, multivariate HGLM
Introduction
Bioequivalence tests are conducted to assess equivalence in bioavailability between a test and reference drug product.1 When they are pharmaceutically comparable based on the active ingredient, formulation, dosage strength, and route of administration, and their pharmacokinetic profiles are not significantly different, the products are therapeutically equivalent.1–4 Bioequivalence is commonly evaluated using the area under the concentration-time curve (AUC) and the peak concentration (Cmax), which are assumed to be log-normally distributed.5 If the 90% confidence interval (CI) for the geometric mean ratio (GMR) of a test product to a reference product falls within the bioequivalence limit of 0.8 to 1.25 for both AUC and Cmax, the test product is considered to be bioequivalent.5 Bioequivalence tests have also been conducted in comparative pharmacokinetic studies and drug–drug interaction studies, where similarity in pharmacokinetic profiles is of interest.
In general, noncompartmental pharmacokinetic analysis has been considered as the standard approach for bioequivalence testing.6 However, because of certain limitations of noncompartmental analysis including sufficient samples at time points post dose, observed sampling time points for AUC0–t/AUCinf > 0.8, systemic circulation related to the exposure of site of action and linear pharmacokinetics, the model-based approach may be more appropriate in specific situations.6 The model-based approach is individual-based, separately fitted data and is able to evaluate the pure metric of rate reflecting the individual absorption rate constants (Ka).6 As a result, model-based approaches can be beneficial for drugs with complex pharmacokinetics including nonlinear pharmacokinetics, non-elimination from the sampling compartment and endogenous homeostatic feedback mechanism, which may not be applicable to the assumption of noncompartmental analysis.6 Furthermore, biosimilars and topical dermatological drugs are preferable candidates to apply the model-based approach due to the comparison of rate and extent of exposure at the site of action.6.
Using a linear mixed model (LMM) with period, sequence, and treatment as fixed effects and subject as a random effect, and fitting this model with log(AUC) or log(Cmax) as a response, the GMR, the exponent of the estimate for the treatment effect, can be obtained for bioequivalence testing.1 Although, 80–125% for the ratio of the product averages was suggested as the bioequivalence criteria in general, in the case of highly variable drugs with an expected within-subject variability of 30% or greater in the pharmacokinetic measures Cmax or AUC (ie), concerns about the bioequivalence limit have been raised.7 This is because the high variability with a wide 90% CI for the GMR makes it difficult to be included in the standard bioequivalence limit.7
To address the issues with highly variable drugs, regulatory agencies generally agree that direct expansion of the bioequivalence limits, enlargement of the sample size, or special study designs including pharmacokinetic evaluation at steady state or replicated design are required.3,7,8 For broadening of the bioequivalence limits, the acceptance range for Cmax can be widened to a maximum of 0.6984–1.4319 according to within-subject CV of Cmax.3 However, these proposed solutions for drugs with high intrasubject variability gave rise to safety or efficacy concerns and ethical issues regarding unnecessarily large numbers of subjects.7
It is well known that AUC and Cmax are strongly correlated because they are two interrelated parameters in the same subject that represent the extent and rate of the exposure to a drug, respectively.9,10 However, usually the 90% CIs of GMR between a test and reference product have been estimated separately for AUC and Cmax assuming that these endpoints are independent.5 This could lead to wider 90% CIs, thereby increasing the probability that a test product fails to meet bioequivalence criteria, with respect to the reference product, when in fact, it is bioequivalent.4,7
A multivariate approach to address bioequivalence has been applied in the last few decades. Chinchilli and Elswick suggested a multivariate assessment based on the acceptable region of the reference profile and another region of the test profile.11 Quan et al developed a simultaneous equivalence assessment and an intersection union test for testing on multiple endpoints, which were developed by Berger and Hsu, and Wang et al.12–14 In addition, another Bayesian modeling of multivariate average bioequivalence was introduced by Ghosh and Gonen.9 Most methods are likelihood approaches that consider all endpoints, including AUC and Cmax, come from a multivariate normal distribution, resulting in correlated parameter estimates and test statistics.4 Lee et al developed multivariate models by assuming correlations among random effects for different responses.15 They showed several examples that have multiple correlated responses from the same subject and compared the correlated model to independent models.16
The objective of the present work is to apply multivariate analysis to the bioequivalence test in practice and to compare the performances of this model and separate models. To this end, three datasets that have been described previously by Choi et al and Yi et al were analyzed.17–19 In particular, two datasets by Yi et al are interesting case studies because of the 90% CI of the GMR being out of the equivalence limit.17,18 More precisely, one is a comparative pharmacokinetic study that has a 90% CI of the GMR for Cmax slightly beyond the limit, and the other is a drug–drug interaction study in which the product consists of highly variable drugs with large within-subject variability Cmax. Using the data shared by the authors, our goal was to build a multivariate model for two co-primary endpoints, AUC and Cmax, which incorporated the correlation between responses by multivariate random effects. We sought to compare both 90% CIs for the GMR of Cmax using the multivariate model and separate models.
The remainder of this paper is organized as follows. First, we describe the three datasets being considered and remind the reader of the bioequivalence test problem and conventional LMM. This is followed by an explanation of the multivariate HGLM used to test bioequivalence in detail. In the following section, the results of different analyses for the three datasets are reported and discussed before concluding.
Materials and Methods
Pharmacokinetic Study Data
Our analysis was based on three pharmacokinetic datasets that have been described previously in detail by Choi et al and Yi et al.17–19 The names of the patients were anonymized, and the patients provided informed consent.
The fixed-dose combination (naproxen and esomeprazole) data were obtained from a comparative pharmacokinetic study of a newly developed (HCP1004) and marketed (VIMOVO®) fixed-dose combination of naproxen (500mg) and esomeprazole (20mg); it was an open-label, randomized, single dose, 2-treatment 2-sequence crossover study in 66 healthy male subjects.19 In each period, a reference (VIMOVO®) or a test (HCP1004) drug was administered orally, and blood samples for PK analysis were obtained for 72 h post dose. The Cmax and AUC0-t of naproxen and esomeprazole were estimated, to compare the pharmacokinetic parameters between the two drugs using two separate LMMs (1) with the period, sequence, and treatment as fixed effects and subject as random effects.
The pharmacokinetic results of tramadol were obtained from a comparative pharmacokinetic study between an extended-release (ER) and immediate-release (IR) fixed-dose combination (tramadol, 37.5 mg/acetaminophen 325 mg); it was an open-label, multiple dose, randomized, 2-sequence, 2-period crossover study in 12 healthy male subjects.17 All subjects were orally administered both formulations: IR formulations for 4 days followed by ER formulations for 4 days, or vice versa. The Cmax and AUC0–12 at steady state (on day 4) were calculated to compare the pharmacokinetic profiles of ER and IR formulations using the two separate LMMs (1).17
The fimasartan data were obtained from a drug–drug interaction study between fimasartan and amlodipine; it was an open-label, multiple-dose, 1-sequence 2-period crossover study in 19 healthy male subjects.18 All subjects received fimasartan 120mg alone for 7 days in period I. With a 5-day washout period, they were administered amlodipine 10mg and fimasartan 120mg for 7 days in period II.18 The effect of the co-administration of fimasartan and amlodipine at steady-state was investigated by the Cmax and AUC0–24 on day 7 using two separate LMMs (1) without period and sequence effects.
Linear Mixed Models and Multivariate Hierarchical Generalized Linear Models
Let  be the repeatedly measured outcome from subject i in period j with a crossover design (i = 1, …, m; j = 1, …, q). We then considered a linear mixed model (LMM) with period, sequence, and treatment as fixed effects and subject as random effects.
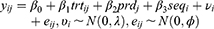
where  for the test and
  for the reference,
  and
and  are covariates indicating period j and the sequence of subject i, and
  is the subject-specific random effect.4 The between (inter)-subject variance and within (intra)-subject variance are presented by variances
 and
and , respectively. The standard error of the treatment effect
  determines the width of the 90% CI for GMR of a test to the reference, and it depends largely on the within-subject variance
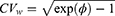
  .4 The within-subject coefficient of variation
  is defined as
When we applied model (1) for log(AUC) or log(Cmax) as a response, then  , the estimate for the GMR of the test to the reference, can be calculated for bioequivalence assessment.4
If there are two or more coprimary endpoints that are correlated, such as Cmax and AUC, in clinical pharmacology data, multivariate HGLMs suggested by Lee et al can be applied.15 Let  and
and  be jth two outcomes from subject i (i = 1, …, m; j = 1, …, q), and υ1i and υ2i be the subject-specific random effects that are correlated.4 It is assumed that
  and
and  are conditionally independent given
  and
and  4 Then, the following bivariate HGLM can be proposed.4
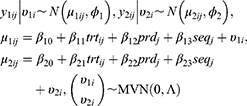
where  , the vector of two subject random effects, follows a multivariate normal distribution with variance-covariance matrix
 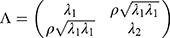 composed of
  ,
,  , and
, and 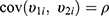 . The correlation coefficient
  of subject random effects satisfies
  .4 Correlations between
  and
and  within a same subject i are explained through the correlations between subject-specific random effects
  and
and  .4 If
.4 If  , then two outcomes
  and
and  from the same subject are independent and this model is equivalent to two conventional separate LMMs (1).4 If
  , then it is equivalent to two conventional separate LMMs (1).4 These two LMMs are nested in the bivariate HGLM, and the likelihood ratio (LR) test can be used to select a better model.4 All statistical analyses were conducted using the R software (version 3.6.1) with the mdhglm package and the R codes are provided as Supplement 1.
Results
Fixed-Dose Combination (Naproxen and Esomeprazole) Data
In the original study of Choi et al, the Cmax and AUC0-t were separately analyzed by the LMM (1) with the period, sequence, and treatment as fixed effects and subject as random effects assuming independence between two responses for each ingredient (naproxen or esomeprazole).19 As a result of the conventional analysis (using separate two LMMs), the GMRs and 90% CIs (HCP1004 to VIMOVO®) of the Cmax and AUC0–72 of naproxen were 0.993 (0.936, 1.054) and 0.996 (0.984, 1.009), respectively. For esomeprazole, the GMRs (with 90% CI) for Cmax and AUC0–12 were 0.985 (0.825, 1.177) and 1.038 (0.915, 1.178), respectively (Table 1).
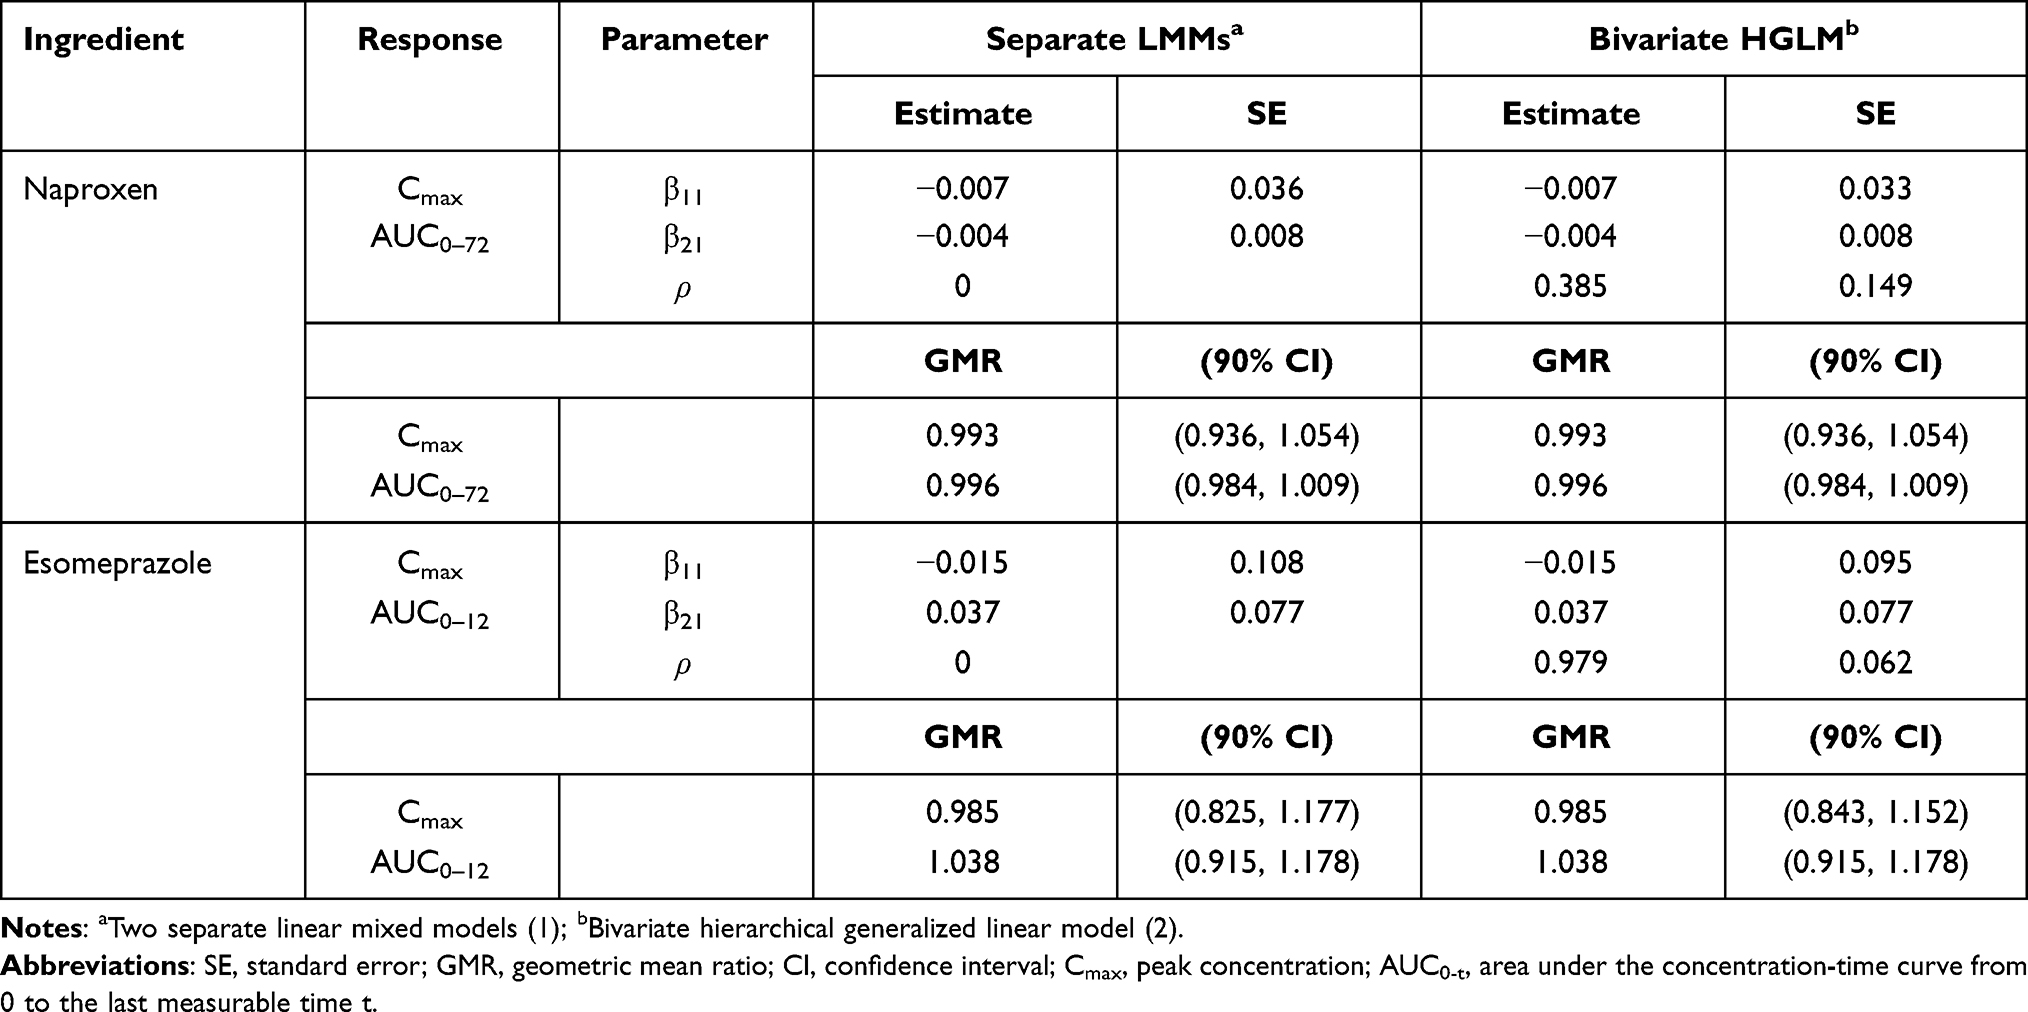 |
Table 1 Summaries of Multivariate (Bivariate HGLM) and Conventional Analysis (Separate LMMs) for the Fixed-Dose Combination (Naproxen and Esomeprazole) Data |
We also performed multivariate analysis (bivariate HGLM) to assess the bioequivalence between the two products. For naproxen, estimates and standard errors for the treatment effects in both Cmax and AUC0–72 by the bivariate HGLM (3) are the same as those of the separate LMMs; therefore, GMRs with 90% CIs remained the same for both Cmax and AUC0–72. In the case of esomeprazole, the standard error of the treatment effect for Cmax by the bivariate HGLM (3) was 0.095, under 0.108, that by the separate LMMs, and this leads to a narrower 90% CI of the GMR for Cmax ((0.843, 1.152) vs (0.825, 1.177)) while remaining the same for AUC0–12.
Based on the restricted likelihood, LR was calculated to test the statistical significance of the correlation coefficient ρ. Because the independent model (separate two LMMs) is nested in the correlated model (bivariate HGLMs), the LR test for  is used to select a better model between two separate LMMs and the bivariate HGLM. It rejects the null hypothesis because of the deviance difference
  ; thus, the LR test selects the bivariate HGLM as a better model.
Figure S1a and b in the Supplement 2 show that there are positive correlations between subject random effects of each LMM for log(Cmax) and log(AUC0-t) in naproxen and esomeprazole (r = 0.286 and r = 0.883, respectively). For naproxen in the fixed-dose combination data, the correlation coefficient r = 0.286 is relatively small and the reported within-subject coefficient of variation ( ) in a previous study was less than 30%; therefore, the estimated results using bivariate HGLM were unchanged.20 However, in the case of esomeprazole, the correlation coefficient (r = 0.883) and reported
  in a previous study were all relatively high (
 ) and the results from bivariate HGLMs showed obvious differences.20
Tramadol Data
In the original study by Yi et al, the Cmax and AUC0–12 at steady state were separately analyzed by the LMM (1) with the period, sequence, and treatment as fixed effects and subject as random effects assuming independence between two responses.17 The GMR of the extended-release (ER) to immediate-release (IR) formulation for AUC0–12 was 0.947 with a 90% CI (0.910, 0.986). However, the Cmax was 0.866 with a 90% CI (0.797, 0.941), which was slightly lower than the bioequivalence criteria. Moreover, Figure S1c in the Supplement 2 shows strong positive correlations between subject random effects for log(Cmax) and those for log(AUC0–12) in the tramadol results (r = 0.966) with relatively low within-subject coefficient of variation ( = 0.106 as maximum) as reported in a previous study. We can expect different results to come from the bivariate HGLMs.21
The results of the two conventional separate LMMs and bivariate HGLMs are summarized in Table 2. The LR test for  rejects the null hypothesis because the deviance difference between separate LMMs and the bivariate HGLM is
  ; thus, the LR test selects the bivariate HGLM. The standard error for the treatment effect in Cmax by the bivariate HGLM (3) was 0.040, under 0.046, that by the separate LMMs, and this led to a narrower 90% CI of the GMR for Cmax. As a result of the bivariate HGLM, both the 90% CI of GMR for Cmax and AUC0–12 were included in the bioequivalence limit (0.8, 1.25), and the ER formulation was equivalent to the IR formulation.
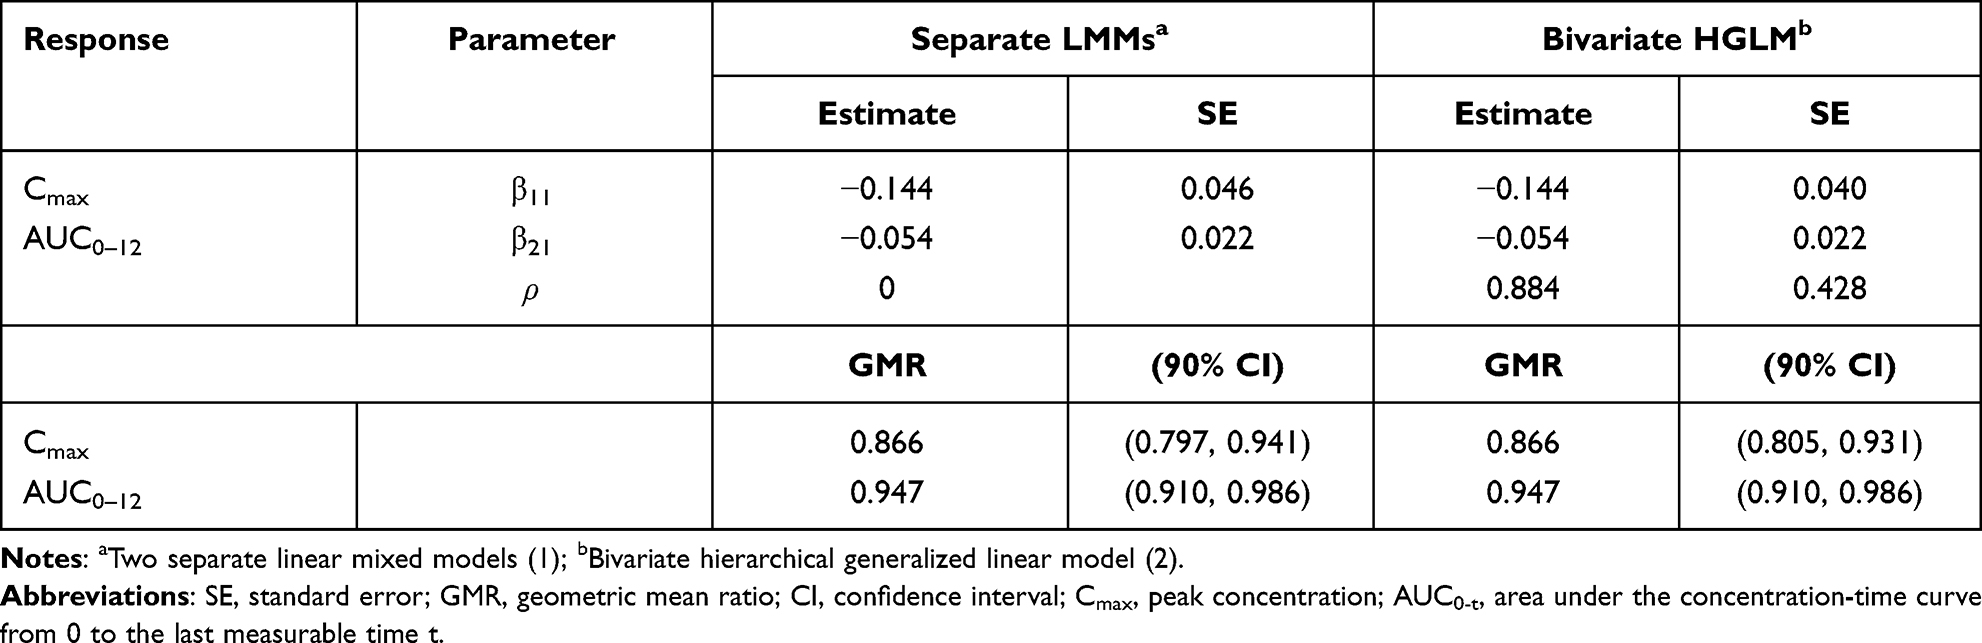 |
Table 2 Summaries of Multivariate (Bivariate HGLM) and Conventional Analysis (Separate LMMs) for the Tramadol Data |
Fimasartan Data
Yi et al used conventional independent LMMs (1) without sequence and period effects for the analysis of Cmax and AUC0–24 at steady state.18 The GMR and 90% CI of co-administration of fimasartan with amlodipine to fimasartan alone for Cmax were 1.096 and 0.761–1.579, respectively, and those for AUC0–24 were 1.163 and 1.009–1.341, respectively. These findings indicate that fimasartan is a highly variable drug with large within-subject variability for Cmax ( ) and moderate within-subject variance for AUC (
 ), similar to that reported in previous studies.22,23 As shown in the tramadol data, the fimasartan data have strong positive correlations (r = 0.832) between subject random effects for log(Cmax) and those for log(AUC0–24) in Figure S1d. Therefore, there are differences between the results obtained using two separate LMMs and a bivariate HGLM.
We performed multivariate analysis using bivariate HGLM (3) without sequence and period effects on fimasartan data. A summary of the results of the two methods is shown in Table 3. The LR test for H0: ρ = 0 rejects the null hypothesis because the deviance difference between separate LMMs and the bivariate HGLM is  ; thus, the LR test selects the bivariate HGLM. The bivariate HGLM yields smaller standard errors than conventional LMMs for treatment effects, which results in narrower 90% confidence intervals.
 |
Table 3 Summaries of Multivariate (Bivariate HGLM) and Conventional Analysis (Separate LMMs) for the Fimasartan Data |
Discussion
In the assessment of bioequivalence, a valid statistical evaluation of pharmacokinetic endpoints representing bioavailability, including AUC and Cmax, is required to guarantee the safety and efficacy of the therapeutic effect.9 While AUC is the most accepted measure to assess bioequivalence, no single parameter can be concluded to be universally superior to the other endpoints.9 In general, the extent of absorption is evaluated by AUC, and Cmax is often used for the rate of absorption.24 Because they are highly correlated, Cmax is not enough to reflect the pure rate of absorption, and alternative markers such as the ratio of Cmax/AUC or time to achieve maximum concentration (Tmax) were proposed instead of Cmax.2,9,24 Although these markers were relatively independent of AUC, their usefulness is limited due to the low power caused by their discrete nature or the assumption of normality for random effects.25,26 Essentially, bioequivalence is a multivariate endpoint from the same biological sample measurements, and correlation between primary endpoints has to be considered for clearly appropriate analysis.9,27 However, currently accepted practice usually involves univariate bioequivalence analysis.9 Although several average bioequivalence (ABE) studies have been generated, there are a limited number of multivariate analyses.9,12,25,26
In the present study, we adapted an advanced bioequivalence test model based on multivariate analysis for pharmacokinetic studies and compared the results from a multivariate HGLM and two conventional independent LMMs in real datasets. Because pharmacokinetic parameters such as AUC and Cmax are highly correlated, these correlations need to be incorporated into the multivariate model, which deals with multiple endpoints simultaneously. It is clear that the multivariate HGLM, including the correlation structure between the two responses, leads to smaller standard errors for estimates of treatment effects. This is because when point estimates of fixed effects do not change and total variations remain the same, the additional parameter in the structured variance-covariance matrix increases the proportion of the explained variance by the model with respect to the total variance. In other words, the correlation parameter fed into the model improved the power of explanation for intrasubject variations; thus, it was observed that the GMRs did not change, but 90% confidence intervals were prone to shrink (Figure 1).
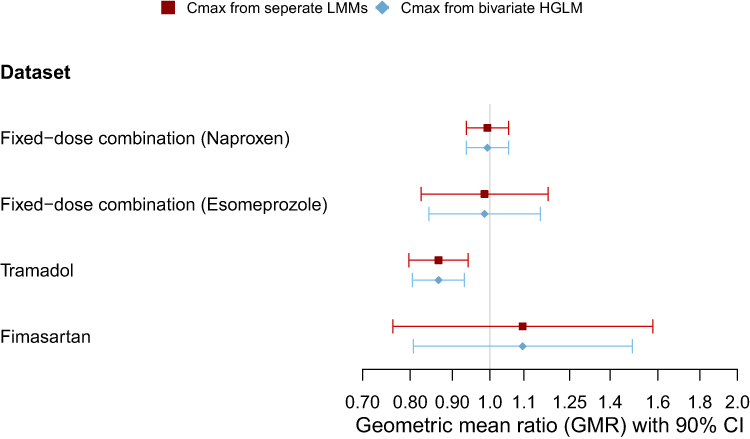 |
Figure 1 Geometric mean ratio (GMR) and 90% confidence interval (CI) using separated two linear mixed models (LMMs) and bivariate hierarchical generalized linear model (HGLM). |
According to regulatory agencies, including the US Food and Drug Administration (FDA), the ABE approach for evaluating differences in exposure between test and reference formulations using both AUC and Cmax has been suggested, which requires equivalence between the population means of two formulations.7,9,28,29 However, traditional bioequivalence studies based on this ABE assessment do not exclude the possibility of differences in exposure at an individual level by intrasubject variability or subject-by-formulation effects.29 In a previous study, this intrasubject variability may have played a crucial role in the variation of drug exposure rather than formulation-dependent variations.29 Despite the benefit for intrasubject variability, due to the limitation of tolerability in healthy subjects and sensitivity of differences in exposure, single-dose bioequivalence studies are still preferred for regulatory acceptance in general.30 The width of the 90% CI is proportional to the drug variability, especially intrasubject variability in a crossover design, and inversely proportional to the number of subjects.7 As a result, proper and reduced estimation of the 90% CI of primary endpoints using a multivariate model could be attributed to data-specific bioequivalence analysis. Because this study was not conducted on pure bioequivalence datasets between same ingredients and formulations, further investigation on the intrasubject variability from partial replicate design would be required.
In conclusion, the proposed multivariate bioequivalence approach using a multivariate HGLM helps to reduce the 90% CI by adding correlation parameters and thus has an advantage in evaluating the bioequivalence of highly variable drugs or biosimilars with large intrasubject variability.
Conclusions
In this study, we applied multivariate analysis (a multivariate HGLM) to the bioequivalence test in practice and compared the performances of the multivariate model and the conventional separate models. For real data analysis, previously studied fixed-dose combinations (naproxen and esomeprazole), tramadol and fimasartan datasets were introduced, and we developed a multivariate model for two endpoints, AUC and Cmax, in which the correlations between responses were incorporated by multivariate normally distributed random effects. As a result, the 90% CIs for the GMR of Cmax decreased, and both AUC and Cmax showed bioequivalence in the tramadol data. Because of its highly variable nature, the fimasartan data did not meet the standard bioequivalence criteria (0.8, 1.25). However, it is clear that multivariate HGLM performs well with the bioequivalence test for multiple endpoints. This method is easily applicable to more general cases and consequently will help resolve a number of issues in bioequivalence evaluation without expanding the bioequivalence limit or requiring a change in study design to a replicated design. However, further investigation of other datasets is required to validate these findings.
Data Sharing Statement
The datasets generated during the current study are available from the corresponding author on reasonable request.
Compliance with Ethics Guidelines
Ethical review and approval were waived for this study, due to anonymized names of the patients.
Acknowledgments
A portion of this work was published for the degree of Doctor of Philosophy in February 2020. (Hyungmi An. H-likelihood approach for clinical pharmacology data). This work was supported by the National Research Foundation of Korea (NRF) grant funded by the Korea government (MSIT) (No. NRF-2020R1F1A1072586) and by Gachon University Gil Medical Center (Grant number: FRD2019-11).
Author Contributions
All named authors meet the International Committee of Medical Journal Editors (ICMJE) criteria for authorship for this article, take responsibility for the integrity of the work as a whole. All authors contributed to data analysis, drafting or revising the article, have agreed on the journal to which the article will be submitted, gave final approval of the version to be published, and agree to be accountable for all aspects of the work.
Funding
The author received no specific funding for this work.
Disclosure
The authors have no conflicts of interest to disclose.
References
1. Chen ML, Shah V, Patnaik R, et al. Bioavailability and bioequivalence: an FDA regulatory overview. Pharm Res. 2001;18(12):1645–1650. doi:10.1023/A:1013319408893
2. US Food and Drug Administration. Guidance for industry: bioavailability and bioequivalence studies submitted in NDAs or INDs — general considerations. Rockville, MD: Food and Drug Administration I; 2014.
3. Use CfMPfH. Guideline on the investigation of bioequivalence. London: Agency EM; 2010.
4. An H. H-Likelihood Approach for Clinical Pharmacology Data [Doctor of Philosophy]. Seoul: Department of Statistics, Seoul National University; 2020.
5. Midha KK, McKay G. Bioequivalence; its history, practice, and future. AAPS J. 2009;11(4):664–670. doi:10.1208/s12248-009-9142-z
6. Seng Yue C, Ozdin D, Selber-Hnatiw S, Ducharme MP. Opportunities and challenges related to the implementation of model-based bioequivalence criteria. Clin Pharmacol Ther. 2019;105(2):350–362. doi:10.1002/cpt.1270
7. Haidar SH, Davit B, Chen ML, et al. Bioequivalence approaches for highly variable drugs and drug products. Pharm Res. 2008;25(1):237–241. doi:10.1007/s11095-007-9434-x
8. el-Tahtawy AA, Tozer TN, Harrison F, Lesko L, Williams R. Evaluation of bioequivalence of highly variable drugs using clinical trial simulations. II: comparison of single and multiple-dose trials using AUC and Cmax. Pharm Res. 1998;15(1):98–104. doi:10.1023/A:1011961006297
9. Ghosh P, Gonen M. Bayesian modeling of multivariate average bioequivalence. Stat Med. 2008;27(13):2402–2419. doi:10.1002/sim.3160
10. Hauck WW, Hyslop T, Anderson S, Bois FY, Tozer TN. Statistical and regulatory considerations for multiple measures in bioequivalence testing. Clin Res Regul Aff. 1995;12(4):249–265. doi:10.3109/10601339509019618
11. Chinchilli VM, Elswick RK. The multivariate assessment of bioequivalence. J Biopharm Stat. 1997;7(1):113–123. doi:10.1080/10543409708835173
12. Berger RL, Hsu JC. Bioequivalence trials, intersection-union tests and equivalence confidence sets. Stat Sci. 1996;11(4):283–319. doi:10.1214/ss/1032280304
13. Quan H, Bolognese J, Yuan W. Assessment of equivalence on multiple endpoints. Stat Med. 2001;20(21):3159–3173. doi:10.1002/sim.985
14. Wang W, Gene Hwang JT, Dasgupta A. Statistical tests for multivariate bioequivalence. Biometrika. 1999;86:395–402. doi:10.1093/biomet/86.2.395
15. Lee Y, Nelder JA, Pawitan Y. Generalized Linear Models with Random Effects: Unified Analysis via H-Likelihood.
16. Lee Y, Rönnegård L, Noh M. Data Analysis Using Hierarchical Generalized Linear Models with R. Chapman and Hall/CRC; 2017.
17. Yi S, Chung YJ, Kim TE, et al. Pharmacokinetics of extended-release versus conventional tramadol/acetaminophen fixed-dose combination tablets: an open-label, 2-treatment, multiple-dose, randomized-sequence crossover study in healthy Korean male volunteers. Clin Ther. 2011;33(6):728–737. doi:10.1016/j.clinthera.2011.04.023
18. Yi S, Kim TE, Yoon SH, et al. Pharmacokinetic interaction of fimasartan, a new angiotensin II receptor antagonist, with amlodipine in healthy volunteers. J Cardiovasc Pharmacol. 2011;57(6):682–689. doi:10.1097/FJC.0b013e31821795d0
19. Choi Y, Han H, Shin D, Lim KS, Yu KS. Comparison of the pharmacokinetics and tolerability of HCP1004 (a fixed-dose combination of naproxen and esomeprazole strontium) and VIMOVO(R) (a marketed fixed-dose combination of naproxen and esomeprazole magnesium) in healthy volunteers. Drug Des Devel Ther. 2015;9:4127–4135. doi:10.2147/DDDT.S86725
20. Wang-Smith L, Fort J, Zhang Y, Sostek M. Pharmacokinetics and relative bioavailability of a fixed-dose combination of enteric-coated naproxen and non-enteric-coated esomeprazole magnesium. J Clin Pharmacol. 2012;52(5):670–680. doi:10.1177/0091270011405500
21. Khandave SS, Sawant SV, Joshi SS, Bansal YK, Kadam SS. Comparative bioequivalence studies of tramadol hydrochloride sustained-release 200 mg tablets. Drug Des Devel Ther. 2010;4:367–374.
22. Ghim JL, Paik SH, Hasanuzzaman M, et al. Absolute bioavailability and pharmacokinetics of the angiotensin II receptor antagonist fimasartan in healthy subjects. J Clin Pharmacol. 2016;56(5):576–580. doi:10.1002/jcph.618
23. Choi Y, Lee S, Jang IJ, Yu KS. Pharmacokinetic interaction between fimasartan and atorvastatin in healthy male volunteers. Drug Des Devel Ther. 2018;12:2301–2309. doi:10.2147/DDDT.S165171
24. Endrenyi L, Fritsch S, Yan W. Cmax/AUC is a clearer measure than Cmax for absorption rates in investigations of bioequivalence. Int J Clin Pharmacol Ther Toxicol. 1991;29(10):394–399.
25. Kaniwa N, Ogata H, Aoyagi N, Takeda Y, Uchiyama M. Power analyses of moment analysis parameter in bioequivalence tests. J Pharm Sci. 1989;78(12):1020–1024. doi:10.1002/jps.2600781210
26. Morgenthaler S, Staudte R. Indicators of evidence for bioequivalence. Entropy. 2016;18(8):291. doi:10.3390/e18080291
27. Pallmann P, Jaki T. Simultaneous confidence regions for multivariate bioequivalence. Stat Med. 2017;36(29):4585–4603. doi:10.1002/sim.7446
28. USFood and Drug Administration. Guidance for industry: statistical approaches to establishing bioequivalenc. Washington, DC: FDA; 2001.
29. Yu Y, Teerenstra S, Neef C, Burger D, Maliepaard M. A comparison of the intrasubject variation in drug exposure between generic and brand-name drugs: a retrospective analysis of replicate design trials. Br J Clin Pharmacol. 2016;81(4):667–678. doi:10.1111/bcp.12828
30. Van Peer A. Variability and impact on design of bioequivalence studies. Basic Clin Pharmacol Toxicol. 2010;106(3):146–153. doi:10.1111/j.1742-7843.2009.00485.x
 © 2021 The Author(s). This work is published and licensed by Dove Medical Press Limited. The full terms of this license are available at https://www.dovepress.com/terms.php and incorporate the Creative Commons Attribution - Non Commercial (unported, v3.0) License.
By accessing the work you hereby accept the Terms. Non-commercial uses of the work are permitted without any further permission from Dove Medical Press Limited, provided the work is properly attributed. For permission for commercial use of this work, please see paragraphs 4.2 and 5 of our Terms.
© 2021 The Author(s). This work is published and licensed by Dove Medical Press Limited. The full terms of this license are available at https://www.dovepress.com/terms.php and incorporate the Creative Commons Attribution - Non Commercial (unported, v3.0) License.
By accessing the work you hereby accept the Terms. Non-commercial uses of the work are permitted without any further permission from Dove Medical Press Limited, provided the work is properly attributed. For permission for commercial use of this work, please see paragraphs 4.2 and 5 of our Terms.