")
Back to Archived Journals » Open Access Medical Statistics » Volume 7
Multistate models on pleural effusion after allogeneic hematopoietic stem cell transplantation
Authors Lee J, Modi D, Jang H, Uberti JP, Kim S
Received 22 October 2016
Accepted for publication 4 February 2017
Published 15 April 2017 Volume 2017:7 Pages 15—26
DOI https://doi.org/10.2147/OAMS.S125465
Checked for plagiarism Yes
Review by Single anonymous peer review
Peer reviewer comments 3
Editor who approved publication: Dr Dongfeng Wu
Joohyoung Lee,1,2 Dipenkumar Modi,3 Hyejeong Jang,2,4 Joseph P Uberti,4 Seongho Kim2,4
1Department of Family Medicine and Public Health Sciences, School of Medicine, Wayne State University, 2Biostatistics Core, Karmanos Cancer Institute, 3Department of Internal Medicine, 4Department of Oncology, School of Medicine, Wayne State University, Detroit, MI, USA
Abstract: A multistate model is more complicated than competing risk models and is composed of a finite number of states and transitions between states. Unlike competing risk models, this model has the ability to assess the effect of occurrence order of time-to-event data. Pleural effusion (PE) is a severe complication that often occurs after allogeneic hematopoietic stem cell transplantation (HSCT). Many patients develop PE during the first 100 days after allogeneic HSCT, and graft-versus-host disease (GVHD) occurs either before or after the development of PE, implying that the occurrence order of PE and GVHD (i.e., PE after GVHD vs. GVHD after PE) would influence on the incidence, risk factors, and mortality of PE. One can use either Cox proportional models or competing risk models to evaluate these values, but neither method is able to incorporate the occurrence order of incidence into the model. To resolve this difficulty, we developed a multistate model describing several possible events and event-related dependencies and applied to a retrospective study of 606 patients, including eight covariates.
Keywords: Cox proportional model, hematopoietic stem cell transplantation, multistate model, pleural effusion, survival analysis
Introduction
Hematopoietic stem cell transplantation (HSCT) is a medical procedure widely used to cure various types of malignant or nonmalignant hematological diseases. It can be autologous HSCT that uses patient’s own cells, allogeneic HSCT that uses donor’s stem cells, or syngeneic HSCT that uses identical twins’ cells. However, >50% of HSCT recipients develop pulmonary complications leading to considerable level of morbidity and mortality.1 Pleural effusion (PE) is one of the common complications occurring after allogeneic HSCT, portraying a diagnostic and therapeutic challenge. This type of complication occurs as a manifestation of direct lung injury from chemotherapeutic regimens, infections, graft-versus-host disease (GVHD), or a result from multiorgan failure.2 Other common pulmonary complications include pulmonary infections (e.g., bacterial, viral, and fungal), pulmonary edema, diffuse alveolar hemorrhage, bacterial sinopulmonary syndrome, idiopathic pneumonia syndrome, bronchiolitis obliterans, and GVHD involving lungs.
With the exception of few case studies,3–5 most previous studies rarely examine occurrence and causes of PE in the stem cell transplant patients. Therefore, Modi et al recently conducted a retrospective study to evaluate all aspects of symptomatic PEs in 618 consecutive adult patients, who underwent allogeneic HSCT, and concluded that PE is a regularly occurring complication after allogeneic HSCT requiring early identification.2 In particular, to assess the effects of PE and GVHD on overall survival (OS) and to account for that each patient has different event time data, PE and GVHD were considered as time-varying covariates using Cox proportional hazard regression models, resulting that PE is an independent predictor but GVHD is not. However, this approach is unable to investigate the effect of occurrence order. That is, with their model used, it would not be possible to answer questions like “What is the probability to be alive in 2 years if a patient experienced PE before GVHD (or GVHD before PE)?” Furthermore, a patient (as well as a clinician) might be interested in answering questions like “Given the current status of GVHD (or PE), what is the probability to experience PE (or GVHD) in 2 years?”
To answer the aforementioned questions, one should consider an approach that incorporates disease progression, which describes the change in disease status over time, into a model. For instance, in our study, the approach should be able to recognize the different systemic progressions between PE after GVHD and GVHD after PE. One such approach to addressing these questions is multistate models that are derived from the competing risk model.6 Specifically, multistate model is concerned about not only the first disease state but also subsequent events after the first state. The observation of the patients begins with the starting state and ends up in the final absorbing state in the multistate model. The starting state and the final state do not have to be single, and the patients pass through more than one intermediate state between the starting state and the final state. To our knowledge, the multistate models have been used by several studies in HSCT,7,8 but it has never been applied for the analysis of the occurrence order of PE and GVHD in allogeneic HSCT patients.
The objectives of our study are to show how disease prediction can be made for the PE cases after allogeneic HSCT with the multistate model, given the baseline clinical covariates, and to investigate how PE and GVHD influence on the mortality of allogeneic HSCT patients.
Multistate models
In this study, we consider three time-to-event outcomes that are the time elapsing from the date of allogeneic HSCT to the three events of interest, that is, time to PE, time to GVHD, and time to death. In the context of multistate models, Cox proportional hazard regression models are described as a model with two states, allogeneic HSCT (e.g., Tx in Figure 1A) as the initial state and time to death (e.g., death in Figure 1A) as the final state, and the other two time-to-event outcomes are incorporated into the model as time-varying covariates. For instance, OS is usually estimated on the basis of the model in Figure 1A.2 As mentioned before, with this Cox model, it is hard to assess the effect of the occurrence order of PE and GVHD on time to death because this approach allows the model to have only one final state without intermediate state.
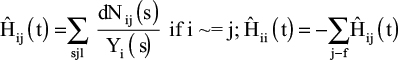
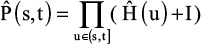
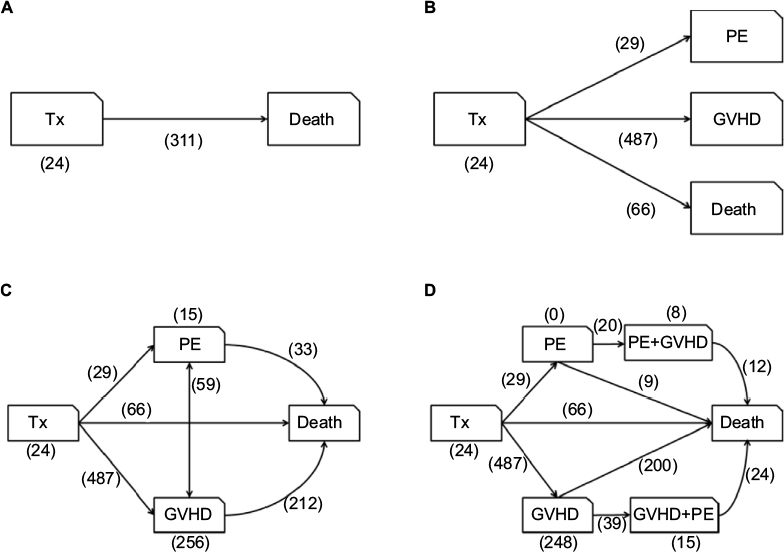 | Figure 1 Multistate models with single (A), independent (B), and cross-related (C, D) outcomes. Notes: The traditional Cox proportional hazard model for the patients with HSCT for a single outcome is in (A), (B) is the competing risk model for the patients with HSCT for independent outcomes, the multistate model for the patients with HSCT is in (C) and (D) is the extended multistate model. Numbers in parentheses represent the number of patients who stayed in the corresponding state or underwent corresponding transition. Abbreviations: GVHD, graft-versus-host disease; HSCT, hematopoietic stem cell transplantation; PE, pleural effusion; Tx, one initial state. |
There would be a situation when the interest of observation is focused on a specific cause of disease in the presence of other causes, which alters the probability of experiencing the event of interest. This is the case of competing risk event, which is an extension of Cox models. Patients would experience multiple causes of disease, but the eventual disease could be attributed to only one of the causes. In this model, the occurrence of one type of event hinders the occurrence of other events. That is, unlike Cox models, it allows a model to have two or more final states in the context of multistate models. For example, the incidence rates of acute and/or chronic GVHD are calculated using competing risk models.7 Figure 1B displays the competing risk model for this study with one initial state (Tx) and three final states (PE, GVHD, and death). Using this model, one can estimate the event rates separately for each of three time-to-event outcomes, but it is still problematic to investigate the effect of occurrence order due to that an intermediate state is not permitted.
Multistate models are one approach that has the ability to assess the occurrence order of incidence, which allow a model to have two or more states as well as intermediate states. The developed multistate model is depicted in Figure 1C, where it does not only reflect the occurrence order of PE and GVHD but also describes event-related dependencies. The model examined in this study is the extended multistate model as depicted in Figure 1D. For the convenience of interpretation, this model extends our initial multistate model by considering PE+GVHD and GVHD+PE as separate states. PE+GVHD is the complication state of GVHD where PE occurs first, and GVHD+PE is the complication state of PE where GVHD occurs first. In this model, there are nine transitions which are numbered in the following order:1) Tx (initial state) to PE, 2) Tx to GVHD, 3) Tx to death, 4) PE to PE+GVHD, 5) PE to death, 6) GVHD to GVHD+PE, 7) GVHD to death, 8) PE+GVHD to death, and 9) GVHD+PE to death.
The model in Figure 1A estimates the mortality due to any cause for 311 cases, while that in Figure 1B focuses on the mortality without PE or/and GVHD for 66 cases, implying that 245 deaths (=311–66) were related to either PE or GVHD and both of these models are unable to estimate the mortalities due to either PE or GVHD. On the other hand, the multistate model in Figure 1C estimates the mortalities caused by PE (33 cases), GVHD (212 cases), and others (66 cases). Furthermore, using the extended model in Figure 1D distinguishes the mortalities according to the occurrence order of PE and GVHD, that is, the mortality caused by PE only (9 cases), GVHD only (200 cases), GVHD before PE (24 cases), and PE before GVHD (12 cases).
We hereafter focus on the model in Figure 1D for the data analyses. Two approaches to estimating multistate models, in this study, are considered based on de Wreede’s work.9 One is standard nonparametric mode and the other is semi-parametric model. In particular, it is assumed that multistate models are Markovian, implying that the conditional probability of future states depends only on the present state. The main difference between nonparametric and semiparametric models is related to covariates. Nonparametric models can incorporate no covariate into the model, whereas semiparametric models can be used with covariates. In general, the outcomes from both models are consistent to each other without covariates as Kaplan–Meier estimates and Cox proportional regression models do. Overall, the semiparametric model should be used for the final outcome because it produces the estimates after considering the influence of covariates. We briefly describe these two modes as follows.
Nonparametric models are used without covariates. Suppose H(t) = [Hij (t)]i,j=1,…,M be an M × M matrix, where M is the number of states in a multistate model, Hij (t) is the cumulative transition hazard for transition from the ith state to the jth state, and 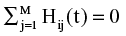 for every i = 1,…,M. To estimate the cumulative transition hazard, the Nelson–Aalen estimator is used, under the assumption that each censoring is independent, given by
|
where Yi (s) is the number of individuals at risk for a transition from the ith state at time s and dNij (s) is the observed number of transitions from the ith state to the jth state. Then, the transition probability matrix is estimated by this Nelson–Aalen estimator of the cumulative transition hazard matrix. Let P(s,t) = [Pij (s,t)]i,j=1,=,M be the transition probability matrix, where Pij (s,t) = Prob(X(t) = j|X(s) = i) is the transition probability from the ith state to the jth state in time interval (s,t] and X(t) is the state occupied at time t. Then, the estimated transition probability matrix is
|
where I is the M × M identity matrix.
For semiparametric models, a transition-specific Cox model is used with covariates. Denote the hazard of a transition from the ith state to the jth state at time t by hij (t | Z), where Z is the vector of covariates at baseline. Then, by the transition-specific Cox model, the hazard is expressed by
|
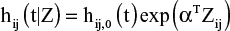
where hij,0 (t) is the baseline hazard for a transition from the ith state to the jth state at time t, and Zij is the vector of transition-specific covariates. Readers can refer to the study by de Wreede et al9 for more detailed descriptions of multistate models. The data analyses were carried out using the statistical software R version 3.3.1 (R Development Core Team, 2016) and the R package mstate.
Patient data
A retrospective study of 618 patients who underwent allogeneic HSCT between January 2008 and December 2013 at Karmanos Cancer Institute (KCI) was conducted.2 This study was approved by the Wayne State University Institutional Review Board. In this study, a total of eight covariates are considered, with seven categorical covariates such as age ([0,40], [40,60], and [60,100], with [0,40] as the reference category), sex (female and male, with female as the reference category), race (African American, European-American, and others, with African American as reference category), conditioning regimen (full and reduced, with full as the reference category), human leukocyte antigen (HLA) match (7/8, 8/8, and <7/8, with 7/8 as the reference category), donor (matched-related and matched-unrelated, with matched-related as the reference category), and disease risk index (very high, high, intermediate, and low, with very high as the reference category), and one continuous covariate, comorbidity index. Because the multivariable analysis requires a complete data without missing, we removed the patients with missing values, resulting in a total of 606 patients. About half (45%) of the allogeneic HSCT patients were aged between 40 and 60 years, and sex ratio was almost even. Most of the patients were European-Americans (90%). Comorbidity index was continuous variable, which was distributed from 0 to 7. Most of the patients belonged to index 2 (21%), 3 (26%), and 4 (20%).
Nonparametric multistate analyses
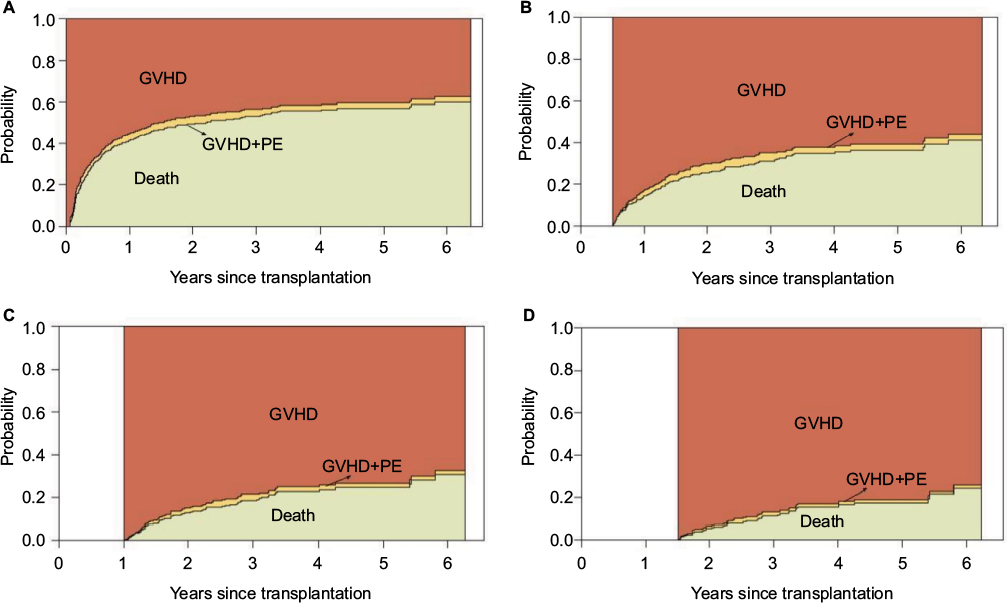
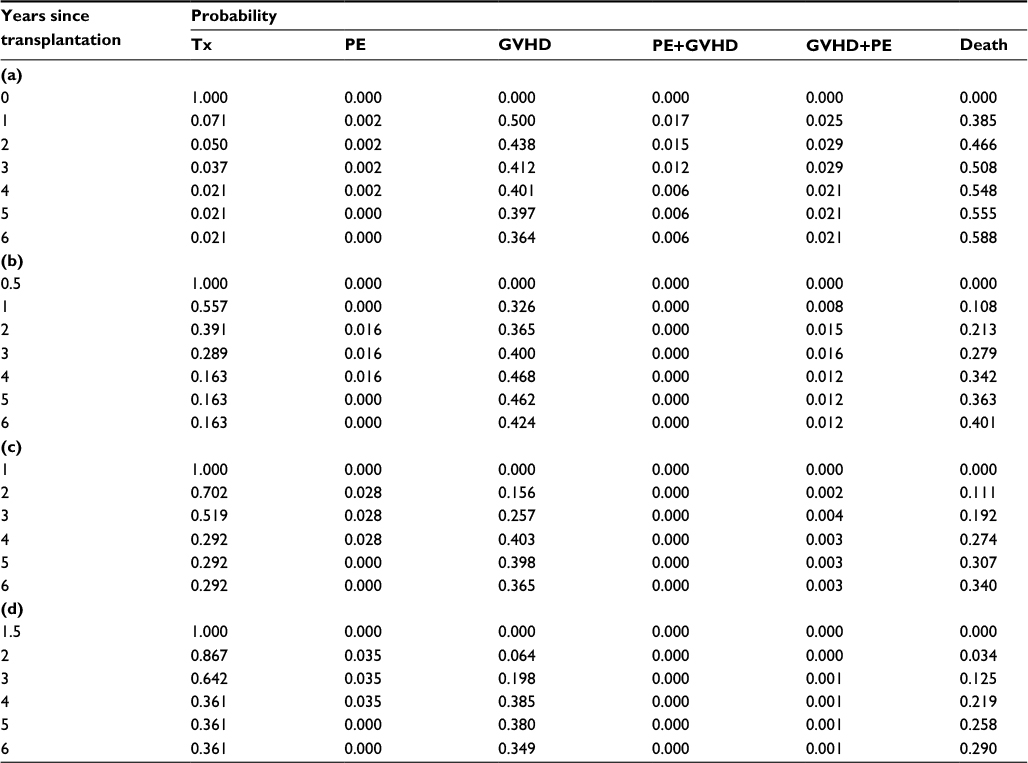
We first perform individual predictions for each patient by applying the Aalen–Johansen estimators to our model.9 Stacked prediction probabilities of being in initial state, GVHD state, and death under the condition that a patient is in initial state right after transplantation, 0.5 years after transplantation, 1 year after transplantation, and 1.5 years after transplantation are shown in Figure 2A–D, respectively. For clarity, the predicted probabilities at certain time points are depicted in Table S1, corresponding to Figure 2. Probabilities of being in other states than those three states were very small, although marked on the figures. Note that the probability of being in the corresponding state is indicated by the distance between two adjacent curves in the plot with the stacked transition probabilities. For example, in Figure 2A, the predicted transition probabilities at 6 years after transplantation are 2.1% to Tx, 0% to PE, 36.4% to GVHD, 0.6% to PE+GVHD, 2.1% to GVHD+PE, and 58.8% to death, as shown in Table 1. Here, the transition probabilities to death and GVHD are the first and second largest probabilities because these two states are the two largest distances at 6 years in Figure 2A. The last observation time of this study was 6.6 years after the transplantation. A comparison of Figure 2A–D showed that as the time period that a patient had not had any harmful event for increased, the mortality rate at the last observation of the study was decreased as follows: 1) 58.8%, 2) 40.1%, 3) 34%, and 4) 29%. However, there was no discernible trend in the occurrence of GVHD during the same time course as follows: 1) 36.4%, 2) 42.2%, 3) 36.5%, and 4) 34.9%. This finding indicates that HSCT was accompanied by constant occurrence rate of GVHD regardless of prognosis.
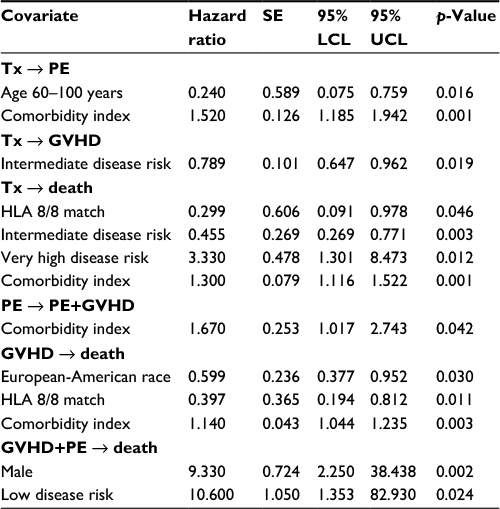 | Table 1 Hazard ratios with standard errors, confidence intervals, and p-values for the Markov proportional regression model of the significant covariates at a 5% significance level Abbreviations: GVHD, graft-versus-host disease; HLA, human leukocyte antigen; LCL, lower confidence limit; PE, pleural effusion; SE, standard error; Tx, one initial state; UCL, upper confidence limit. |
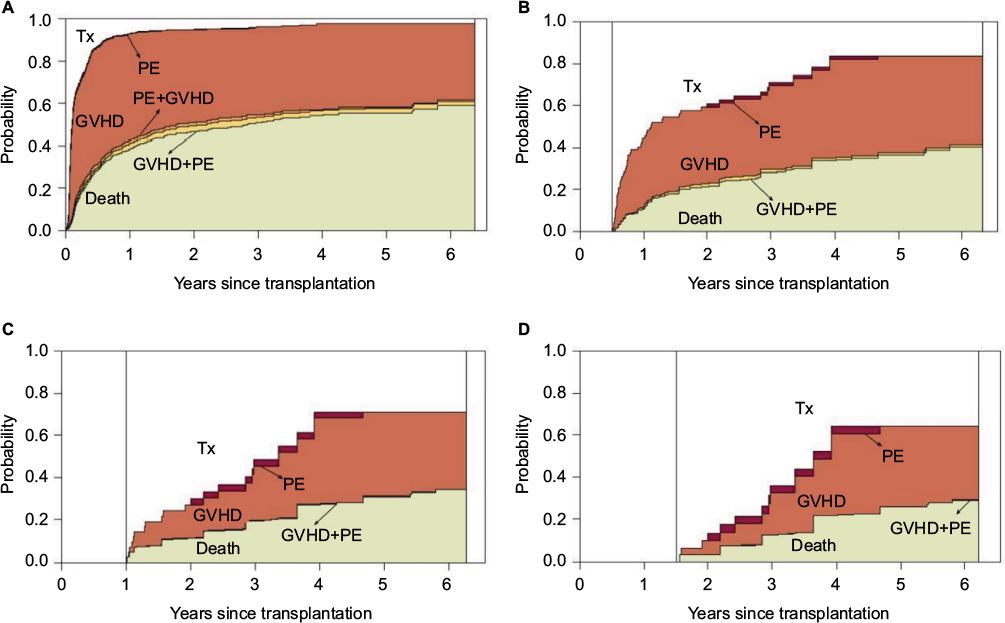 | Figure 2 Nonparametric estimates of the stacked transition probabilities at time 0 year (A), 0.5 year (B), 1 year (C), and 1.5 years (D) after the transplantation. Abbreviations: GVHD, graft-versus-host disease; PE, pleural effusion; Tx, one initial state. |
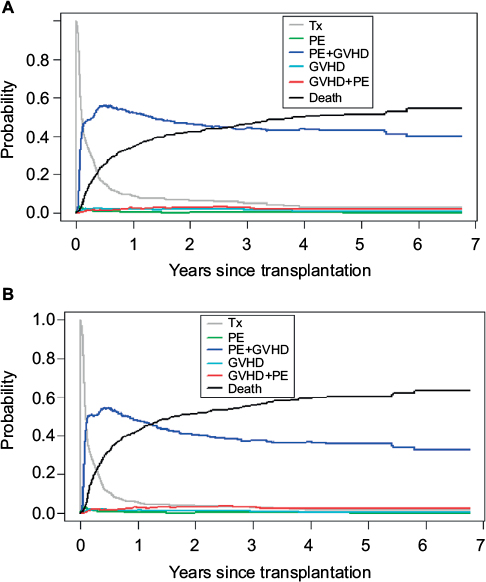
Stacked prediction probabilities of being in PE+GVHD state or death under the condition that a patient is in PE state right after transplantation are illustrated in Figure 3A (probability at the last observation of the study: PE+GVHD 10.8% and death 89.2%), and stacked prediction probabilities of being in PE+GVHD state or death under the condition that a patient is still in PE state 0.5 year, 1 year, and 1.5 years after transplantation are shown in Figure 3B (probability at the last observation of the study: PE+GVHD 25.8% and death 74.3%), C (probability at the last observation of the study: PE+GVHD 40% and death 60%), and D (probability at the last observation of the study: PE+GVHD 0% and death 100%). For clarity, the predicted probabilities at certain time points are depicted in Table S2, corresponding to Figure 3. There were no patients staying in PE state as shown in Figure 1D. All the patients who entered PE state left for PE+GVHD state or death. A comparison of Figure 3A–D showed that as the time period that a patient had been in PE state increased, the occurrence of PE+GVHD complication was increased and the mortality rate was decreased. However, 1.5 years after transplantation, time was an exception because all the patients were dead by that time.
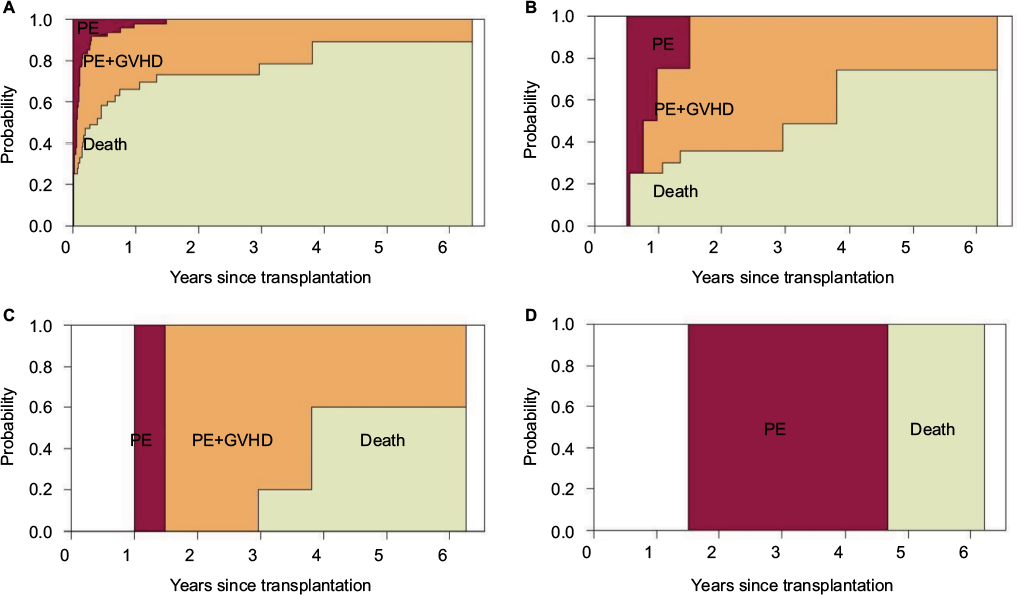 | Figure 3 Nonparametric estimates of the stacked transition probabilities at time 0 year (A), 0.5 year (B), 1 year (C), and 1.5 years (D) after the transplantation. Starting state is PE. Abbreviations: GVHD, graft-versus-host disease; PE, pleural effusion. |
Among the 487 patients who had entered GVHD state, 248 patients (51%) stayed in that state as shown in Figure 1D. In the multistate model, those patients are considered as being alive after having entered the corresponding state, and not necessarily suffering from the later events continuously. Therefore, staying in GVHD state could be interpreted as a long-term survival.
Stacked prediction probabilities of being in GVHD state or death under the condition that a patient is in GVHD state right after transplantation are shown in Figure 4A (probability at the last observation of the study: GVHD 37.1% and death 60.3%), and stacked prediction probability of being in GVHD state or death under the condition that a patient is still in GVHD state 0.5 years after transplantation is shown in Figure 4B (probability at the last observation of the study: GVHD 56% and death 41.1%), under the condition that a patient is still in PE state 1 year after transplantation is shown in Figure 4C (probability at the last observation of the study: GVHD 67.4% and death 30.5%), and under the condition that a patient is still in PE state 1.5 years after transplantation is shown in Figure 4D (probability at the last observation of the study: GVHD 74.4% and death 24.2%). For clarity, the predicted probabilities at certain time points are depicted in Table S3, corresponding to Figure 4. A comparison of Figure 4A–D shows that as the time period that a patient had been in GVHD state for increased, survival rate was improved in terms of prolonged stay in GVHD state and the mortality rate was decreased.
 | Figure 4 Nonparametric estimates of the stacked transition probabilities at time 0 year (A), 0.5 year (B), 1 year (C), and 1.5 years (D) after the transplantation. Starting state is GVHD. Abbreviations: GVHD, graft-versus-host disease; PE, pleural effusion. |
Semiparametric multistate analyses
Next, we utilized a semiparametric approach in which transplantation is considered as a covariate at baseline, not merely a stratifying variable. The estimation was performed using Cox models when all baseline hazards were assumed to be unrelated.
We predicted the state where patients with HLA 8/8 allele match or intermediate disease risk index belong after transplantation in dependence on different times of inspection. Those two covariates were selected because they were found to be most frequently appearing significant covariates in the Markov proportional regression model (Table 1). The plots of the transition probabilities for other covariates than HLA 8/8 allele match and intermediate disease risk index had the similar patterns as those of the two covariates.
At the end of the study, most of the patients stayed in GVHD state (40.9%) or ended up being dead (51.3%) as shown in Figure 1D. Only the small number of patients stayed in other states. This trend was also shown in the semiparametric analysis for the covariates of HLA match and disease risk index. Figure 5A, B shows that the probability of being in GVHD state was decreasing over the most time of inspection: highest at the time <1 year after transplantation and lowest at the last observation of the study (HLA 8/8 allele patients 39.8% and intermediate disease risk index patients 32.5%). The probability of being in death was increasing over the time of inspection, which was the highest at the last observation of the study (HLA 8/8 allele patients 54.6% and intermediate disease risk index patients 63.4%). The probabilities of being in other states than GVHD and death were steady over the most time of inspection and were very low values.
 | Figure 5 The probabilities of being in different states for HLA 8/8 allele match patient (A) and intermediate disease risk index patient (B). Abbreviations: GVHD, graft-versus-host disease; PE, pleural effusion; Tx, one initial state. |
Mortality
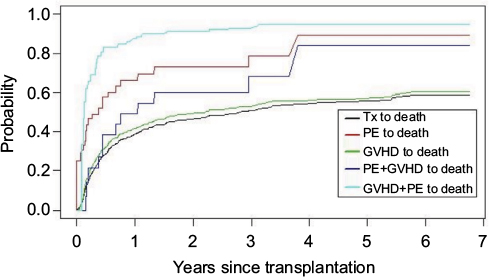
We calculated the estimated cumulative hazards of the transitions from each state to death in order to compare the mortality rates of the events (Figure 6). It is shown that GVHD+PE state has higher cumulative death hazards than any other states in most time courses (94.5% at the last observation of the study). Especially, when considering the patients who suffered from the complication, those who had GVHD first and PE later were more probable to die than those who had PE first and GVHD later. This can be interpreted as that PE event at a later stage would be more lethal. In addition, the fact that the cumulative death hazard of PE state was higher than that of PE+GVHD state means that if patients got GVHD after PE, their chances to survive were increased when compared with the patients having only PE. However, this complication effect was not valid if patients experienced PE after GVHD. Tx and GVHD had the similar cumulative death hazards (58.8% and 60.3%, respectively, at the last observation of the study), which were the lowest in most time courses. The findings suggest that the patients who did not experience PE had a higher probability to survive.
 | Figure 6 Comparison of the cumulative death hazard transition for each state. Abbreviations: GVHD, graft-versus-host disease; PE, pleural effusion; Tx, one initial state. |
One of the interesting finding in our study was the fact that the patients with complication who experienced GVHD had a greater level of probability to survive as illustrated in Figure 6. This can be explained by the graft-versus-lymphoma effect because the patients underwent allogeneic HSCT. Even though they had suffered from high toxicity of the chemotherapy and immune resistance compared with those who underwent autologous HSCT, a graft-versus-lymphoma effect could be provided by the donor cells at a later stage. This result would lead to decrease in the main disease relapse.10 However, if the patients had not experienced GVHD, their probability of getting the benefit from protection against relapse by the graft-versus-lymphoma effect would be low. Even in a case that the patient’s main disease was not lymphoma, similar benefit as the graft-versus-lymphoma effect can be expected from the transplanted donor cells. However, as shown in our result, the patients in GVHD+PE state had higher mortality rate than those in PE+GVHD state. That is, if PE occurs after GVHD, then the benefit of allogeneic HSCT was not maintained. This finding may occur because severe complication PE effect offsets the initial healing effect of GVHD.
Markov hazard model
Table 1 presents the results for the Markov proportional hazards regression model. We found that conditioning regimen (full or reduced) and donor relationship (matched-related or matched-unrelated) had no significant influences on any of the transitions in the multistate model. On the other hand, there were no significant covariates in the transitions from GVHD state to GVHD+PE state, from PE state to death, and from PE+GVHD state to death. There were the transitions that had the significant covariates in them.
- Initial state to PE state: The patients aged between 60 and 100 had the lowest hazard of PE occurrence (hazard ratio [HR]=0.24), and as comorbidity index (continuous variable) increased in this transition, PE occurrence was prompted (HR=1.52).
- Initial state to GVHD state: The patients with intermediate disease risk index had the lowest hazard of GVHD occurrence (HR=0.789).
- Initial state to death: The patients with HLA 8/8 allele match and intermediate disease risk index had the lowest hazard of death.
- PE state to PE+GVHD state: Only the higher comorbidity index was able to prompt the occurrence of PE+GVHD complication from PE state (HR=1.67).
- GVHD state to death: The European-American race group and the patients with HLA 8/8 allele match had the lowest hazard of death.
- GVHD+PE state to death: Male patients had a higher probability of ending up being dead than female patients (HR=9.33).
Concluding remarks
Complication disease analysis often requires the assumption of multiple end states. This is the reason why multistate model is useful for stem cell transplantation study, which accompanies complications in many cases. Several studies have showed the effectiveness of multistate models in transplantation, although none of them are related to PE.8,11 Comparing to the existing studies, although none of them is related to PE, our study uses more sophisticated model with covariates so that it could predict various transition probabilities as well as provide accurate predictions of various patient’s possible states.
Multistate model approach can be applied to diverse study designs flexibly, and it is convenient to interpret data for prediction. This approach is especially appropriate if the research objective is to predict patients’ disease state after specific treatment or diagnosis. Ordinary competing risk model, however, can only be used to find the probability to reach a certain state. This is because it focuses on single disease state and considers other states as competing events. Cox model also focuses on single state, but other states become covariates.12
The main advantage of multistate models in this study is to be able to deal with the occurrence orders of various disease statuses, providing more itemized mortalities. As shown in Figure 6, our developed model can predict five different mortalities according to current patient’s disease statuses, that is, the mortalities from Tx, PE, GVHD, PE+GVHD, and GVHD+PE, respectively, while Cox and competing models can predict the mortality from Tx only. This feature will be of great benefit to both clinicians and patients for decision making because it can further lead to more detailed information according to a patient’s current status.
There are two limitations to our model study. First, we could not follow the standard sample size calculation methods for the competing risk model13 because it was basically a retrospective study, not a planned clinical study. There were relatively small sample sizes for PE to death transition (sample size 9) and PE+GVHD to death transition (sample size 12). It is known that the validity of multistate analysis improves as the sample size increases.14 Recently developed simulation applications would be helpful for further studies with our retrospective empirical data.15 Second, in our model there was no state for the patients whose conditions were getting aggravated without going to the next state, which could happen in real-life situations. This is because our data did not have such level of information for us to construct the model with more sophisticated states. Multistate model construction often requires high level of detail with data due to many cases of possible transitions, which connect the states. Even though there was this kind of caveat with the multistate model analysis, our study provided useful information about the disease states and prognosis, which had not been available with commonly adopted previous model approaches
Acknowledgments
This work has been partially supported by National Science Foundation grant DMS-1312603. The Biostatistics Core is supported in part by National Institute of Health Cancer Center Support Grant P30 CA022453 to the Karmanos Cancer Institute at Wayne State University.
Part of this work has been presented at the 2016 Joint Statistical Meetings (JSM) in Chicago, IL, USA, on August 1, 2016, as a poster presentation.
Disclosure
The authors report no conflicts of interest in this work.
References
Soubani AO1, Miller KB, Hassoun PM. Pulmonary complications of bone marrow transplantation. Chest. 1996;109(4):1066–1077. | ||
Modi D, Jang H, Kim S, et al. Incidence, etiology, and outcome of pleural effusions in allogeneic hematopoietic stem cell transplantation. Am J Hematol. 2016;91(9):E341–E347. | ||
Noble PW. The pulmonary complications of bone marrow transplantation in adults. Western J Med. 1989;150(4):443–449. | ||
Nguyen A. Characteristics of pleural effusions in patients after hematopoietic stem cell transplantation. Chest. 2010;138(4):812A. | ||
Ozkaynak MF, Weinberg K, Kohn D, Sender L, Parkman R, Lenarsky C. Hepatic veno-occlusive disease post-bone marrow transplantation in children conditioned with busulfan and cyclophosphamide: incidence risk factors, and clinical outcome. Bone Marrow Transplant. 1991;7(6):467–474. | ||
Aalen OO, Johansen S. An empirical transition matrix for non-homogenous Markov chains based on censored observation. Scand J Stat. 1978;5(3):141–150. | ||
Schmoor C, Schumacher M, Pinke J, Beyersmann J. Competing risks and multistate models. Clin Cancer Res. 2013;19(1):12–21. | ||
Eefting M, de Wreede LC, Halkes CJ, et al. Multi-state analysis illustrates treatment success after stem cell transplantation for acute myeloid leukemia followed by donor lymphocyte infusion. Haematologica. 2016;101(4):506–514. | ||
de Wreede LC, Fiocco M, Putter H. The mstate package for estimation and prediction in non- and semi-parametric multi-state and competing risks models. Comput Methods Programs Biomed. 2010;99(3):261–274. | ||
van Besien K, Loberiza FR Jr, Bajorunaite R, et al. Comparison of autologous and allogeneic hematopoietic stem cell transplantation for follicular lymphoma. Blood. 2003;102(10):3521–3529. | ||
Holtan SG, DeFor TE, Lazaryan A, et al. Composite end point of graft-versus-host disease-free, relapse-free survival after allogeneic hematopoietic cell transplantation. Blood. 2015;125(8):1333–1338. | ||
Cox DR. Regression models and life-tables. J R Stat Soc Ser B Methodol. 1972;34(2):187–220. | ||
Latouche A, Porcher R. Sample size calculations in the presence of competing risks. Stat Med. 2007;26(30):5370–5380. | ||
Logan BR. Review of multistate models in hematopoietic cell transplantation studies. Biol Blood Marrow Transplant. 2013;19(Suppl 1):S84–S87. | ||
Allignol A, Schumacher M, Wanner C, Dreschsler C, Beyersmann J. Understanding competing risks: a simulation point of view. BMC Med Res Methodol. 2011;11:86. |
Supplementary materials
 | Table S1 Predicted transition probabilities at time (a) 0 year, (b) 0.5 year, (c) 1 year, and (d) 1.5 years after the transplantation Abbreviations: GVHD, graft-versus-host disease; PE, pleural effusion; Tx, one initial state. |
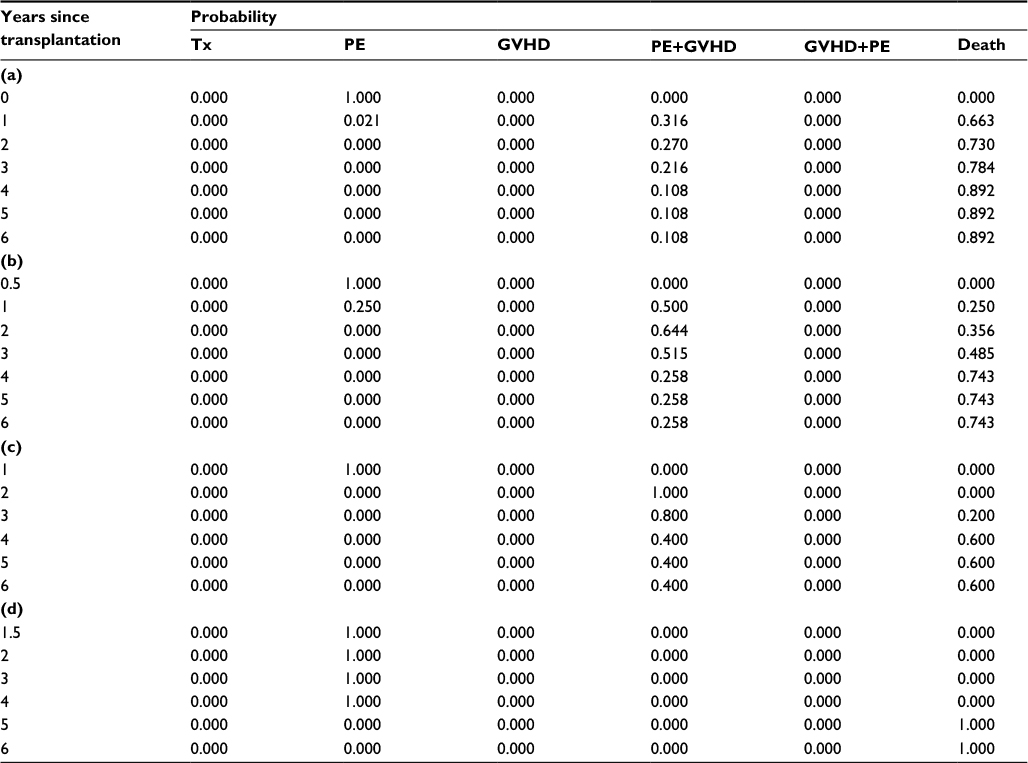 | Table S2 Predicted transition probabilities at time (a) 0 year, (b) 0.5 years, (c) 1 year, and (d) 1.5 years after the transplantation (starting state is PE) Abbreviations: GVHD, graft-versus-host disease; PE, pleural effusion; Tx, one initial state. |
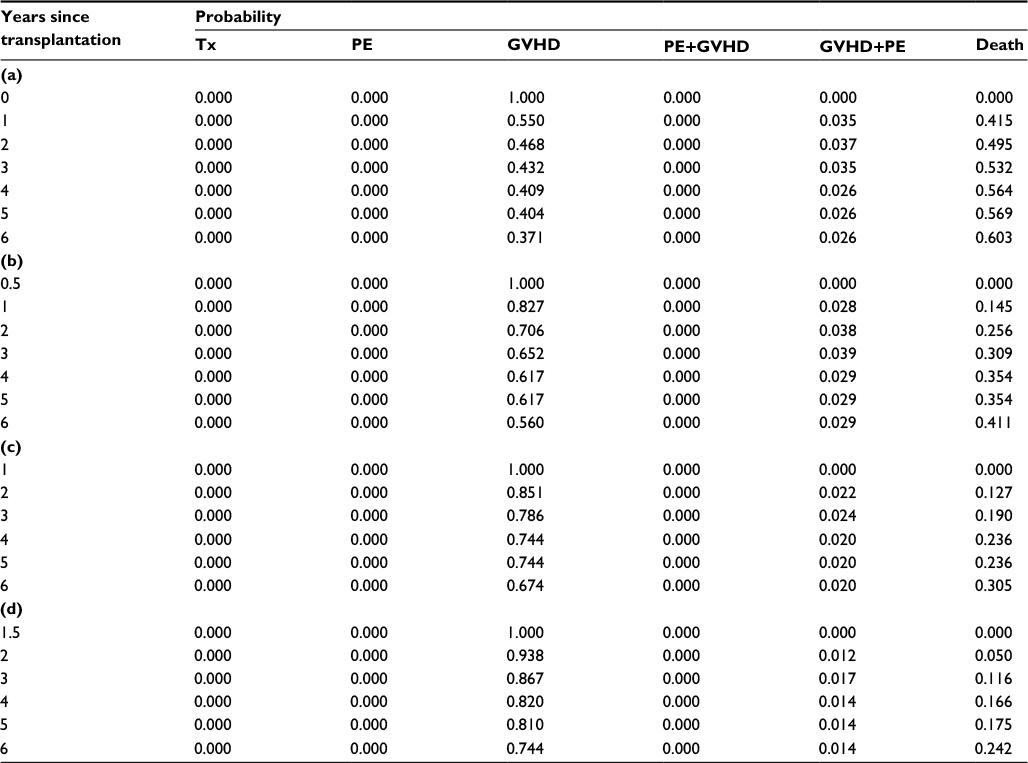 | Table S3 Predicted transition probabilities at time (a) 0 year, (b) 0.5 year, (c) 1 year, and (d) 1.5 years after the transplantation (starting state is GVHD) Abbreviations: GVHD, graft-versus-host disease; PE, pleural effusion; Tx, one initial state. |
 © 2017 The Author(s). This work is published and licensed by Dove Medical Press Limited. The full terms of this license are available at https://www.dovepress.com/terms.php and incorporate the Creative Commons Attribution - Non Commercial (unported, v3.0) License.
By accessing the work you hereby accept the Terms. Non-commercial uses of the work are permitted without any further permission from Dove Medical Press Limited, provided the work is properly attributed. For permission for commercial use of this work, please see paragraphs 4.2 and 5 of our Terms.
© 2017 The Author(s). This work is published and licensed by Dove Medical Press Limited. The full terms of this license are available at https://www.dovepress.com/terms.php and incorporate the Creative Commons Attribution - Non Commercial (unported, v3.0) License.
By accessing the work you hereby accept the Terms. Non-commercial uses of the work are permitted without any further permission from Dove Medical Press Limited, provided the work is properly attributed. For permission for commercial use of this work, please see paragraphs 4.2 and 5 of our Terms.