")
Back to Journals » International Journal of Nanomedicine » Volume 15
Multifunctional Nanoparticles Encapsulating Astragalus Polysaccharide and Gold Nanorods in Combination with Focused Ultrasound for the Treatment of Breast Cancer
Authors Xiong J , Jiang B, Luo Y, Zou J, Gao X, Xu D, Du Y, Hao L
Received 17 January 2020
Accepted for publication 25 May 2020
Published 12 June 2020 Volume 2020:15 Pages 4151—4169
DOI https://doi.org/10.2147/IJN.S246447
Checked for plagiarism Yes
Review by Single anonymous peer review
Peer reviewer comments 2
Editor who approved publication: Dr Mian Wang
Jie Xiong,1 Binglei Jiang,1 Yong Luo,1 Jianzhong Zou,1 Xuan Gao,1 Die Xu,1 Yan Du,1,2 Lan Hao3
1State Key Laboratory of Ultrasound in Medicine and Engineering, College of Biomedical Engineering, Chongqing Medical University, Chongqing Key Laboratory of Biomedical Engineering, Chongqing Medical University, Chongqing 400016, People’s Republic of China; 2Ultrasonography Department, The Fourth People’s Hospital of Chongqing, Central Hospital of Chongqing University, Chongqing 400014, People’s Republic of China; 3Institute of Ultrasound Imaging, Chongqing Medical University, Chongqing 400010, People’s Republic of China
Correspondence: Jianzhong Zou
College of Biomedical Engineering, Chongqing Medical University, Chongqing 400010, People’s Republic of China
Tel +86 13783002390
Email [email protected]
Purpose: Focused ultrasound (FUS) is a noninvasive method to produce thermal and mechanical destruction along with an immune-stimulatory effect against cancer. However, FUS ablation alone appears insufficient to generate consistent antitumor immunity. In this study, a multifunctional nanoparticle was designed to boost FUS-induced immune effects and achieve systemic, long-lasting antitumor immunity, along with imaging and thermal enhancement.
Materials and Methods: PEGylated PLGA nanoparticles encapsulating astragalus polysaccharides (APS) and gold nanorods (AuNRs) were constructed by a simple double emulsion method, characterized, and tested for cytotoxicity. The abilities of PA imaging and thermal-synergetic ablation efficiency were analyzed in vitro and in vivo. The immune-synergistic effect on dendritic cell (DC) differentiation in vitro and the immune response in vivo were also evaluated.
Results: The obtained APS/AuNR/PLGA-PEG nanoparticles have an average diameter of 255.00± 0.1717 nm and an APS-loading efficiency of 54.89± 2.07%, demonstrating their PA imaging capability and high biocompatibility both in vitro and in vivo. In addition, the as-prepared nanoparticles achieved a higher necrosis cell rate and induced apoptosis rate in an in vitro cell suspension assay, greater necrosis area and decreased energy efficiency factor (EEF) in an in vivo rabbit liver assay, and remarkable thermal-synergic performance. In particular, the nanoparticles upregulated the expression of MHC-II, CD80 and CD86 on cocultured DCs in vitro, followed by declining phagocytic function and enhanced interleukin (IL)-12 and interferon (INF)-γ production. Furthermore, they boosted the production of tumor necrosis factor (TNF)-α, IFN-γ, IL-4, IL-10, and IgG1 (P< 0.001) but not IgG2a. Immune promotion peaked on day 3 after FUS in vivo.
Conclusion: The multifunctional APS/AuNR/PLGA-PEG nanoparticles can serve as an excellent synergistic agent for FUS therapy, facilitating real-time imaging, promoting thermal ablation effects, and boosting FUS-induced immune effects, which have the potential to be used for further clinical FUS treatment.
Keywords: immune, immunoadjuvant, thermal ablation, PLGA, Chinese traditional medicine
Introduction
Focused ultrasound (FUS) is a noninvasive technique that is used to generate coagulative necrosis through localized thermal ablation in subcutaneous tissues,1 which can not only noninvasively induce the death of all localized tumor cells without damaging the surrounding normal tissue2 but also activate systemic antitumor immunity. Host immune suppression induced by tumor cells may be lessened or relieved after thermal ablation, and some tumor antigens remain in the tumor debris, leading to renewed host antitumor immunity.3 Preclinical and clinical results of FUS tumor ablation show increased infiltration and activation of CD4+ and CD8+ T cells.4 It is increasingly apparent that FUS ablation alone may not be sufficient to generate a clinically relevant immune response and to stimulate the host immune system consistently. A strategy to combine FUS ablation with active immunological stimulation, such as an immunoadjuvant, may augment the efficacy of FUS-induced antitumor immunity specifically against targeted tumors.5 In recent years, many studies have focused on how to make acoustic energy deposition more efficient by using synergistic nanoparticles with various materials,6 in combination with some auxiliary functions such as imaging, targeting, or drug delivery for chemotherapy.7 However, the combination of FUS and immune-related nanoparticles has rarely been investigated. The purpose of this study was to achieve a new strategy involving multifunctional synergistic nanoparticles, which incorporate immunoadjuvants from herbs with FUS to boost the immune response and provide imaging and thermal enhancement.
Checkpoint inhibitor monoclonal antibodies have been widely used in the clinic, for example, as anti-PD-1/PD-L1 therapeutics.8 However, the widespread use is limited by the toxicity associated with immune checkpoint inhibitors, and the response rate is modest: fewer than 20% of patients respond to them.9 Polysaccharides isolated and identified from A. membranaceus (astragalus polysaccharides, APS) have shown significant immunomodulatory effects and anticancer activity.10 Because of the advantages of low toxicity, a natural and readily available source, convenient preparation and lack of drug resistance, APS has become a hot topic in the study of traditional Chinese medicine.11 Recently, studies have demonstrated that APS has various types of biological effects, such as immunomodulatory activity, antioxidant activity, antimutant activity, antidiabetic activity, antibiotic activity, anticoagulant, and anti-inflammatory activities.12 APS was found to activate macrophages and DCs, and the immune-regulatory activity was significantly enhanced after encapsulation with liposomes.13
Acoustic-responsive polymer probes fabricated with gold nanoparticles exhibited the ability to enable FUS-mediated drug administration.14 Gold nanorods (AuNRs) have been used to enhance the therapeutic efficiency of FUS,15 especially for shallow treatment sites, because of their special optical properties for photoacoustic imaging (PAI),16 providing the potential to facilitate ultrasound guide FUS exposure for early-stage breast cancer.17 AuNRs in this study are expected to act not only as on-demand thermal converters for FUS thermal therapy and potential imaging agents but also as mediators of a controlled drug-release system responding to FUS.
The most frequent polymer used to form such nanoparticulate carriers is poly(D,L-lactide-co-glycolide) (PLGA) due to its biocompatibility and biodegradability.18 The degradation of PLGA NPs can take days or even months.19 In this paper, to maximize the synergistic effect with FUS, we designed and constructed multifunctional nanoparticles (NPs) of APS/AuNRs/PLGA-PEG. The copolymer was newly designed and synthesized by directly encapsulating APS and AuNRs in PLGA-PEG-COOH (Figure 1B). In our protocol, these NPs can initially accumulate efficiently in the tumor region via the typical enhanced permeability and retention (EPR) effect20 during blood circulation (Figure 1A). After entering the tumor site, these NPs can act as contrast agents for concurrent PAI, with potential for diagnosing tumors and evaluating therapeutic outcomes. In addition, upon external FUS exposure, these NPs can behave as a synergist for increasing the tumor temperature and ablating the tumor cells/tissues more efficiently, exposing the tumor antigens. Additionally, immature DCs (imDCs) were stimulated, proliferated and differentiated into mature DCs (mDCs), resulting in an immune response of APS released from NPs (Figure 1C and D). mDCs are the most powerful antigen-presenting cells (APCs) and can identify the exposed tumor antigen, migrate to peripheral lymph nodes and induce the activation of cytotoxic T lymphocytes (CTLs) via antigen presentation (Figure 1D and E). This process further triggers the immune response and immunological surveillance (Figure 1E and F). Last but not least, the infiltration of CTLs into the destroyed tumor is enhanced to kill the residual tumor cells. Collectively, our findings suggest that these NPs could be useful for noninvasive tumor imaging and therapy.
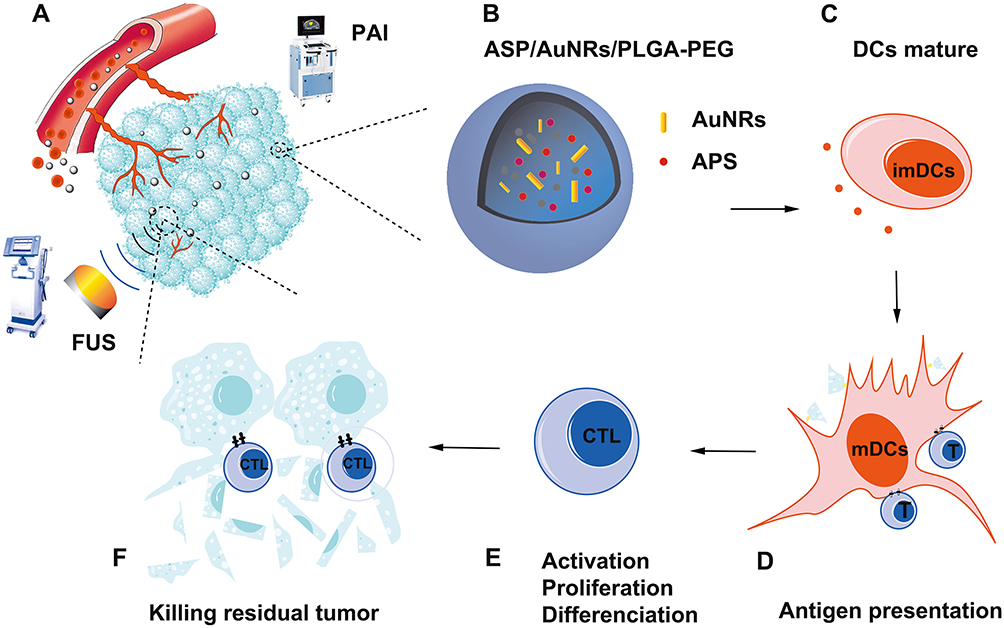 |
Figure 1 (A) Schematic illustration of the theranostic functions of as-synthesized APS/AuNR/PLGA-PEG NPs, including their passive accumulation in tumor tissue via the typical EPR effect followed by PA imaging and FUS ablation of the tumor. (B) Schematic illustration of the synthetic procedure of APS/AuNRs/PLGA-PEG. (C) Coaction of immature DCs with APS. (D) Mature DCs identify antigen information and transmit it to T cells. (E) T cell activation, proliferation and differentiation to antigen-specific CTLs. (F) CTLs infiltrate into the tumor and kill the residual tumor. Abbreviations: APS, astragalus polysaccharide; AuNRs, gold nanorods; PLGA, poly(lactic-co-glycolic) acid; PEG, polyethylene glycol; NPs, nanoparticles; PAI, photoacoustic imaging; FUS, focused ultrasound; CTLs, cytotoxic T lymphocytes; DCs, dendritic cells; mDCs, mature DCs; imDCs, immature DCs. |
Materials and Methods
Chemicals, Cell Lines, and Animals
All chemicals were of analytical grade and used without further purification. Polyethylene glycol (PEG), poly(lactic-co-glycolic) acid (PLGA) (50:50, MW: 15,000), and PLGA-PEG-COOH were manufactured by and obtained from Daigang BIO Engineer Ltd., Co. (Shandong, China). Gold nanorods (methyl terminated 10 nm diameter, 1 g/mL) and poly(vinyl alcohol) (PVA) were purchased from Sigma-Aldrich Chemical Co. (St. Louis, MO, USA). Astragalus polysaccharide (APS) was purchased from Solarbio (Beijing, China) and diluted to a concentration of 10 mg/mL with PBS for subsequent experiments. Isopropyl alcohol and CHCL3 were purchased from Chuandong Chemical Co. (Chongqing, China). Cells from the mouse mammary carcinoma cell line 4T1 and HUVECs were gifts from The Ultrasound Imaging Institute of Chongqing Medical University and were approved by Chongqing Medical University ethics committee. 4T1 cells and HUVECs were purchased commercially from the Chinese Academy of Sciences Cell Bank. The cells were maintained in RPMI-1640 medium supplemented with 10% fetal bovine serum and 1% penicillin-streptomycin solution in a humidified atmosphere containing 5% CO2 at 37 °C. All animals were purchased from the Experimental Animal Center of Chongqing Medical University. All the experiments and procedures were approved by the Institutional Animal Care and Use Committee at Chongqing Medical University and performed under the guidelines. To obtain tumor-bearing mouse models, 4T1 cells were suspended in serum-free RPMI-1640 (1×10⁶ 4T1 cells in 200 μL per mouse) and then injected subcutaneously into the flanks of female nude mice (for PAI imaging) and BALB/c mice (~20 g, 6–8 weeks, for immune effect). Healthy BALB/c mice were used for biosafety evaluation, and New Zealand rabbits (2.0–2.4 kg) were used to test the synergistic effect of FUS.
Synthesis of APS/AuNR/PLGA NPs
APS/AuNR/PLGA NPs were prepared by a simple double emulsion (water/oil/water: W/O/W) method and freeze-dried. First, 40 mg of PLGA-PEG-COOH was dissolved in 2 mL of trichloromethane (CHCl3), and then APS and 50 μL of AuNRs (1 g/mL) were added. Subsequently, the mixture was emulsified by an ultrasonic cell crusher (Sonics & Materials, Inc., USA) at an intensity of 75 W for 2 min (water/oil: W/O). For the second emulsion, 4 mL of 1% PVA solution was added to the above emulsified solution, and the mixture was emulsified again with the ultrasonic probe at an intensity of 75 W (water/oil/water: W/O/W). Furthermore, 10 mL of 2% isopropyl alcohol solution was added to the emulsion, and CHCl3 was extracted by magnetic stirring at 100 r/min for 2 h. Next, the NPs were separated by centrifugation (8000 rpm, 10 min) and washed with PBS three times at 4 °C. Finally, the final nanoparticles were lyophilized and stored at room temperature for further use. Pure PLGA powder was prepared using a similar process, except that water was added instead of APS or AuNR solution during the synthesis. To generate homogeneous and stable NPs, parameters such as the volume of added APS (100, 150, 200, 250 μL), the first emulsification time (W/O) (1, 2, 3, 4 min), and second emulsification time (W/O/W) (3, 4, 5, 6, 7 min) were optimized.
Characterization of APS/AuNRs/PLGA NPs
The size distribution and ζ-potential of APS/AuNR/PLGA NPs were measured by dynamic light scattering (DLS, Malvern Instruments, Malvern, UK). The particle size of APS/AuNRs/PLGA NPs dispersed in phosphate buffered saline (PBS) was assessed at different time points (0 d, 1 d, 3 d, 7 d and 14 d). The morphological and structural characterization of nanoparticles was performed by transmission electron microscopy (TEM, Hitachi H-7600, Tokyo, Japan). The encapsulation efficiency (EE) of APS was assessed using the phenol-sulfuric acid method.18 First, the sample was broken by dimethyl sulfoxide (DMSO) and ultrasonic exposure. Second, 2 mL of test fluid and 1 mL of 5% phenol solution were added to a tube and blended. In addition, 5 mL of concentrated sulfuric acid was carefully added. After strong vibration for 2min, the sample was heated in a boiling water bath for 15min, then moved to a cold water bath and cooled rapidly. Finally, the absorbance of the UV at 490 nm was measured by a NANODROP2000 Ultramicro Spectrophotometer (Thermo, USA). A concentration-dependent standard curve was made before calculating encapsulation efficiency. EE (%) =Ce/Ct × 100%, where EE is the encapsulation efficiency of APS, Ct is the total amount of added APS, and Ce is the encapsulated amount of APS. The EE of the AuNRs (808 nm) was calculated as EE (%) = Wt -Wu/Wt ×100%, where Wt is the total mass of added AuNRs and Wu is the mass of unentrapped AuNRs in the collection solution.
Cytotoxicity of APS/AuNRs/PLGA NPs in vitro
To evaluate the cytotoxicity of APS/AuNRs/PLGA NPs, HUVECs were seeded into a 96-well plate (1×10⁴ cells per well) overnight. After cell adhesion, APS/AuNR/PLGA NPs dispersed in serum-free DMEM solution were added to each well at different concentrations (0.00, 0.40, 0.80, 1.20, 1.60, 2.00, 2.40, and 2.80 mg/mL). The toxicities of PBS, APS, AuNRs and free PLGA NPs were also tested as control groups. Their concentrations corresponded to the content in APS/AuNRs/PLGA NPs. After another 24 h of coincubation, cell viabilities were tested by the typical CCK-8 assay (Dojindo, Japan). Five replicates were conducted for each group. Cell viability (%)= (At-Ab)/(At0-Ab) ×100%, where At is the absorption of the test cuvette at 490 nm, Ab is the absorption of a blank cuvette without cells, and At0 is the absorption without test drugs.
Biosafety Evaluation of APS/AuNRs/PLGA NPs in vivo
Fifty healthy BALB/c mice were randomly divided into 5 groups with three mice in each group. Drugs (10 mg/kg) were intravenously injected, and blood samples and major organs (heart, liver, spleen, lung and kidney) were collected after 1 day (control group and 1 d group), 3 d (3 d group), 7 d (7 d group) or 14 d (14 d group). Blood samples were collected for serum biochemical index analysis and routine blood examination. The serum biochemical indexes included aspartate aminotransferase (AST), alanine aminotransferase (ALT), blood urea nitrogen (BUN), creatinine (CREA), creatine kinase (CK) and lactate dehydrogenase (LDH).
Photoacoustic Imaging (PAI) in vitro and in vivo
To evaluate the PA performance of the APS/AuNRs/PLGA NPs, a Vevo LAZR Photoacoustic Imaging System (VisualSonics Inc., Toronto, Canada) equipped with an LZ250 (fiber-optic bundles: 25.4 × 1.25 mm; focal depth: 10 mm; center frequency: 21 MHz; axial resolution: 75 μm) probe was used to acquire PA and ultrasound images. The APS/AuNR/PLGA NPs suspension at a concentration of 5 mg/mL was scanned for PAI at different wavelengths ranging from 680 nm to 970 nm (interval = 5 nm) to detect the maximum absorbance for optimized PAI. The quantified PA signal intensities within a region of interest (ROI) in each image were then analyzed by Vevo LAZR software. Different concentrations (1, 2, 3, 4, 5 mg/mL) of APS/AuNR/PLGA NPs dispersed in PBS were triggered by the optimal excitation wavelength to acquire the corresponding PA images. The PA intensities of each image were measured.
Focused Ultrasound (FUS) Exposure in vitro and in vivo
In vitro, to evaluate the synergistic effect of APS/AuNR/PLGA NPs with FUS, 4T1 cell suspensions were seeded into a 24-well plate (1×10⁸ cells per well), and 100 μL of APS/AuNR/PLGA NPs dispersed in serum-free DMEM was added into each well at different concentrations (1, 2, 3, 4 and 5 mg/mL). FUS was performed at 5 W for 10 s by a CZF300 Ultrasound Therapeutic Instrument (Haifu Company, Chongqing Medical University, China). After FUS exposure, cells were labeled with an Annexin V-FITC/PIPC5.5 Apoptosis Detection Kit (Sigma, United States) and detected by flow cytometry. In addition, membrane damage was identified by trypan blue staining after FUS.21 After that, 0.4% trypan blue dye was immediately added to each group and stained for 20 min, washed with PBS, and observed under an optical microscope. Membrane damage was indicated by the movement of the dye through the cells, causing them to appear blue. Living cell rate (%)= (Nt -Np)/Nt ×100%, Np is the number of positive blue stained cells, and Nt is the total number of cells.
In vivo, after anesthesia, eighteen healthy New Zealand rabbits were intravenously injected with APS/AuNR/PLGA NPs (10 mg/kg). The liver was exposed and ablated with FUS at a power of 5 W for 10 s. The liver was collected after 24 h, and coagulative necrosis volume (V) was measured using Microsea HIFU measurement software: V = π/6×length×width×thickness. The energy efficiency factor (EEF) (J/mm3) = η Pt/V,22 where η is the focusing coefficient of the transducer, which reflects the ability of the transducer to gather ultrasonic energy (η=0.7); P is the total ultrasonic power (P=5 W); t is the total treatment time (t=10 s); and V(mm3) is the damage volume. The effects in control groups treated separately with PBS, APS, AuNRs and PLGA NPs were also tested.
Facilitating DC Maturation in vitro
Mouse bone marrow-derived DCs (BMDCs) were generated and modified as previously described.23 Briefly, bone marrow tissues were collected from the femurs and tibiae of female BALB/c mice (6–8 W). Erythrocytes were removed from the derived bone marrow cells by ammonium chloride potassium (ACK) lysis buffer and plated in 30 mL of RPMI 1640 complete medium supplemented with 20 ng/mL GM-CSF and IL-4 at 37°C in a 5% CO2 atmosphere in an incubator. On day 2 and day 4, two-thirds of the original medium was removed, and fresh complete medium containing the same amount of GM-CSF and IL-4 was added. On day 5, 4T1 cells were mixed with APS/AuNR/PLGA NPs, and FUS ablation (5 W, 10 s) was then added and coincubated with DCs for 48 h. On day 7, the floating and loosely adherent DCs in the culture were harvested for subsequent analyses. The effects of treatment with PBS, APS, AuNRs and free PLGA NPs were also tested separately in the control groups, and LPS (1 μg/mL) was used as a positive control group. Their concentrations corresponded to the content in APS/AuNR/PLGA NPs.
First, the effect of APS/AuNR/PLGA NPs on the expression of DC surface molecules was measured by flow cytometry. DCs were collected at day 7 and washed three times with complete RPMI 1640 medium. Subsequently, test cells were stained with FITC anti-mouse CD80, APC anti-mouse CD86 or PE anti-mouse MHC-II antibodies (Biolegend, USA) for 20 min at 4°C. Then, the cells were detected by flow cytometry (BD Influx, USA).
The culture supernatants were collected and tested by the enzyme-linked immunosorbent assay (ELISA) method according to the manufacturer’s instructions for the Mouse IL-12 and IFN-γ ELISA Kit (NOVUS, USA). After the termination of the reaction, the absorbance at 450 nm was detected with a microplate reader (BioTec, USA), and the concentration of cytokines was analyzed according to the standard curve.
Finally, to evaluate the phagocytosis function of DCs, test cells were coincubated with 1 mg/mL FITC-dextran (40,000 Da, Sigma, USA) at 37°C in 5% CO2 for 1 h. The cells were washed twice with wash buffer and resuspended in 4% paraformaldehyde solution. Then, the cells were detected using flow cytometry. The phenotypic changes in the test DCs were analyzed with BD Influx flow cytometer software.
Immune Response in vivo
Ninety tumor-bearing BALB/c mice were randomly divided into 6 groups with 15 mice in each group. One of the groups was the control group without intervention, and drugs were injected locally into the tumor before FUS exposure (5 W, 10 s) in 5 groups: PBS+FUS, APS/AuNR/PLGA NPs +FUS, AuNRs +FUS, APS +FUS, and PLGA NPS +FUS. On days 3, 7 and 14 after FUS, 5 mice were sampled randomly from each group. Blood samples from the orbital venous sinus were drawn into an Eppendorf tube and allowed to clot at 37°C for 2 h. The serum was separated by centrifugation to determine the concentrations of cytokines. The concentrations of interferon gamma IFN-γ, tumor necrosis factor TNF-α, IL-10, IL-4, IgG1, and IgG2a in serum were assayed by an ELISA Kit (Novus, USA).
Furthermore, for the APS/AuNR/PLGA-PEG NPs group, the tumor was harvested for H&E staining for histological analysis, and immunohistochemical staining with antibodies against vascular endothelial growth factor (VEGF) was performed to assess tumor cell proliferation. To evaluate apoptosis, the terminal deoxynucleotidyl transferase-mediated nick end labeling (TUNEL) method was performed on these tissue sections. The proliferating index (PI) and apoptotic index (AI) were calculated as the ratio of positively stained cells to all cells, (PI)= number of positive cells/total number of cells ×100%, (AI) = number of positive cells/total number of cells × 100%, obtained from at least 5 randomly selected high power fields (200 ×magnification) by blind observers. In addition, the tumor was collected for mouse anti-mouse CD3 and anti-mouse CD8 staining, and the inguinal lymph node near the tumor was harvested for mouse anti-mouse CD80 and anti-mouse CD86 staining to analyze the histopathologic characteristics. The immunoassayed cells were considered positive when there was homogeneous and clearly visible brown staining and negative if this staining was absent. The positive cell area rate was analyzed with Fiji ImageJ. Ten areas with the highest number of stained cells were chosen in each section.
Statistical Analysis
All data were analyzed with GraphPad Prism 8.0 version. Quantitative data are expressed as the mean ± standard deviation. One-way analysis of variance (ANOVA) was used for multiple-group comparisons. Tukey’s honestly significant difference was used for the statistical post test of ANOVA. P values < 0.05 were considered statistically significant, *p <0.05, **p < 0.01, ***p < 0.001, ****p<0.0001.
Results
Design and Characterization of APS/AuNR/PLGA-PEG NPs
An optical microscope (Figure 2A) and a TEM image of APS/AuNRs/PLGA-PEG (Figure 2B) indicated the successful encapsulation of the microstructure of APS/AuNR/PLGA NPs, showing a uniform spherical morphology, and the average hydrodynamic diameter of APS/AuNR/PLGA-PEG NPs was approximately 255.00±0.1717 nm (Figure 2D). All volumes of APS (100, 150, 200, 250 mL) were acceptable, and 150 mL was preferred (Figure 2G). The optical ultrasonic working time of W/O was 2 min (Figure 2H). The ultrasonic working time of W/O/W should be greater than or equal to 5 min (Figure 2I). Figure 2D and E show that the size and zeta of NPs were almost unchanged at 7 d and significantly changed at 2 weeks (p < 0.0001). The freeze-dried powders of NPs could also be easily dispersed into aqueous solution for further cancer imaging and treatment.
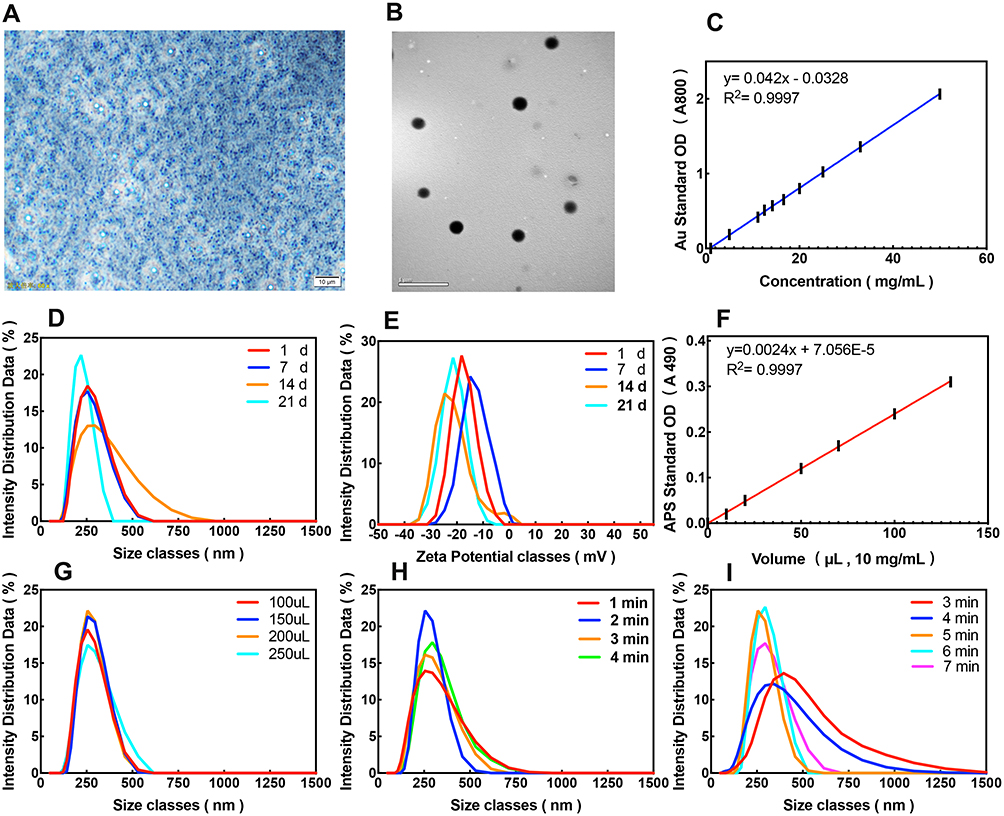 |
Figure 2 Synthesis and characterization of APS/AuNRs/PLGA-PEG. (A) Bright-field optical microscopy image (Magnification, 200 ×, scale bar, 20μm) and (B) TEM image (scale bar, 1μm) of APS/AuNRs/PLGA-PEG NPs. (C) The concentration-dependent absorbance of AuNRs at the wavelength 800 nm. (D) Size distribution changes of APS/AuNRs/PLGA-PEG over time. (E) Zeta distribution changes of APS/AuNRs/PLGA-PEG over time. (F) The concentration-dependent absorbance of APS at the wavelength 490 nm. (G) Size distribution with different volumes of APS. (H) Size distribution with different ultrasonic emulsification times for W/O. (I) Size distribution with different ultrasonic emulsification times for W/O/W. Abbreviations: APS, astragalus polysaccharide; AuNRs, gold nanorods; PLGA, poly(lactic-co-glycolic) acid; PEG, polyethylene glycol; NPs, nanoparticles; TEM, transmission electron microscopy; W/O, water/oil; W/O/W, water/oil/water. |
Both APS and AuNRs showed a concentration-dependent increase in absorbance intensity, which represented a linear relationship. APS showed Y=0.0024X + 5.634E-6 (R2=0.9997) (APS, 490 nm) (Figure 2F); AuNRs showed Y=0.042X-0.0328 (R2=0.9997,808 nm) (Figure 2C). The encapsulation efficiency of APS was 54.89±2.07% for 100 L. The EE of AuNRs was 56.09 ± 4.33% (Table 1).
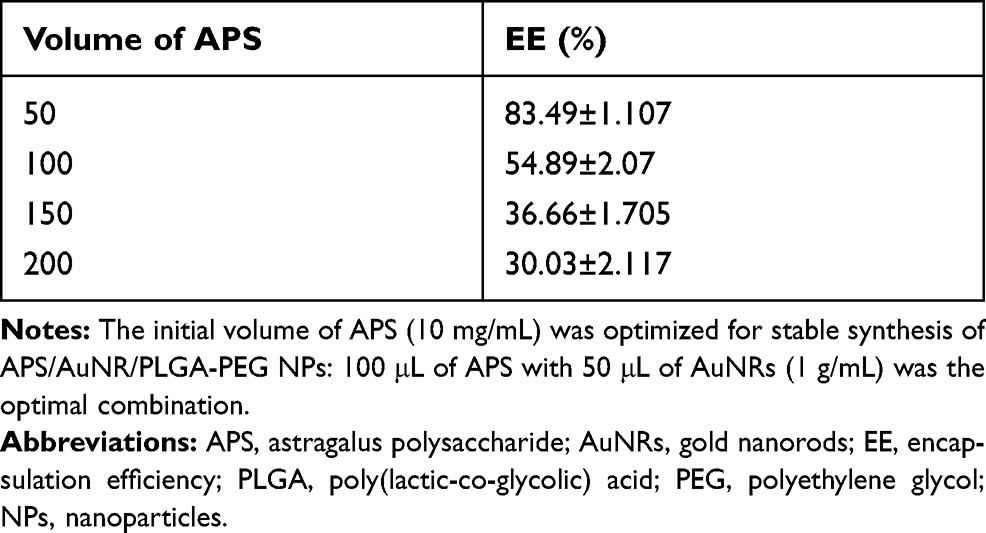 |
Table 1 Encapsulation Efficiency of APS |
In vitro Cytotoxicity and in vivo Biosafety Assay
The biocompatibility and biosafety of APS/AuNR/PLGA-PEG NPs are of high significance for further clinical translation, and they were systematically evaluated both in vitro and in vivo. The cytotoxicity of APS, AuNRs, PLGA-PEG NPs, and PBS was also evaluated by the typical CCK-8 assay (Figure 3A). The cell viability results showed no obvious cytotoxicity for all the groups in the analyzed concentration range, even at high concentrations of APS/AuNR/PLGA-PEG NPs (Figure 3B). The in vivo biocompatibility was further evaluated in mice after the intravenous administration of APS/AuNR/PLGA-PEG NPs for prolonged durations (control, 1 d, 3 d, 7 d and 14 d). No obvious abnormal behaviors were found among all mice, suggesting that the NPs did not cause significant side effects in the mice. The blood indexes included liver functional markers (ALT, AST), kidney functional markers (BUN, CR), myocardial enzyme spectrum (CK, LDH) and complete blood count (RBC, WBC, etc.) and showed negligible variation among the different groups (Figure 3C). H&E staining of the major organs (heart, liver, spleen, lung and kidney) at different durations after intravenous injection showed no significant acute or chronic physiological toxicity compared with the control group (Figure 3D).
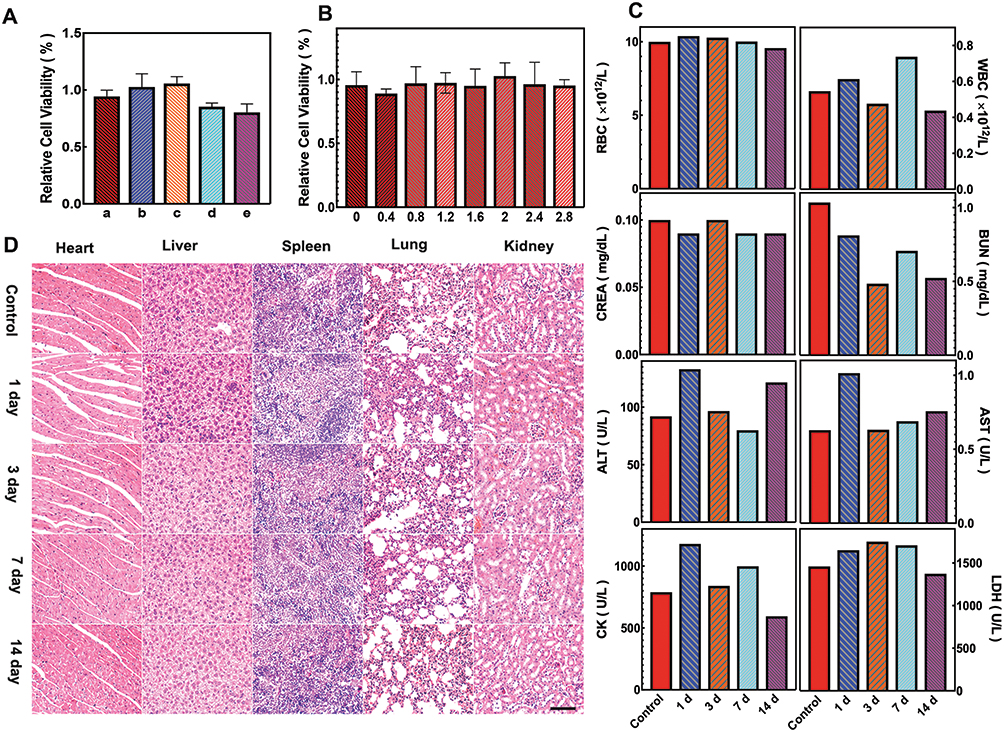 |
Figure 3 In vitro cytotoxicity and in vivo biosafety assay of APS/AuNRs/PLGA-PEG. (A) CCK8 for cell cytotoxicity of PBS (a), APS/AuNRs/PLGA-PEG (b), APS (c), AuNRs (d) and PLGA-PEG-COOH (e) after co-incubation with HUVEC for 24 h. (B) Cell cytotoxicity at different concentrations of APS/AuNRs/PLGA-PEG. (C) Hematological assay of BALB/c mice and (D) H&E staining of major organs from the control group and the experimental groups 1, 3, 7, and 14 days post intravenous injection of APS/AuNRs/PLGA-PEG. Magnification, 200 ×, scale bar, 50 μm. Abbreviations: APS, astragalus polysaccharide; AuNRs, gold nanorods; PLGA, poly(lactic-co-glycolic) acid; PEG, polyethylene glycol; HUVECs, human umbilical vein endothelial Cells; ALT, alanine aminotransferase; AST, amino-transferase; BUN, blood urea nitrogen; CK, creatine kinase; CREA, creatinine; LDH, lactate dehydrogenase; CCK-8, Cell Counting Kit-8; H&E, hematoxylin-eosin. |
In vitro Photoacoustic Imaging
AuNRs are extensively applied in PA imaging because of their facile synthesis route and tunable absorption in the NIR region. APS/AuNR/PLGA-PEG NPs were further evaluated to determine their diagnostic-imaging performance for PAI. As shown in Figure 4D, 708 nm was determined to be the maximum absorbance for the potentially optimal PAI. The B-mode ultrasound images, PA images and overlay images (B-mode and PA mode) of the APS/PLGA-PEG NPs and APS/AuNR/PLGA-PEG NPs suspensions at elevated concentrations are shown in Figure 4B and E. The APS/AuNRs/PLGA-PEG NPs showed concentration-dependent contrast enhancement in PAI, while the APS/PLGA-PEG NPs represented no contrast change even at high concentrations, indicating that the encapsulated AuNRs contributed to the PA signal enhancement. Quantitative PA signal intensities increased linearly relative to elevated APS/AuNR/PLGA-PEG NPs concentrations (Figure 4D). Furthermore, the relative concentration of the APS/PLGA-PEG NPs suspension was locally injected into the tumor and was obtained in the tumor tissues (Figure 4A and C).
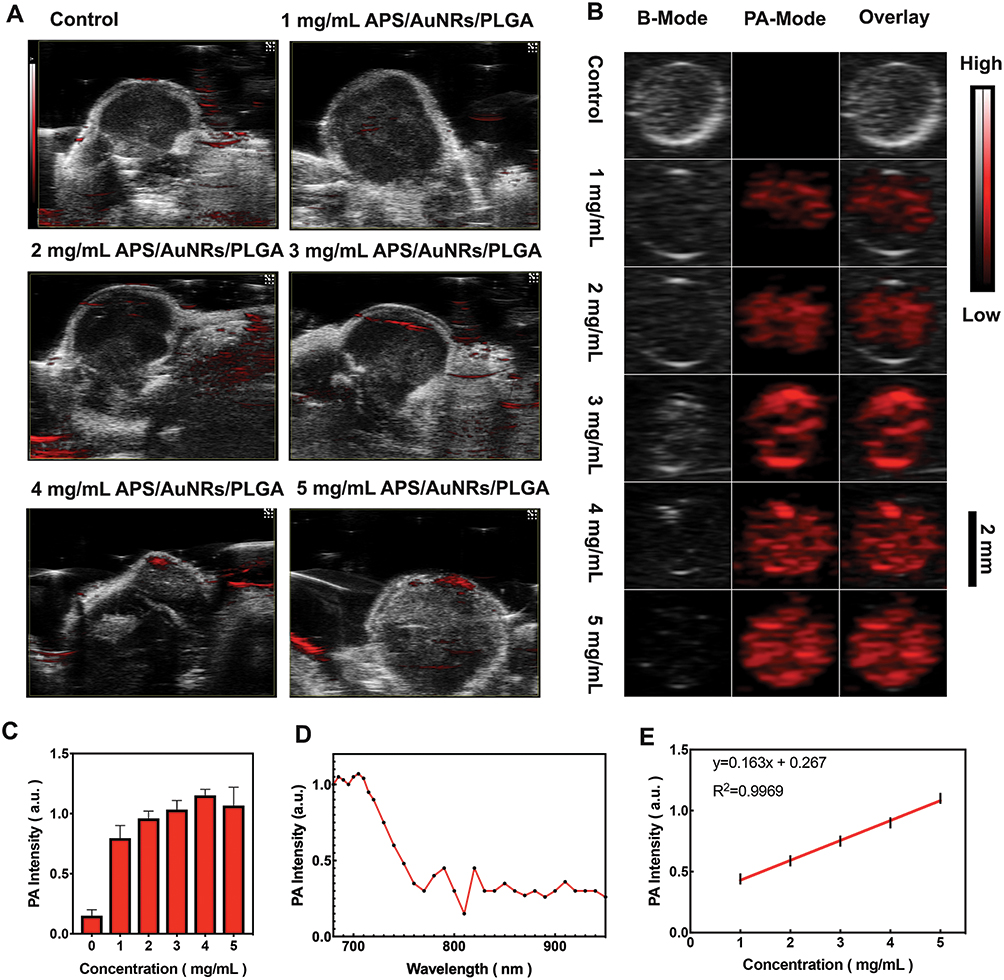 |
Figure 4 In vitro and in vivo PAI assessment of APS/AuNRs/PLGA-PEG. (A) PAI after local injection of 5 mg/mL APS/PLGA as the control group, different concentrations (1, 2, 3, 4, 5 mg/mL) of APS/AuNRs/PLGA, and (C) corresponding quantitative analysis of enhanced PA signal intensities. (B) PAI at a concentration of 5 mg/mL APS/PLGA and at concentrations of 1, 2, 3, 4, 5 mg/mL of APS/AuNRs/PLGA (from top to bottom) and (E) corresponding quantitative analysis of enhanced PA signal intensities. (D) PA spectrum of (3 mg/mL) from 680 nm to 970 nm. Abbreviations: APS, astragalus polysaccharide; AuNRs, gold nanorods; PLGA, poly(lactic-co-glycolic) acid; PEG, polyethylene glycol; PAI, photoacoustic imaging. |
Enhancing FUS Ablation in vitro and in vivo
Different concentrations of APS/AuNR/PLGA-PEG NPs (0, 1, 2, 3, 4, 5 mg/mL) were used in combination with FUS. Compared to the control groups of PBS+FUS, the APS/AuNR/PLGA-PEG NPs increased the apoptosis rate (Figure 5A) (P< 0.05) in a linear relationship with the concentration (Figure 5C). The APS/AuNR/PLGA-PEG NPs decreased the living cell rate (Figure 5B) of cancer cells with FUS ablation (P< 0.001) and had a linear relationship with the concentration (Figure 5D). According to the results shown in Figure 6, the necrosis area (Figure 6B) increased with increasing concentrations of APS/AuNR/PLGA-PEG NPs, P< 0.0001. Furthermore, the EEF (Figure 6C) was calculated and showed a significant difference between different concentration groups, P< 0.0001. Above all, the APS/AuNR/PLGA-PEG NPs could significantly enhance the thermal ablation effect in vitro and vivo.
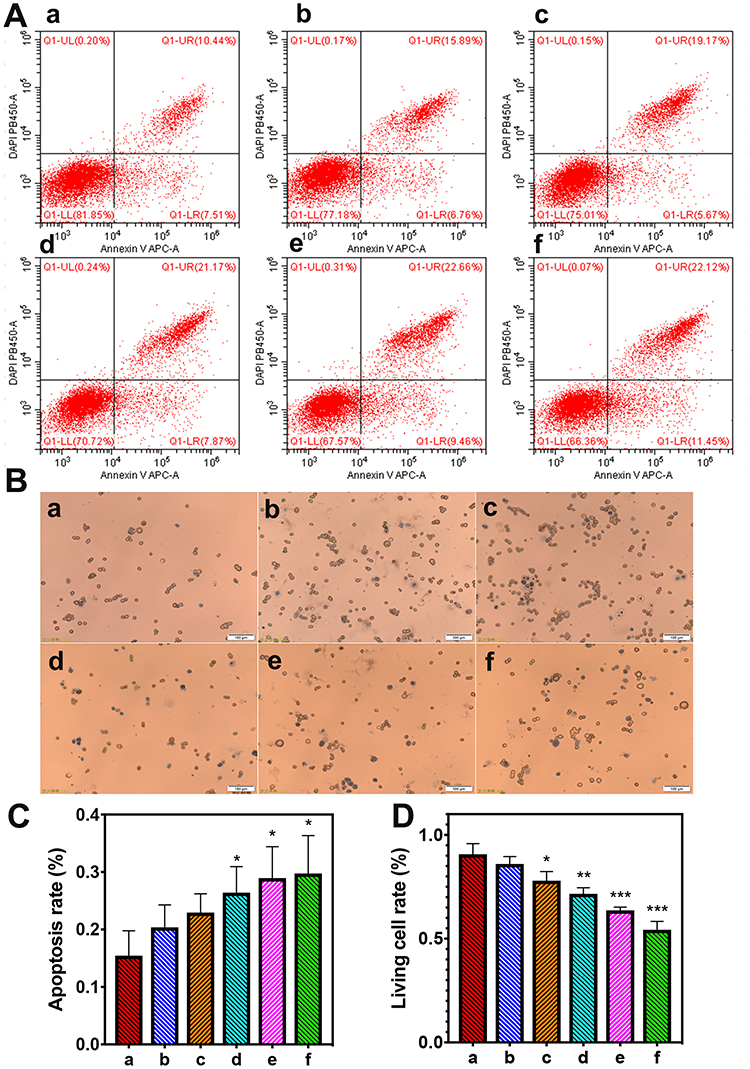 |
Figure 5 In vitro FUS ablation. (Aa-f) different concentration of APS/AuNRs/PLGA-PEG + FUS groups: (0 mg/mL, 1 mg/mL, 2 mg/mL, 3 mg/mL, 4 mg/mL, 5 mg/mL). (A) Flow cytometry for apoptosis rate, and (C) corresponding apoptosis rate analysis, Apoptosis rate =UR+ LR. (B) Trypan blue staining, showing the proportion of membrane-damaged cells (labeled with black arrow). Original magnification, 200 ×. All bars, 100 μm. (D) Corresponding living cell rate analysis. All statistical analysis was in comparison to the control group, *P< 0.05, **P< 0.01, ***P< 0.001. Abbreviations: APS, astragalus polysaccharide; AuNRs, gold nanorods; PLGA, poly(lactic-co-glycolic) acid; PEG, polyethylene glycol; FUS, focused ultrasound. |
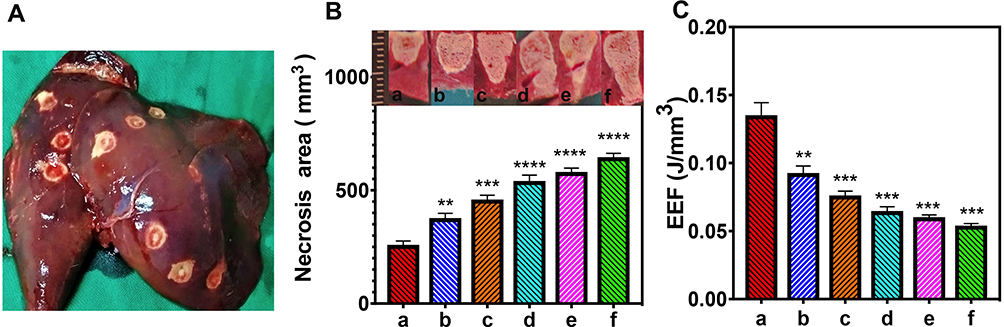 |
Figure 6 In vivo FUS ablation. (a-f) Different concentrations of APS/AuNRs/PLGA-PEG + FUS groups: (0 mg/mL, 1 mg/mL, 2 mg/mL, 3 mg/mL, 4 mg/mL, 5 mg/mL), 3 rabbits per group. (A) Rabbit liver after ablation. (B) Necrosis area analysis. (Insert: Maximum longitudinal section of necrotic tissue.) (C) Corresponding energy efficiency factor (EEF). All statistical analyses were in comparison to the control group. **P< 0.01, ***P< 0.001, ****P< 0.0001. Abbreviations: APS, astragalus polysaccharide; AuNRs, gold nanorods; PLGA, poly(lactic-co-glycolic) acid; PEG, polyethylene glycol; FUS, focused ultrasound. |
Facilitating DC Maturation in vitro
Enhancing CD80, CD86, and MHC-II Expression of DCs
The expression of MHC class II, CD80 and CD86 molecules on DCs was determined by flow cytometry. As shown in Figure 7A, the proportion of MHC-II (Figure 7C) was 71.08±0.055%, the proportion of CD86 (Figure 7D) was 65.01±0.154%, and the proportion of CD80 (Figure 7E) was 23.13±0.076% in the APS/AuNR/PLGA-PEG NPs group. These values were significantly higher than those in the control group (P< 0.0001), AuNR group (P< 0.01), and PLGA-PEG NPs group (P< 0.0001) and lower than those in the LPS group (P< 0.01). The results suggested that APS/AuNR/PLGA-PEG NPs could induce phenotypic maturation of DCs. However, no differences in the expression of MHC-II, CD80 and CD86 were observed between the APS/AuNR/PLGA-PEG NPs and APS (P> 0.05). The results demonstrated that both APS/AuNR/PLGA-PEG NPs and LPS can enhance CD80, CD86, and MHC-II expression in DCs.
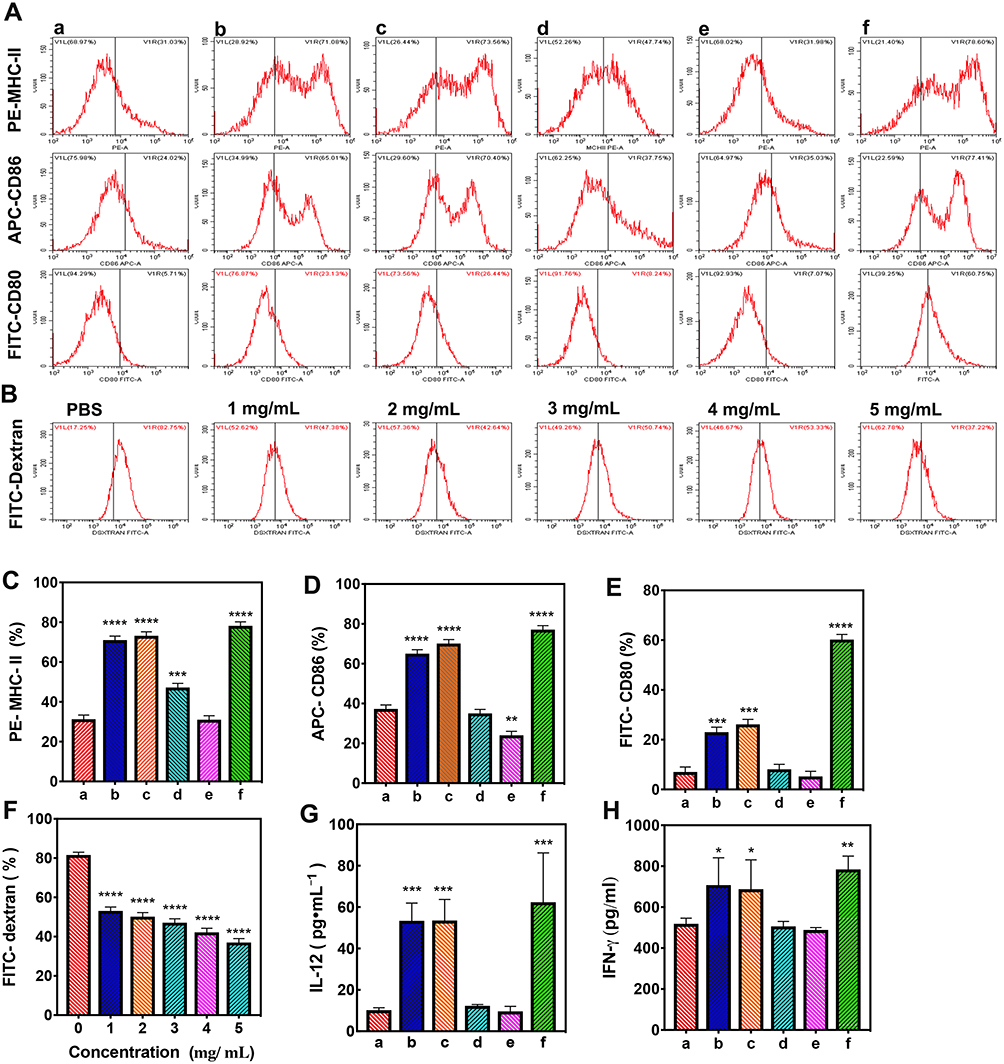 |
Figure 7 In vitro Flow cytometry and ELISA of the immune response. (Aa) Control group; (Ab) APS/AuNRs/PLGA-PEG NPs group; (Ac) APS group; (Ad) AuNRs group; (Ae) PLGA-PEG NPs group; (Af) LPS group. (A) Flow cytometry and corresponding analyses of the expression of MHC class II (C), CD86 (D) and CD80 (E) molecules on DCs. (B) Flow cytometry of the phagocytosis function of FITC-dextran of DCs and (F) corresponding analysis. (G) ELISA of IL-12 and (H) IFN-γ production of DCs. All statistical analyses were in comparison with the control group, *P< 0.05, **P< 0.01, ***P< 0.001, ****P< 0.0001. Abbreviations: APS, astragalus polysaccharide; AuNRs, gold nanorods; PLGA, poly(lactic-co-glycolic) acid; PEG, polyethylene glycol; NPs, nanoparticles; IL, interleukin; DCs, dendritic cells; MHC-II, major histocompatibility complex; IFN, interferon; ALT, alanine aminotransferase; AST, amino-transferase; BUN, blood urea nitrogen; CK, creatine kinase; CR, creatinine; LDH, lactate dehydrogenase; FITC, fluorescein isothiocyanate; APC, allophycocyanin; PE, phycoerythrin; ELISA, enzyme-linked immunosorbent assay. |
Reducing the Phagocytosis Function of DCs
The effect of the NPs on the phagocytosis function of FITC-dextran of DCs is shown in Figure 7B. The phagocytosis rates (Figure 7F) of FITC-dextran in different concentration groups of APS/AuNR/PLGA-PEG NPs were 53.33% (1 mg/mL), 50.74% (2 mg/mL), 47.38% (3 mg/mL), 42.67% (4 mg/mL), and 37.22% (5 mg/mL), which were lower than in the control group (82.75%), P< 0.0001. The results showed that the APS/AuNR/PLGA-PEG NPs could decrease the phagocytosis function of DCs in a linear relationship with the concentration.
Enhancing IL-12 and IFN-γ Production of DCs
As shown in Figure 7G and H, IL-12 and IFN-γ levels were significantly higher in the supernatants of DCs incubated with APS/AuNR/PLGA-PEG NPs compared to the control group (P < 0.01). However, there was no significant difference in IL-12 and IFN-γ secretion between the APS/AuNR/PLGA-PEG NPs and LPS groups (P > 0.05). These results demonstrated that both APS/AuNR/PLGA-PEG NPs and LPS could enhance IL-12 and IFN-γ production by DCs.
Immune Response in vivo
The Dynamic Changes in TNF-α and IFN-γ Concentrations
The dynamic changes in serum TNF-α and IFN-γ concentrations in each group are illustrated in Figure 8A and B. On day 3, the TNF-α and IFN-γ concentrations in the APS/AuNR/PLGA-PEG NPs+ FUS (26.020±5.585%, 17.067±5.976%) and APS+FUS groups (20.543±7.082%, 18.330±3.524%) were significantly higher than those in the other four groups (p < 0.001). On day 7, the TNF-α (10.863±1.358%) and IFN-γ (12.960±4.540%) concentrations in the APS/AuNR/PLGA-PEG NPs+ FUS group were higher than those in other groups (p < 0.001). On day 14, there was no significant difference between groups (P> 0.05). On days 3, 7 and 14, the TNF-α and IFN-γ concentrations in the PBS+ FUS, AuNRs+ FUS and PLGA-PEG NPs+ FUS groups were not significantly different from those in the blank group (P>0.05).
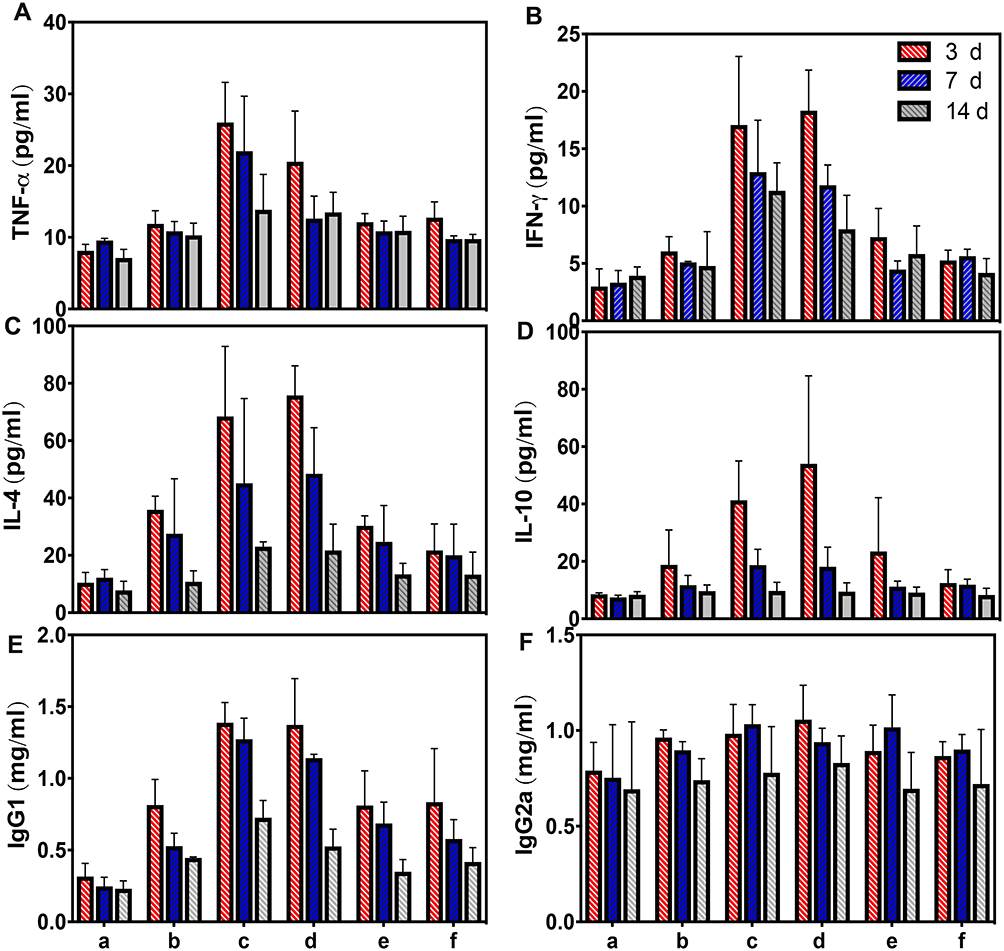 |
Figure 8 In vivo ELISA dynamic changes of TNF-α (A), IFN-γ (B), IL-4 (C), IL-10 (D), IgG1 (E) and IgG2a (F) concentration. (A) Control group; (B) PBS+ FUS group; (C) APS/AuNR/PLGA-PEG NPs+ FUS group; (D) APS + FUS group; (E) AuNRs + FUS group, (F) PLGA-PEG NPs + FUS group, fifteen mice per group and five mice were sacrificed each time. The APS/AuNR/PLGA-PEG NPs+ FUS and APS + FUS could significantly increase the concentrations of TNF-α, IFN-γ, IL-4, IL-10 and IgG1, P<0.001. The concentrations of IgG2a had no significant difference, P> 0.05. Abbreviations: APS, astragalus polysaccharide; AuNRs, gold nanorods; PLGA, poly(lactic-co-glycolic) acid; PEG, polyethylene glycol; NPs, nanoparticles; FUS, focused ultrasound; IL, interleukin; TNF, tumor necrosis factor; IFN, interferon; IgG, immunoglobulin G. |
The Dynamic Changes in IL-4 and IL-10 Concentrations
The dynamic changes in serum IL-4 and IL-10 concentrations in each group are illustrated in Figure 8C and D. The concentrations of IL-4 were higher than those of IL-10. On days 3 and 7, the IL-4 and IL-10 concentrations in the APS/AuNR/PLGA-PEG NPs+ FUS, APS+FUS, PBS+ FUS, AuNR+ FUS and PLGA-PEG NPs+ FUS groups were significantly higher than those in the blank groups (p < 0.001), in which the APS/AuNR/PLGA-PEG NPs+ FUS and APS+FUS groups were significantly higher than those in the other groups (p < 0.0001). On day 14, the IL-4 and IL-10 concentrations in all the groups were not significantly different from those in the blank group (P>0.05).
The Dynamic Changes in IgG1 and IgG2a Concentrations
The dynamic changes in serum IgG1 and IgG2a concentrations in each group are illustrated in Figure 8. On days 3, 7 and 14, the IgG1 concentrations (Figure 8E) in the APS/AuNR/PLGA-PEG NPs+ FUS, APS+FUS groups, PBS+ FUS, AuNRs+ FUS and PLGA-PEG NPs+ FUS groups were significantly higher than those in the blank groups (p < 0.001), and the APS/AuNR/PLGA-PEG NPs+ FUS and APS+FUS groups were significantly higher than the other groups on days 3 and 7 (p < 0.01). The dynamic changes in serum IgG2a concentrations in each group on days 3 and 7 are illustrated in Figure 8F. The IgG2a concentrations in the APS/AuNR/PLGA-PEG NPs+ FUS, APS+FUS, PBS+ FUS, AuNRs+ FUS and PLGA-PEG NPs+ FUS groups were higher than those in the blank group, but the IgG2a concentrations in all the groups were not significantly different from those in the blank group (P>0.05).
The H&E Staining Changes in the APS/AuNR/PLGA-PEG NPs +FUS Group
The immunohistochemistry staining results are shown in Figure 9A. In the H&E-stained tumor sections, there were only a small portion of purple blue (normal nucleus) and many more deformed nuclei (karyopyknosis, karyorrhexis and karyolysis) at 3, 7, and 14 d in the APS/AuNR/PLGA-PEG NPs+FUS group, indicating the high apoptosis and coagulative necrosis of the cancer cells.
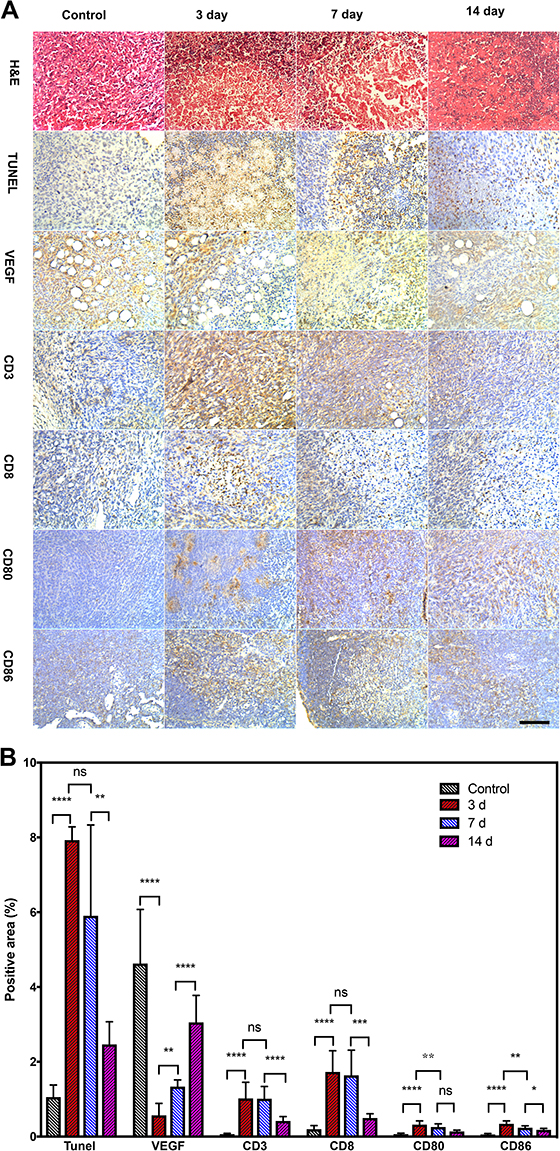 |
Figure 9 Immunohistochemical staining of the APS/AuNR/PLGA-PEG NPs+ FUS group on day 0, 3, 7, and 14. (A) H&E staining (first row), TUNEL staining (second row), VEGF staining (third row). Immunohistochemical staining of positive expression (brown) of tumor-infiltrating CD3+ (fourth row), CD8+ (fifth row), and lymphoid-infiltrating CD80+ (sixth row), CD86+ (the last row) in the control group: 0 day (left column) and APS/AuNR/PLGA-PEG NPs+ FUS group at 3 days (second column), 7 days (third column) and 14 days (right column). Original magnification, 200×. Bar, 50 μm. (B) Corresponding statistical analysis columns, mean; error bar. *P < 0.05; **P< 0.01; *** P < 0.001; ****P<0.0001. Data were pooled from two independent experiments with five mice per group. Abbreviations: APS, astragalus polysaccharide; AuNRs, gold nanorods; PLGA, poly(lactic-co-glycolic) acid; PEG, polyethylene glycol; NPs, nanoparticles; FUS, focused ultrasound; TUNEL: TdT-mediated dUTP nick-end labeling; H&E, hematoxylin-eosin; VEGF, vascular endothelial growth factor; CD, cluster of differentiation. |
TUNEL and VEGF Staining Changes in Apoptosis and Proliferation
In the TUNEL and VEGF assay results (Figure 9A), representative apoptosis-positive and proliferation-positive cells were indicated by dark-brown nuclei. The apoptotic index (AI) was 7.93±0.353% in the 3d group, 5.909±2.425% in the 7d group, and 2.466±0.607% in the 14d group, which were all significantly higher than that in the control group (1.058±0.322%, P<0.0001) (Figure 9B). The proliferating index (PI) was 4.624±1.449% in the control group, 0.570±0.318% in the 3d group, 1.338±0.181% in the 7d group, and 3.054±0.723% in the 14d group. The results indicated that the apoptosis rates were significantly increased 3 d after ablation, and the proliferation rate decreased (P< 0.0001). After that, the apoptosis rates decreased, and the proliferation rate increased at 7 and 14 d.
CD3+ and CD8+ Staining Changes in Tumor-Infiltrating T Cells
Immunochemical staining displayed CD3+ T cells and CD8+ T cells in tumor sections in brown (Figure 9A), and the infiltration rate (Figure 9B) of CD3+ T cells was 4.624±1.449% in the control group, 1.023±0.431% in the 3d group, 1.016±0.327% in the 7d group, and 0.419±0.119% in the 14d group. The infiltration rates of CD8+ T cells were 0.198±0.098% in the control group, 1.730±0.568% in the 3d group, 1.641±0.673% in the 7d group, and 0.496±0.118% in the 14d group. The infiltration rates of both CD3+ and CD8+ T cells were significantly higher than in the control group after FUS ablation, P<0.0001. There was no significant difference between the 3d group and 7d group (P> 0.05), but on day 14, the infiltration rate was significantly decreased compared to those in the previous groups (P< 0.01) and higher than that in the control group (P< 0.0001).
CD80+ and CD86+ Staining Changes in Lymphoid-Infiltrating DCs
Immunochemical staining of CD80+ and CD86+ DCs in lymphoid sections was displayed in brown (Figure 9A), and the positive rate of CD80+ DCs (Figure 9B) was 0.065±0.025% in the control group, 0.320±0.104% in the 3d group, 0.256±0.087% in the 7d group, and 0.139±0.034% in the 14d group. The positive rate of CD86+ DCs was 0.049±0.037% in the control group, 0.345±0.077% in the 3d group, 0.238±0.050% in the 7d group, and 0.182±0.040% in the 14d group. Both positive CD80+ and CD86+ DCs at 3, 7, and 14 d were significantly higher than those in the control group (P<0.0001). The values were highest in the 3d group and significantly decreased over time (P< 0.01).
Discussion
Focused ultrasound (FUS) provides noninvasive and nonionizing radiation thermal ablation,24 which can achieve an immune-stimulation effect against cancer, with consequent possible “abscopal effect” and induction of long-term immunity against cancer.25 The FUS-induced immune effects are multifold: First, mechanical and thermal ablation can destroy the tumor mass and lower tumor burden; second, the tumor antigens are exposed and act as a specific tumor vaccine when identified by APCs; in addition, damage-associated molecular patterns (DAMPs) are released, and the expression of heat shock proteins (HSPs) is upregulated, inducing the physiological wound healing response. Furthermore, FUS can cause infiltration of immune cells, such as cytotoxic T lymphocytes (CTLs), into the tumor.4,5 However, this ablation-induced enhanced infiltration alone appears insufficient to generate consistent protective antitumor immunity. Therapies combining ablation with immune stimulation, including antigen presentation and CTL activation, are therefore expected to be the key to boosting FUS-induced immune effects and achieving systemic, long-lasting, antitumor immunity. Thus, we designed a new multifunctional synergistic agent for FUS to provide immune enhancement by combining traditional thermal improvement and multifunctional imaging acoustic agents. This theranostic combination was designed to overcome the limitations of FUS treatments.
Due to its excellent acoustic properties, poly(lactic-co-glycolic acid) (PLGA) is commonly used in the preparation of FUS synergistic agents; it has been approved by the FDA and formally listed as a pharmaceutical excipient in the United States Pharmacopeia.26 Based on previous studies, we optimized the parameters and successfully newly designed and synthesized APS/AuNR/PLGA-PEG NPs. Physical characterization of our NPs demonstrated a spherical morphology with an average size of 255.00±0.1717 nm, and the encapsulation efficacy (EE) of APS in the NPs was 54.89±2.07% when coencapsulated with AuNRs. It was reported that the EE increased without AuNRs.27 To ensure complete function and optimize the APS packaging, we controlled a single variable and fixed the volume of AuNRs, then optically encapsulated APS. The EE of AuNRs was 56.09 ± 4.33%. In this work, there was no detectable toxicity in either short or relatively long timeframes of APS/AuNR/PLGA-PEG NPs administration (Figure 3). PLGA, AuNRs and APS are all nontoxic and can potentially be metabolized normally.
To maximize the efficiency of delivery to the tumor, we coencapsulated gold nanorods (AuNRs) with APS in the biodegradable shell to achieve AuNR-enhanced FUS-mediated drug administration and exposed the PLGA-PEG-COOH shell to aqueous solution for enhanced stability under physiological conditions. In this work, we detected the diagnostic-imaging performance for PAI and the therapeutic-synergistic performance for FUS thermal ablation. APS/AuNR/PLGA-PEG NPs showed concentration-dependent contrast enhancement in PAI in vitro (Figure 4). There were no targeted modifications in the NPs at this stage, which limited their systemic concentration and potential to extravagate into the tumor. Hence, we injected the NPs only locally into the tumor for PAI assays, and the results preliminarily showed the possibility that the APS/AuNR/PLGA-PEG NPs could be used for in vivo PAI imaging. Photoacoustic imaging (PAI) is a noninvasive and nonionizing imaging technique that combines the spectral selectivity of pulsed laser excitation with the high resolution of ultrasound imaging. AuNRs have been proven to be excellent PAI agents,16 and their optical and sensing properties can facilitate the monitoring of the FUS procedure and ensure that a sufficient thermal dose is delivered to the targeted area.28 It was found that the combination of FUS with AuNRs and PAI could control the generation of AuNR-nucleated inertial cavitation for both imaging and enhancing HIFU exposures and lowering the AuNR imaging concentration.15
The results of the FUS thermal enhancing assay showed that the NPs could significantly enhance the heating mechanism of FUS in vitro, which increased the necrotic cell rate and decreased the living cell rate in a linear relationship with the concentration (Figure 5). The same thermal-synergistic effect was achieved in an in vivo rabbit liver study, which showed that the NPs could significantly increase the necrosis area and decrease the energy efficiency factor (EEF) of FUS exposure (Figure 6). As an accurate quantitative index of dose delivery, EEF can directly reflect the relationship between dosage and the efficiency of FUS ablation.29 Our study confirmed that gold nanoparticles have the potential to locally enhance the thermal ablation of FUS and furthermore provide real-time feedback on the success of exposure and monitoring with increasing thermal denaturation rates. The acoustic absorption of the AuNRs endows it with synergistic thermal ablation with focused ultrasound.30
In this study, we chose dendritic cells (DCs) as a cell model and preliminarily investigated the immunomodulatory mechanism of APS. Immature DCs (imDCs) constantly patrol the environment for potential invading pathogens. Once stimulated by APS, imDCs differentiate into mature DCs (mDCs), which upregulate the expression of MHC class II-bearing pathogen-derived peptides and determine the specificity of the T cell response.31 To follow DC changes, the effect of APS/AuNR/PLGA-PEG NPs on CD80, CD86, and MHC-II expression, the phagocytosis function of FITC-dextran, and the IL-12 and IFN-γ production of DCs are illustrated in Figure 7. The results showed that the effect of APS/AuNR/PLGA-PEG NPs was significantly better than that of PBS (P< 0.001) and APS (P> 0.5). Compared to the positive control lipopolysaccharide (LPS) group, the expression of CD80 and the production of IL-12 were significantly lower in the APS/AuNR/PLGA-PEG NPs group (P<0.001), and MHC-II, CD86, and IFN-γ showed no significant difference (P> 0.05). Additionally, the phagocytosis of FITC-dextran showed a concentration-dependent decrease with APS/AuNR/PLGA-PEG NPs (0, 1, 2, 3, 4, 5 mg/mL) (P<0.01). Accumulated evidence indicates that the APS/AuNR/PLGA-PEG NPs are a satisfactory immune adjuvant that can significantly boost the maturity of DCs, which play an important role in initiating adaptive immunity. Polysaccharide is a kind of natural biological macromolecule that occurs in a wide variety of forms in nature, in plants, animals, and microorganisms, and is a kind of traditional Chinese herbal medicine that has been used in clinical practice for more than 2000 years.32 It has been shown that APS mainly contains 9 monosaccharides, Glc, Gal, Ara, Rha, Man, Xyl, Fuc, Fru and Rib, with a Mw range of 8.7–4800 kDa, and might also contain GalA and GlcA.33 Various studies have shown that astragalus polysaccharide could play an important role in immune regulation,34 but the mechanism remains unknown and needs further investigation.
To examine the in vivo immune response, we detected changes in cytokines after FUS treatment with NPs on days 3, 7, and 14. Cytokines such as IL-2 and INF-γ, produced by type 1 T helper (Th1) cells, are mainly associated with cellular immune functions such as delayed hypersensitivity, and IL-4, IL-5, IL-13, produced by type 2 helper (Th2) cells, mainly increase B cell antibody production. Both Th1 and Th2 can produce TNF-a.35 The results demonstrated that the APS/AuNR/PLGA-PEG NPs +FUS could significantly upregulate TNF-α, IFN-γ, IL-4, IL-10, and IgG1 compared to the control group (P<0.0001) and FUS group (P<0.0001) on day 3. The immune effect on day 3 was the strongest and then decreased on day 7, becoming almost identical to that of the control group on day 14. IFN-is considered the iconic marker of the Th1 response, and IL-4 plays an important role in the differentiation of Th2 cells.36 The ratio of IL-4/IFN-γ changes in the APS/AuNRs/PLGA-PEG NPs +FUS group (4.0-fold on day 3, 3.5-fold on day 7, 2.0-fold on day 14) was not significantly different from that in the control group and FUS group (P>0.05), which means that both Th1 and Th2 responses would have been boosted with little difference. IL-10 is known as an immunosuppressor, inhibiting the proliferation and cytokine production of T cells, inducing tolerance indirectly, and inhibiting the full maturation of DCs.37 The IL-4/IL-10 ratio changes in the APS/AuNR/PLGA-PEG NPs +FUS group were 1.6-fold on day 3, 2.4-fold on day 7, and 1.1-fold on day 14, which showed that both the immune promoting effect and suppressing effect were upregulated, but the -killing immune effect predominated. These reports support our findings that serum levels of IL-6 and IL-10 increased after FUS treatment in 120 patients with uterine fibroids38 and that APS could significantly promote IFN-γ, IL-2, IL-4 and IL-10 secretion in chickens.34 The concentration of IgG2a was not significantly different between the test group and the control group (P>0.05), and IgG1 advanced on days 3 and 7 and then decreased on day 14 (P<0.0001). The changes in the IgG1/IgG2a ratio in the APS/AuNR/PLGA-PEG NPs +FUS group were 1.4-fold on day 3, 1.2-fold on day 7, and 0.9-fold on day 14, which were significantly different from the values in the control group of 0.4-fold on day 3, 0.3-fold on day 7, and 0.3-fold on day 14 (P<0.001). IgG is the most abundant immunoglobulin in the blood and involved in anti-infection immunity. Not only is its content high, but it also has a long duration of circulation. IgG has many kinds of immunologic competences, such as antibacterial, antiviral, antitoxin and antitumor effects.11 APS was found to enhance specific IgG, IgG1 and IgG2a antibody responses.29 However, IgG2a in our work was not significantly different between groups. This may be the result of the combined action of IL-4 and IFN-γ. In our study, the changes in IL-4/IFN-γ were not significantly different between the groups. IL-4 promotes IgG1 conversion, expanding the proportion of B cells producing IgG1, and IFN-γ inhibits IgG1 but stimulates IgG2a transformation.39 In this work, to ensure that the quantities of drugs in the tumor were equal between groups and to achieve sufficient activity with FUS, we injected equal quantities of the designed drugs locally into the tumor, followed by FUS exposure the next day. Thus, the concentration of the drugs was limited in in vivo circulation, which may make a difference in the immune response from administration by caudal injection. We modified the NPs with a targeting agent for further study and identified the immune effect in vivo by caudal injection. Above all, it demonstrated that the APS/AuNR/PLGA-PEG NPs that cooperated with FUS could regulate the host immunity of both Th1 and Th2 cells and especially facilitate the activity of the immune cytokines IFN-γ, TNF-a, and IL- 4 rather than the suppression of the immune cytokine IL-10.
As shown in Figure 9, VEGF and TUNEL immunohistochemical staining was used to detect cell proliferation and apoptosis, which confirmed the thermal ablation synthesis effect of the APS/AuNRs/PLGA-PEG NPs with FUS treatment. In addition, CD3 and CD8 staining were adopted to reveal the infiltration of T cells into the destroyed tumor, which validated that FUS ablation could destroy the physical barrier and promote CTL infiltration. To strengthen this result, we performed double staining to identify the CD4/CD8 ratio in further studies. Furthermore, CD80 and CD86 staining were performed to identify the proportion of mDCs in the lymphoid adjacent to the tumor, which confirmed that the APS/AuNRs/PLGA-PEG responds to mDC homing and enhances its antigen presentation capacity. Our study preliminarily confirmed that FUS thermal ablation can destroy tumor tissue and expose tumor-specific antigens; at the same time, the destruction of the tumor barrier contributes to the infiltration of CTLs responding to the immunomodulatory activities of APS, specifically and cooperatively killing the residual tumor. Next, we stained all the groups for more accurate identification, along with recording the tumor size and survival curve to examine the curative effect of this combined therapy.
In this work, we reported a new strategy for FUS synergistic agents, integrating the herbal immunoadjuvant and physical thermal ablation. Both APS and FUS have been widely used in clinical cancer treatment, which has special significance for further clinical FUS treatment in China. The APS/AuNR/PLGA-PEG NPs had exciting synergistic effects, which make up for the limitations of ultrasound-guided FUS in terms of imaging, thermal ablation enhancement, and drug administration to enhance immunomodulatory activity.
Conclusion
In summary, we successfully constructed a new multifunctional theranostic agent, APS/AuNR/PLGA-PEG, which encapsulated astragalus polysaccharide (APS) and gold nanorods (AuNRs) in PEGylated PLGA NPs. The APS/AuNR/PLGA-PEG NPs exhibited exciting PA imaging properties that have the potential to facilitate the real-time imaging of the FUS technique. Furthermore, the APS/AuNR/PLGA-PEG NPs showed excellent synergistic performance with FUS in bolstering the thermal ablation effect and enhancing immune regulation. Therefore, this work paves a new way for an herbal immunoadjuvant to boost FUS-induced immune effects and systemically maximize the synergistic efficacy for FUS therapy.
Acknowledgments
We gratefully acknowledge the valuable cooperation of Dr. Yang Sijin of Chongqing Traditional Chinese Medicine Hospital offering valuable ideas at the beginning of the experiment.
Disclosure
The authors report no conflicts of interest in this work.
References
1. Ter Haar G, Coussios C. High intensity focused ultrasound: physical principles and devices. Int J Hyperthermia. 2007;23:89–104. doi:10.1080/02656730601186138
2. Wang Z. The theoretical basis of minimally-invasive and non-invasive medicine: treatments-minimize harm to patients. Ultrason Sonochem. 2015;27:649–653. doi:10.1016/j.ultsonch.2015.05.023
3. Bull JMC. A review of immune therapy in cancer and a question: can thermal therapy increase tumor response? Int J Hyperthermia. 2018;34:840–852. doi:10.1080/02656736.2017.1387938
4. van den Bijgaart RJ, Eikelenboom DC, Hoogenboom M. Thermal and mechanical high-intensity focused ultrasound: perspectives on tumor ablation, immune effects and combination strategies. Cancer Immunol Immunother. 2017;66:247–258. doi:10.1007/s00262-016-1891-9
5. Feng W. High intensity focused ultrasound ablation and antitumor immune response. J Acoust Soc Am. 2013;134:1695–1701. doi:10.1121/1.4812893
6. Qian X, Han X, Chen Y. Insights into the unique functionality of inorganic micro/nanoparticles for versatile ultrasound theranostics. Biomaterials. 2017;142:13–30. doi:10.1016/j.biomaterials.2017.07.016
7. Yizhen L, Hao L, Liu F. Cell penetrating peptide-modified nanoparticles for tumor targeted imaging and synergistic effect of sonodynamic/HIFU therapy. Int J Nanomedicine. 2019;14:5875–5894. doi:10.2147/IJN.S212184
8. Li C, Zhang N, Zhou J. Peptide blocking of PD-1/PD-L1 interaction for cancer immunotherapy. Cancer Immunol Res. 2018;6:178–188. doi:10.1158/2326-6066.CIR-17-0035
9. Cousin S, Seneschal J, Italiano A. Toxicity profiles of immunotherapy. Pharmacol Ther. 2018;181:91–100. doi:10.1016/j.pharmthera.2017.07.005
10. Zahran E, Risha E, AbdelHamid F. Effects of dietary astragalus polysaccharides (APS) on growth performance, immunological parameters, digestive enzymes, and intestinal morphology of Nile tilapia (Oreochromis niloticus). Fish Shellfish Immune. 2014;38:149–157. doi:10.1016/j.fsi.2014.03.002
11. Xie JH, Jin ML, Morris GA. Advances on bioactive polysaccharides from medicinal plants. Crit Rev Food Sci Nutr. 2016;29:56,S60–S84.
12. Wang Y, Zhang Q, Chen Y. Antitumor effects of immunity-enhancing traditional Chinese medicine. Biomed Pharmacother. 2020;121:109570. doi:10.1016/j.biopha.2019.109570
13. Zhang WM, Ma WR, Zhang J. The immunoregulatory activities of astragalus polysaccharide liposome on macrophages and dendritic cells. Int J Biol Macromol. 2017;105:852–861. doi:10.1016/j.ijbiomac.2017.07.108
14. Chuang C-C, Cheng C-C, Chen P-Y. gold nanorod-encapsulated biodegradable polymeric matrix for combined photothermal and chemo-cancer therapy. Int J Nanomedicine. 2019;14:181–193. doi:10.2147/IJN.S177851
15. McLaughlan JR, Cowell DMJ, Freear S. Gold nanoparticle nucleated cavitation for enhanced high intensity focused ultrasound therapy. Phys Med Biol. 2018;63:015004. doi:10.1088/1361-6560/aa97e9
16. Li W, Chen X. Gold nanoparticles for photoacoustic imaging. Nanomedicine. 2015;10:299–320. doi:10.2217/nnm.14.169
17. Cui Hand YX. Enhanced-heating effect during photoacoustic imaging-guided high-intensity focused ultrasound. Appl Phys Lett. 2012;99:231113.
18. Xu S, Wusiman A, Liu Z. pH-responsive Astragalus polysaccharides-loaded poly (lactic-co-glycolic acid) nanoparticles and their in vitro immunogenicity. Int J Biol Macromol. 2019;125:865–875. doi:10.1016/j.ijbiomac.2018.12.156
19. Zolnik BS, Burgess DJ. Effect of acidic pH on PLGA microsphere degradation and release. J Control Release. 2007;122:338–344. doi:10.1016/j.jconrel.2007.05.034
20. Fang J, Nakamura H, Maeda H. The EPR effect: unique features of tumor blood vessels for drug delivery, factors involved, and limitations and augmentation of the effect. Adv Drug Deliv Rev. 2011;63(3):136–151. doi:10.1016/j.addr.2010.04.009
21. Zhang W, Shou W-D, Xu Y-J. Low-frequency ultrasound-induced VEGF suppression and synergy with dendritic cell-mediated anti-tumor immunity in murine prostate cancer cells in vitro. Sci Rep. 2017;7:5778. doi:10.1038/s41598-017-06242-8
22. LI F, Wang Z, Du Y. Study on therapeutic dosimetry of HIFU ablation tissue. J Biomed Eng. 2006;23(4):839–843.
23. Yin SY, Wang CY, Yang NS. Interleukin-4 enhances trafficking and functional activities of GM-CSF-stimulated mouse myeloid-derived dendritic cells at late differentiation stage. Exp Cell Res. 2011;317:2210–2221. doi:10.1016/j.yexcr.2011.06.013
24. Mauri G, Sconfienza LM, Pescatori LC. Technical success, technique efficacy and complications of minimally-invasive imaging-guided percutaneous ablation procedures of breast cancer: a systematic review and meta-analysis. Eur Radiol. 2017;27:3199–3210. doi:10.1007/s00330-016-4668-9
25. Mauri G, Nicosia L, Xu Z. Focused ultrasound: tumour ablation and its potential to enhance immunological therapy to cancer. Br J Radiol. 2018;91:20170641. doi:10.1259/bjr.20170641
26. Danhier F, Ansorena E. PLGA-based nanoparticles: an overview of biomedical applications. J Control Release. 2012;161:505–522. doi:10.1016/j.jconrel.2012.01.043
27. Zhang N, Song J, Liu Y. Photothermal therapy mediated by phase-transformation nanoparticles facilitates delivery of anti-PD1 antibody and synergizes with antitumor immunotherapy for melanoma. J Control Release. 2019;306:15–28. doi:10.1016/j.jconrel.2019.05.036
28. Sadeghi-Goughari M, Jeon S, Kwon HJ. Enhancing thermal effect of focused ultrasound therapy using gold nanoparticles. IEEE Trans Nanobiosci. 2019;18:661–668. doi:10.1109/TNB.2019.2937327
29. Fan H, Cun JP, Zhao W. Factors affecting effects of ultrasound guided high intensity focused ultrasound for single uterine fibroids: a retrospective analysis. Int J Hyperthermia. 2018;35:1–7. doi:10.1080/02656736.2018.1511837
30. Devarakonda SB, Myers MR, Lanier M. Assessment of gold nanoparticle-mediated-enhanced hyperthermia using MR-guided high-intensity focused ultrasound ablation procedure. Nano Lett. 2017;17:2532–2538. doi:10.1021/acs.nanolett.7b00272
31. Proietto AI, van DS, Zhou P. Dendritic cells in the thymus contribute to T-regulatory cell induction. Proc Natl Acad Sci USA. 2008;105:19869–19874. doi:10.1073/pnas.0810268105
32. Wu Y, Li YY, Liu C. Structural characterization of an acidic Epimedium polysaccharide and its immune-enhancement activity. Carbohyd Polym. 2016;138:134–142. doi:10.1016/j.carbpol.2015.11.014
33. Franz G. Polysaccharides in pharmacy: current Applications and Future concepts. Planta Med. 1989;55:493–497. doi:10.1055/s-2006-962078
34. Jin M, Zhao K, Huang Q, Shang P. Structural features and biological activities of the polysaccharides from Astragalus membranaceus. Int J Biol Macromol. 2014;64:257–266. doi:10.1016/j.ijbiomac.2013.12.002
35. Romagnani S. Th1/Th2 cells. Inflamm Bowel Dis. 1999;5:285–294. doi:10.1097/00054725-199911000-00009
36. Watt WC, Cecil DL, Disis ML. Selection of epitopes from self-antigens for eliciting Th2 or Th1 activity in the treatment of autoimmune disease or cancer. Semin Immunopathol. 2016;39:245–253. doi:10.1007/s00281-016-0596-7
37. De Jong EC, Smits HH, Kapsenberg ML. Dendritic cell-mediated T cell polarization. Springer Semin Immunopathol. 2004;26:289–307. doi:10.1007/s00281-004-0167-1
38. Wang X, Qin J, Chen J. The effect of high-intensity focused ultrasound treatment on immune function in patients with uterine fibroids. Int J Hyperthermia. 2013;29:225–233. doi:10.3109/02656736.2013.775672
39. Matías J, Brotons A, Cenoz S. Oral immunogenicity in mice and sows of enterotoxigenic escherichia coli outer-membrane vesicles incorporated into zein-based nanoparticles. Vaccines. 2019;8:E11. doi:10.3390/vaccines8010011
 © 2020 The Author(s). This work is published and licensed by Dove Medical Press Limited. The full terms of this license are available at https://www.dovepress.com/terms.php and incorporate the Creative Commons Attribution - Non Commercial (unported, v3.0) License.
By accessing the work you hereby accept the Terms. Non-commercial uses of the work are permitted without any further permission from Dove Medical Press Limited, provided the work is properly attributed. For permission for commercial use of this work, please see paragraphs 4.2 and 5 of our Terms.
© 2020 The Author(s). This work is published and licensed by Dove Medical Press Limited. The full terms of this license are available at https://www.dovepress.com/terms.php and incorporate the Creative Commons Attribution - Non Commercial (unported, v3.0) License.
By accessing the work you hereby accept the Terms. Non-commercial uses of the work are permitted without any further permission from Dove Medical Press Limited, provided the work is properly attributed. For permission for commercial use of this work, please see paragraphs 4.2 and 5 of our Terms.