")
Back to Journals » Journal of Inflammation Research » Volume 15
Multi-Transcriptomic Analysis and Experimental Validation Implicate a Central Role of STAT3 in Skin Barrier Dysfunction Induced Aggravation of Rosacea
Authors Wang Y, Wang B, Huang Y, Li Y, Yan S, Xie H, Zhang Y , Li J
Received 30 December 2021
Accepted for publication 22 March 2022
Published 31 March 2022 Volume 2022:15 Pages 2141—2156
DOI https://doi.org/10.2147/JIR.S356551
Checked for plagiarism Yes
Review by Single anonymous peer review
Peer reviewer comments 3
Editor who approved publication: Professor Ning Quan
Yaling Wang,1,2 Ben Wang,1,2 Yingxue Huang,1 Yangfan Li,1,2 Sha Yan,1 Hongfu Xie,1– 3 Yiya Zhang,1– 3 Ji Li1– 3
1Department of Dermatology, Xiangya Hospital, Central South University, Changsha, People’s Republic of China; 2Hunan Key Laboratory of Aging Biology, Xiangya Hospital, Central South University, Changsha, People’s Republic of China; 3National Clinical Research Center for Geriatric Disorders, Xiangya Hospital, Central South University, Changsha, People’s Republic of China
Correspondence: Ji Li; Yiya Zhang, Department of Dermatology, Xiangya Hospital, Central South University, Changsha, People’s Republic of China, Tel +86-731-84327472, Email [email protected]; [email protected]
Objective: Rosacea is a chronic inflammatory skin disease with high morbidity. Previous studies have described the contribution of skin barrier dysfunction (SBD) in the progression of rosacea, but the specific mechanism remains unclear. In this study, we aim to investigate the key genes that may involve SBD-mediated rosacea aggravation.
Methods: In this study, we evaluated the SBD patterns of rosacea based on the expression of 23 skin barrier-related genes (SBRGs) using a consensus clustering analysis, and revealed the SBD-mediated immune cells infiltration in rosacea using GSE65914 dataset. The key genes associated with SBD and rosacea progression were identified using WGCNA analysis and then verified in rosacea mice model.
Results: Two distinct SBD patterns (moderate- and high-SBD patterns) were determined in rosacea. GO, KEGG and GSEA analysis revealed the differently immune-related signal pathways between two SBD patterns in rosacea. The XCell immune cell assays showed that the increased immune infiltration with SBD. Subsequently, the WGCNA analysis identified STAT3 as the hub gene related to rosacea and SBD, and correlation analysis revealed that STAT3 could contribute to the progression of rosacea partly by dysregulating immune infiltration via activating the cytokine/chemokines signal. Finally, the up-regulated STAT3 was verified in the epidermis of rosacea tissues and correlated with SBRGs expression using IHC and epidermal transcriptome data of rosacea. The vivo experiment showed that tape stripping-induced SBD evidently induced the expression of STAT3 and increased CD4+ T cell infiltration in LL37-induced rosacea-like skin lesion in mice.
Conclusion: In conclusion, our results showed that the destruction of the skin barrier aggravates the inflammation levels and immune infiltration of rosacea partly by activating STAT3-mediated cytokine signal pathways in keratinocytes.
Keywords: rosacea, skin barrier, immune, STAT3, WGCNA
Graphical Abstract:
Introduction
Rosacea is a chronic inflammatory skin disease characterized by flushing, persistent erythema, papules and pustules, telangiectasia and phyma, especially on the cheek, nose, chin, forehead and eyes.1 The incidence of rosacea varies in different areas of the world and a cross-sectional study showed that about 3.48% of individuals are affected in China.2 According to the National Rosacea Society Expert Committee in 2017, the updated classification of rosacea is based on phonotypes linked to clinical manifestations and provides criterion of diagnosis and severity assessment of the disease.3 Although the pathophysiology of rosacea remains unclear, genetic factors, dysregulation of the innate and adaptive immune system, vascular and neuronal dysfunction, and microorganisms such as Demodex folliculorum appear to be involved.4 Above these, Zuo et al found overcleaning were positively associated with rosacea,5 indicating that rosacea is also associated with impairment of the skin barrier.
Skin barrier plays a critical role in skin homeostasis. Various skin barrier-related genes (SBRGs) have been reported to be involved in the progression of skin disease via regulating the skin barrier. The tight junction protein and Filaggrin (FLG) are important SBRGs,6 playing a central role for the physical integrity of the skin barrier. The biological and chemical stimulations from the external environment disrupted the skin barrier by reducing tight junctions, triggering epithelial alarmin, including barrier alarms (KRT6A, KRT16), AMPs (DEFB4B, CAMP, LCN2, S100A7, S100A8, S100A9) and KLK enzyme.7 Previous investigations have shown that patients with rosacea have impaired facial skin barrier, characterized by increased PH, abnormal fatty acid composition and increased trans epidermal water Loss (TEWL).8,9 Previous research demonstrated the dysregulated SBRGs in rosacea patients10,11 and barrier repair could be of therapeutic benefit in rosacea, revealing the potential role of skin barrier dysfunction (SBD) in the pathogenesis of rosacea. However, the underlying mechanism is still unknown.
STAT3 is a crucial signal transducer factor in the pathogenesis of various skin diseases. Upregulation and activation of STAT3 were observed in the keratinocyte, which resulted in the dysregulated immune cells infiltration via promoting the expression of proinflammatory factor in psoriasis.12 Epidermal STAT3 also affected the skin barrier in AD by regulating the transcription of FLG, keratin 1 and keratin 10.13 However, the expression and role of STAT3 in rosacea remains limited.
Here, we aim to investigate the key genes that may involve SBD-mediated rosacea aggravation. In this study, two distinct SBD patterns were identified and were associated with dysregulation of immune infiltration in rosacea. Subsequently, the WGCNA analysis combined with vivo experiments revealed that SBD-induced STAT3 upregulation in keratinocytes plays a key role in the dysregulation of immune cell infiltration, contributing to the progression of rosacea.
Methods
Public Data Source
The expression data and clinical character of rosacea and normal tissues (38 rosacea sample from 19 patients and 20 control sample from 10 healthy volunteers) were downloaded from GSE65914 (GPL571) (https://www.ncbi.nlm.nih.gov/geo/). For the verification of hub genes, rosacea transcriptome data were downloaded from Shih’s study14 and HRA000379 (http://bigd.big.ac.cn/gsa-human/browse).15 The epidermal transcriptome data were downloaded from HRA000809.15
Differential Expression Analysis of SBRGs
The expression of 31 skin barrier molecules from 7 categories as previous described11 was downloaded, including tight junction formation (CLDN1, CLDN16, CLDN23, OCLN), Barrier alarms (KRT6A, KRT16), AMPs (DEFB4B, CAMP, LCN2, S100A7, S100A8, S100A9), cornified envelope formation (FLG, KRT1, KRT10, LCE1D, LCE1F, LOR, SPRR1A, SPRR2A, TGM1, TGM3, TGM5), corneodesmosome organization (CDH1, CDSN, DSC1, DSG1, PKP1) and corneocyte desquamation (KLK5, KLK7, KLK14).11 EdgeR package was used for the differently expressed SBRGs between rosacea and normal tissue with the adjusted p < 0.05 from GSE65914.
Consensus Clustering Analysis
Consensus clustering is a method used for estimating the clustering consensus and assessing stability based on repeated subsampling and clustering, thereby providing the clustering numbers that best fit the data matrix. To determine the SBRGs patterns in rosacea, the 23 differently expressed SBRGs were used for a Consensus Clustering analysis with R package “Consensus Cluster Plus”,16 and k = 3 seemed to be the most appropriate selection.
Enrichment Analyses
The GO and KEGG enrichment analysis was carried out using R “clusterProfiler”, “enrichplot” and “ggplot2” packages. ClueGO was used to reveal the network of GO/KEGG pathways. GSEA analysis was carried out using GSEA_4.1.0 as previously described.17
GSVA Analysis
GSVA was carried out using R “GSVA” package to evaluate the enrichment score of the pathways in moderate-/high-SBD patterns.18
Immune Cells Infiltration in Rosacea
Xcell was used for immune cells infiltration in rosacea using GSE65914 as previously described.19
WGCNA Analysis
The 4045 DEGs between rosacea and normal tissues were used for WGCNA using the R package “WGCNA”. The power (β) = 18 was selected to construct a co-expression network. Next, 0.2 was selected to merge similar modules. The module eigengenes (ME), Gene Significance (GS), and Module Membership (MM) were calculated as previously described.20
The PPI Networks
The PPI network was constructed using the STRING database (https://string-db.org/) with a combined score > 0.7. The “MCODE” was used for the represent modules using Cytoscape software 3.8.1 (https://Cytoscape.org). CytoHubba analysis was used for detecting hub genes.
Connectivity Map (CMap) for Drug Prediction
To predict the potential drugs for rosacea, SBD- and STAT3 related genes were submitted to CMap database for candidate drug of rosacea.21 The top 100 DEGs between the STAT3 high/low group and the top 100 DEGs between moderate-/high-SBD patterns were submitted to CMap for drug prediction. And the drugs with |enrichment|> 0.7 and p < 0.05 were collected as the candidate drugs for rosacea.
Mice
The mice used in the experiment were BALB/c female mice (7–8 weeks old), which were purchased from Hunan SJA Laboratory Animal Co., Ltd. (Changsha, China). We conduct experiments and animal care in accordance with the ‘Guiding Principles for the Use and Care of Experimental Animals issued by the Ministry of Science and Technology of China and ethical guidelines and the protocol approved by the Animal Care and Use Institutional Committee of Xiangya Hospital Central South University (permit code: 201907793).
Animal Model
The dorsal skin of anesthetized mice was shaved 24 hours before the experiment and subjected to tape stripping with a film dressing on their right dorsum (Transpore TM, 3M) until the TEWL increased obviously (Courage and Khazaka, Germany), twice a day for two days. Mouse skin samples were collected 12 hours after the fourth treatment and stored at liquid nitrogen or −80° C. Intradermal injection of LL37 to induce rosacea-like skin lesions as the previous described.22
RNA Extraction and RT-PCR
The total RNA was extracted by TRIzol reagent (Thermo Fisher Scientific, Waltham, MA, USA), and the cDNA synthesis was performed by Maxima H Minus First Strand cDNA synthesis kit (Thermo Fisher Scientific, Waltham, MA, USA). qPCR was performed on an Applied Biosystems 7500 machine (Life Technologies) using ChamQ Universal SYBR qPCR Master Mix (Vazyme Biotech, Nanjing, China). The relative expression of GAPDH mRNA is the relative mRNA expression level of genes, and the data of all genes are shown as fold change against controls. Data are expressed as mean ± standard deviation (SD) and all experiments have been repeated at least 3 times. All relevant PCR primers are summarized in Table 1.
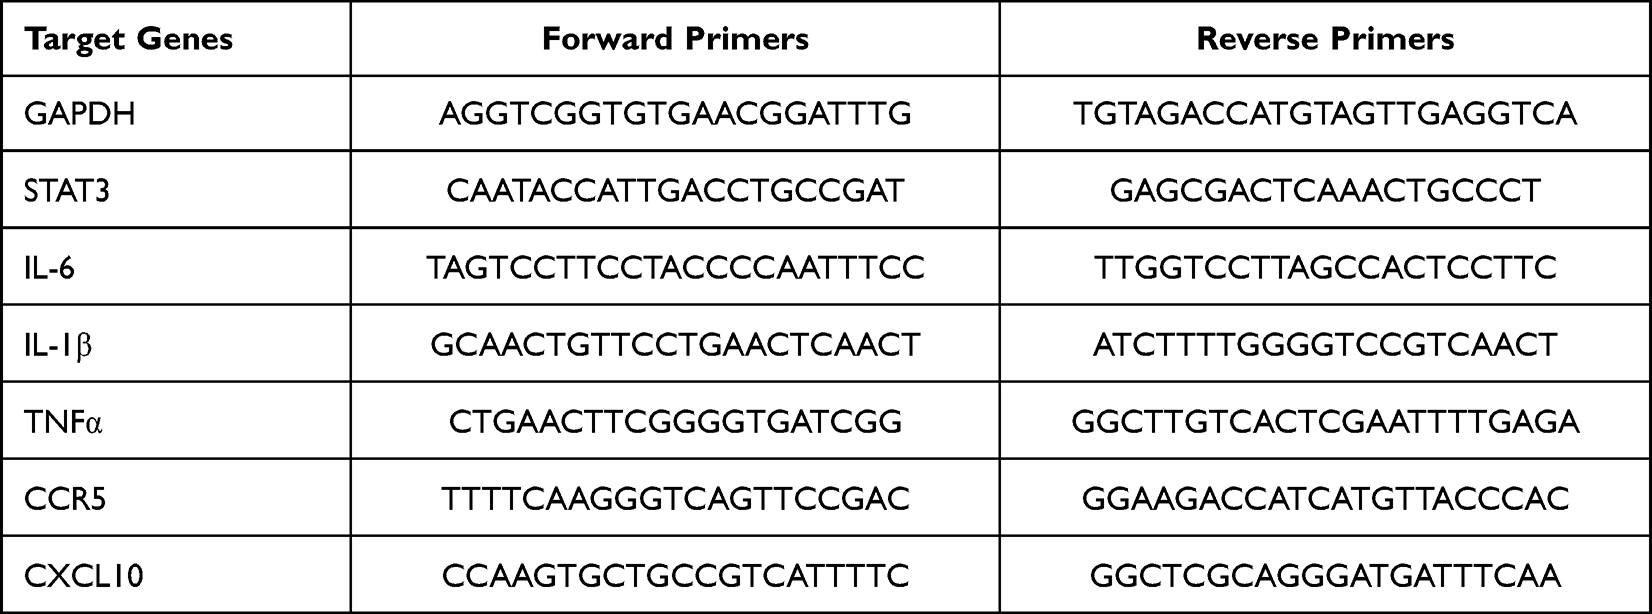 |
Table 1 The Primers of Genes for qPCR |
Immunohistochemistry Assay
Human skin tissues from the central face of patients with rosacea (n = 8) and healthy volunteers (n = 6) with matched age were collected from the Department of Dermatology in Xiangya Hospital, Central South University with informed consent and approved by the ethical committee of the Xiangya Hospital of Central South University. The skin tissues were fixed in formalin, embedded in paraffin, and cut into 3µm slices. After the tissue was repaired by microwave with citrate antigen retrieval solution, it was incubated with anti-STAT3 antibody (10253-2-AP; Proteintech) at 4°C overnight. The immunohistochemical staining kit (Zhongshan Jinqiao) was used in subsequent experiments. The evaluation of the intensity of epidermal staining was carried out by using IHC-Profiler and ImageJ software23 In brief, high positive staining scored 3, positive staining scored 2, low positive scored staining 1, and negative staining scored 0.
Immunofluorescence
Frozen sections (8µm) of mice skin were fixed with 4% paraformaldehyde for 15 minutes at room temperature, and then blocked with 5% normal donkey serum and 0.3% triton for 1 hour at room temperature. Then incubate the sections with anti-STAT3 antibody (10253-2-AP; Proteintech) or anti-CD4 antibody (14-0042-85, Invitrogen) overnight at 4°C. Wash the sections 3 times with PBS, and then incubate with the secondary antibody for 1 hour at room temperature. After washing with PBS, stain the nucleus with 4’,6-diamidino-2-phenylindole (DAPI) for 3 minutes.
HE Staining
Mice skin was fixed with formalin overnight, embedded in paraffin and cut into 3μm slices. After deparaffinization, the sections were stained with hematoxylin and eosin (H&E), and then observed and recorded with a standard optical microscope (Nikon, Japan).
Statistical Analysis
The statistical analysis was performed by using GraphPad version 7.0 (GraphPad, La Jolla, CA, USA) and SPSS version 20.0 (SPSS, Chicago, IL, USA). The results are expressed as mean ± SD. The comparison between the two groups was carried out by t-test, and the comparison between multiple groups was carried out by one-way ANOVA. The p-value <0.05 is considered statistically significant.
Results
SBD Patterns in Rosacea
To investigate the differences in skin barrier between rosacea and normal controls, we analyzed the SBRGS expression in rosacea tissues. 27 of 31 skin barrier-related genes (SBRGs) were detected in GSE65914, and 23 SBRGs were differently expressed between rosacea tissues and normal tissues with p<0.01 (Figure 1A–C). The 23 SBRGS was described in Figure S1. Next, 23 SBRGs were used for a consensus clustering analysis and 3 clusters were identified (Figure 2A). The PCA results revealed 3 well-distinguished clusters in Figure 2B, the normal tissues were clustered into cluster 1 and rosacea tissues were clustered into cluster 2 and 3. As shown in Figure 2C, KLK enzyme (KLK7) and AMPs (CAMP, S100A7, S100A8 and A100A9) levels gradually rise from cluster 1 (normal tissue) to cluster 2 to cluster 3, the levels of tight junction-related genes (CLDN1, CLDN16, CLDN23, OCLN) gradually reduced from cluster 1 (normal tissue) to cluster 2 to cluster 3. The increased KLK enzyme and AMPs and decreased tight junction-regulated genes often function as a marker of skin barrier dysfunction.7 Based on these observations, we identified cluster 1 (normal tissue) as the non-SBD pattern, identified cluster 2 (rosacea tissue) as the moderate-SBD pattern and cluster 3 (rosacea tissue) as the high-SBD pattern, respectively. The clinical correlation analysis showed that PPR tissues were grouped into the high -SBD pattern, while SBD pattern is not significantly different in ETR and PHR subtypes (Figure 2C), indicating the different SBD pattern is a novel classification that is significantly different from subtype (ETR, PPR and PHR).
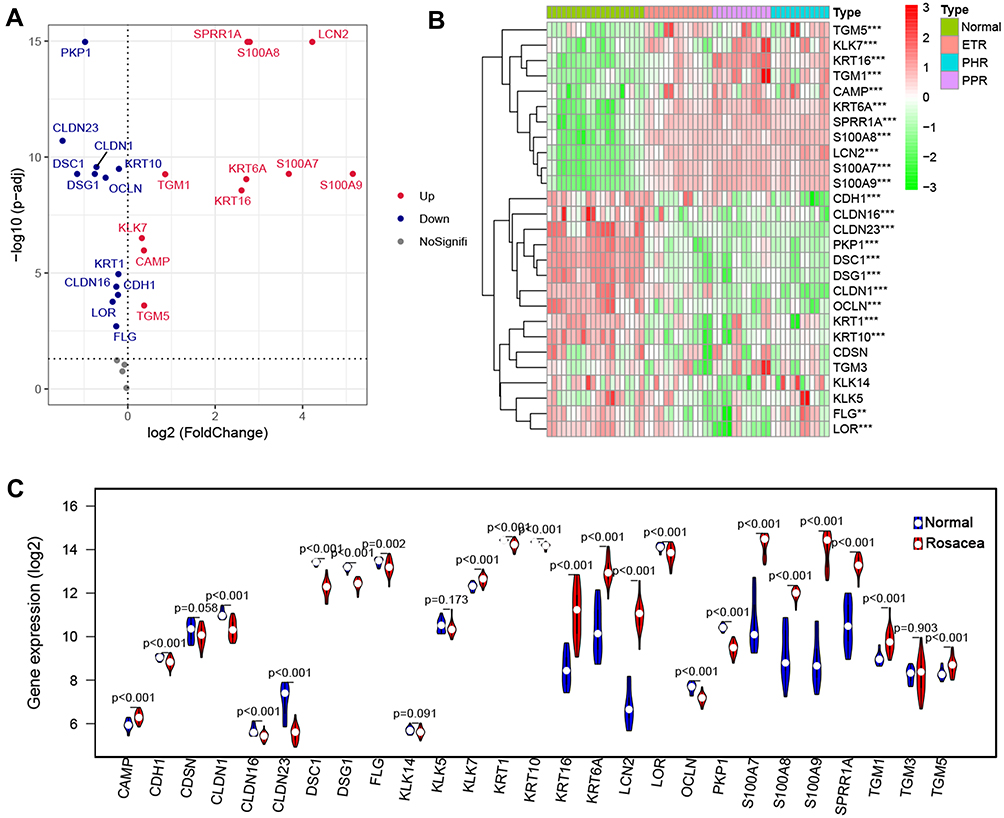 |
Figure 1 SBRGs expression in rosacea. The volcano plot (A) the heatmap (B) and the violin plot (C) of SBRGs in rosacea. |
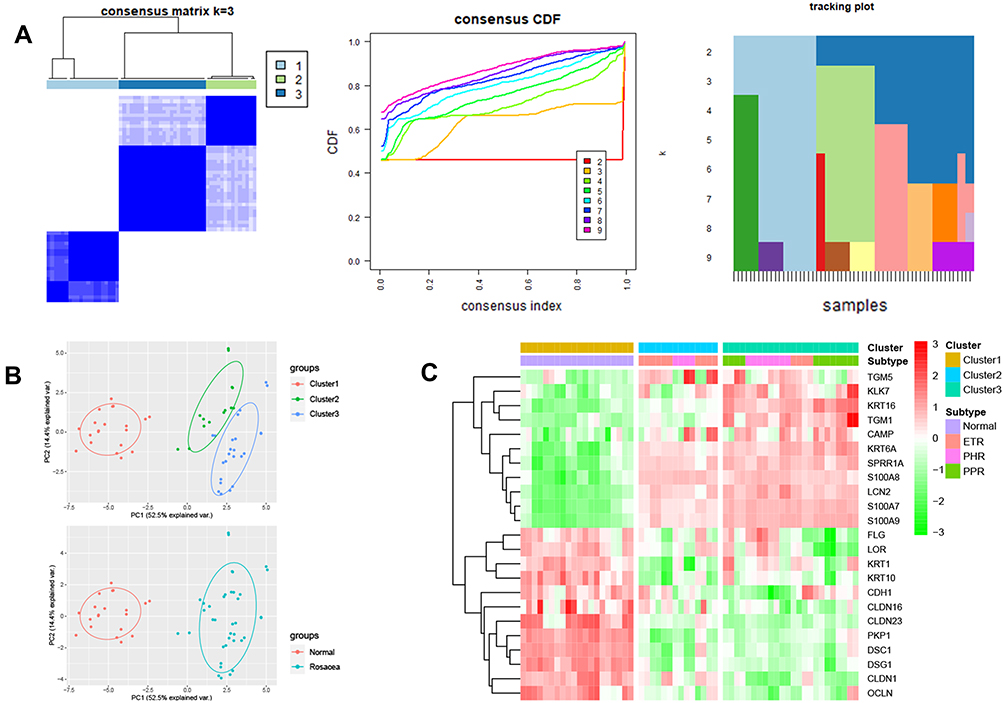 |
Figure 2 The consensus Cluster analysis basing on SBRGs. (A) Three distinct clusters were eventually identified using cluster analysis. (B) The PCA analysis of 3 clusters. (C) The heatmap of SBRGs in 3 clusters. |
SBD Patterns Related to Inflammatory- and Immune-Related Signal Pathway in Rosacea
To reveal the potential pathways related SBD patterns in rosacea, we analyzed the differently expressed genes (DEGs) between the moderate- and high-SBD patterns in rosacea. As shown in Figure 3A, 719 DEGs were detected with |logFC| > 0.5 and FDR < 0.05. The heatmap revealed the 259 upregulated and 460 downregulated DEGs in high-SBD group compared to moderate-SBD group (Figure 3A–C). Next, GO-KEGG analysis revealed that upregulated DEGs were enriched in immune-related signal pathways, including T cell activation, neutrophil degranulation and cytokine-cytokine receptor interaction (Figure 3D and Table S1–2. The downregulated DEGs were enriched into metabolism-related pathways, including fatty acid metabolism, carbon metabolism, glycolysis/gluconeogenesis. etc (Figure 3E and.Table S3–4)
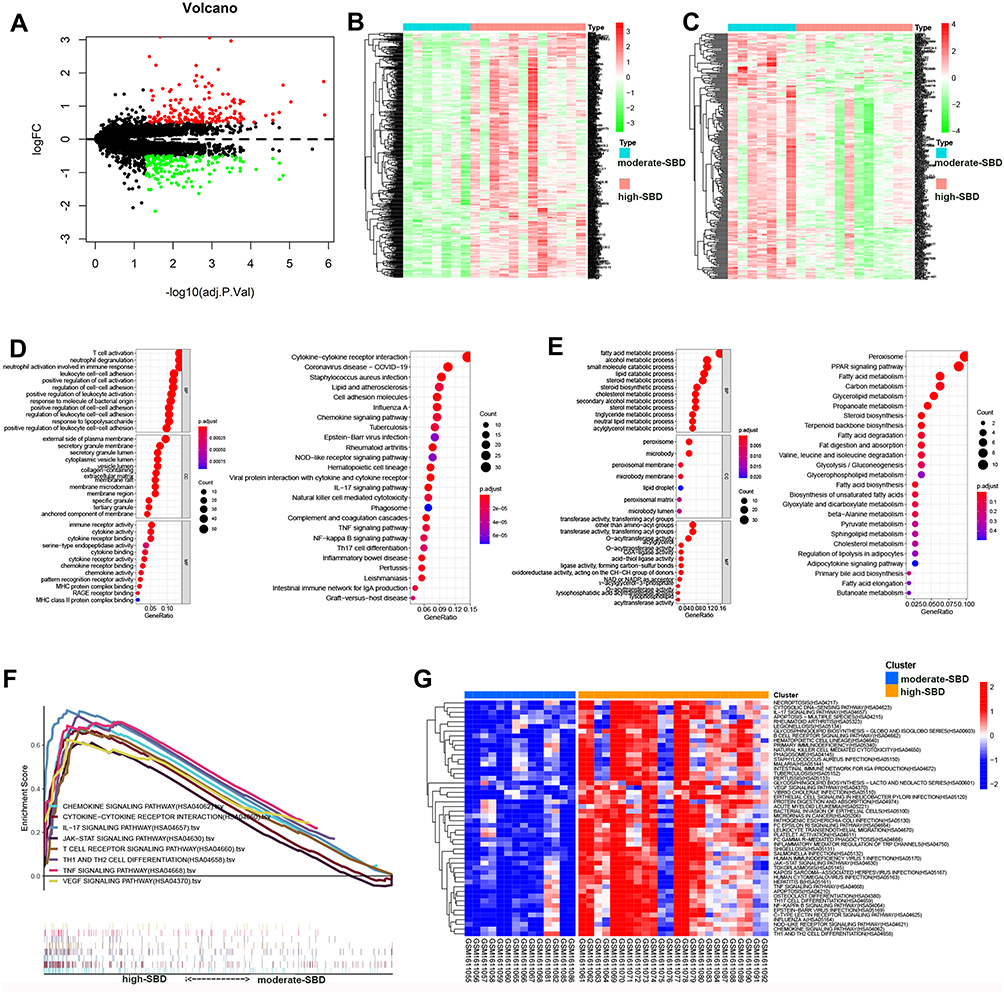 |
Figure 3 SBD patterns-related signal pathway in rosacea. (A) The differently expressed genes between moderate- and high-SBD pattern in rosacea. (B) The heatmap of upregulated DEGs and (C) The heatmap of downregulated DEGs in high-SBD group compared to moderate-SBD group. (D) The GO and KEGG analysis of upregulated DEGs. (E) GO and KEGG analysis of downregulated DEGs. (F) The GSEA analysis of genes from moderate- and high-SBD pattern in rosacea. (G) The GSVA analysis revealed the different pathways in high- SBD pattern compared to moderate-SBD pattern in rosacea. |
Moreover, GSEA analysis also revealed that the SBD pattern was related to cytokine-cytokine receptor interaction, JAK/STAT signaling pathway, chemokine signaling pathway, IL-17 signaling pathway, T cell receptor signaling pathway, Th1 and Th2 cell differentiation, TNF signaling pathway, and VEGF signaling pathway in rosacea (Figure 3F). To further validate the pathways regulated by skin barriers in rosacea, we analyzed pathways in rosacea using GSVA analysis. As shown in Figure 3G, inflammatory- and immune-related signal pathways were enriched in cluster 3 (high-SBD pattern). These results indicated that disturbed skin barriers could be associated with the activation of inflammatory- and immune-related signal pathways.
Disturbed Skin Barrier Associated with Immune Cell Infiltration in Rosacea
Considering the role of immune dysregulation in rosacea, we next analyzed the immune cell infiltration in 38 rosacea and 20 normal samples using Xcell. Compared with the normal controls, there are elevated infiltration of CD4+T cells, CD4+memory T cells, Th2 cells, macrophages M1, macrophages, neutrophils, and pDC in rosacea tissues (Figure 4). Moreover, the infiltration of these cells was gradually increased with the severity of barrier dysfunction in rosacea patients. The immune cells infiltration among ETR, PPR and PHR was described in Figure S2. In view of the important role of immune mechanism in the pathogenesis of rosacea,24,25 this result indicated that the disturbed skin barrier associated with immune cell infiltration in rosacea.
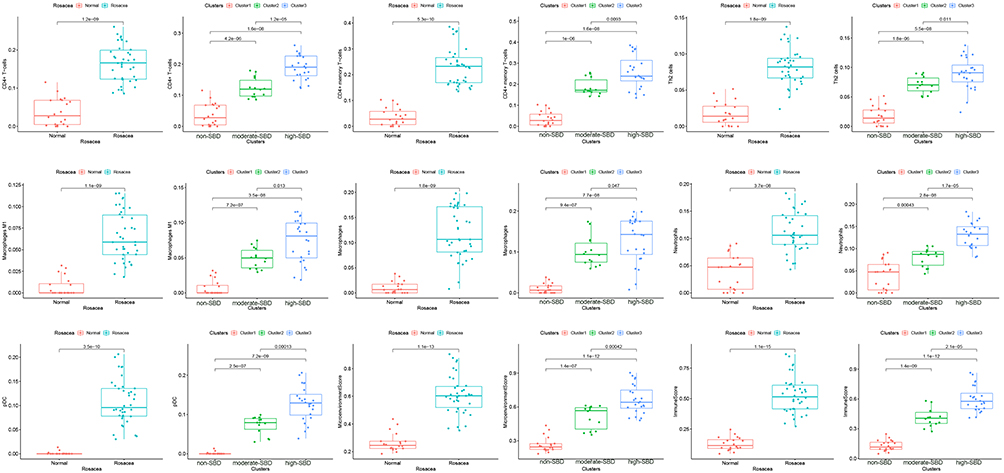 |
Figure 4 The immune cell infiltration in rosacea. |
WGCNA Analysis Identifies Key Modules Associated with Skin Barrier and Immune Infiltration
To reveal the hub network related to SBD patterns and immune cell infiltration in rosacea, WGCNA was performed by using 4045 DEGs between rosacea and normal tissues, and eight modules were identified (Figure 5A and B). The relationship between modules and clinical characters were shown in Figure 5C. The result showed that module greenyellow and lightgreen was positively and the module blue was negatively related with skin barrier cluster with R>0.7 and p<0.01 (Figure 5D). Among these modules, the lightgreen module was the most positively correlated with immune cell infiltration (Figure 5C). Next, 236 lightgreen module-related genes were identified with GS>0.8 and MM>0.8. The GO analysis indicated that these genes were significantly enriched in T cell activation, leukocyte cell adhesion, T cell differentiation (Figure 5E and Table S5). The KEGG analysis revealed the enrichment of JAK-STAT signaling pathway, chemokine signaling pathway, cytokine-cytokine receptor interaction and the cell differentiation related pathways (Figure 5E and Table S6). And then, cytoHubba analysis revealed STAT3, LCK and PTPRC as the hub genes in lightgreen module (Figure 5F). These three genes expression was verified in rosacea and paired normal tissue from Shih’s study26 and Deng’s study.15 Consistent with the results in GSE65914, STAT3 was significantly upregulated in rosacea tissues from Shih’s study and Deng’s study (Figure S3). As STAT3 is a transcript factor that involves biological progression by regulating the expression of its target genes. Next, we predicted the potential function of STAT3 in rosacea by analyzing its related genes using Pearson correlation analysis. Here, we identified 36 genes from lightgreen-module as STAT3-related genes with R>0.5 and p<0.05, and found that these genes were evidently upregulated in rosacea tissue (Figure S4A) and were closely related to SBD patterns (Figure S4B) and were enriched in immune-related signal pathways (Figure S4C–D). Moreover, MODE analysis revealed JAK-STAT signal pathway was a key subnetwork (Figure 5G and Figure S5). Moreover, STAT-pathway is significantly related to the expression of rosacea-related genes, skin barrier-related genes in rosacea (Figure S6). In conclusion, these results indicated that STAT3 and related pathways could play a major role in SBD patterns-related immune infiltration in rosacea.
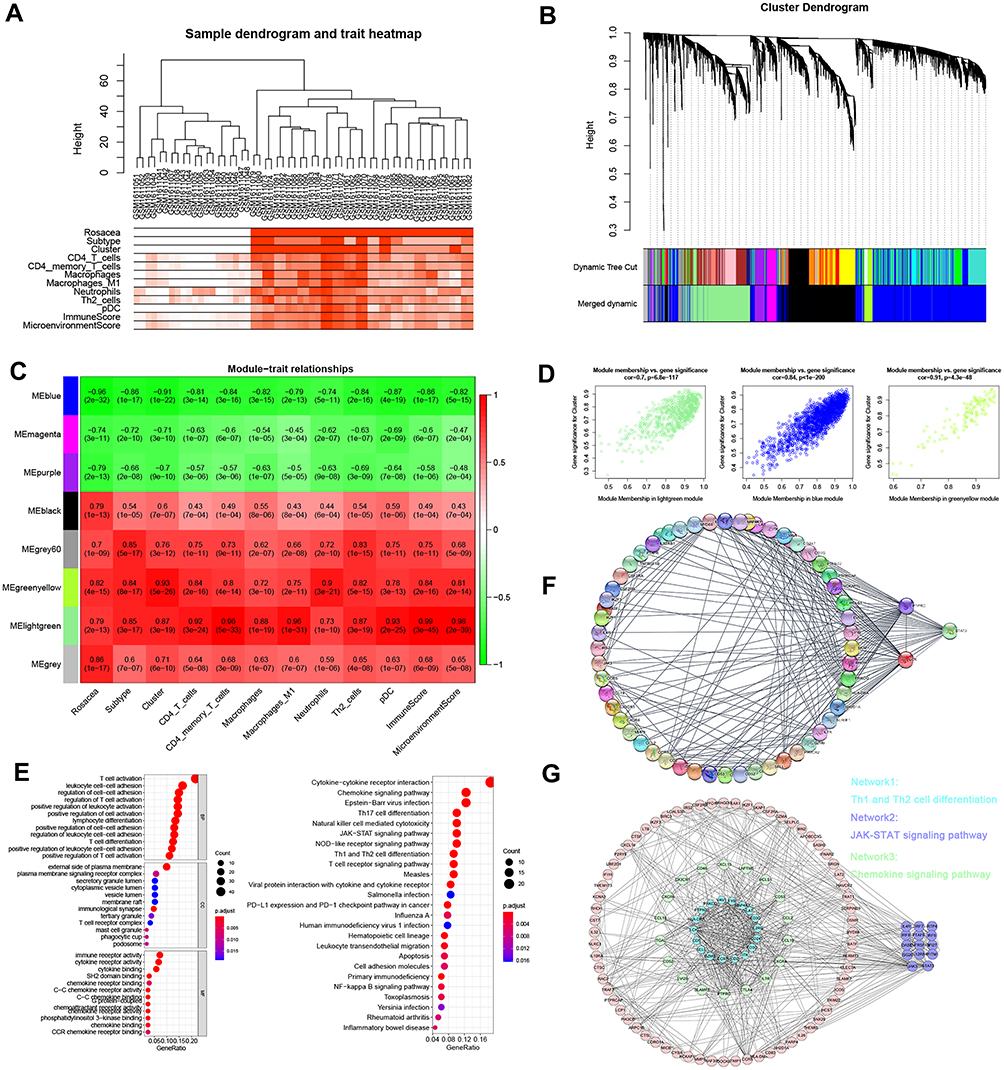 |
Figure 5 WGCNA analysis. (A) Sample clustering associated with clinical characters. (B) The cluster of WGCNA. (C) The relationships between modules and clinical characters. (D) The relationship between GS and MM in the lightgreen, blue and greenyellow modules. (E) GO and KEGG analysis of genes from lightgreen module. (F) The PPI network analysis revealed the hub genes in lightgreen module. (G) MODE analysis revealed JAK-STAT signal pathway was a key subnetwork. |
STAT3-Related to Immune Infiltration in Rosacea
Next, we further verified the potential relationship between STAT3 and immune infiltration in rosacea. As shown in Figure 6A, CD4+ T cells, CD4+ memory T cells, M1_Macrophages, Neutrophils, Th2 cells, pDC were significantly increased in STAT3 high-expression group, compared to the STAT3-low-expression group in rosacea. Person analysis revealed the significant correlation between STAT3 expression and these immune cells (Figure 6B). Consistent with these results, CD4+ T cells, CD4+ memory T cells, M1_Macrophages, Neutrophils, Th2 cells were significantly increased in STAT3-pathway high-score group, compared to STAT3-pathway low-score group in rosacea (Figure 6C). The significant correlation between STAT3/STAT3-pathway and these immune cells was observed in Figure 6D. Considering the important role of cytokine and chemokine on the chemotaxis of immune cells, we further analyzed the relationship between STAT3 and cytokine /chemokine expression and cytokine/chemokine-related signal pathways. 24 lightgreen-module genes were enriched in Cytokine-cytokine receptor interaction, 16 lightgreen-module genes were enriched in the chemokine signaling pathway and 12 key genes were enriched in T cell receptor signaling pathway in lightgreen module (Table S6). As shown in Figure 6E, STAT3 and STAT3-pathway was positively correlated with genes in cytokine-cytokine receptor interaction, chemokine signaling pathway and T cell receptor signaling pathway.
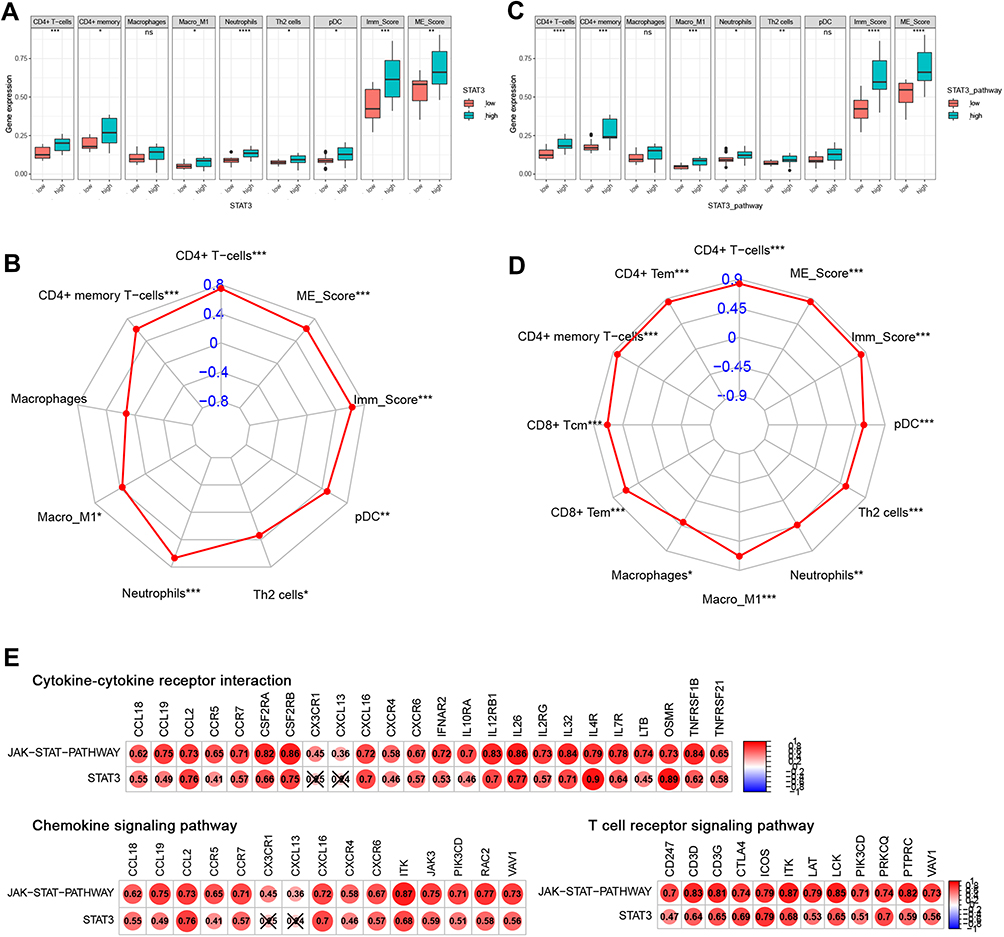 |
Figure 6 STAT3-related to immune infiltration in rosacea. (A) The immune infiltration in STAT3 high/low-expression group. (B) The relationship between STAT3 expression and immune cell infiltration. (C) The immune infiltration in STAT3 signal high/low group. (D) The relationship between STAT3 signal and immune cell infiltration. (E) The relationship between STAT3 and the genes in cytokine/chemokine-related signal pathways and T cell receptor-related signal pathways. Data represent the means ± SD, *P < 0.05, **P < 0.01, ***P < 0.001 and ****P < 0.0001. |
To test above results experimentally, we first detected the expression of STAT3 in skin lesions from the patient with rosacea. We found that the expression of STAT3 in the keratinocyte of epidermis was significantly increased in the rosacea patient, when compared with the normal controls (Figure 7A). Moreover, the epidermis RNA-Seq data of rosacea showed the increased STAT3 in the rosacea group compared to the normal group (Figure 7B). The significant association was observed between STAT3 and SBRGs (Figure 7C), and between STAT3 and cytokine/chemokine genes (Figure 7D) in keratinocytes of rosacea using epidermis RNA-Seq data.
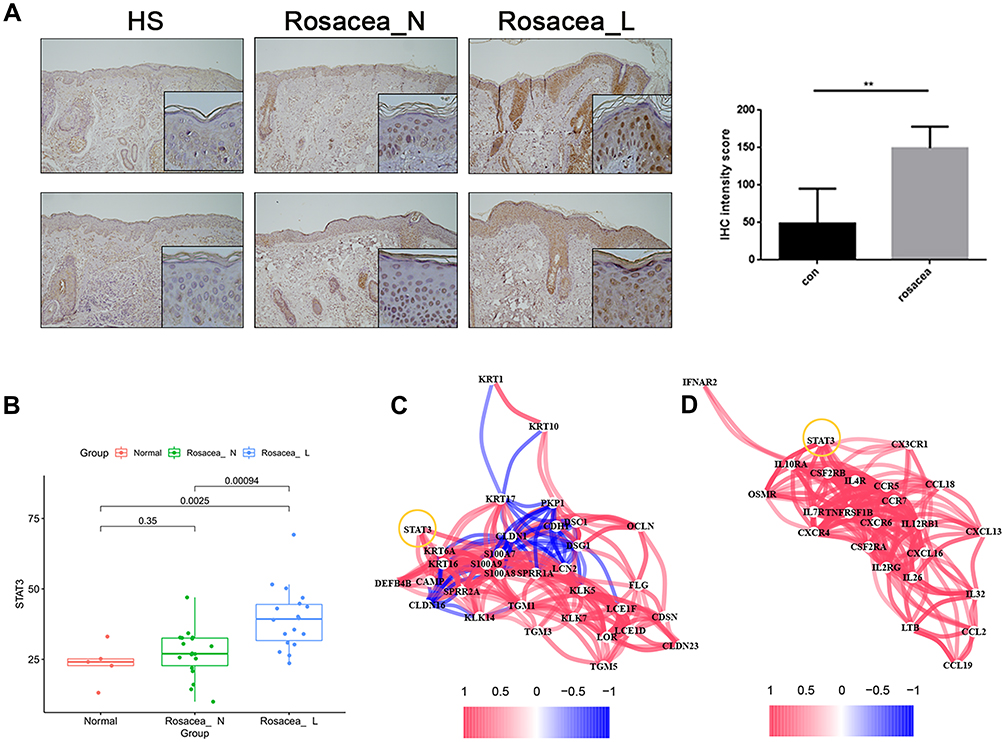 |
Figure 7 Increased STAT3 expression in rosacea. (A) IHC analyzed the expression of STAT3 in rosacea. (B) The epidermis RNA-Seq data of rosacea. (C) The significant correlation between STAT3 and SBRGs. (D) The significant correlation between STAT3 and cytokine/chemokine genes. Data represent the means ± SD, *P < 0.05, **P < 0.01 and ***P < 0.001. |
In conclusion, these results indicated that STAT3 contributed to SBD patterns-related immune infiltration in rosacea partly by regulating cytokine/ chemokine-related signal pathways.
Candidate Drug Screened by Network Pharmacology
Considering the important role of SBD patterns and STAT3 in the progression of rosacea, we used SBD- and STAT3 related genes to predict the candidate drug for rosacea. The top 100 DEGs between the STAT3 high/low group were submitted to CMap for drug prediction and 20 candidate drugs were obtained with the cutoff of |enrichment|>0.7 and P-value < 0.05 (Table S7). The top 100 DEGs between moderate-/high-SBD patterns were submitted to CMap, and 23 candidate drugs against pattern were obtained with the cutoff of |enrichment|>0.7 and P-value < 0.05 (Table S8). 8 drugs, including rottlerin, Prestwick-1103, 5230742, clofibrate, benfluorex, ikarugamycin, puromycin and ivermectin were overlapped in STAT3 group and SBD patterns group (Figure S7). Among of them, Ivermectin, an anti-Demodex folliculorum drug, has a good effect on papules and pustules for rosacea patients.27 Rottlerin, a PKC inhibitor, has antiviral role for La Crosse virus.28 Clofibrate, peroxisome proliferator-activated receptor-alpha (PPARα) agonist, was reported to reduce oxidative stress, improved antioxidant status.29 Ikarugamycin was showed anti antibacterial activity against Intracellular Staphylococcus aureus.30
Skin Barrier Disruption Increased STAT3 Expression and CD4+ T Cell Infiltration in Rosacea
To further verify the relationship between SBD and STAT3 expression, we use tape stripping to construct the skin barrier damage model. After tape stripping, the TEWL was significantly increased, indicating the animal model of skin barrier damage was successfully constructed (Figure 8A). SBD evidently induced STAT3 expression (Figure 8B) and cytokine/chemokines (CCR5, CXCL10, TNFα, IL-1β and IL6) expression (Figure 8C).
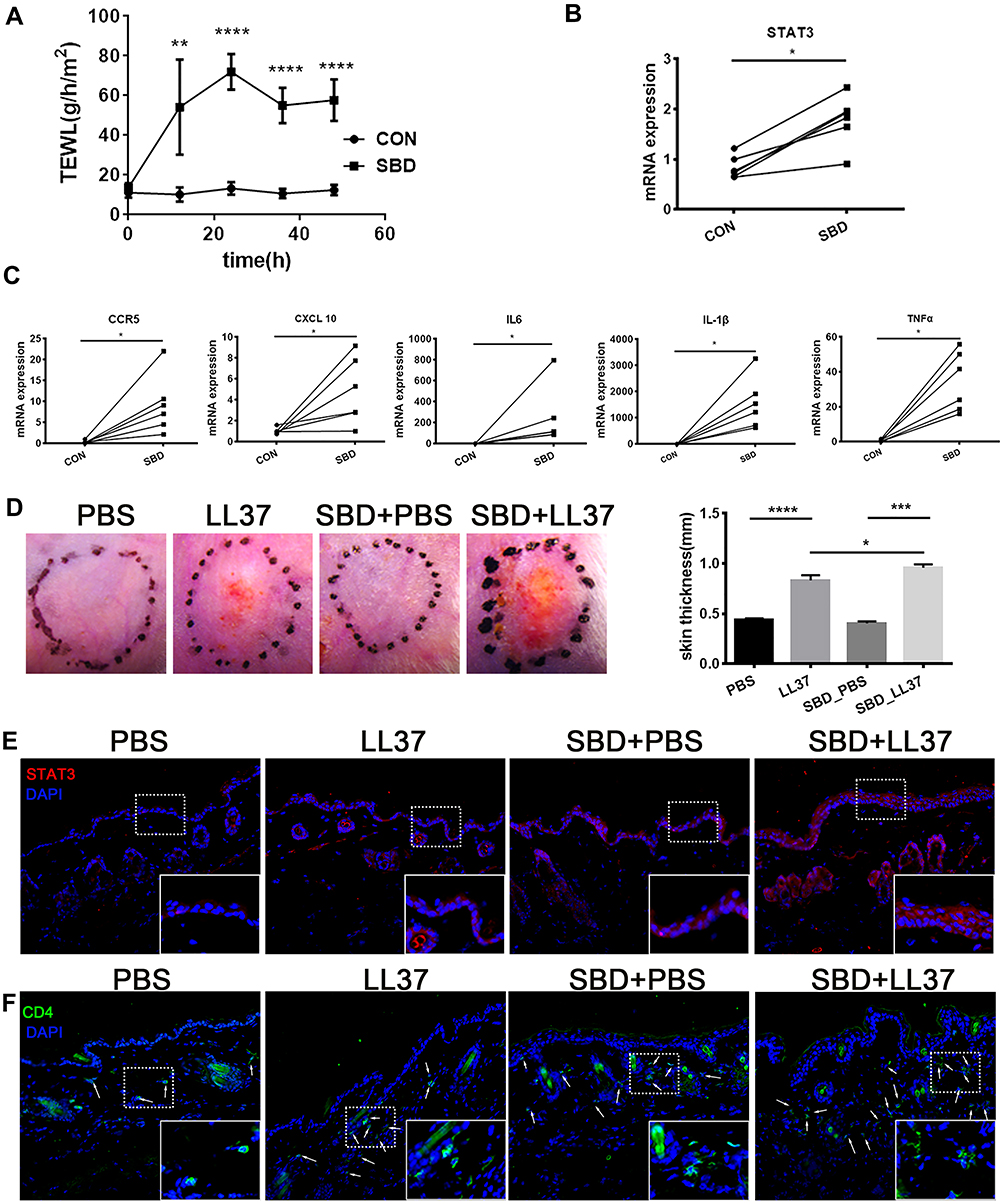 |
Figure 8 STAT3 expression and CD4+ T cell infiltration in skin barrier damage model. BALB/c mice received tape-stripping treatment every 12 hours for a total of 4 times. (A) The TEWL of control and SBD mice. (B) The STAT3 mRNA expression in the whole skin sample. (C) The mRNA expression of CCR5, CXCL10, IL-1β, IL-6 and TNF-α in the whole skin sample. BALB/c mice were treated with tape-stripping combined with LL37. (D) The erythema and the thickness of dorsal skin. (E), The STAT3 expression in control skin and LL37-induced rosacea-like skin lesion. (F) CD4+ T cell infiltration in control skin and LL37-induced rosacea-like skin lesion. Data represent the means ± SD, *P < 0.05, **P < 0.01, ***P < 0.001 and ***P < 0.001. |
To reveal SBD-mediated STAT3 in rosacea, we use tape stripping to simulate skin barrier damage in the rosacea-like mouse model. We found that SBD alone did not cause significant clinical erythema and change of skin thickness, but it significantly induces erythema, skin thickness and inflammatory infiltration in LL37-induced rosacea-like mice (Figure 8D and E). SBD induced STAT3 expression in LL37-induced rosacea-like mice lesion (Figure 8E). Moreover, CD4+ T cells were significantly increased in rosacea-like skin with tap stripping (Figure 8F).
In conclusion, these suggested that skin barrier damage may lead to STAT3-mediated inflammatory factors secretion, resulting in infiltration of immune cells, and ultimately promoting the development of rosacea.
Discussion
Previous studies have described the important role of SBD in the progression of rosacea.31,32 However, the potential mechanism remains elusive. In this study, we identified two SBD patterns in rosacea and revealed the potential mechanism of SBD-induced immune infiltration in rosacea, and predicted 8 candidate drugs for rosacea with high SBD.
Immune disorders play an essential role in the occurrence of rosacea, including increased CD4+ T cells, macrophages, mast cells, B cells, neutrophils and so on22,33,34. Consistent with previous work,35,36 we found that the infiltration of CD4+T cells, DC cells, macrophages, and neutrophils in rosacea lesions are increased in this study. Interestingly, we found that CD4+ memory T cells, Th2 cells, macrophages M1 infiltration are increased in rosacea lesions compared to normal controls. Memory T cells would be quickly activated and take action after being stimulated again. Previous research has shown that the infiltration of CD4+ memory T cells was significantly elevated in psoriatic patients as compared to healthy donors,37 and circulating CCR6+ CD4+ TEM cells were significantly associated with systemic inflammation in psoriasis.38 This means the increase of CD4+ memory T cells in rosacea patients may allow a faster and more inflammatory response after being stimulated again. Previous studies have shown a positive feedback loop between the skin barrier and the immune infiltration that drives the pathology of skin disease. Studies have highlighted the primary pathogenic role of skin barrier deficiency in patients with AD,39 the persistent skin inflammation further induced skin barrier dysfunction.40 In this study, the infiltration of immune cells was evidently increased with the aggravation of SBD, and the skin barrier damage aggravates the rosacea phenotype and increases CD4+ T cell infiltration in rosacea-like model, indicating that the SBD contributed to immune infiltration in rosacea.
JAK/STAT signaling, a key signaling pathway involved in the pathogenesis of skin disease in keratinocytes.41 Recent years, the JAK/STAT pathway inhibitor was reported as an effective therapeutic in psoriasis and AD.42,43 In this study, we found that STAT3 and related signaling were up-regulated in rosacea, and tape stripping-induced skin barrier damage increased STAT3 in keratinocytes of rosacea-like mice. The close relationship between STAT3 and immune infiltration was also observed in this work. STAT3 related cytokines expression was increased with SBD and skin barrier damage, suggesting that STAT3 is a key factor in the skin barrier-immune connection. Based on the significant correlation between STAT3 and cytokines/chemokines in keratinocytes of rosacea lesions, we speculate that the expression of keratinocyte STAT3 is up-regulated after skin barrier dysfunction, leading to the secretion of inflammatory factors and inducing immune infiltration. Previous research has shown the activation of STAT3 will inhibit the expression of skin barrier-related molecules such as FLG, LOR and CLDN,44–47 suggesting that STAT3 regulates skin barrier dysfunction through positive feedback.
Although several treatments, including skin care and cosmetic treatments, topical brimonidine/oxymetazoline, oral doxycycline/Hydroxychloroquine/β-blockers, Laser and intense pulsed light, were used for rosacea therapy, rosacea treatment remains challenging for dermatologists, especially in refractory or recalcitrant cases.48 In this study, we predicted 8 candidate drugs for rosacea using SBD- and STAT3 related genes, offering the promising novel treatment strategies for rosacea.
In conclusion, our results identified two SBD patterns in rosacea and revealed a central role of STAT3 in SBD-immune communication in rosacea and providing novel treatment strategies for rosacea.
Funding
This work was supported by the National Key Research and Development Program of China No.2021YFF1201200. This work was supported by the National Natural Sciences Foundation of Hunan province (2020JJ5950). This work was supported by grants from the National Natural Science Foundation of China (81974480 and 82173448), the Science and Technology Innovation Plan of Hunan province (No. 2018SK2087).
Disclosure
The authors declare that they have no conflicts of interest.
References
1. Gallo RL, Granstein RD, Kang S, et al. Rosacea comorbidities and future research: the 2017 update by the National Rosacea Society Expert Committee. J Am Acad Dermatol. 2018;78:167–170. doi:10.1016/j.jaad.2017.06.150
2. Li J, Wang B, Deng Y. Epidemiological features of rosacea in Changsha, China: a population-based, cross-sectional study. J Dermatol. 2020;47(5):497–502. doi:10.1111/1346-8138.15301
3. Gallo RL, Granstein RD, Kang S, et al. Standard classification and pathophysiology of rosacea: the 2017 update by the National Rosacea Society Expert Committee. J Am Acad Dermatol. 2018;78(1):148–155. doi:10.1016/j.jaad.2017.08.037
4. van Zuuren EJ, Solomon CG. Rosacea. N Engl J Med. 2017;377(18):1754–1764. doi:10.1056/NEJMcp1506630
5. Zuo Z, Wang B, Shen M, et al. Skincare habits and rosacea in 3439 Chinese adolescents: a University-based Cross-sectional Study. Acta Derm Venereol. 2020;100(3):adv00081–adv00085. doi:10.2340/00015555-3442
6. Sandilands A, Sutherland C, Irvine AD, McLean WH. Filaggrin in the frontline: role in skin barrier function and disease. J Cell Sci. 2009;122(9):1285–1294. doi:10.1242/jcs.033969
7. Celebi Sözener Z, Cevhertas L, Nadeau K, Akdis M, Akdis CA. Environmental factors in epithelial barrier dysfunction. J Allergy Clin Immunol. 2020;145(6):1517–1528. doi:10.1016/j.jaci.2020.04.024
8. Dirschka T, Tronnier H, Fölster-Holst R. Epithelial barrier function and atopic diathesis in rosacea and perioral dermatitis. Br J Dermatol. 2004;150(6):1136–1141. doi:10.1111/j.1365-2133.2004.05985.x
9. Ni Raghallaigh S, Bender K, Lacey N, Brennan L, Powell FC. The fatty acid profile of the skin surface lipid layer in papulopustular rosacea. Br J Dermatol. 2012;166(2):279–287. doi:10.1111/j.1365-2133.2011.10662.x
10. Deng Z, Chen M, Xie H, et al. Claudin reduction may relate to an impaired skin barrier in rosacea. J Dermatol. 2019;46(4):314–321. doi:10.1111/1346-8138.14792
11. Medgyesi B, Dajnoki Z, Béke G, et al. Rosacea is characterized by a profoundly diminished skin barrier. J Invest Dermatol. 2020;140(10):1938–1950.e1935. doi:10.1016/j.jid.2020.02.025
12. Ravipati A, Nolan S, Alphonse M, et al. IL-6R/signal transducer and activator of transcription 3 signaling in keratinocytes rather than in T cells induces psoriasis-like dermatitis in mice. J Invest Dermatol. 2021. doi:10.1016/j.jid.2021.09.012
13. Dai X, Utsunomiya R, Shiraishi K, et al. Nuclear IL-33 plays an important role in IL-31‒mediated downregulation of FLG, keratin 1, and keratin 10 by regulating signal transducer and activator of transcription 3 activation in human keratinocytes. J Invest Dermatol. 2021;141(11):2646–2655.e6. doi:10.1016/j.jid.2021.05.033
14. Shih YH, Xu J, Kumar A, Li R, Chang ALS. Alterations of immune and keratinization gene expression in papulopustular rosacea by whole transcriptome analysis. J Invest Dermatol. 2020;140(5):1100–1103.e1104. doi:10.1016/j.jid.2019.09.021
15. Deng Z, Liu F, Chen M, et al. Keratinocyte-immune cell crosstalk in a STAT1-mediated pathway: novel insights into rosacea pathogenesis. Front Immunol. 2021;12:674871). doi:10.3389/fimmu.2021.674871
16. Wilkerson MD, Hayes DN. ConsensusClusterPlus: a class discovery tool with confidence assessments and item tracking. Bioinformatics. 2010;26:1572–1573. doi:10.1093/bioinformatics/btq170
17. Reimand J, Isserlin R, Voisin V, et al. Pathway enrichment analysis and visualization of omics data using g: profiler, GSEA, Cytoscape and EnrichmentMap. Nat Protoc. 2019;14:482–517. doi:10.1038/s41596-018-0103-9
18. Sun H, SY Liu, JY Zhou, et al. Specific TP53 subtype as biomarker for immune checkpoint inhibitors in lung adenocarcinoma. E Bio Med. 2020;60. doi:10.1016/j.ebiom.2020.102990
19. Aran D, Hu Z, Butte AJ. xCell: digitally portraying the tissue cellular heterogeneity landscape. Genome Biol. 2017;18(1):220. doi:10.1186/s13059-017-1349-1
20. Long J, Huang S, Bai Y, et al. Transcriptional landscape of cholangiocarcinoma revealed by weighted gene coexpression network analysis. Brief Bioinform. 2020. doi:10.1093/bib/bbaa224
21. Subramanian A, Narayan R, Corsello SM, et al. A next generation connectivity map: L1000 platform and the first 1,000,000 profiles. Cell. 2017;171(6):1437–1452.e1417. doi:10.1016/j.cell.2017.10.049
22. Yamasaki K, Di Nardo A, Bardan A, et al. Increased serine protease activity and cathelicidin promotes skin inflammation in rosacea. Nat Med. 2007;13:975–980. doi:10.1038/nm1616
23. Varghese F, Bukhari AB, Malhotra R, De A. IHC profiler: an open source plugin for the quantitative evaluation and automated scoring of immunohistochemistry images of human tissue samples. PLoS One. 2014;9:e96801. doi:10.1371/journal.pone.0096801
24. Buhl T, Sulk M, Nowak P, et al. Molecular and morphological characterization of inflammatory infiltrate in rosacea reveals activation of Th1/Th17 pathways. J Invest Dermatol. 2015;135(9):2198–2208. doi:10.1038/jid.2015.141
25. Georgala S, Katoulis AC, Kylafis GD, et al. Increased density of Demodex folliculorum and evidence of delayed hypersensitivity reaction in subjects with papulopustular rosacea. J Eur Acad Dermatol Venereol. 2001;15(5):441–444. doi:10.1046/j.1468-3083.2001.00331.x
26. Shih YH, Xu J, Kumar A, Li R, Chang ALS. Alterations of immune and keratinization gene expression in papulopustular rosacea by whole transcriptome analysis. J Invest Dermatol. 2019;139(5):S170. doi:10.1016/j.jid.2019.09.021
27. Sahni DR, Feldman SR, Taylor SL. Ivermectin 1% (CD5024) for the treatment of rosacea. Expert Opin Pharmacother. 2018;19(5):511–516. doi:10.1080/14656566.2018.1447562
28. Ojha D, Winkler CW, Leung JM, et al. Rottlerin inhibits La Crosse virus-induced encephalitis in mice and blocks release of replicating virus from the Golgi body in neurons. Nat Microbiol. 2021;6(11):1398–1409. doi:10.1038/s41564-021-00968-y
29. Oyagbemi AA, Adejumobi OA, Jarikre TA, et al. Clofibrate, a Peroxisome Proliferator-Activated Receptor-Alpha (PPARα) agonist, and its molecular mechanisms of action against sodium fluoride-induced toxicity. Biol Trace Elem Res. 2022;200(3):1220–1236. doi:10.1007/s12011-021-02722-1
30. Saeed SI, Aklilu E, Mohammedsalih KM, et al. Antibacterial activity of ikarugamycin against intracellular staphylococcus aureus in bovine mammary epithelial cells in vitro infection model. Biology. 2021;10(10):958. doi:10.3390/biology10100958
31. Darlenski R, Kazandjieva J, Tsankov N, Fluhr JW. Acute irritant threshold correlates with barrier function, skin hydration and contact hypersensitivity in atopic dermatitis and rosacea. Exp Dermatol. 2013;22(1):752–753. doi:10.1111/exd.12251
32. Powell FC, Ni Raghallaigh S. Interventions for ‘rosacea’. Br J Dermatol. 2011;165(4):707–708. doi:10.1111/j.1365-2133.2011.10590.x
33. Yamasaki K, Kanada K, Macleod DT, et al. TLR2 expression is increased in rosacea and stimulates enhanced serine protease production by keratinocytes. J Invest Dermatol. 2011;131(3):688–697. doi:10.1038/jid.2010.351
34. Gomaa AH, Yaar M, Eyada MM, Bhawan J. Lymphangiogenesis and angiogenesis in non-phymatous rosacea. J Cutan Pathol. 2007;34(10):748–753. doi:10.1111/j.1600-0560.2006.00695.x
35. Dajnoki Z, Béke G, Kapitány A, et al. Sebaceous gland-rich skin is characterized by TSLP expression and distinct immune surveillance which is disturbed in rosacea. J Invest Dermatol. 2017;137(5):1114–1125. doi:10.1016/j.jid.2016.12.025
36. Buddenkotte J, Steinhoff M. Recent advances in understanding and managing rosacea. F1000Res. 2018;7:1885. doi:10.12688/f1000research.16537.1
37. Abul H, Mahmoud F, Al-Saleh Q, Khajeji M, Haines D. Profiles of activated T lymphocytes in peripheral blood of Kuwaiti psoriasis vulgaris patients. J Dermatol. 2002;29(4):202–208. doi:10.1111/j.1346-8138.2002.tb00250.x
38. Diani M, Galasso M, Cozzi C, et al. Blood to skin recirculation of CD4 (+) memory T cells associates with cutaneous and systemic manifestations of psoriatic disease. Clin Immunol. 2017;180:84–94. doi:10.1016/j.clim.2017.04.001
39. Han H, Roan F, Ziegler SF. The atopic march: current insights into skin barrier dysfunction and epithelial cell-derived cytokines. Immunol Rev. 2017;278(1):116–130. doi:10.1111/imr.12546
40. Oyoshi MK, Larson RP, Ziegler SF, Geha RS. Mechanical injury polarizes skin dendritic cells to elicit a T (H) 2 response by inducing cutaneous thymic stromal lymphopoietin expression. J Allergy Clin Immunol. 2010;126(5):976–984. doi:10.1016/j.jaci.2010.08.041
41. Sun S, Zhang X, Xu M, et al. Berberine downregulates CDC6 and inhibits proliferation via targeting JAK-STAT3 signaling in keratinocytes. Cell Death Dis. 2019;10:274. doi:10.1038/s41419-019-1510-8
42. Fridman JS, Scherle PA, Collins R, et al. Preclinical evaluation of local JAK1 and JAK2 inhibition in cutaneous inflammation. J Invest Dermatol. 2011;131(9):1838–1844. doi:10.1038/jid.2011.140
43. Schwartz DM, Kanno Y, Villarino A, et al. JAK inhibition as a therapeutic strategy for immune and inflammatory diseases. Nat Rev Drug Discov. 2017;16(12):843–862. doi:10.1038/nrd.2017.201
44. Tsuji G, Hashimoto-Hachiya A, Kiyomatsu-Oda M, et al. Aryl hydrocarbon receptor activation restores filaggrin expression via OVOL1 in atopic dermatitis. Cell Death Dis. 2017;8:e2931–e2931. doi:10.1038/cddis.2017.322
45. Hashimoto-Hachiya A, Tsuji G, Murai M, Yan X, Furue M. Upregulation of FLG, LOR, and IVL expression by rhodiola crenulata root extract via aryl hydrocarbon receptor: differential involvement of OVOL1. Int J Mol Sci. 2018;19. doi:10.3390/ijms19061654
46. Tsuji G, Ito T, Chiba T, et al. The role of the OVOL1-OVOL2 axis in normal and diseased human skin. J Dermatol Sci. 2018;90(3):227–231. doi:10.1016/j.jdermsci.2018.02.005
47. Ryu WI, Lee H, Bae HC, et al. IL-33 down-regulates CLDN1 expression through the ERK/STAT3 pathway in keratinocytes. J Dermatol Sci. 2018;90(3):313–322. doi:10.1016/j.jdermsci.2018.02.017
48. Zhang H, Tang K, Wang Y, Fang R, Sun Q. Rosacea treatment: review and update. Dermatol Ther. 2021;11:13–24. doi:10.1007/s13555-020-00461-0
 © 2022 The Author(s). This work is published and licensed by Dove Medical Press Limited. The full terms of this license are available at https://www.dovepress.com/terms.php and incorporate the Creative Commons Attribution - Non Commercial (unported, v3.0) License.
By accessing the work you hereby accept the Terms. Non-commercial uses of the work are permitted without any further permission from Dove Medical Press Limited, provided the work is properly attributed. For permission for commercial use of this work, please see paragraphs 4.2 and 5 of our Terms.
© 2022 The Author(s). This work is published and licensed by Dove Medical Press Limited. The full terms of this license are available at https://www.dovepress.com/terms.php and incorporate the Creative Commons Attribution - Non Commercial (unported, v3.0) License.
By accessing the work you hereby accept the Terms. Non-commercial uses of the work are permitted without any further permission from Dove Medical Press Limited, provided the work is properly attributed. For permission for commercial use of this work, please see paragraphs 4.2 and 5 of our Terms.