")
Back to Journals » Nature and Science of Sleep » Volume 13
Multi-Night Validation of a Sleep Tracking Ring in Adolescents Compared with a Research Actigraph and Polysomnography
Authors Chee NIYN, Ghorbani S, Golkashani HA , Leong RLF, Ong JL , Chee MWL
Received 10 October 2020
Accepted for publication 19 December 2020
Published 15 February 2021 Volume 2021:13 Pages 177—190
DOI https://doi.org/10.2147/NSS.S286070
Checked for plagiarism Yes
Review by Single anonymous peer review
Peer reviewer comments 2
Editor who approved publication: Dr Steven A Shea
Nicholas IYN Chee,* Shohreh Ghorbani,* Hosein Aghayan Golkashani, Ruth LF Leong, Ju Lynn Ong, Michael WL Chee
Centre for Sleep and Cognition, Yong Loo Lin School of Medicine, National University of Singapore, Singapore
*These authors contributed equally to this work
Correspondence: Michael WL Chee
Centre for Sleep and Cognition, Yong Loo Lin School of Medicine, MD1 Level 13 Rm 05B, National University of Singapore, 117549, Singapore
Tel +65 66013199
Email [email protected]
Background: Wearable devices have tremendous potential for large-scale longitudinal measurement of sleep, but their accuracy needs to be validated. We compared the performance of the multisensor Oura ring (Oura Health Oy, Oulu, Finland) to polysomnography (PSG) and a research actigraph in healthy adolescents.
Methods: Fifty-three adolescents (28 females; aged 15– 19 years) underwent overnight PSG monitoring while wearing both an Oura ring and Actiwatch 2 (Philips Respironics, USA). Measurements were made over multiple nights and across three levels of sleep opportunity (5 nights with either 6.5 or 8h, and 3 nights with 9h). Actiwatch data at two sensitivity settings were analyzed. Discrepancies in estimated sleep measures as well as sleep-wake, and sleep stage agreements were evaluated using Bland–Altman plots and epoch-by-epoch (EBE) analyses.
Results: Compared with PSG, Oura consistently underestimated TST by an average of 32.8 to 47.3 minutes (Ps < 0.001) across the different TIB conditions; Actiwatch 2 at its default setting underestimated TST by 25.8 to 33.9 minutes. Oura significantly overestimated WASO by an average of 30.7 to 46.3 minutes. It was comparable to Actiwatch 2 at default sensitivity in the 6.5, and 8h TIB conditions. Relative to PSG, Oura significantly underestimated REM sleep (12.8 to 19.5 minutes) and light sleep (51.1 to 81.2 minutes) but overestimated N3 by 31.5 to 46.8 minutes (Ps < 0.01). EBE analyses demonstrated excellent sleep-wake accuracies, specificities, and sensitivities – between 0.88 and 0.89 across all TIBs.
Conclusion: The Oura ring yielded comparable sleep measurement to research grade actigraphy at the latter’s default settings. Sleep staging needs improvement. However, the device appears adequate for characterizing the effect of sleep duration manipulation on adolescent sleep macro-architecture.
Keywords: validation, adolescents, wearable, polysomnography, actigraphy
Introduction
Polysomnography (PSG), the reference standard for measuring sleep in clinical settings requires the engagement of trained staff, is time-consuming to conduct and score, making it expensive. It is thus less well suited for the characterization of sleep patterns studied over multiple nights outside a laboratory.
Actigraphy is a well-accepted means of gathering population sleep data for such purposes having been refined since its introduction in the 1970s.1–4 It has been validated against PSG in both healthy and clinical populations, across a range of age groups.1,5 Actigraphy shows good sensitivity in detecting sleep, but it has lower specificity in detecting periods of wakefulness, misclassifying periods when one is awake but motionless as sleep.6,7 For individuals such as older adults who are more likely to have such periods while they are in bed, actigraphy tends to overestimate sleep.8 At the other end of the age spectrum, children and adolescents tend to move more during their sleep, resulting in underestimation of sleep duration.9–12
Most consumer wearables used to track sleep started as fitness trackers used to monitor daytime activity levels using accelerometry. Manufacturers soon realized that with minor adaptations, their devices could mimic the function of far more expensive research actigraphs. For a variety of reasons, early products demonstrated mixed performance when measuring sleep compared to research-grade devices.9,13–16
Recent models of consumer sleep trackers use multiple sensors to collect physiological data in order to overcome limitations of motion-based sleep detection. For example, the inclusion of photoplethysmography (PPG) to measure heart rate (HR) and heart rate variability (HRV) has improved sleep-wake detection and has been used to facilitate sleep staging.15,17 Additionally, these wearables are integrated with smartphone applications, offering convenient collection, display and trend analysis of sleep as well as remote monitoring of participants. Coupled with the rapid growth in adoption by consumers, this has resulted in the generation of unprecedented amounts of low-cost sleep data.18 Such data can be used to determine the extent to which habitual sleep behaviour modulates health and wellbeing for the formulation of a next generation of sleep behaviour guidelines and interventions. However, before this takes place it is vital that the sleep measures they gather are validated against trusted measurements of sleep.
The Oura ring (Oura, Oulu, Finland) incorporates a triaxial accelerometer and gyroscope for physical activity tracking, two infrared LED (light-emitting diode) photoplethysmographs for optical pulse measurements and a temperature sensor in a waterproof 4-gram package. Previous validation studies involving the Oura ring showed that it performs comparably with research-grade actigraphs, over single nights of study in predominantly Caucasian participants.19,20 As prior work suggests that age, BMI, biological sex, skin tone and hair follicle density are important factors when it comes to accuracy and generalizability of wearable studies based on HR and motion sensors, it is important to consider these factors and assess replicability in an East Asian sample.21,22
To evaluate the suitability of Oura ring as a tool for the large-scale longitudinal assessment of sleep we assessed its accuracy in sleep-wake determination and sleep-stage classification compared to PSG in healthy East Asian adolescents. We were also interested in whether the temporal pattern of ring data would concur with that obtained from PSG. Alongside, we compared the Oura ring with a research-grade actigraph (Actiwatch 2, Philips Respironics Inc., Pittsburgh, PA), under two different sensitivity settings of the latter. While previous findings have shown that the adoption of a lower sensitivity setting with the Actiwatch 2 resulted in greater correspondence with PSG in an adolescent population,23 a comparison with the default setting remains relevant as it remains the most widely adopted setting for use with adult populations. Additionally, adults are the primary users of the Oura ring and thus a comparison with the default setting of the Actiwatch 2 may provide useful insights. To ascertain the consistency of measurements under controlled settings, we collected data on multiple nights of sleep per participant and across three levels of sleep opportunity (6.5, 8 and 9h). We conducted our evaluations in accordance to recent device validation guidelines.17
Methods
Participants
Fifty-nine healthy adolescents (29 males and 30 females) aged between 15 and 19 years old participated in a study on the effect of two different sleep schedules on cognitive performance.24 All participants were screened for sleep disorders and pre-existing medical conditions prior to the study, had body mass index (BMI) of less than 30 kg/m2 and did not smoke.
Study Protocol
Full details of the study protocol are described in our prior work.24 While this protocol was designed primarily to compare cognitive functions of adolescents under different sleep schedules, the experimental conditions, with standardization and verification of bed and wake time of subjects over the course of the entire protocol made it ideal for the comparison and validation of sleep devices against PSG. In brief, the study was conducted over 15 days in a semi-laboratory condition at a boarding school’s dormitory. Participants were randomized into Split (shortened nocturnal sleep plus daytime nap) and Continuous (nocturnal sleep only) sleep schedule groups. Both groups had one 9h TIB adaptation night and one 9h baseline night (B2) prior to any sleep manipulation. Following this, the Split sleep group underwent five manipulation days (M11-M15) with 6.5h nocturnal TIB plus 1.5h nap TIB while the Continuous sleep group received 8h nocturnal TIB without any daytime nap opportunity. Both groups then underwent two recovery 9h TIB nights (R11-R12), before undergoing another cycle of three manipulation (M21-M23) and two 9h TIB recovery (R21-R22) nights. 6.5h and 8.5h TIB nights took place from 00:15 to 06:45 and 23:30 to 07:30, respectively, while 1.5h TIB naps took place from 14:00 to 15:30. Six participants withdrew during the study, resulting in the final sample of 29, and 24 in the Continuous and Split sleep groups, respectively (Refer to protocol figure in Supplementary Figure 1).
Participants’ sleep was monitored using the Oura ring and wrist-worn Actiwatch during all nights of the protocol, while polysomnography data analysed in the present study were concurrently recorded on eight nights: 3 nights of 9h nocturnal sleep (B2, R11 and R21), and 5 nights of manipulation (M11, M13, M15, M21, M23).
The Institutional Review Board of the National University of Singapore approved the study and our protocol was in accordance with the principles in the Declaration of Helsinki. Informed written consent was obtained from participants and their legal guardians during the briefing sessions on the study procedures and objectives. They were also informed of their right to withdraw from the study at any time.
Polysomnography
Polysomnography (PSG) was performed using the SOMNOtouch device (SOMNOmedics GmbH, Randersacker, Germany). Electroencephalography was recorded from two main channels (C3 and C4 in the international 10–20 system of electrode placement) referenced to the contralateral mastoids. The common ground and reference electrode were placed at Fpz and Cz, respectively. Electrooculography (EOG; right and left outer canthi) and submental electromyography (EMG) were also recorded for sleep stage classification. EEG signals were sampled at 256 Hz and impedance was kept at less than 5KΩ for EEG and below 10KΩ for EOG and EMG channels.
Data was autoscored with the updated version of Z3Score algorithm (https://z3score.com), which has been previously validated and shown to be on par with expert scorers;25 along with the FASST EEG toolbox (http://www.montefiore.ulg.ac.be/~phillips/FASST.html), and visually inspected by trained technicians who were blinded to the Oura ring and actigraphic records. Scoring of the sleep was performed based on the American Academy of Sleep Medicine Manual (AASM). WASO, REM sleep, N1, N2 and N3 were calculated based on 30-second epochs according to the AASM manual criteria.26
Oura Ring
Participants wore an Oura ring throughout the protocol on whichever finger on either hand that they could achieve the best fit with the sizes available. Prior to the commencement of the study, ring sizes of participants were obtained for all fingers, from which a ratio of appropriate ring sizes for this population group was established. This allowed for the procurement of a range of ring sizes that maximised for both good fit and reusability in future studies. The Oura ring measures sleep based on heart rate variability and motion using plethysmography and an accelerometer. App version 2.7.4 of the Oura App and firmware version 1.36.3 for the Oura ring were used throughout the duration of this study. Technicians ensured the participants wore the rings properly by checking the rings worn by the participants throughout the day and at bedtime, and ensured the ring and Oura mobile app were connected the following day to upload the data. Thirty second epoch by epoch data was obtained from Oura’s cloud. The Oura ring classifies sleep epochs into four categories of sleep: wake, light, deep, and REM sleep. As the ring does not record N1 and N2 stages separately, PSG N1 and N2 epochs were summed to correspond with Oura’s light sleep stage, while PSG N3 epochs were compared with Oura’s deep sleep stage.27 TST in both Oura and PSG records were defined as the summation of light sleep (PSG stages N1 and N2), deep sleep (PSG stage N3) and REM sleep. For both Oura and PSG, sleep onset was defined as the first epoch of sleep, regardless of stage.
To ensure accurate PSG-device synchronization, all device time stamps were synchronized with an Internet Time Server. Based on lights-off/on timings logged by research assistants each night, data from all devices were truncated to match this sleep period. Wake epochs were added to the Oura data if sleep duration was shorter (Oura-determined bedtime was after actual lights-off timing or Oura-determined waketime was before actual lights-on timing), and removed if sleep duration was longer (Oura-determined bedtime was before actual lights-off timing or Oura-determined waketime was after actual lights-on timing).
Actigraphy
Participants wore the Actiwatch (AW2) on the non-dominant wrist throughout the 15-day protocol, in addition to a one-week period before the study to ensure compliance with the stipulated 9h sleep schedule. Actiwatch data were collected in 30-second epochs and scored using the Actiware software (version 6.0.9, Philips Respironics Inc, Pittsburgh, Pennsylvania). Two wake thresholds and immobility settings were applied for actigraphy data processing. The default M10 setting uses a medium wake threshold with 40 counts per epoch with 10 immobile minutes for sleep onset and termination. In addition, given the reported increased movement during sleep in adolescents28 and our own findings that actigraphy analysis with a lower sensitivity to motion improved accuracy of sleep classification in adolescents,23 we also employed the H5 setting. This had a higher wake threshold of 80 counts per epoch and 5 immobility minutes for sleep onset and termination. For both settings, total sleep time (TST) was calculated as the summation of sleep epochs within the designated sleep periods, and wake after sleep onset (WASO) as the summation of wake epochs between sleep onset and end.
Data Analysis (Sleep-Wake Classification)
Analyses of Measurement Biases
SPSS 25.0 (IBM Corp., Armonk, New York) and MATLAB version R2017b (The Math Works, Inc., Natick, MA) was used to preprocess data and run statistical analyses. As subjects underwent 2 of 3 different TIB conditions (6.5, 8, and 9 h), we first employed a repeated measures ANOVA with the within-subjects factors of night and device setting (M10, H5, Oura) within each TIB condition to investigate whether the observed biases (mean difference) from PSG in the estimated TST and WASO varied across the measurement nights. We did not find a significant device setting by night interaction (p > 0.1), indicating similar discrepancies from the gold standard throughout the protocol nights. Given this finding, we used the intrasubject averaged data across nights within each TIB condition in subsequent analyses. We also examined the effects of sex and BMI on the bias in TST estimates, performing separate 2×3 mixed ANOVAs with sex, and BMI group as between-subjects, and device as within-subject factors in each TIB condition.
Next, we explored if biases in the estimated TST and WASO measured by actigraphy (M10 and H5 settings) and the Oura ring were significant using one-sample t-tests against zero. A negative bias represents underestimation by the device compared to gold-standard PSG and vice versa. Furthermore, to compare biases of different devices we employed separate repeated measures analysis of variance (ANOVA) within each TIB condition for TST and WASO with device setting (M10, H5, Oura) as a within-subjects factor, followed by post-hoc t-tests. Resulting p-values were adjusted for multiple comparisons using the Bonferroni correction (multiplied by 3 to account for comparisons across the three devices), and then compared with selected significance levels (p<0.05, p<0.01, p<0.001). Bland–Altman plots were also generated for each TIB condition to visualize the level of agreement between PSG and equivalent sleep measures for each device setting. We used simple linear regression to explore proportional biases and determine if the duration of estimated TST and WASO for each device setting would predict the bias magnitude in each TIB condition.
Epoch by Epoch Analysis
To further evaluate the ability of devices to accurately classify sleep and wake epochs, we calculated the following agreement measures on 30-second epoch data using the following equations within each TIB condition:
Sleep sensitivity: True sleep/(False Wake + True Sleep)
Wake specificity: True wake/(True Wake + False Sleep)
Accuracy: (True Sleep + True Wake)/(True Sleep + False Wake + True Wake + False Sleep)
Sensitivity, specificity and accuracy values were first calculated for each participant, and then averaged together within each TIB condition. In addition, we also computed a multi-class version of Cohen’s kappa coefficient based on the confusion matrix of sleep stages, as a measure of how well the classifier performs beyond random chance. Kappa values were computed for each subject’s confusion matrix and then averaged together within the respective TIB condition. Kappa values ≤ 0 indicate no agreement, 0.01–0.20 slight agreement, 0.41–0.60 moderate agreement, 0.61–0.80 substantial agreement, and 0.81–1.00 almost perfect agreement.29
Data Analysis (Sleep-Stage Classification)
As the Oura ring additionally outputs sleep stage measurements in 30-second epochs, similar Bland–Altman and epoch-by-epoch analyses conducted for sleep-wake classification were performed to assess the agreement in sleep staging between the Oura ring and PSG, for each sleep stage duration output by Oura (light, deep, and REM sleep).
Replication of Prior PSG Findings with the Oura Ring
Although a device may show systematic biases (eg, overestimation or underestimation) compared to the reference measure, it remains useful if it is able to identify key trends in the data. Since we recorded from multiple nights for each subject, we sought to identify if the Oura ring could similarly identify differences in sleep architecture between experimental groups previously documented with PSG.24
Results
Of the original 59 participants at the start of the study protocol, 53 contributed to the final sample. Two participants withdrew from the study before the experiment and four withdrew within three days after commencement of the experiment. Due to technical issues, 27 PSG recordings, 27 Oura recordings and 13 Actiwatch recordings were excluded from the analysis. PSG recordings were excluded either due to device failures resulting in early termination of recordings or insufficient data quality for sleep staging due to electrodes falling off during the night. Excluded Oura recordings were due to missing sleep stage data on some nights (although sleep times were recorded) - likely as a result of poor ring fit or movement during the night that prevented proper PPG recording. Excluded Actiwatch recordings were due to data corruption, which resulted in complete loss of data for the data collection period. Actiwatches from a pool of over 130 devices were constantly rotated between use throughout the protocol to minimize this possibility.Critically, these missing recordings occurred randomly. In addition, the device recordings from 2 participants for one night was excluded due to non-compliance with study protocol. PSG-determined sleep architecture for the final sample is listed in Table 1.
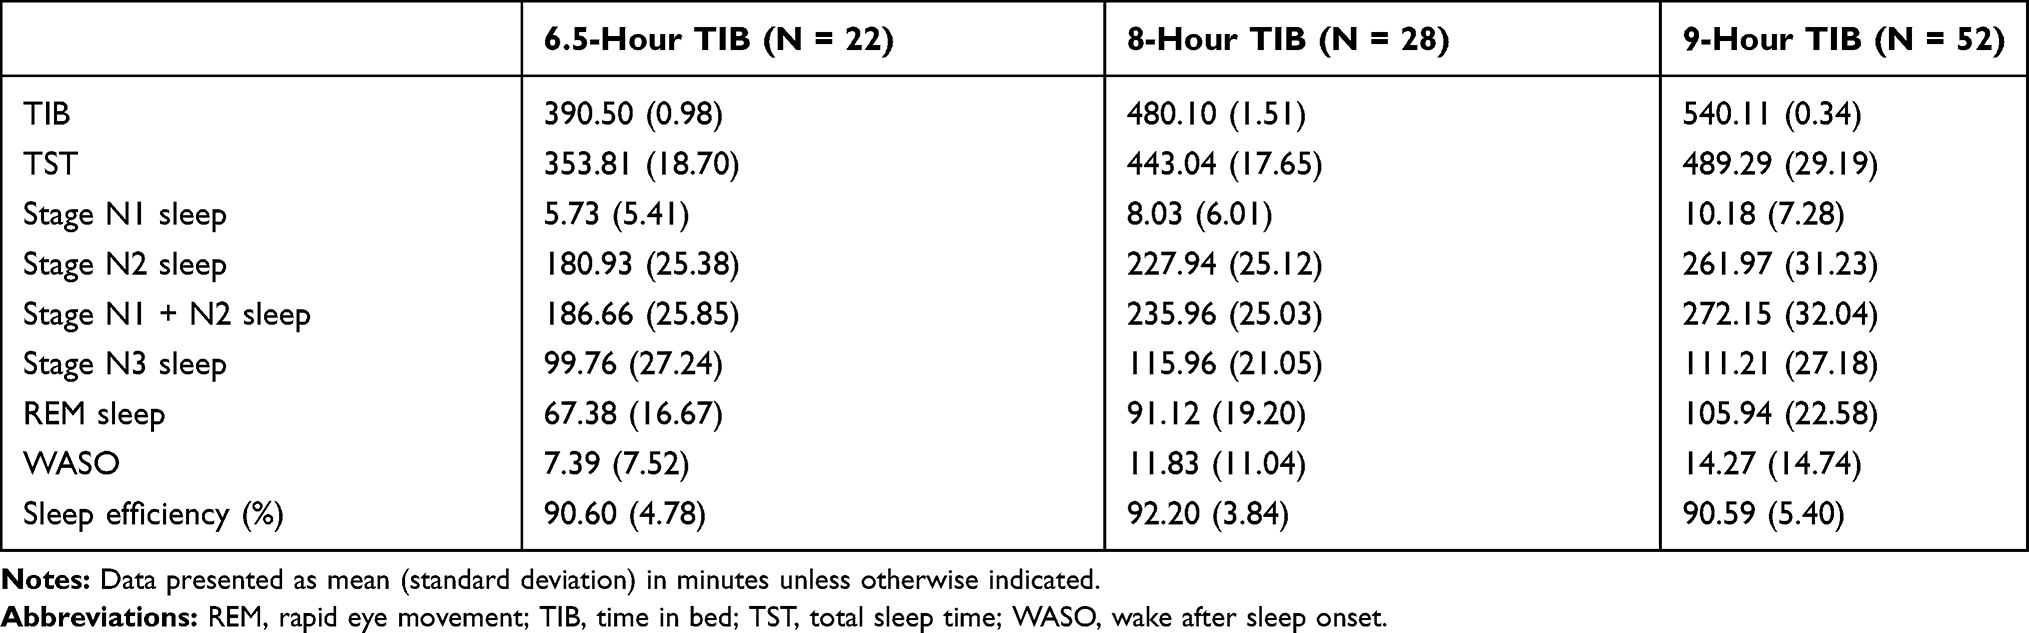 |
Table 1 Polysomnography-Determined Sleep Architecture |
Oura Ring Compared with PSG
The Oura ring underestimated TST and overestimated WASO. Oura significantly underestimated TST by an average of 32.8 to 47.3 minutes (ts ≥ 9.02, Ps < 0.001, Cohen’s ds ≥ 1.92), and overestimated WASO by an average of 30.7 to 46.3 minutes across the different TIB conditions (ts ≥ 8.82, Ps < 0.001, Cohen’s ds ≥ 1.87, Table 2). Compared to PSG, Oura significantly underestimated REM sleep and light sleep (stage N1+N2), and overestimated time spent in deep sleep (stage N3) consistently across all TIB conditions. REM sleep was underestimated by an average of 12.8 to 19.5 minutes (ts ≥ 3.01, Ps < 0.01, Cohen’s ds ≥ 0.44). Bias magnitudes were significantly larger for light, and deep sleep with an average of 51.1 to 81.2 minutes of underestimation (ts ≥ 8.47, Ps < 0.001, Cohen’s ds ≥ 1.81), and 31.5 to 46.8 minutes of overestimation, respectively (ts ≥ 4.18, Ps < 0.001, Cohen’s ds ≥ 0.89, Table 2). Bland–Altman plots demonstrating device setting-PSG biases for TST, WASO, and sleep-stage analyses are presented in Figures 1 and 2, respectively.
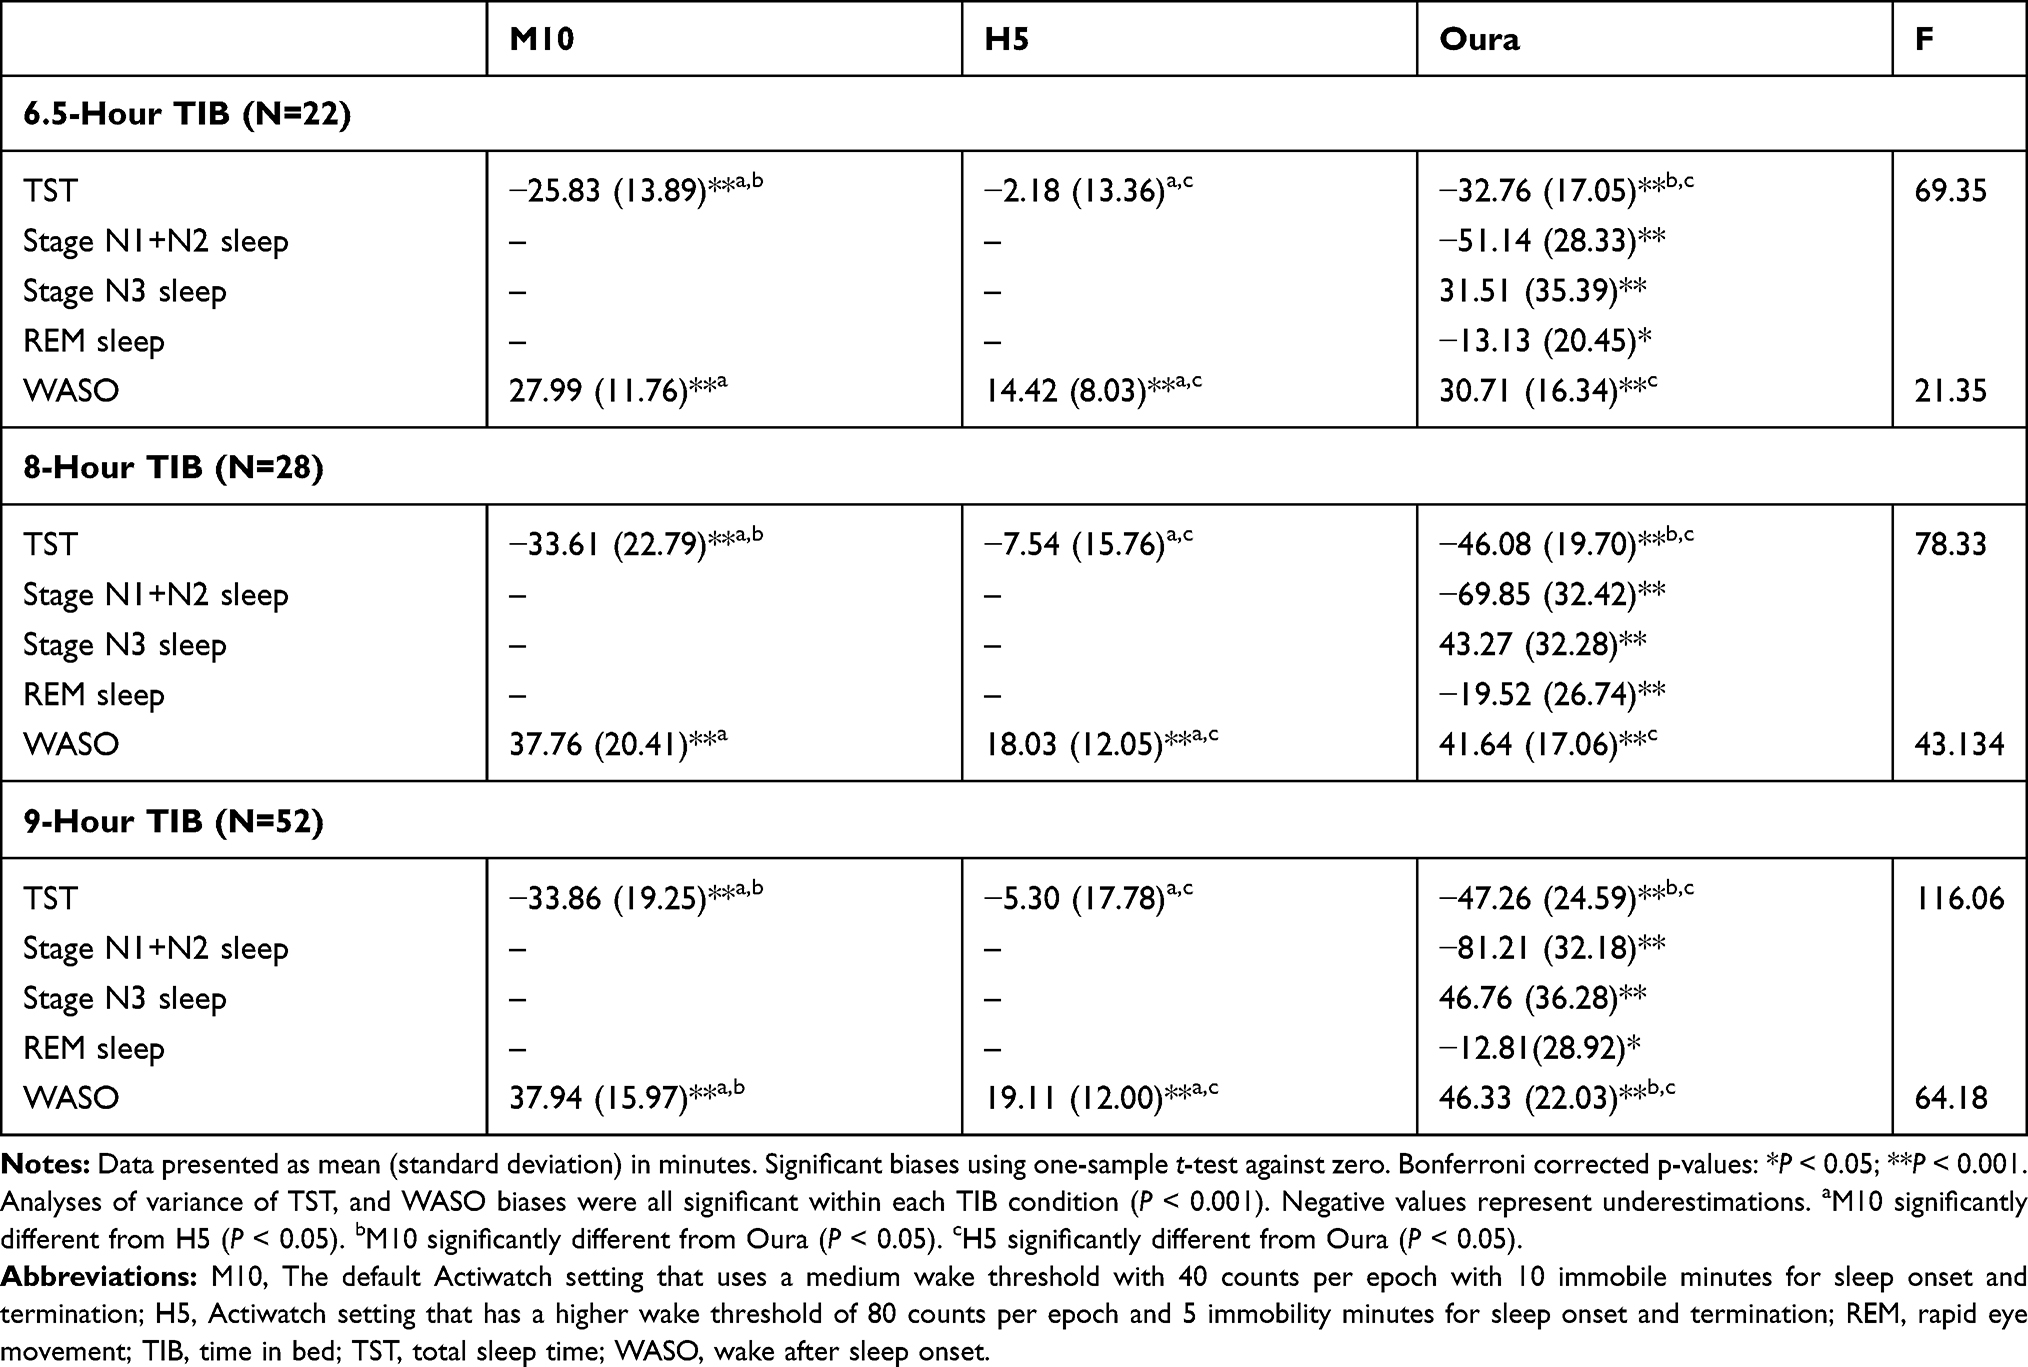 |
Table 2 Biases from PSG for Each Device Across TIB Conditions |
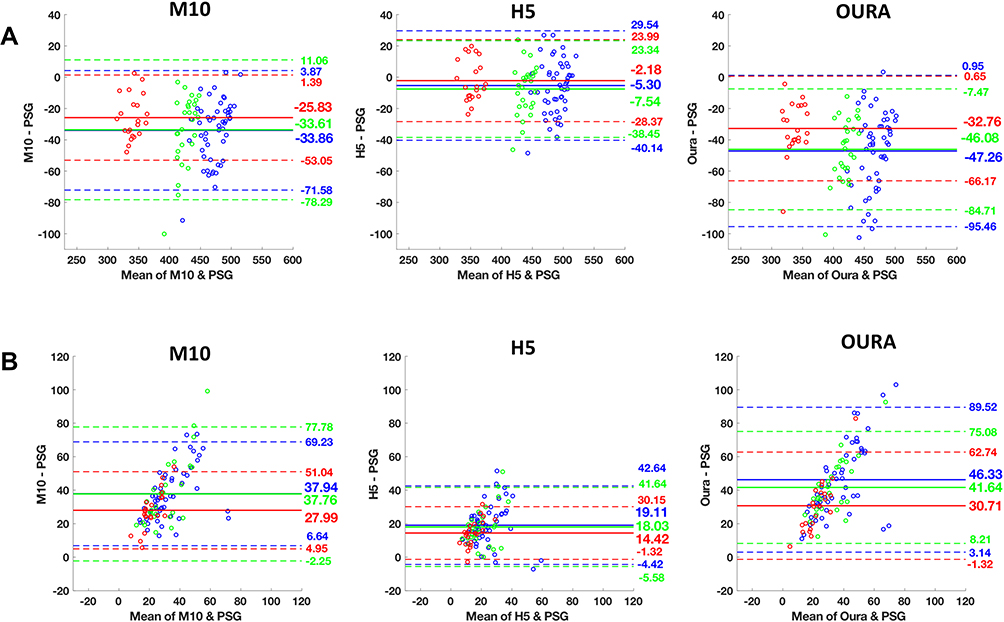 |
Figure 1 Bland−Altman plots of mean bias with upper and lower bands of agreement between polysomnography (PSG), Oura and Actiwatch H5 and M10 settings for each TIB condition (Red: 6.5-hour, green: 8-hour, and blue: 9-hour). A mean bias line above and below zero demonstrates overestimation and underestimation of the device against PSG, respectively. Bland-Altman plots of (A) total sleep time (TST), and (B) wake after sleep onset (WASO) for Actiwatch M10, H5, and Oura, respectively. The solid line indicates the mean value of bias and the dashed line represent 1.96 SD limits of agreement. |
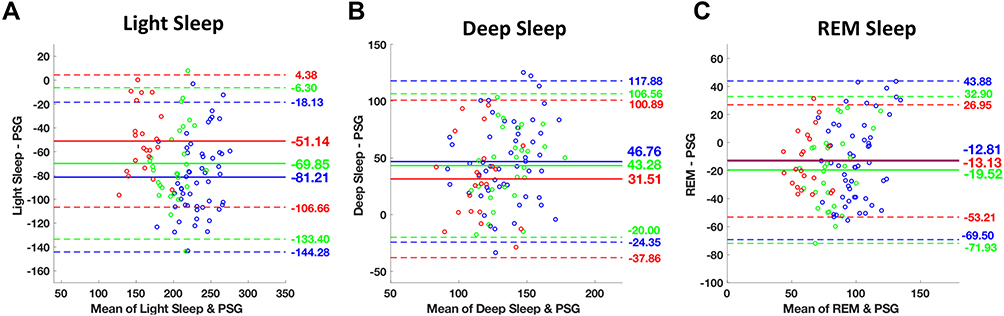 |
Figure 2 Bland–Altman plots of (A) light, (B) deep, and (C) REM sleep, respectively between polysomnography (PSG) and Oura. Each TIB condition is color-coded with red: 6.5-hour, green: 8-hour, and blue: 9-hour sleep. The solid line indicates the mean value of bias and the dashed line represent 1.96 SD limits of agreement. |
EBE analyses compared with PSG demonstrated excellent sleep-wake accuracies, specificities, and sensitivities; between 0.88 and 0.89 across all TIBs (Tables 3 and 4). Further, EBE comparisons on sleep stage classification accuracy relative to PSG indicated agreement of 0.51 to 0.53 in detecting REM sleep, 0.52 in detecting light sleep, and 0.79 to 0.83 in detecting deep sleep (Table 4). Based on the confusion matrices presented in (Table 5) Oura most commonly misclassified light sleep as deep sleep (23 to 25% of the time), followed by misclassification as wake and REM sleep (10 to 13% of the time). Deep and REM sleep were most frequently misclassified as light sleep (13 to 18% of the time), and (23 to 28% of the time), respectively. Cohen’s kappa coefficient showed moderate agreement values of 0.45 ± 0.07 in the 6.5 and 8h TIB conditions and 0.44 ± 0.08 in the 9h TIB condition.
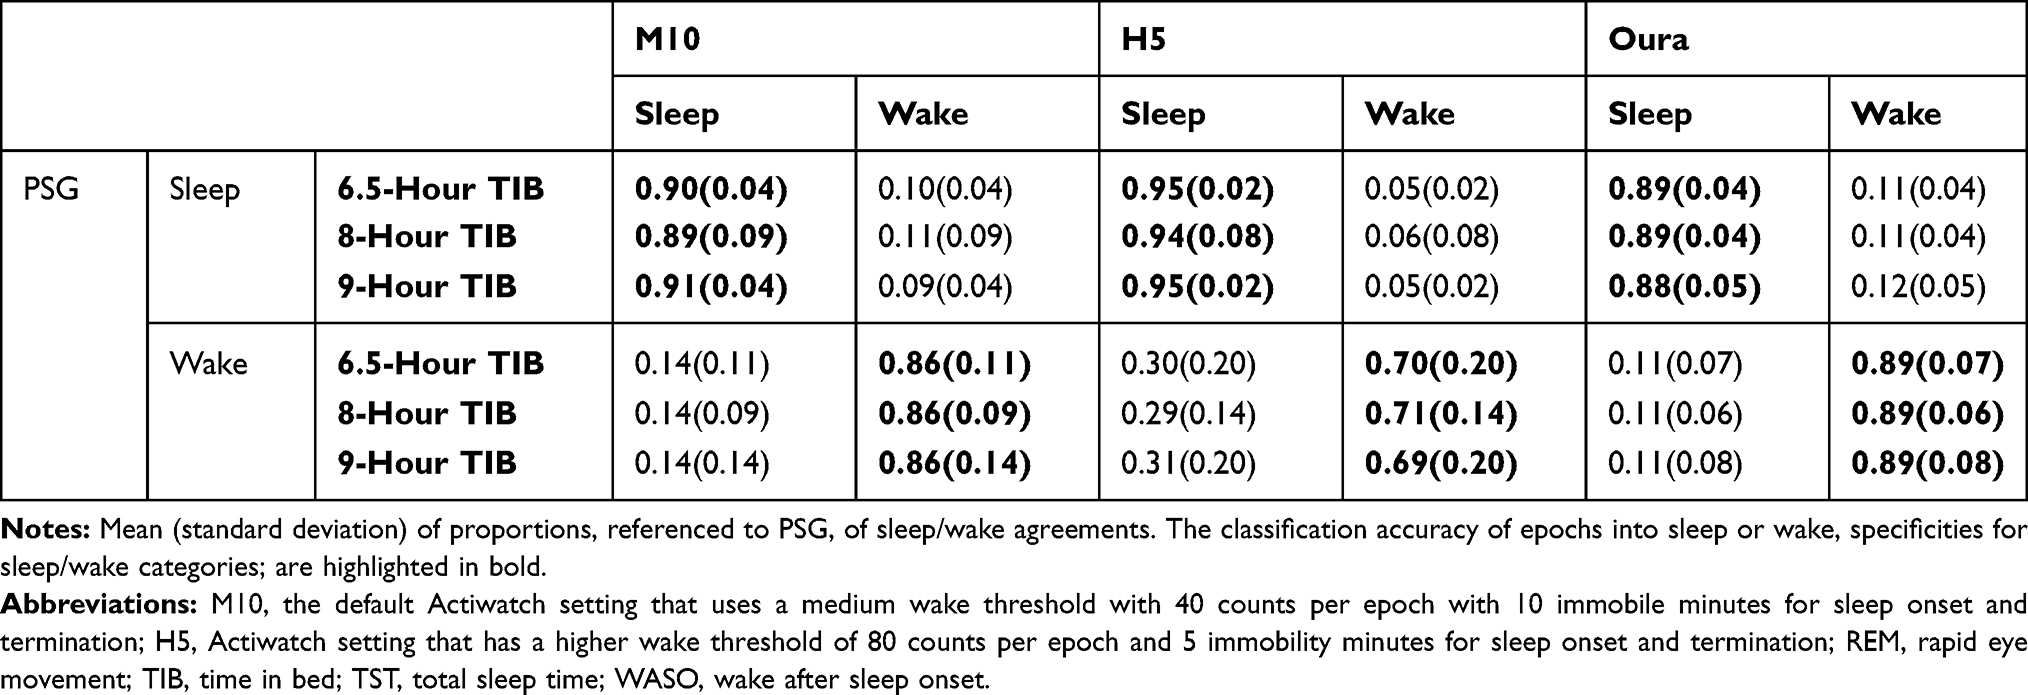 |
Table 3 Confusion Matrices of Each Device Setting by TIB Condition |
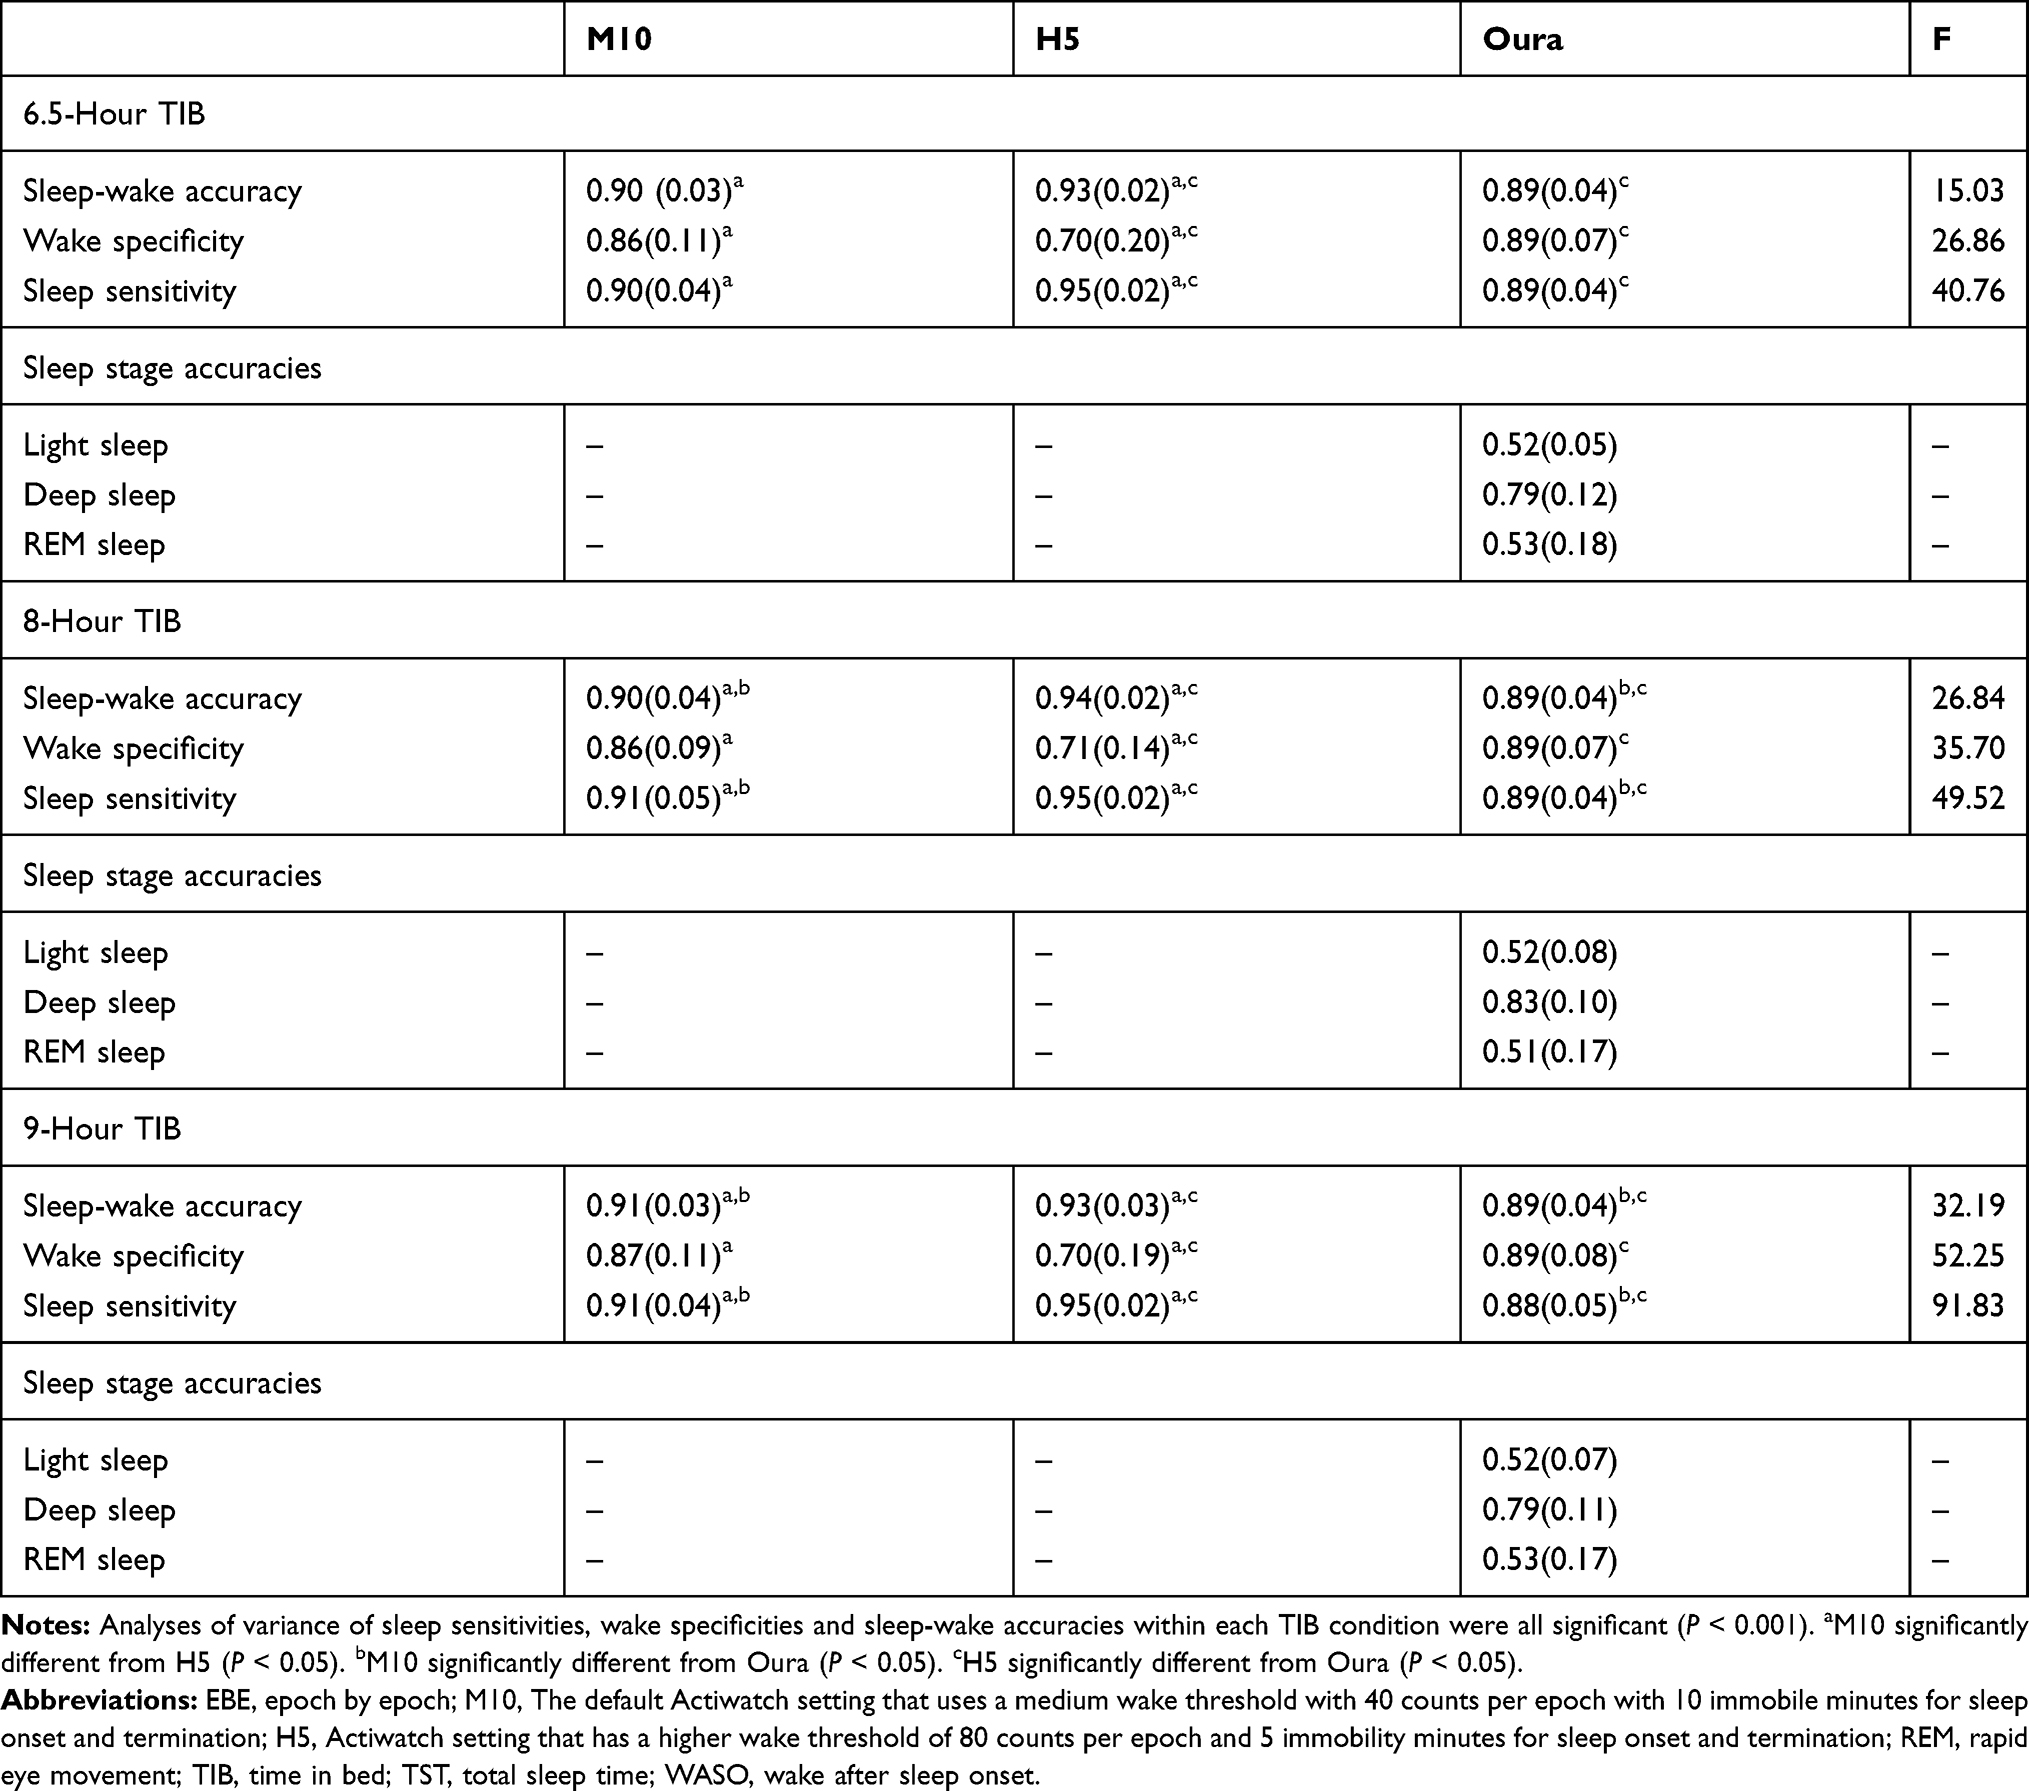 |
Table 4 EBE Agreement Metrics, Referenced to PSG, of Each Device Setting Grouped by TIB Condition |
 |
Table 5 Confusion Matrices of Oura Sleep Staging by TIB Condition |
Comparison of Actiwatch M10, H5 and Oura Ring
Repeated measures ANOVA on observed device-PSG biases for TST, and WASO showed a significant main effect of the device across all TIB conditions (TST: F ≥ 69.35, P < 0.001; WASO: F ≥ 21.35, P < 0.001; Table 2, Figure 1). The post hoc paired t-tests demonstrated that Oura had slightly more TST underestimation compared with M10, by an average of 6.9 to 13.4 minutes (ts ≥ 2.17, Ps < 0.05, Cohen’s ds ≥ 0.47) across the different TIB conditions. For WASO, M10 and Oura performed comparably in the 6.5 and 8h TIB conditions (ts ≤ 0.89, Ps ≥ 0.38, Cohen’s ds ≤ 0.19), and M10 significantly outperformed Oura with an average of 8.4 minutes less overestimation in the 9-h TIB condition (t = 2.54, P = 0.006, Cohen’s d = 0.39). We observed significantly better performance in both TST and WASO estimation for H5, compared with M10 and Oura (ts ≥ 5.25, Ps < 0.001, Cohen’s ds ≥ 1.12; Table 2, Figure 1).
For EBE analyses, repeated measures ANOVA on device-PSG agreements of accuracy, sensitivity, and specificity indicated a significant main effect of device across all TIB conditions (accuracy: F ≥ 15.03, P< 0.001; sensitivity: F ≥ 40.76, P < 0.001; specificity: F ≥ 26.86, P < 0.001; Table 4). The post hoc paired t-tests showed significantly higher wake specificity values of Oura compared to H5 by 0.18 to 0.19 (ts ≥ 5.08, Ps < 0.001, Cohen’s ds ≥ 1.09), and comparable performance with M10 consistently across all TIB conditions (ts ≤ 1.67, Ps ≥ 0.10, Cohen’s ds ≤ 0.23). Moreover, we did not observe any significant differences in sleep-wake accuracy and sleep sensitivity between Oura and M10 in the 6.5h condition. However, Oura had slightly lower accuracy values than M10 by 0.01 to 0.02 in the 8 and 9h TIB conditions (ts ≥ 2.11, Ps < 0.05, Cohen’s ds ≥ 0.41). Finally, we observed significantly higher accuracy and sensitivity values of H5, compared with M10 and Oura, across TIB conditions ranging from 0.02 to 0.07 (ts ≥ 4.72, Ps < 0.001, Cohen’s ds ≥ 0.89). Nonetheless, this came at the cost of significantly lower specificity (Table 4). Further details regarding the sleep-wake classification accuracy, sensitivity, and specificity of each device across TIB conditions are summarized in Tables 3 and 4. In addition, direct comparison of M10 and H5 with PSG is presented in the supplemental material.
Proportional Biases Associated with Sleep Duration
Bias in TST underestimation was significantly associated with longer sleep duration for M10 and Oura in the 8 and 9h TIB conditions (Table 6). The magnitude of underestimation increased by 0.39 to 1 minute (F ≥ 13.98, Ps < 0.001), and 0.37 to 0.82 minutes (F ≥ 5.60, Ps < 0.05) per TST minute; for M10 and Oura, respectively. We did not find a significant association in the 6.5h condition (F ≤ 1.24, P ≥ 0.28). For H5, this association was not significant across TIB conditions (F ≤ 3.76, Ps ≥ 0.058). Linear regression on WASO showed greater overestimation for all devices by 0.6 to 1.64 minutes per additional WASO minute across all TIB conditions (F ≥ 4.11, Ps < 0.001; Table 6). We found a significant relationship between the amount of REM sleep duration and increased REM sleep estimation bias by an average of 0.62 to 0.77 minutes for Oura in the 8 and 9h conditions (F ≥ 5.49, Ps < 0.05). For the other sleep stages and device settings, we did not observe any significant associations of bias magnitude with the stage duration (F ≤ 3.22, Ps ≥ 0.09). For further details on the biases proportional to the sleep duration, see Table 6.
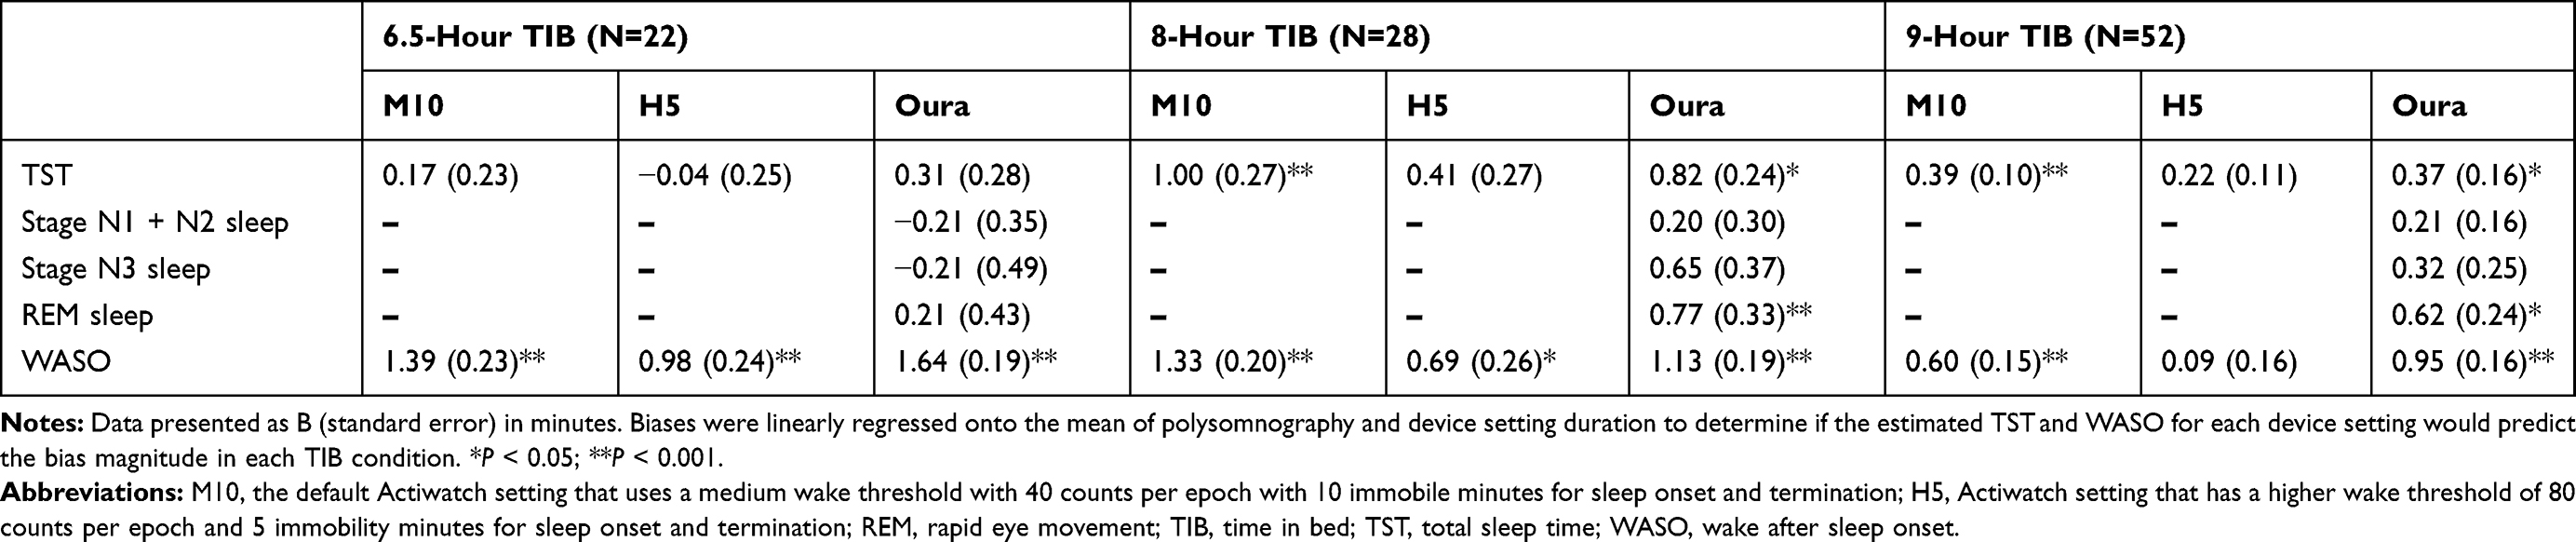 |
Table 6 Biases Proportional to the Sleep Duration Observed in Each Device Across TIB Conditions |
Sex and BMI Effects on PSG-Device Discrepancies
We found no significant sex by device interactions on the bias in TST estimates across all TIB conditions (Table S1). Differential effects were only trending towards significance in the 8h TIB condition for H5, and Oura, where both devices underestimated TST more in males compared to females (Table S1). Similarly, we observed no significant BMI by device interactions in TST estimates in all TIB conditions (Table S2).
Replication of Prior PSG Findings with the Oura Ring
Despite the biases observed in the Oura ring compared to PSG, we sought to examine whether the Oura ring would still be able to replicate the conclusion of our previously reported sleep architecture findings between Split and Continuous groups demonstrated with the PSG.24 Sleep architecture differences between Continuous and Split groups across the manipulation nights using both PSG and the Oura ring are presented in Figure 3. Overall PSG trends between groups are largely mirrored by the Oura, despite biases between devices.
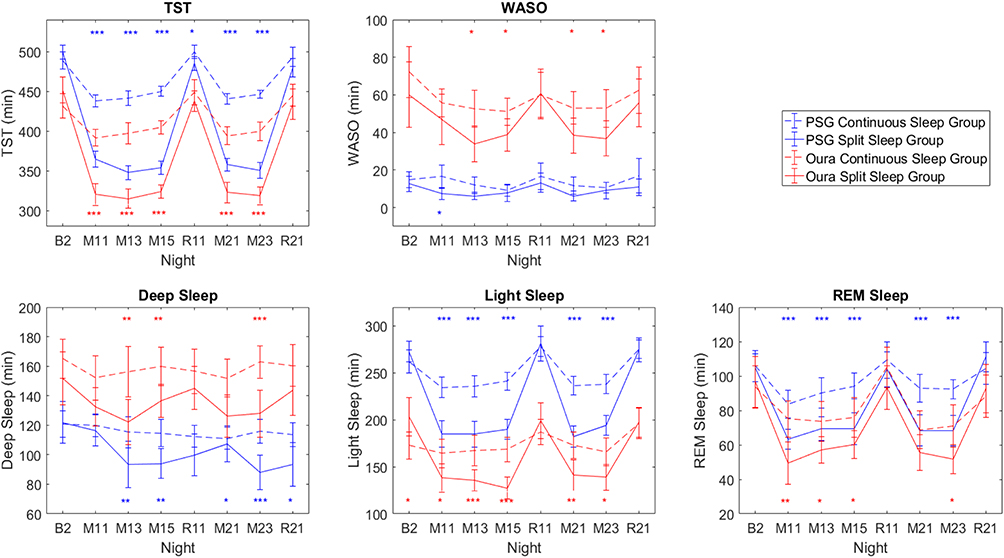 |
Figure 3 TST, WASO, and sleep stages measured by PSG (blue lines) and Oura ring (red lines) for the Continuous (dotted lines) and Split (solid lines) sleep groups across the manipulation nights. Error bars denote 95% confidence intervals. Blue asterisks denote significant differences between groups with PSG measures, while red asterisks denote significant differences between groups with Oura measures. *P < 0.05; **P < 0.01; ***P < 0.001. |
However, it is important to consider both the magnitude and variance of experimental effects as well as device errors in assessing whether the Oura is able to detect an effect of interest. For example, an effect is considered significant at the p<0.05 level when 95% CIs of the 2 groups (Continuous and Split Sleep) measured by PSG overlap less than half of the error bar width. Assuming comparable Oura-PSG device biases in both groups, if the error bars of the Oura-PSG discrepancy render an overlap greater than half of the error bar width, then the effect can no longer be detected by Oura (eg, on night R11 in Supplementary Figure 2). However, if the size of the effect is large in contrast to the size of the discrepancy, the issue is less problematic (eg, on the M (manipulation) nights), particularly if one is only interested in the differential effects between groups.
Discussion
In our evaluation of the Oura ring, over multiple nights of sleep in each participant, we found the device to give comparable assessment of sleep timing and duration with respect to PSG as the Actiwatch 2 research actigraph at the latter’s default settings. Both devices significantly underestimated adolescent sleep in this sample across all 3 sleep opportunities. This similar underestimation by the Oura ring and the Actiwatch 2 at default M10 setting may be due to both devices being optimised for adults, and thus warrants further validation in an adult population. The possibility for improving the accuracy of sleep detection for different populations, such as different age groups, by customizing sensor sensitivity is exemplified by the better correspondence of Actiwatch 2 output and PSG with lowered sensitivity to motion.
For sleep staging, the Oura ring systematically underestimated light sleep and overestimated deep sleep. Notwithstanding these biases, data from the Oura ring were able to detect practically important differences between groups across the 15-day study, particularly where experimental effects were larger than the size of the Oura-PSG discrepancy. This speaks to utility in detecting important sleep trends even if point estimates are off the mark.
Comparable Performance Between Consumer Device and Research Actigraph for Sleep-Wake Classification
Both devices underestimated sleep in adolescents, by about 30 minutes for the Actiwatch 2 at M10 and by about 40 minutes for the Oura ring. This underestimation was proportional with the duration of the sleep opportunity, with increasing underestimation as the sleep opportunity lengthened for the 8- and 9-h sleep opportunities. This mirrors an overestimation of WASO in both devices, with a similar proportionally increasing overestimation of WASO with increasing sleep opportunity.
With TST and WASO, the Oura ring showed comparable bias to the Actiwatch 2 at its default setting (3–13 minutes). Additionally, the Oura achieved better wake specificity across all TIB conditions. This improved specificity could be the result of the use of multiple sensors for sleep-wake classification employed by the Oura ring. Other devices from this new generation of wearables that incorporate additional sensors beyond motion-only sleep detection have also shown improvements in their performance over their motion-only predecessors.15
Feasibility of Customization of Sleep Detection for Different Subgroups
Across all TIB conditions, Actiwatch 2 at the lower motion sensitivity ‘H5ʹ setting was associated with less underestimation of TST and overestimation of WASO compared with the default setting. These observations concur with previous findings12,23 and support the use of different threshold settings to achieve higher agreement with PSG in adolescent populations. Validation studies of the Actiwatch 2 at the default (M10) setting mostly employed healthy adult populations. However, it is known that healthy adolescents demonstrate increased movement during sleep compared to adults.28 Given the similar performance of the Oura ring compared with the Actiwatch M10 setting, this supports wearables providing the option for customisation of their sleep algorithms for different subgroups as well as further validation studies with healthy adult populations, for which the Actiwatch M10 setting has been well validated with.
Oura Sleep Staging Performance
Compared to PSG, the Oura ring significantly underestimated the amount of light (N1 + N2), and REM sleep, and overestimated the amount of deep sleep (N3) across all TIBs. These results are opposite to the findings by de Zambotti and colleagues who found an underestimation of deep sleep by about 20 minutes and overestimation of light and REM sleep by 3 and 17 minutes respectively.19 There could be several possible reasons for these discrepancies.
An updated sleep scoring algorithm and a second generation of rings was used in this study which might limit comparisons to prior work. For example, in the EBE analysis, we found greater likelihood of scoring N3 relative to light and REM sleep compared to the earlier study on adolescents.19 Inter-scorer differences could also contribute to the different results. Aggregate agreement among human scorers of PSG is around 80%.30 The labeling of N3 and N1 in particular typically shows lower inter-scorer agreement than N2, REM sleep, or wakefulness.30–32 Finally, sleep measurement algorithms used by the Oura ring were developed using data from healthy Caucasian adults. The adolescents in a previous study19 were also predominantly Caucasian, while only East and South Asians were studied here. Further work is needed to validate sleep algorithms in samples that involve persons of different ages and ethnicity as these could additionally influence accuracy and generalizability of wearable studies based on HR and motion sensors.21,22,33
Wearable Devices as an Attractive Tool for Longitudinal Tracking
The Oura ring and likely, other new generation wearables with multiple sensors, have clear advantages over both PSG and research actigraphs in their ability to collect weeks, months, or even years of data in a home setting without requiring users to visit the lab for data extraction. The smartphone-based apps that support such devices enable researchers to retrieve daily updates of participants’ sleep through a secure cloud-based platform. A potential challenge for long-term research studies is firmware and hardware upgrading that can disrupt the assessment of long-term trends in sleep behavior, particularly if these changes are not communicated to users in advance. This can be circumvented by first collecting raw or minimally processed sensor data (as in the case of research actigraphs) followed by the provision of an Application Programming Interface (API) that would allow researchers to process collected research data to take advantage of advances in the mapping of wearable data to PSG rather than rely on processed outcome metrics. We expect that when more validation data of the sort available here become accessible, sleep scoring algorithms using deep learning will advance such mapping to different subgroups of users – taking into account age, ethnicity, and underlying health condition.34
Despite systematic biases in sleep measurement, there could still be utility in the detection of certain trends as demonstrated here. On a single night basis and for clinical uses, PSG provides unparalleled fidelity of sleep measurement. However, over a period of months or longer, wearables with a growing number of sensors trained on extensive datasets on which machine learning can be applied, provide access to trend data on sleep regularity on a scale and duration hitherto impossible. Beyond serving as proxy measures of sleep, the measures these devices collect: heart rate, heart rate variability, body temperature, and breathing rate provide physiological information that are invaluable in monitoring health and wellbeing, as well as the effect of lifestyle or therapeutic interventions on these.
Limitations
We excluded the analysis of sleep onset latency (SOL) in the present work as an accurate assessment would be incompatible with the protocol of the study. In the case of the Oura ring, an automated proprietary algorithm determines TIB timings, which does not always conform to the lights off and lights on timings enforced during the study – to which PSG and Actiwatch TIB start and end times were aligned with. As such, to ensure a fair comparison across the devices, we amended Oura ring recordings to match TIBs across all devices by adding or removing epochs around the enforced lights off/lights on timings during the study.
Additionally, while a comparison of SOL is theoretically possible under laboratory settings with artificially imposed lights off and on timings, it would be more difficult to assess this under real-world, ecological settings, where peri-sleep behavior (and thus, exact TIB timings) vary substantially across individuals. Future validation studies in this regard would benefit from a consensus as to the type of sleep behavior that constitutes actual sleep time (eg, lying down with eyes closed as opposed to sitting up in bed reading a book), as well as the ability of the sensors to distinguish between these types of behaviors.
Conclusion
The Oura ring performed comparably with a research grade actigraph at its default setting in terms of sleep/wake classification, but with slightly greater TST underestimation. In terms of sleep staging, the Oura ring significantly underestimated N1+N2 and REM sleep and overestimated N3 sleep in adolescents. The ring was able to detect the effects of sleep manipulation on sleep behavior that were in agreement with the inference obtained from concurrent PSG monitoring over a 2-week period, demonstrating its utility for the long-term monitoring of sleep habits.
Acknowledgments
The authors thank Alyssa Ng, Azrin Jamaluddin, Andrew Dicom, Christina Chen, Xin Yu Chua, Ksenia Vinogradova, Zhenghao Pu, Teck Boon Teo, Te Yang Lau, Brian Teo, Tiffany Koa, Jessica Lee, James Teng, Kian Wong, Zaven Leow, Litali Mohapatra, Caryn Yuen, Yuvan C, and Karthika Muthiah for assistance in data collection and sleep scoring.
This work was supported by grants from the National Medical Research Council, Singapore (NMRC/STaR/015/2013 and STaR19May-001)
Disclosure
The Oura rings used in this study were supplied by Oura Health Oy for the collection of PSG data for the company’s internal use. The contents of this report were independently generated. The authors report no financial or other conflicts of interest in this work.
References
1. Ancoli-Israel S, Cole R, Alessi C, Chambers M, Moorcroft W, Pollak CP. The role of actigraphy in the study of sleep and circadian rhythms. Sleep. 2003;26(3):342–392. doi:10.1093/sleep/26.3.342
2. Ancoli-Israel S. Actigraphy. In: Kryger M, Roth T, Dement W, editors. Principles and Practice of Sleep Medicine. Philadelphia: W.B. Saunders; 2000:1295–1301.
3. Colburn TR, Smith BM, Guarini JJ, Simmons NN. An ambulatory activity monitor with solid state memory. ISA Trans. 1976;15(2):149–154.
4. Kripke DF, Mullaney DJ, Messin S, Wyborney VG. Wrist actigraphic measures of sleep and rhythms. Electroencephalogr Clin Neurophysiol. 1978;44(5):674–676. doi:10.1016/0013-4694(78)90133-5
5. Sadeh A. The role and validity of actigraphy in sleep medicine: an update. Sleep Med Rev. 2011;15(4):259–267. doi:10.1016/j.smrv.2010.10.001
6. Marino M, Li Y, Rueschman MN, et al. Measuring sleep: accuracy, sensitivity, and specificity of wrist actigraphy compared to polysomnography. Sleep. 2013;36(11):1747–1755. doi:10.5665/sleep.3142
7. Quante M, Kaplan ER, Cailler M, et al. Actigraphy-based sleep estimation in adolescents and adults: a comparison with polysomnography using two scoring algorithms. Nat Sci Sleep. 2018;10:13–20. doi:10.2147/NSS.S151085
8. Sivertsen B, Omvik S, Havik OE, et al. A comparison of actigraphy and polysomnography in older adults treated for chronic primary insomnia. Sleep. 2006;29(10):1353–1358. doi:10.1093/sleep/29.10.1353
9. de Zambotti M, Baker FC, Colrain IM. Validation of sleep-tracking technology compared with polysomnography in adolescents. Sleep. 2015;38(9):1461–1468. doi:10.5665/sleep.4990
10. Belanger ME, Bernier A, Paquet J, Simard V, Carrier J. Validating actigraphy as a measure of sleep for preschool children. J Clin Sleep Med. 2013;9(7):701–706. doi:10.5664/jcsm.2844
11. Lo JC, Ong JL, Leong RL, Gooley JJ, Chee MW. Cognitive performance, sleepiness, and mood in partially sleep deprived adolescents: the need for sleep study. Sleep. 2016;39(3):687–698. doi:10.5665/sleep.5552
12. Meltzer LJ, Wong P, Biggs SN, et al. Validation of actigraphy in middle childhood. Sleep. 2016;39(6):1219–1224. doi:10.5665/sleep.5836
13. Montgomery-Downs HE, Insana SP, Bond JA. Movement toward a novel activity monitoring device. Sleep Breath. 2012;16(3):913–917. doi:10.1007/s11325-011-0585-y
14. Meltzer LJ, Hiruma LS, Avis K, Montgomery-Downs H, Valentin J. Comparison of a commercial accelerometer with polysomnography and actigraphy in children and adolescents. Sleep. 2015;38(8):1323–1330. doi:10.5665/sleep.4918
15. Haghayegh S, Khoshnevis S, Smolensky MH, Diller KR, Castriotta RJ. Accuracy of wristband fitbit models in assessing sleep: systematic review and meta-analysis. J Med Internet Res. 2019;21(11):e16273. doi:10.2196/16273
16. Meltzer LJ, Walsh CM, Traylor J, Westin AM. Direct comparison of two new actigraphs and polysomnography in children and adolescents. Sleep. 2012;35(1):159–166. doi:10.5665/sleep.1608
17. Depner CM, Cheng PC, Devine JK, et al. Wearable technologies for developing sleep and circadian biomarkers: a summary of workshop discussions. Sleep. 2020;43(2). doi:10.1093/sleep/zsz254.
18. Loncar-Turukalo T, Zdravevski E, Machado da Silva J, et al. Literature on wearable technology for connected health: scoping review of research trends, advances, and barriers. J Med Internet Res. 2019;21(9):e14017. doi:10.2196/14017
19. de Zambotti M, Rosas L, Colrain IM, Baker FC. The sleep of the ring: comparison of the OURA sleep tracker against polysomnography. Behav Sleep Med. 2019;17(2):124–136. doi:10.1080/15402002.2017.1300587
20. Roberts DM, Schade MM, Mathew GM, Gartenberg D, Buxton OM. Detecting sleep using heart rate and motion data from multisensor consumer-grade wearables, relative to wrist actigraphy and polysomnography. Sleep. 2020;43(7). doi:10.1093/sleep/zsaa045
21. Nelson BW, Low CA, Jacobson N, Arean P, Torous J, Allen NB. Guidelines for wrist-worn consumer wearable assessment of heart rate in biobehavioral research. NPJ Digit Med. 2020;3:90. doi:10.1038/s41746-020-0297-4
22. Colvonen PJ, DeYoung PN, Bosompra NA, Owens RL. Limiting racial disparities and bias for wearable devices in health science research. Sleep. 2020;43. doi:10.1093/sleep/zsaa159
23. Lee XK, Chee N, Ong JL, et al. Validation of a consumer sleep wearable device with actigraphy and polysomnography in adolescents across sleep opportunity manipulations. J Clin Sleep Med. 2019;15(9):1337–1346. doi:10.5664/jcsm.7932
24. Lo JC, Leong RLF, Ng ASC, et al. Cognitive effects of split and continuous sleep schedules in adolescents differ according to total sleep opportunity. Sleep. 2020;43. doi:10.1093/sleep/zsaa129
25. Patanaik A, Ong JL, Gooley JJ, Ancoli-Israel S, Chee MWL. An end-to-end framework for real-time automatic sleep stage classification. Sleep. 2018;41(5). doi:10.1093/sleep/zsy041
26. Ibert C, Ancoli-Israel S, Chesson A, Quan S. The AASM Manual for the Scoring of Sleep and Associated Events: Rules, Terminology and Technical Specification. Westchester: American Academy of Sleep Medicine; 2007.
27. What are the stages of sleep? Ouraring.com; 2020. Available from: https://blog.ouraring.com/sleep-stages.
28. Short MA, Gradisar M, Lack LC, Wright H, Carskadon MA. The discrepancy between actigraphic and sleep diary measures of sleep in adolescents. Sleep Med. 2012;13(4):378–384. doi:10.1016/j.sleep.2011.11.005
29. Anthony D. Introductory statistics for health and nursing using SPSS. Nurse Res. 2010;17(3):89.
30. Rosenberg RS, Van Hout S. The American Academy of Sleep Medicine inter-scorer reliability program: sleep stage scoring. J Clin Sleep Med. 2013;9(1):81–87. doi:10.5664/jcsm.2350
31. Basner M, Griefahn B, Penzel T. Inter-rater agreement in sleep stage classification between centers with different backgrounds. Somnologie - Schlafforschung und Schlafmedizin. 2008;12(1):75–84. doi:10.1007/s11818-008-0327-y
32. Danker-Hopfe H, Kunz D, Gruber G, et al. Interrater reliability between scorers from eight European sleep laboratories in subjects with different sleep disorders. J Sleep Res. 2004;13(1):63–69. doi:10.1046/j.1365-2869.2003.00375.x
33. Ibáñez V, Silva J, Navarro E, Cauli O. Sleep assessment devices: types, market analysis, and a critical view on accuracy and validation. Expert Rev Med Devices. 2019;16(12):1041–1052. doi:10.1080/17434440.2019.1693890
34. Fiorillo L, Puiatti A, Papandrea M, et al. Automated sleep scoring: a review of the latest approaches. Sleep Med Rev. 2019;48:1012. doi:10.1016/j.smrv.2019.07.007
 © 2021 The Author(s). This work is published and licensed by Dove Medical Press Limited. The full terms of this license are available at https://www.dovepress.com/terms.php and incorporate the Creative Commons Attribution - Non Commercial (unported, v3.0) License.
By accessing the work you hereby accept the Terms. Non-commercial uses of the work are permitted without any further permission from Dove Medical Press Limited, provided the work is properly attributed. For permission for commercial use of this work, please see paragraphs 4.2 and 5 of our Terms.
© 2021 The Author(s). This work is published and licensed by Dove Medical Press Limited. The full terms of this license are available at https://www.dovepress.com/terms.php and incorporate the Creative Commons Attribution - Non Commercial (unported, v3.0) License.
By accessing the work you hereby accept the Terms. Non-commercial uses of the work are permitted without any further permission from Dove Medical Press Limited, provided the work is properly attributed. For permission for commercial use of this work, please see paragraphs 4.2 and 5 of our Terms.