")
Back to Journals » Clinical Ophthalmology » Volume 16
Multi-Center Repeatability of Macular Capillary Perfusion Density Using Optical Coherence Tomography Angiography
Authors Jiang H, Simms AG, Sadaghiani S, Jiang YY, Morgan JIW, Aguirre GK, Pattany PM, Detre JA, Wang J
Received 26 July 2022
Accepted for publication 6 September 2022
Published 17 September 2022 Volume 2022:16 Pages 3069—3078
DOI https://doi.org/10.2147/OPTH.S383770
Checked for plagiarism Yes
Review by Single anonymous peer review
Peer reviewer comments 2
Editor who approved publication: Dr Scott Fraser
Hong Jiang,1,2 Ava-Gaye Simms,1 Shokufeh Sadaghiani,3 Yu You Jiang,4 Jessica IW Morgan,4 Geoffrey K Aguirre,3 Pradip M Pattany,5 John A Detre,2 Jianhua Wang1
1Department of Ophthalmology, Bascom Palmer Eye Institute, University of Miami Miller School of Medicine, Miami, FL, USA; 2Department of Neurology, University of Miami Miller School of Medicine, Miami, FL, USA; 3Department of Neurology, University of Pennsylvania Perelman School of Medicine, Philadelphia, PA, USA; 4Scheie Eye Institute and Center for Advanced Retinal and Ocular Therapeutics, Department of Ophthalmology, University of Pennsylvania Perelman School of Medicine, Philadelphia, PA, USA; 5Department of Radiology, University of Miami Miller School of Medicine, Miami, FL, USA
Correspondence: Jianhua Wang, Bascom Palmer Eye Institute, University of Miami, Miller School of Medicine, 1638 NW 10th Avenue, McKnight Building - Room 202A, Miami, FL, 33136, USA, Tel +1 305 482-5010, Fax +1 305 482-5012, Email [email protected]
Background/Aims: This study was to determine the test–retest repeatability in quantifying macular capillary perfusion density (CPD, expressed as fractal dimension) using optical coherence tomography angiography (OCTA) in a multi-center setting.
Methods: OCTA data were obtained in self-reported healthy subjects from Bascom Palmer Eye Institute at the University of Miami (UM, N = 18) and the University of Pennsylvania (UPenn, N = 22). The right eye of each subject was imaged twice at the first visit and then again at an interval of one week to assess intra-visit and inter-visit repeatability. The macular area of the OCTA-derived capillary perfusion density (OCTA-CPD) was analyzed by custom-made image processing and fractal analysis software. Fractal analysis was performed on the skeletonized microvascular network to yield OCTA-CPD by box-counting to the fractal dimension (Dbox) in the superficial vascular plexus (SVP). Repeatability was assessed by three measures: within-subject standard deviation (Sw), coefficient of variation (CoV) of repeated measures, and intraclass correlation coefficient (ICC).
Results: OCTA-CPD from both sites (UM and UPENN) showed good to excellent intra-visit repeatability, as demonstrated by the Sw ≤ 0.004, CoVs ≤ 0.23%, and ICCs ≥ 0.61. Similarly, both sites had good to excellent inter-visit repeatability, as shown by the Sw ≤ 0.005, CoVs ≤ 0.28%, and ICCs ≥ 0.61. The Bland-Altman plots of the intra-visit and inter-visit measurements showed excellent agreements between the paired measurements with minimal biases.
Conclusion: Our data showed that comparable high repeatability of OCTA-CPD can be achieved in both research sites using the same device, scan protocol, and image analysis.
Keywords: retinal capillary perfusion density, optical coherence tomography angiography, repeatability, multi-center study
Background
Optical coherence tomography angiography (OCTA) is an ophthalmic imaging instrument used to visualize and analyze the microvasculature of the retina and choroid.1 This imaging modality uses blood flow as an intrinsic contrast agent to track movement within an image sequence; therefore, the vessel network, including the capillaries, can be visualized in a non-invasive way without the need to inject an external dye.2 In addition, OCTA produces a three-dimensional scan that gives detailed depth information, and quantification of the vessel network can be obtained in different retinal slabs. This advances our understanding of the vascular structure and related circulation in the retina and choroid. Since OCTA relies on signal changes due to blood flow as the contrast agent to extract the vessel structure information, the OCTA-derived vessel network thus mainly reflects the microvascular structure and also indicates blood flow occupation within the tissue (ie, tissue perfusion).
OCTA has been widely used in research and clinical settings for diagnosis and to inform treatment decisions. While various analytic approaches are available in commercially available OCTA devices, there is no standardized analysis protocol for research and clinical applications. Furthermore, measurements of retinal vascular density from different OCTA device models or makes are not comparable, mainly due to different OCTA signal extraction algorithms, segmentation techniques, and quantification methods.3 It is essential to understand the repeatability and reproducibility of OCTA data to design clinical trials, interpret and compare data, and select the optimal technique for use in clinical practice.
In general, OCTA is repeatable with high precision when measuring retinal vessel density within each of the OCTA devices,4–15 but not reproducible among different OCTA devices (ie, different brands).3 The majority of previous repeatability studies were single-center studies that imaged healthy and/or diseased eyes using the same or different OCTA device brands within the research site. While different OCTA devices of the same model from the same manufacturer were found to have high reproducibility in the same site,16 this repeatability will also need to be tested in a multicenter setting, especially using the same image protocols and analysis. A multicenter approach allows for greater and faster subject recruitment and yields results reflecting a greater population sample. Characterizing repeatability in a multicenter setting will aid future multi-center study designs. The goal of the present study was to determine the test–retest repeatability in quantifying macular capillary perfusion density (CPD) using OCTA in a multi-center setting.
Methods
The research project was approved by the Institutional Review Board for Human Research at the University of Miami for both sites. A detailed description of the study was provided to each participant, who then read and signed the approved written informed consent forms. The tenets of the Declaration of Helsinki were observed throughout the study.
A screening visit was conducted to confirm the study participant eligibility. Exclusion criteria included a history of drug or alcohol dependence, psychiatric illness, stroke, brain tumor, cerebrovascular diseases, pregnancy, and ocular disorders such as glaucoma, diabetic retinopathy, macular degeneration, or refractive error greater than ±6 diopters (D).
Eligible participants underwent OCTA imaging twice (one week apart), using an Optovue OCTA device (AngioVue, Optovue, Inc., Fremont, CA, USA, ver. 2018.1.0.43). The details of the Optovue OCTA system have been well documented.17,18 Briefly, it is a spectral-domain optical coherence tomography system with a scan speed of 70,000 A-scans per second and an axial resolution of 5 µm. To ensure the acquisition of high-quality angiography, images were only included in the study if the image quality was ≥7/10, as determined by the Optovue software. The macula, centered on the fovea, was imaged for each eye using angiographic retinal scan protocols (3 × 3 mm and 6 × 6 mm). Although the poor correlation of vessel density between the right and left eyes was documented previously using other analytic methods, high inter-eye correlation in fractal dimension has been found in normal healthy subjects with this method.7 As in previous studies,8,11,12,16,19,20 only one eye (right eye) of each subject was scanned twice in each study visit, and eight high-quality images (2 angio scans per eye per visit per scan protocol × 2 visits × 2 scan protocols) were obtained.
The angiographic en face slabs were exported using zero offsets of the boundaries. Only the superficial vascular plexus (SVP) slab was analyzed. Eight en face images were exported for each scan protocol (ie, 3 × 3 mm and 6 × 6 mm). The deeper capillary plexus was not analyzed because of the shadow graphic projection artifact, which may confound the analysis of vessel quantification.7
Custom software was developed to process the en face slab images, and quantification of the CPD was performed using fractal analysis. Image processing has been reported previously.21,22 Briefly, the images were processed using a set of filters, and processing approaches, including inverting, equalizing, removing background noise, and creating binary images. Any vessels with a diameter of ≥25 µm were removed. The software detects the center of the avascular zone (marked as the yellow asterisk in Figure 1), which was used to define the annulus. The remaining small vessels were then skeletonized for analysis in the annuli (0.6–2.5 mm in diameter for 3 × 3 mm scans and 0.6–5.0 mm for 6 × 6 mm scans). The CPD was expressed as the fractal dimension (ie, Dbox) and analyzed using box-counting in fractal analysis.
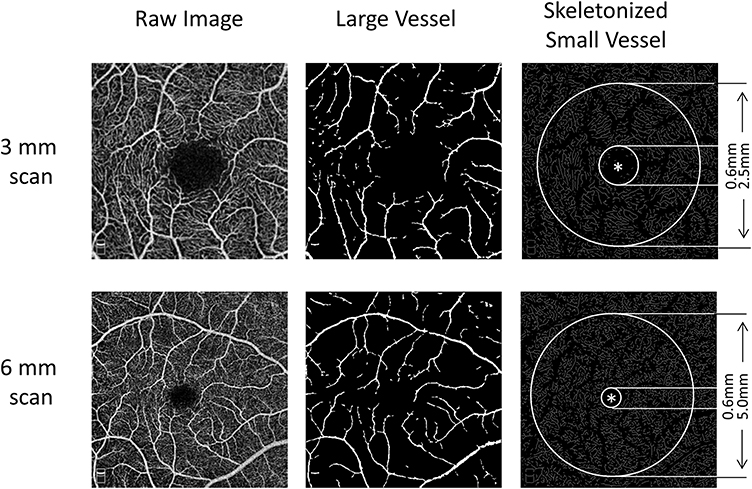 |
Figure 1 Image processing. The raw images of segmented angiographic slabs were processed using custom software to remove large vessels with a diameter > ~25 µm in the superficial vascular plexus (SVP). The remaining small vessels were then skeletonized for analysis within the annulus with 0.6–2.5 mm in diameters for 3×3 mm scan and 0.6–5.0 mm in diameters for 6×6 mm scan. The software detects the center of the avascular zone (marked as the asterisk), which was used to define the annulus. |
Statistical analysis was performed using SPSS (version 25, IMB SPSS Inc., Armonk, NY, USA). The following measures assessed repeatability: within-subject standard deviation (Sw), which measures how scattered data points are from the mean of the repeated measures within the subject; coefficient of variation (CoV), which determines the variability of repeated measures (ie, Sw divided by mean measurements); and intraclass correlation coefficient (ICC), to assess consistency or reproducibility of the paired measurements. Generally, CoV <10% indicates good repeatability.11 ICC was analyzed for intra-visit and inter-visit ICCs using a two-way mixed model with a 95% confidence interval on the absolute agreement. ICC between 0.60 and 0.74 indicates good agreement of the paired measurements, and ICC between 0.75 and 1.00 indicates excellent agreement in the paired measurements.23 Bland-Altman plots were also used to show the intra-visit and inter-visit agreements of paired measurements.
Results
A total of 40 self-reported healthy subjects were recruited at the University of Miami (UM, site 1, N = 18) and the University of Pennsylvania (UPenn, site 1, N = 22) (Table 1). There were no significant differences in age and sex between sites. The means and standard deviations of the CPD measurements (Table 1) were similar between visits and scans (ie, first and second scans) in both scan protocols (ie, 3 × 3 mm and 6 × 6 mm) and research sites (all P > 0.05, Table 1 and Figure 2). Of note, the measurements of the CPD in the 3 mm scans were lower than those in the 6 mm scans in both research sites (all P < 0.05).
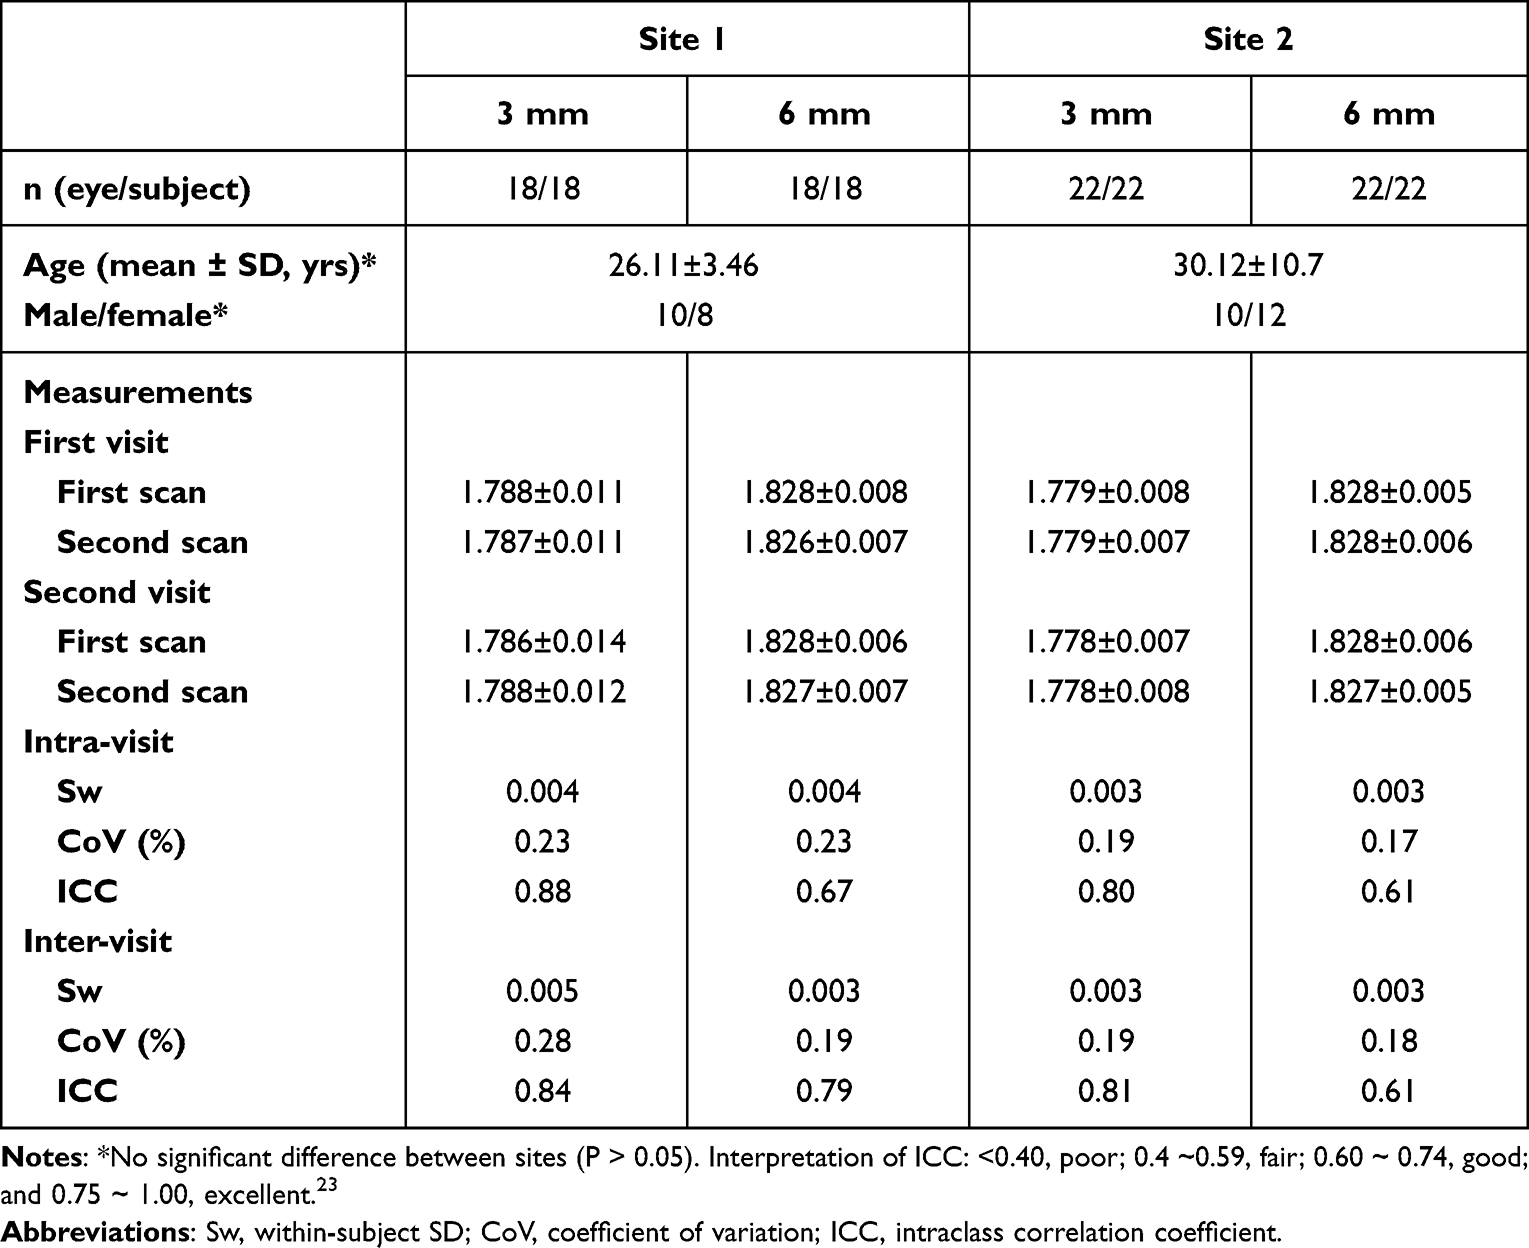 |
Table 1 Intra-Visit and Inter-Visit Repeatability Measurements in Both Research Sites |
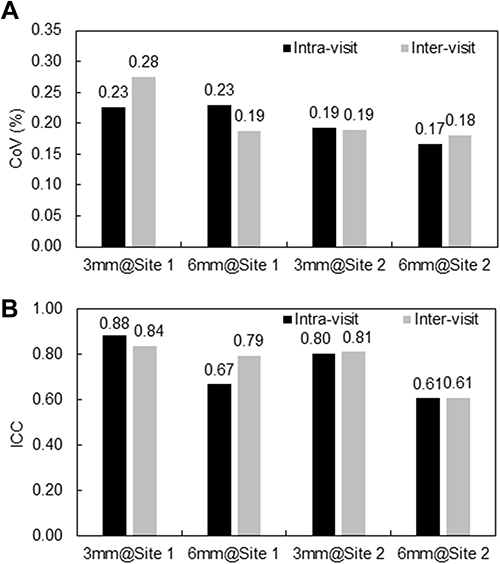 |
Figure 2 Intra-visit and inter-visit repeatability in both research sites. Both sites had good to excellent intra-visit repeatability, as shown by the CoVs and ICCs (A). Both sites had similar repeatability of the measurements taken on the same day (ie, intra-visit). In addition, the 6 mm scan protocol yielded slightly worse intra-visit ICCs in both sites than that of the 3 mm scan protocol, although the CoVs were similar. Similarly, both sites had good to excellent inter-visit repeatability, as shown by the CoVs and ICCs (B). Both sites had similar repeatability in the measurement taken on different days (ie, inter-visit). In addition, the 6 mm scan protocol yielded slightly worse inter-visit ICCs in both sites than that of the 3 mm scan protocol, although the CoVs were similar. Abbreviations: CoV, coefficient of variation; ICC, intraclass correlation coefficient. |
Both sites had good to excellent intra-visit repeatability, as shown by the CoVs ≤0.23% and ICCs ≥0.61. Both research sites had similar repeatability of the measurements taken on the same day (ie, intra-visit). In addition, the 6 × 6 mm scan protocol yielded slightly poorer intra-visit ICCs (0.67 at Site 1 and 0.61 at Site 2) than that of the 3 × 3 mm scan protocol (0.88 at Site 1 and 0.80 at Site 2), although the CoVs were similar.
Similarly, both sites had good to excellent inter-visit repeatability, as shown by the CoVs ≤0.28% and ICCs ≥0.61. Both sites had similar repeatability in the measurements taken on different days (ie, inter-visit). In addition, the 6 × 6 mm scan protocol yielded slightly poorer inter-visit ICCs (0.79 at Site 1 and 0.61 at Site 2) than that of the 3 × 3 mm scan protocol (0.84 at Site 1 and 0.81 at Site 2), although the CoVs were similar.
The Bland-Altman plots of the intra-visit and inter-visit measurements showed excellent agreements between paired measurements, with minimal biases of both scan protocols (ie, 3 × 3 mm and 6 × 6 mm) in both research sites (Figure 3). Of note, there were only a few cases of outliers (ie, beyond 95% confidence intervals on both sides) at either research site.
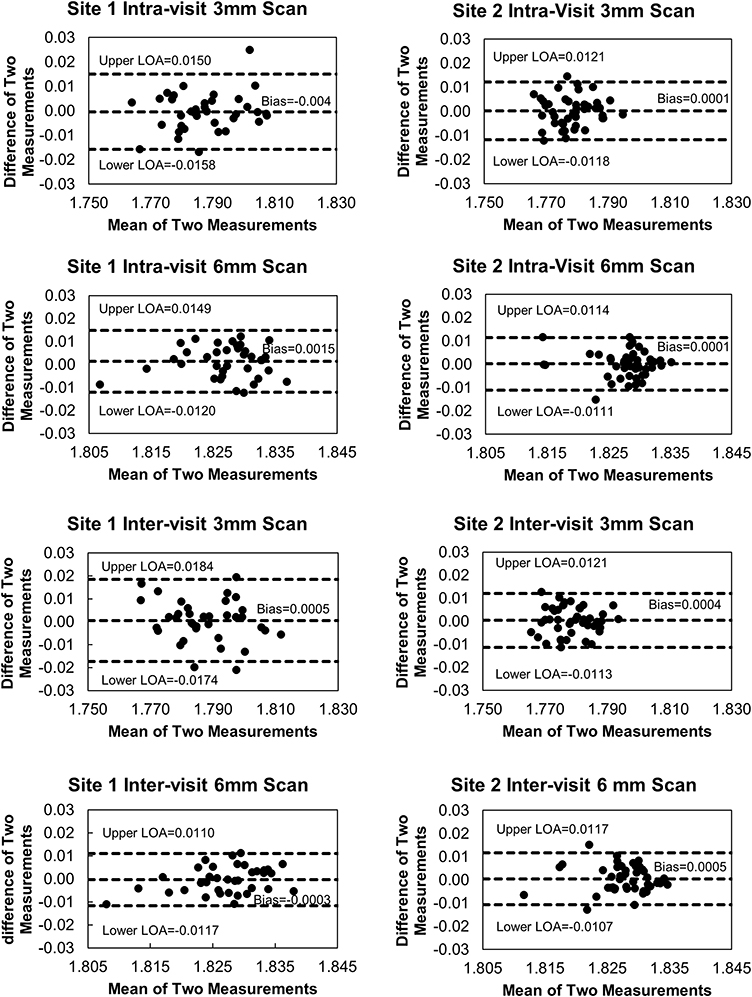 |
Figure 3 The Bland-Altman plots of the intra-visit and inter-visit measurements. The plots showed excellent agreements between paired measurements with minimal biases of both scan protocols (ie, 3×3 mm and 6×6 mm) in both research sites. Of note, there were only a few cases of outliers (ie, beyond 95% confidence intervals on both sides) in either research site. The intra-visit analysis included both visits between the first and second scans. Similarly, the inter-visit analysis included both visits between the first scan of visit 1 and the first scan of visit 2, and between the second scan of visit 1 and the second scan of visit 2. |
Discussion
To the best of our knowledge, this is the first study to report the repeatability of OCTA-derived CPD in a multicenter setting, which is critical for informing clinical trials involving multi-centers. The study provides evidence that good to excellent repeatability can be achieved among research sites with the same OCTA devices, image protocol, and image processing methods for quantifying the CPD. The intra-visit and inter-visit repeatability obtained from both sites was in agreement with previous studies tested in a single site using the same OCTA device or different devices (Table 2).4–14 Together with the current study, the results suggest that OCTA-derived vessel density measurements have high repeatability within a session (ie, same visit) and reproducibility repeated in different sessions (ie, different visits or different devices of the same model).4–14 Based on these results, we conclude that the data could be directly compared and potentially merged for analysis if each cohort from each site shared the same demographic and clinical features. Additional studies suggest that high repeatability can be obtained within a couple of days6,20 or weeks,11,13 or even more than six months,9 provided the eye conditions remain the same. However, the measurements appeared not to be reproducible among different OCTA devices made by different manufacturers3 and among different software versions if major modifications are made to the same OCTA model.24
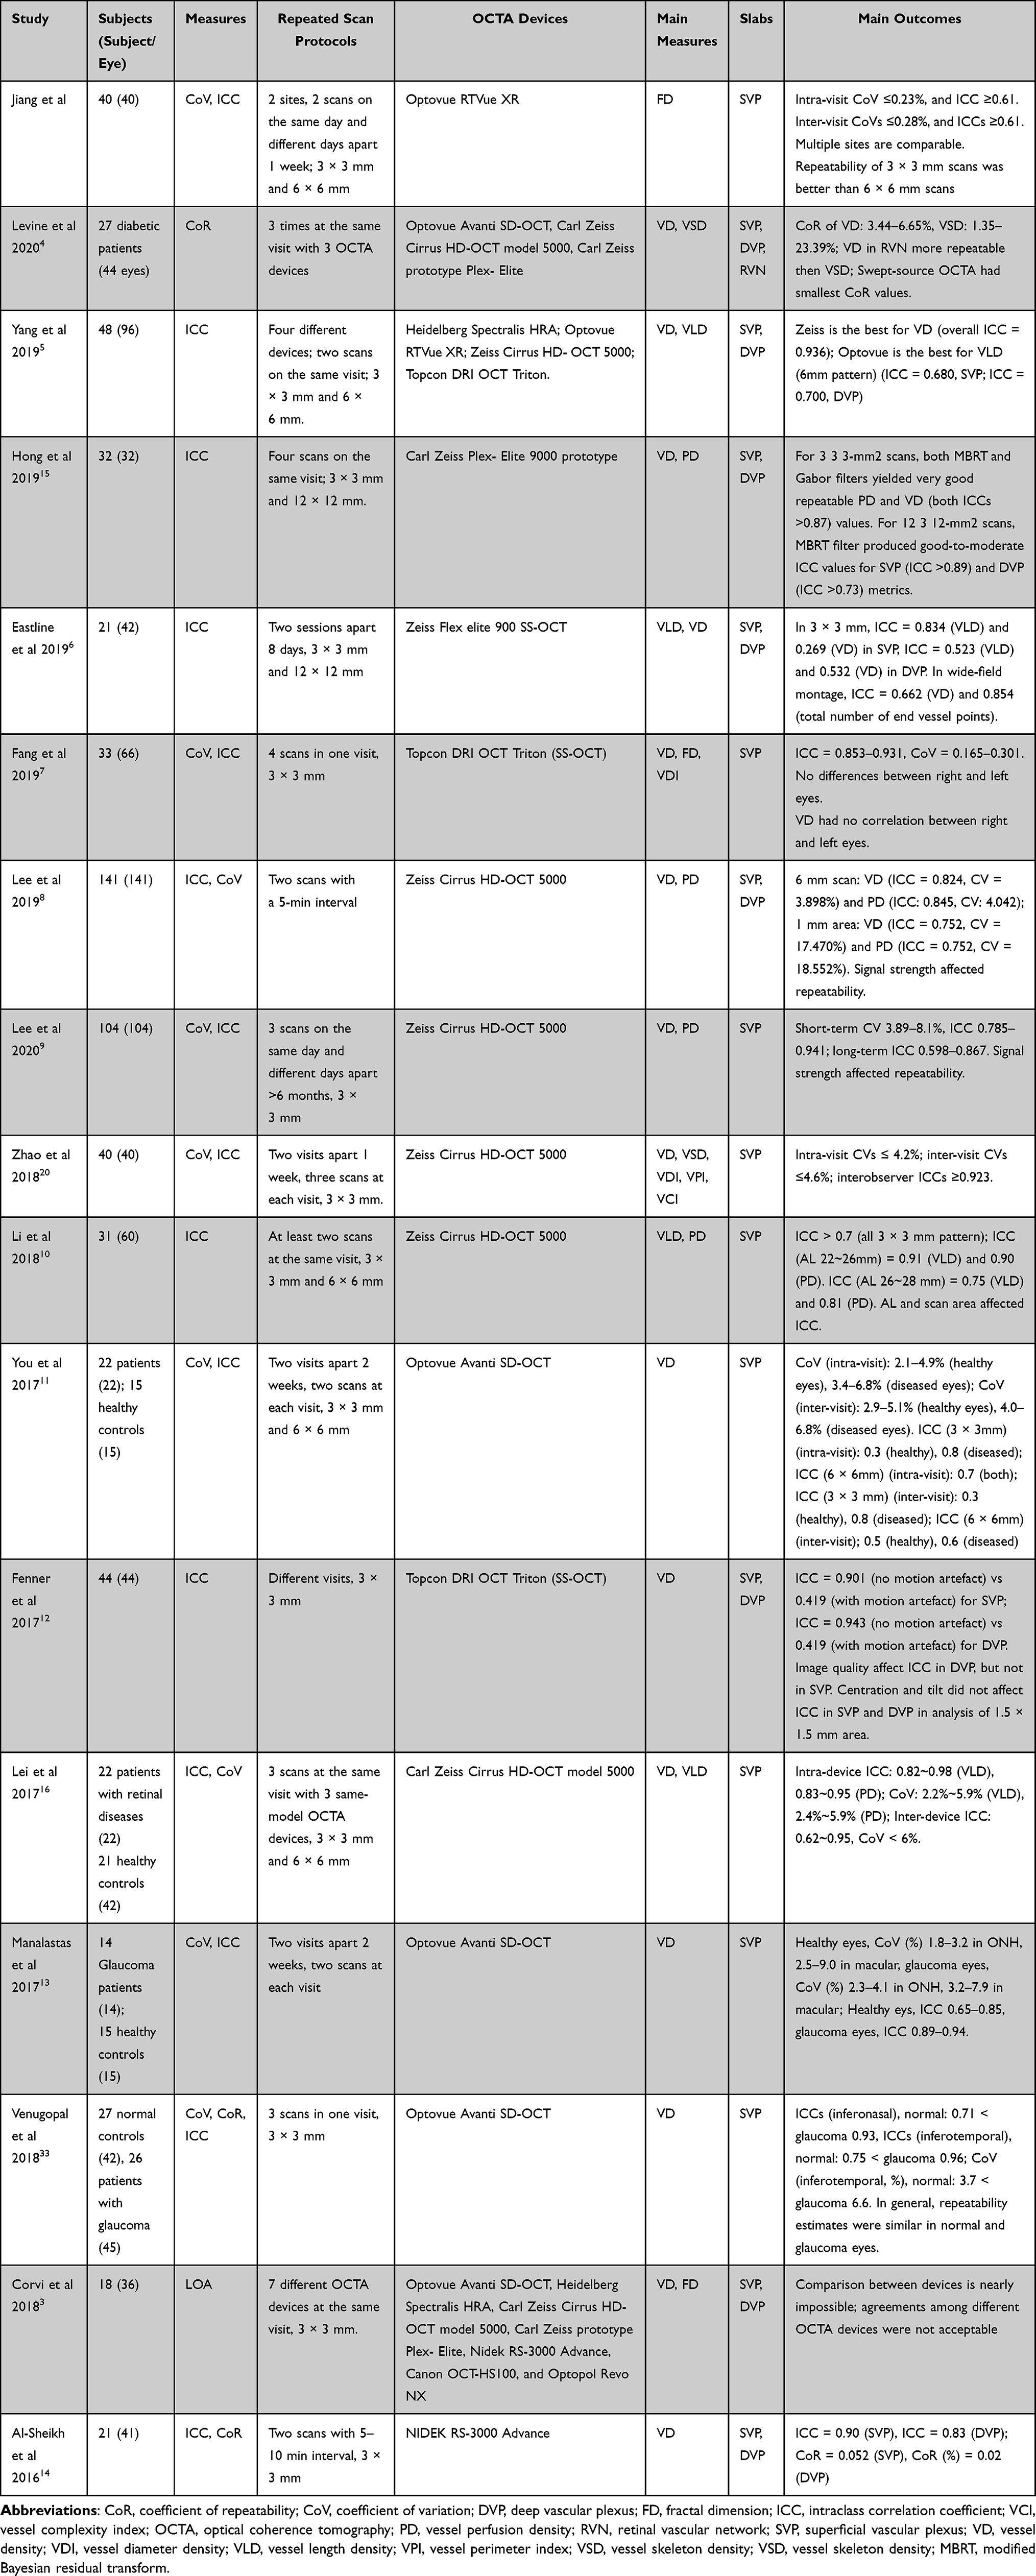 |
Table 2 Summary of Repeatability and Reproducibility of OCTA-Derived Quantification of Macular Vascular Density |
The image analysis approach used in this study differs from some previous studies that mainly used the pixel counting method (such as the proprietary OCTA software) to calculate the measurement repeatability.5,12,14 In the current study and some others,3,7 fractal analysis was used to calculate the CPD. Fractal analysis has been widely used in quantifying retinal large vessel density in vascular research for fundus photos,25,26 and retinal microvascular networks from OCTA.21,22,27–29 The vascular network provides an ideal vascular distribution with a fractal dimensional value of ~1.7 for the large vessels25,26 and ~1.8 for the capillary network.21,22,27,28 The present study and a previous study7 support the notion that fractal analysis offers highly repeatable measurements and thus provides a valuable tool in the field of vascular research.7,21,22,27,30
The CoVs found in the present study ranged from 0.17 to 0.28%, which are much smaller than those using pixel counting methods (about 10x, range 1–9%).7,11,13,14,16,19,20 Generally, the CoV <10% can be regarded as good repeatability. However, the CoV is a variability measure that is estimated and scaled by the magnitude of the measurement itself. Therefore, these values cannot be directly compared if the measurement scales are not the same. In other words, the CoV calculation is dependent on the mean measurements (ie, the denominator). The density based on the pixel-counting method (ie, counting the pixels occupied by vessels over a particular area) ranges typically from 30% to 50% for the SVP,7,11,13,14,16,19,20 while the fractal dimensions (ie, Dbox) range from 1.4 to 1.8.7,21,22,27,30 Therefore, the different analyses of the vessel density make it impossible to directly compare the CoVs between the present study and previous studies using vessel occupation ratios.7,11,13,14,16,19,20 The differences in CoVs between methods have been reported in an earlier study by Fang et al,7 who reported that the CoV of fractal dimension of the macular superficial vascular plexus was 0.165% for the left eyes and 0.184% for the right eyes. The CoVs of the vessel density using the pixel counting method ranged from 2.8% to 3.0% in the same cohort.7 The CoVs of fractal dimension in the present study have similar ranges compared to the CoVs of fractal dimension in the study by Fang et al.7
While the CoVs cannot be directly compared, the ICCs represent consistency or reproducibility of the measurements in intra-visit and inter-visit fashions, which can be directly compared. The good or excellent ICCs mean that most of the variation in vessel density quantification is due to individual differences rather than test variability. Previous studies showed the ICCs are good to excellent in repeated measurements on the same day or different days in healthy participants5,12,14,19,31 and slightly decreased in diseased eyes.11,13,16,31 Of note, ICCs ≥0.75 were used as the cut-off to represent the excellent ICCs in some of the previous studies,8,12 while other studies used ICCs ≥0.80 as the excellent ICCs.5 These thresholds are selected based on established guidelines.23,32 In the present study, the ICCs of the 3 × 3 mm scan protocol were greater than 0.80, which is “excellent”, while the ICCs of the 6 × 6 mm scan protocol were all greater than 0.60, which is “good”. Most importantly, both sites shared the same ICCs and showed a similar trend in that the 3 × 3 mm scan protocol yielded higher ICCs than the 6 × 6 mm scan protocol. This finding might be due to the different density of the A-scans between these scan protocols. The 304 × 304 A-scans cover a 3 × 3 mm scan area with a pixel interval of 10 µm, whereas in the 6 × 6 mm scan protocol, 400 × 400 A-scans cover a 6 × 6 mm scan area with a pixel interval of 15 µm. In addition, the scan period of the 6 × 6 mm scan protocols is slightly longer than the 3 × 3 mm scan protocol. Such differences in repeatability between scan protocols have also been reported in previous studies.10,11,13 Therefore, even though the scan area is small, the 3 × 3 mm scan protocol may be better suited for longitudinal and/or multi-site clinical studies.
There are some limitations in the present study. First, we did not compare the fractal analysis to other methods like the pixel-counting method. A previous study showed similar precision and ICCs between fractal analysis and pixel-counting based retinal vessel density.7 This work focused on comparing fractal analysis of the SVP between research sites using the same device, software version, and image analysis. Second, we did not use the same study cohorts to test repeatability between research sites. Although there were no significant differences in age and sex between study cohorts, unknown factors may exist between study cohorts, resulting in possible measurement bias. Indeed, we found similar repeatability and frequencies of outliers between sites, which suggests that the experiments are comparable and similar repeatability could be achieved. Third, we only tested healthy eyes in relatively young cohorts and did not include patients with diseased eyes. Previous studies showed a slight decrease in repeatability in diseased eyes compared to healthy eyes.11,16 However, those studies only ran on one research site and used vessel length and area as the density measurements. Further studies, including diseased eyes for fractal analysis of the vessel density, are needed in multiple site settings. Last, we did not analyze the vessel density in the partitioned region, as different regions may show different repeatability.16
In summary, our data showed that comparable high repeatability of OCTA-CPD can be achieved across two research sites using the same device, scan protocol, and image analysis. Scans with the 3 × 3 mm scan protocol appeared more repeatable than the 6 × 6 mm scans.
Ethics Statement
The research project was approved by the Institutional Review Board for Human Research at the University of Miami for both sites (ID 20191101). A detailed description of the study was provided to each participant, who then read and signed the approved written informed consent forms. The tenets of the Declaration of Helsinki were observed throughout the study.
Acknowledgments
Grant/financial support: P30 EY014801, P30 EY001583, R01 1R01NS111115, the Ed and Ethel Moor Alzheimer’s Disease Research Program (Florida Health, 20A05), Research to Prevent Blindness (RPB).
Disclosure
Dr Jessica IW Morgan reports grants from NIH, during the conduct of the study; grants from NIH, Foundation Fighting Blindness, Research to Prevent Blindness, Center for Advanced Retinal and Ocular Therapeutics, F. M. Kirby Foundation, Paul and Evanina Bell Mackall Foundation Trust and AGTC, outside the submitted work. In addition, Dr Jessica IW Morgan has a patent 8226236 issued to the University of Rochester, a patent US Patent App 16/389,942 pending to the University of Pennsylvania. The authors report no other conflicts of interest in this work.
References
1. Wang L, Murphy O, Caldito NG, Calabresi PA, Saidha S. Emerging applications of optical coherence tomography angiography (OCTA) in neurological research. Eye Vis. 2018;5:11. doi:10.1186/s40662-018-0104-3
2. Kashani AH, Chen CL, Gahm JK, et al. Optical coherence tomography angiography: a comprehensive review of current methods and clinical applications. Prog Retin Eye Res. 2017;60:66–100. doi:10.1016/j.preteyeres.2017.07.002
3. Corvi F, Pellegrini M, Erba S, Cozzi M, Staurenghi G, Giani A. Reproducibility of vessel density, fractal dimension, and foveal avascular zone using 7 different optical coherence tomography angiography devices. Am J Ophthalmol. 2018;186:25–31. doi:10.1016/j.ajo.2017.11.011
4. Levine ES, Arya M, Chaudhari J, et al. Repeatability and reproducibility of vessel density measurements on optical coherence tomography angiography in diabetic retinopathy. Graefes Arch Clin Exp Ophthalmol. 2020;258:1687–1695. doi:10.1007/s00417-020-04716-6
5. Yang J, Yuan M, Wang E, Chen Y. Comparison of the repeatability of macular vascular density measurements using four optical coherence tomography angiography systems. J Ophthalmol. 2019;2019:4372580. doi:10.1155/2019/4372580
6. Eastline M, Munk MR, Wolf S, et al. Repeatability of wide-field optical coherence tomography angiography in normal retina. Transl Vis Sci Technol. 2019;8:6. doi:10.1167/tvst.8.3.6
7. Fang D, Tang FY, Huang H, Cheung CY, Chen H. Repeatability, interocular correlation and agreement of quantitative swept-source optical coherence tomography angiography macular metrics in healthy subjects. Br J Ophthalmol. 2019;103:415–420. doi:10.1136/bjophthalmol-2018-311874
8. Lee TH, Lim HB, Nam KY, Kim K, Kim JY. Factors affecting repeatability of assessment of the retinal microvasculature using optical coherence tomography angiography in healthy subjects. Sci Rep. 2019;9:16291. doi:10.1038/s41598-019-52782-6
9. Lee MW, Nam KY, Lim HB, Koo HM, Shin YI, Kim JY. Long-term repeatability of optical coherence tomography angiography parameters in healthy eyes. Acta Ophthalmol. 2020;98:e36–e42. doi:10.1111/aos.14203
10. Li M, Jin E, Dong C, Zhang C, Zhao M, Qu J. The repeatability of superficial retinal vessel density measurements in eyes with long axial length using optical coherence tomography angiography. BMC Ophthalmol. 2018;18:326. doi:10.1186/s12886-018-0992-y
11. You Q, Freeman WR, Weinreb RN, et al. Reproducibility of vessel density measurement with optical coherence tomography angiography in eyes with and without retinopathy. Retina. 2017;37:1475–1482. doi:10.1097/IAE.0000000000001407
12. Fenner BJ, Tan GSW, Tan ACS, Yeo IYS, Wong TY, Cheung GCM. Identification of imaging features that determine quality and repeatability of retinal capillary plexus density measurements in OCT angiography. Br J Ophthalmol. 2018;102:509–514. doi:10.1136/bjophthalmol-2017-310700
13. Manalastas PIC, Zangwill LM, Saunders LJ, et al. Reproducibility of optical coherence tomography angiography macular and optic nerve head vascular density in glaucoma and healthy eyes. J Glaucoma. 2017;26:851–859. doi:10.1097/IJG.0000000000000768
14. Al-Sheikh M, Tepelus TC, Nazikyan T, Sadda SR. Repeatability of automated vessel density measurements using optical coherence tomography angiography. Br J Ophthalmol. 2017;101:449–452. doi:10.1136/bjophthalmol-2016-308764
15. Hong J, Tan B, Quang ND, et al. Intra-session repeatability of quantitative metrics using widefield optical coherence tomography angiography (OCTA) in elderly subjects. Acta Ophthalmol. 2019. doi:10.1111/aos.14327
16. Lei J, Durbin MK, Shi Y, et al. Repeatability and reproducibility of superficial macular retinal vessel density measurements using optical coherence tomography angiography en face images. JAMA Ophthalmol. 2017;135:1092–1098. doi:10.1001/jamaophthalmol.2017.3431
17. Jia Y, Bailey ST, Hwang TS, et al. Quantitative optical coherence tomography angiography of vascular abnormalities in the living human eye. Proc Natl Acad Sci U S A. 2015;112:E2395–E2402. doi:10.1073/pnas.1500185112
18. Jia Y, Tan O, Tokayer J, et al. Split-spectrum amplitude-decorrelation angiography with optical coherence tomography. Opt Express. 2012;20:4710–4725. doi:10.1364/OE.20.004710
19. Carpineto P, Mastropasqua R, Marchini G, Toto L, Di NM, Di AL. Reproducibility and repeatability of foveal avascular zone measurements in healthy subjects by optical coherence tomography angiography. Br J Ophthalmol. 2016;100:671–676. doi:10.1136/bjophthalmol-2015-307330
20. Zhao Q, Yang WL, Wang XN, et al. Repeatability and reproducibility of quantitative assessment of the retinal microvasculature using optical coherence tomography angiography based on optical microangiography. Biomed Environ Sci. 2018;31:407–412. doi:10.3967/bes2018.054
21. Jiang H, Wei Y, Shi Y, et al. Altered macular microvasculature in mild cognitive impairment and Alzheimer disease. J Neuroophthalmol. 2018;38:292–298. doi:10.1097/WNO.0000000000000580
22. Wei Y, Jiang H, Shi Y, et al. Age-related alterations in the retinal microvasculature, microcirculation, and microstructure. Invest Ophthalmol Vis Sci. 2017;58:3804–3817. doi:10.1167/iovs.17-21460
23. Cicchetti DV. Multiple comparison methods: establishing guidelines for their valid application in neuropsychological research. J Clin Exp Neuropsychol. 1994;16:155–161. doi:10.1080/01688639408402625
24. Wang H, Hu H, Gregori G, Zhang J, Jiang H, Wang J. The effect of software versions on the measurement of retinal vascular densities using optical coherence tomography angiography. Curr Eye Res. 2020;46:341–349.
25. Macgillivray TJ, Patton N. A reliability study of fractal analysis of the skeletonised vascular network using the “box-counting” technique. Conf Proc IEEE Eng Med Biol Soc. 2006;1:4445–4448.
26. Talu S. Multifractal geometry in analysis and processing of digital retinal photographs for early diagnosis of human diabetic macular edema. Curr Eye Res. 2013;38:781–792. doi:10.3109/02713683.2013.779722
27. Lin Y, Jiang H, Liu Y, et al. Age-related alterations in retinal tissue perfusion and volumetric vessel density. Invest Ophthalmol Vis Sci. 2019;60:685–693. doi:10.1167/iovs.18-25864
28. Deng Y, Li M, Wang G, et al. The inter-visit variability of retinal blood flow velocity measurements using retinal function imager (RFI). Eye Vis. 2018;5:31. doi:10.1186/s40662-018-0124-z
29. Yang Y, Wang J, Jiang H, et al. Retinal microvasculature alteration in high myopia. Invest Ophthalmol Vis Sci. 2016;57:6020–6030. doi:10.1167/iovs.16-19542
30. Gadde SG, Anegondi N, Bhanushali D, et al. Quantification of vessel density in retinal optical coherence tomography angiography images using local fractal dimension. Invest Ophthalmol Vis Sci. 2016;57:246–252. doi:10.1167/iovs.15-18287
31. Douma I, Rousseau D, Sallit R, Kodjikian L, Denis P. Toward quantitative and reproducible clinical use of OCT-angiography. PLoS One. 2018;13:e0197588. doi:10.1371/journal.pone.0197588
32. Diedenhofen B, Musch J, Olivier J. cocor: a comprehensive solution for the statistical comparison of correlations. PLoS One. 2015;10:e0121945. doi:10.1371/journal.pone.0121945
33. Venugopal JP, Rao HL, Weinreb RN, et al. Repeatability of vessel density measurements of optical coherence tomography angiography in normal and glaucoma eyes. Br J Ophthalmol. 2018;102:352–357. doi:10.1136/bjophthalmol-2017-310637
 © 2022 The Author(s). This work is published and licensed by Dove Medical Press Limited. The full terms of this license are available at https://www.dovepress.com/terms.php and incorporate the Creative Commons Attribution - Non Commercial (unported, v3.0) License.
By accessing the work you hereby accept the Terms. Non-commercial uses of the work are permitted without any further permission from Dove Medical Press Limited, provided the work is properly attributed. For permission for commercial use of this work, please see paragraphs 4.2 and 5 of our Terms.
© 2022 The Author(s). This work is published and licensed by Dove Medical Press Limited. The full terms of this license are available at https://www.dovepress.com/terms.php and incorporate the Creative Commons Attribution - Non Commercial (unported, v3.0) License.
By accessing the work you hereby accept the Terms. Non-commercial uses of the work are permitted without any further permission from Dove Medical Press Limited, provided the work is properly attributed. For permission for commercial use of this work, please see paragraphs 4.2 and 5 of our Terms.