")
Back to Journals » OncoTargets and Therapy » Volume 12
MTSS1 inhibits metastatic potential and induces G2/M phase cell cycle arrest in gastric cancer
Authors Liu K, Jiao XD, Hao JL, Qin BD, Wu Y, Chen W, Liu J, He X, Zang YS
Received 28 January 2019
Accepted for publication 10 May 2019
Published 2 July 2019 Volume 2019:12 Pages 5143—5152
DOI https://doi.org/10.2147/OTT.S203165
Checked for plagiarism Yes
Review by Single anonymous peer review
Peer reviewer comments 2
Editor who approved publication: Prof. Dr. Geoffrey Pietersz
Ke Liu,1,* Xiao-Dong Jiao,1,* Jie-Lu Hao,2 Bao-Dong Qin,1 Ying Wu,1 Wei Chen,3 Jun Liu,1 Xi He,1 Yuan-Sheng Zang1
1Department of Medical Oncology, Changzheng Hospital, Naval Medical University, Shanghai, People’s Republic of China; 2Department of Nephrology, Changzheng Hospital, Naval Medical University, Shanghai, People’s Republic of China; 3Department of Pharmacy, Changzheng Hospital, Naval Medical University Shanghai, People’s Republic of China
*These authors contributed equally to this work
Background: Metastasis suppressor 1 (MTSS1), a potential metastasis suppressor gene associated with tumor progression, may play an important role in cancer development. Our previous study demonstrated that MTSS1 was downregulated significantly when gastric cancer (GC) progressed and metastasized, suggesting that MTSS1 may be involved in the physiopathologic mechanism of GC.
Purpose: The objective of this study was to evaluate the effect of MTSS1 expression on the biological behavior of gastric cancer cell both in vitro and in vivo.
Materials and methods: The gain-and-loss function of MTSS1 in GC cells were analyzed after transfection with pEGFP-N1-MTSS1 and ShRNA431. Proliferation and invasion abilities were measured by means of plate clone formation assay and transwell assay. To further explore the underlying mechanism of MTSS1-induced tumor restrain, cell cycle distribution was analyzed using flow cytometry.
Results: The results revealed that overexpression of MTSS1 significantly reduced proliferation, migration and invasion of GC cells in vivo and in vitro, while downregulation of MTSS1 had the opposite biological manifestations. Moreover, overexpression of MTSS1 induced accumulation of GC cells in G2/M phase, increased phosphorylated Cdc2 expression and decreased Cdc25C and cyclinB1 levels, suggesting MTSS1 could cause G2/M cell cycle arrest.
Conclusion: Our data provided insight into an important role for MTSS1 in suppressing tumor cell proliferation, invasion and migration, indicating that MTSS, as a functional tumor suppressor in GC, could be a potential therapeutic target to prevent GC metastasis.
Keywords: MTSS1, Gastric Cancer, Tumor Suppressor, AGS cells, MGc80-3 cells
Introduction
Gastric cancer (GC) is the fifth most common cancer worldwide, and the incidence rates of GC are highest in Eastern Asia.1 By 2002, the number of GC patients in China accounts for approximately 40% of worldwide occurrences. It is estimated that 400,000 new GC cases and 300,000 deaths occurred each year in China. Despite advances being made in preventive measures and early diagnosis, over the past decade, GC still ranks the second leading cause of cancer-related death.2 According to the Japanese GC Association (JGCA) data collected from 208 participating hospitals during 2002 to 2008, most early treatment of primary GC at stage IA achieved beneficial outcomes by the estimated 5-year survival rate of 92%.3 However, more than half of radically resected GC patients relapse locally or with distant metastases. The median overall survival rarely exceeds 12 months, and 5-year survival is <10% because of lack of effective biomarkers to assess bioprocess of GC.4 Therefore, it is an urgent need to reveal the mechanisms of carcinogenesis of GC and find more therapeutic targets.
Metastasis suppressor-1 (MTSS1), as a metastasis suppressor gene, belongs to IRSp53 and MIM (missing in metastasis) domain-family (IMD-family) mapped to human chromosome 8q24.1, which is missing in metastatic bladder carcinoma cell lines, suggesting it may play an important role in invasion and metastatic behavior.5 Accumulated evidence indicated that downregulation of MTSS1 was associated with unfavorable clinical and pathological features as well as poor prognosis in various types of cancer such as breast cancer and esophageal cancer.6–8 Controversially, opposite results were also proposed in colorectal cancer, hepatocellular carcinoma, cervical cancer and lung squamous cell carcinoma.9–12 Recently, Ling et al13 showed that MTSS1 has various roles in different subtypes of non-small cell lung cancer (NSCLC), suggesting the expression patterns and biological roles of MTSS1 might be tissue-type specific.
Our previous study demonstrated that MTSS1 expression was missing in GC patients’ samples and associated with poor prognosis.14 However, little is known about its biological effect in GC. In this study, we explored the role of MTSS1 in GC cell proliferation, migration and invasion. Besides, we also investigated the underlying mechanisms to provide a novel therapeutic target.
Materials and methods
Cell lines
Human GC cell lines MKN45, MKN28, AGS, BCG-823, SGC-7901, HGC-27, MGc80-3, SH-10-TC, N87and gastric epithelial cell line GES were obtained from Institute of Biochemistry and Cell Biology of the Chinese Academy of Science (Shanghai, China). All the cells were maintained in RPMI-1640 medium (Gibco, Grand Island, NY, , USA), containing 10% FBS(Biowest, Maine et Loire, France), 100 U/mL penicillin, 100 μg/mL streptomycin sulfate and 1 mmol/L sodium pyruvate with 5% CO2 at 37°C.
Western blot
Total protein was extracted from GC cells. Briefly, cells were washed by ice PBS, disrupted by lysate and Phenylmethanesulfonyl fluoride (PMSF), and then the insoluble tissue debris was removed by centrifugation at 10,000×g for 5 mins. Western blotting was performed as described previously.14 pAb to phospho-cdc2 (Tyr15) was purchased from New England Biolabs (Ipswich, MA, USA). pAb to Cdc25C (sc-327), monoclonal antibody toCdc2 (sc-54) and cyclin B1 (sc-245) were from Santa Cruz Biotechnology (Dallas, TX, USA). Amersham enhanced chemiluminescence system was used to detect the probe proteins. Equal protein sample loading was monitored with an anti-β-actin antibody.
qRT-PCR
RNA was isolated with the TRIzol method and analyzed for purity via nanodrop. PCR amplification was carried out with Ex Taq DNA polymerase reaction system (Takara, Kyoto, Japan) by TProfessional PCR (Biometra, Jena, Germany). The primer sequences for MTSS1 were as follows: 5ʹ-ACATGGCCACCAACACACGTG-3ʹ (forward) and 5ʹ- CGAAAACTGCCTCAGCTTGGCT-3ʹ (reverse). The primer sequences for glyceraldehyde-3-phosphate dehydrogenase (GAPDH) primers were as follows: 5ʹ-ACCCACTCCTCCACCTTTGA-3ʹ (forward) and 5ʹ-CTGTTGCTGTAGCCAAATTCGT-3ʹ (reverse). Conditions for PCR were 94°C 4 mins, 30 s at 94°C for denaturation, 30 s at 60°C for annealing and 90 s at 72°C for elongation (30 cycles). The RT-PCR products were analyzed on 1% agarose gel and visualized with ethidium bromide staining. Quantity of the target was normalized against the quantity of GAPDH.
Plasmid construction and cell transfection
All the experiments of upregulated MTSS1 were divided into three groups: A: control group; B: blank-loaded transfection group; C: experimental group. pEGFP-N1 was purchased from Invitrogen (CA, USA). pEGFP-N1-MTSS1 eukaryotic expression vector was assisted designed by the Biotechnology Company (Genechem, Shanghai, China). AGS cells were transfected with pEGFP-N1-MTSS1 or empty vector pEGFP-N1 by LipofectMINE2000TM Reagent (Invitrogen) according to the manufacturer’s specifications. The plasmid expressing GFP (Green fluorescent protein) was used to evaluate the transfection efficacy. G418-resistant (Sigma, MO, USA) colonies at a concentration of 1 mg/mL were selected for further use.
shRNA preparation and transfection
Experiments of downregulated MTSS1 were also divided into three groups. shRNA431 was synthesized by GenePharma (Shanghai, China). The shRNA sequences were described as follows: MTSS1-homo-431: 5ʹ-GUC UCU CGG AAG GUG AAA UTT-3ʹ (forward) and 5ʹ-AUU UCA CCU UCC GAG AGA CTT-3ʹ (reverse). The negative control shRNAs were designed as follows: 5ʹ-UUCUCCGAACGUGUCACGUTT-3ʹ (forward) and 5ʹ- ACGUGACACGUUCGGAGAATT-3ʹ (reverse). GAPDH-positive control shRNAs were described as follows: 5ʹ-GUA UGA CAA CAG CCU CAA G-3ʹ (forward) and 5ʹ-CUU GAG GCU GUU GUC AUA CTT-3ʹ (reverse). The transfections of shRNA were carried out with LipofectMINE2000TM Reagent in 6-well plates. Until 50–70% confluence is reached, MGc80-3 cells were transfected with 20 nM of shRNA for 6–12 hrs and then replaced with the regular growth media. 24–72 hrs post-transfection, cells were either harvested for validation or replaced for additional analysis.
Cell proliferation assay
Cells were seeded into 96-well culture plates at a density of 2×10³ cells in a final volume of 200 μl/well and incubated at 37°C for 8 days. At the day of 0, 1, 2, 3, 4 and 8, the samples were treated with 20 μL MTT storage solution (5 mg/mL) and cultured for another 4 hrs. Then, absorbance was detected at 490 nm using an ELISA plate reader. Growth curves were drawn by measured data.
Colony formation assay
Stably transfected AGS and MGc80-3 cells were cultured in 6-well plates (1000 per well) at 37°C until cell colony was settled. The colonies with cell numbers of >50 cells were fixed in cold methanol and stained with H&E. The colonies were counted under an inverted phase microscope (Tokyo,Olympus, Japan) and photographed.
Transwell migration/invasive assay
Transwell migration assay was performed using polycarbonate transwell filters ( 8 μmCorning, New York, NY, USA). 1×10⁵ cells/well/200 μL were plated on the upper chamber, and 1640 culture medium containing 10% FBS was filled into the bottom chambers. After incubation at 37°C for 24 hrs, cells on the upper surface were removed, and then cells on the lower surface were fixed in cold methanol and stained with 0.4% crystal violet (Sigma, Shanghai, China). The number of transmigrated cells in five random fields on the underside of the filter was counted and photographed. To perform transwell invasion assay, each membrane was coated with 15 μg of Matrigel matrix (Gibco), which was rehydrated by adding 45 μL of serum-free medium. After incubating at 37°C for 4 hrs, the Matrigel solidified and served as the extracellular matrix for analysis of tumor cell invasion. Subsequent steps were the same as the transwell migration assay.
Cell cycle analysis
Cells were fixed in 70% ethanol at 4°C overnight and then stained with PI at 4°C in shade overnight. The fractions of the cells in the G0/G1, S and G2/M phases were analyzed by flow cytometry (EPICS-ELITE-ESP, Coulter, Glanville, MI, USA).
Vivo tumorigenicity
Cells (1×10⁷/mL) were injected subcutaneously into the right flank of nude mice. Mice were kept in a sterile environment and randomized into three mice per group. Body weight, health status and growth of subcutaneous nodules were observed regularly. Tumor volume was measured as the following formula: tumor volume=Length (L)×Width (W)2/2. 6 weeks later, the mice were sacrificed, and the tumor tissues were weighed. All procedures pertaining to animal care and treatments strictly adhered to the recommendations in the Guide for the Care and Use of Laboratory Animals (US National Research Council, 11016). The study was conducted in accordance with the ethical procedures and policies approved by the Administrative Committee of the Experimental Animal Care and Use of Second Military Medical University (viz. Naval Medical University) (SMMU, License No.20130602).
Statistical analysis
All the experiments were repeated three times. All calculations were performed with SPSS version 13.0. The statistical analyses were performed with a Student t-test and analysis of variance. The Chi-square test was used for analysis correlation and rates. P<0.05 was considered statistically different.
Results
MTSS1 expression in GC and epithelial cell lines
Initially, we tried to identify if MTSS1 expression was changed among different malignant cell lines of GC. For this purpose, we examined MTSS1mRNA and protein level in GC lines including MKN45, MKN28, AGS, BCG-823, SGC-7901, HGC-27, MGc80-3, SH-10-TC, N87 as well as human immortalized gastric mucosa epithelial cell line GES. As shown in Figure 1, we could observe high MTSS1 mRNA expression in all GC cell lines compared with GES. However, the MTSS1 protein expression was varied among these GC cell lines. The human undifferentiated HGC-27cells, poorly differentiated MGc-803cells as well as SGC-7901 had relatively higher MTSS1 protein expression than GES cell line. Another GC cell lines exhibited lower MTSS1 protein expression, especially AGS, BCG-823, SH-10-TC and MKN45. Collectively, the expression of MTSS1 was varied among different GC cell lines, which may be related to histologic differentiation grade.
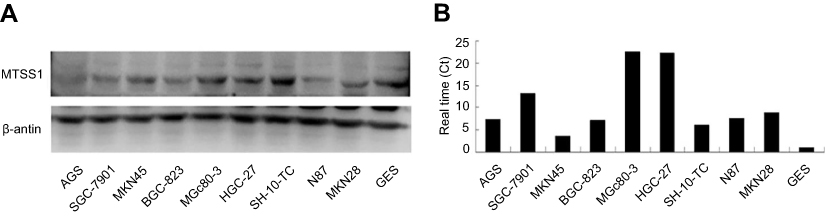 |
Figure 1 Analysis of MTSS1 expression in human gastric cancer epithelial cell lines. Western blot (A) and qRT-PCR (B) revealed the variety of MTSS1 expression in protein and mRNA levels.MTSS-1, Metastasis suppressor 1; qRT-PCR, Quantitative Reverse Transcription PCR. |
Elevated MTSS1 inhibits GC growth in vitro and in vivo
To investigate the role of MTSS1 in GC,AGS cells were transfected with pEGFP-N1-MTSS1 (MTSS1-AGS group) to overexpress MTSS1. The expression of MTSS1 was significantly observed upregulated by Western blot and qRT-PCR (Figure 2A). Cell viability analysis showed that elevated expression of MTSS1significantly suppressed cell proliferation in MTSS1-AGS cells compared with control vector (Vec-AGS group) (Figure 2B).The inhibitory effect on AGS cell proliferation was further confirmed by colony formation assay (Figure 2C). To validate whether MTSS1 could inhibit the tumorigenic activity of AGS cells in vivo, we examined tumor burden in immunodeficient mice. The results showed that tumorigenic activity was significantly inhibited in MTSS1-AGS implanted nude mice compared with Vec-AGS or negative control (Figure 2D). As shown in Figure 2E, the tumor development was also suppressed by testing of tumor masses and volumes when MTSS1 was overexpressed. Together, these data indicated that MTSS1 may act as tumor suppressor in GC growth.
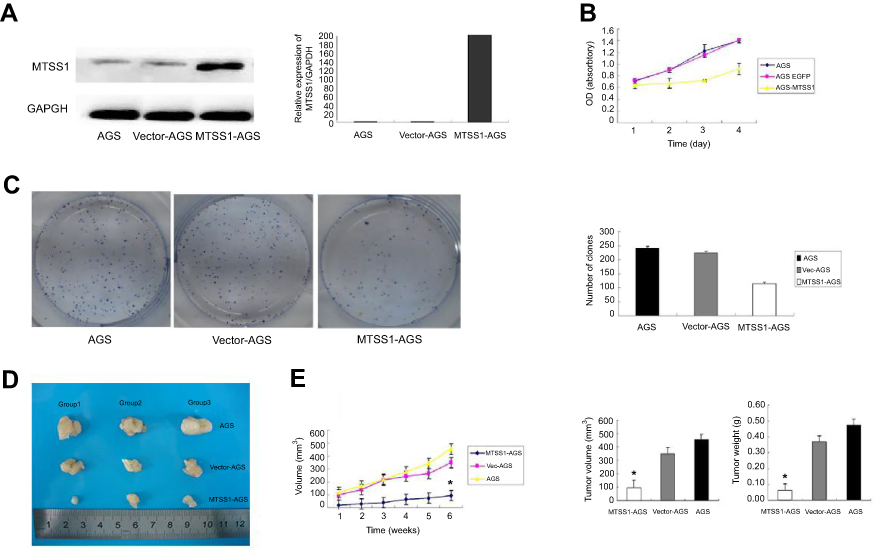 |
Figure 2 Effect of MTSS1 on tumor growth. AGS cells were transfected with 5 ug pEGFP-N1-MTSS1, control vector or transfection reagent for 48 hrs. (A) the protein and mRNA expression level of MTSS1 using Western Blot and qRT-PCR (B) Cell growth curves by MTT assay showed suppressing of cell growth in MTSS1-AGS cells. (C) Colony formation assay indicated the inhibition of colony numbers in MTSS1-AGS cells. (D) Nude mice were injected with 107 MTSSA-AGS or vector cells, and tumor size was determined. (E) Tumor masses and volumes for three groups are compared. Data were expressed as mean ± SD (n=3), *P<0.05 versus control. |
Overexpression of MTSS1 restrains migration and invasion of AGS cells
To further address the effect of MTSS1 on invasive and migratory ability, transwell assay was performed. The results showed that MTSS1-AGS cells had, respectively, 2.2-fold and 2.0-fold decreased migratory ability compared to AGS cells and Vec-AGS cells (Figure 3A). Consistently, transwell invasive assay demonstrated that MTSS1-AGS cells had a significant 5.8-fold decreased ability of invasion compared to Vec-AGS group and 6.8-fold decreased ability compared to untreated AGS cells (Figure 3B). These results further demonstrated that ectopic MTSS1 expression affected cell migration and invasion in GC cells.
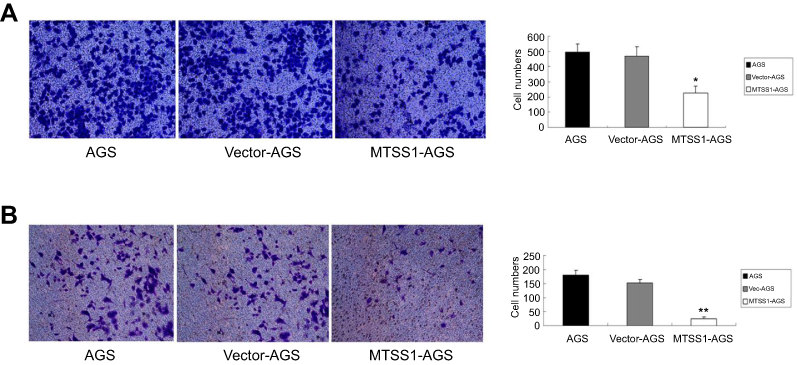 |
Figure 3 Overexpression of MTSS1 restrains migration and invasion of AGS cells. AGS cells were transfected with 5 ug pEGFP-N1-MTSS1, control vector or transfection reagent for 48 hrs. (A) Transwell migration cell counting was determined. Data were expressed as mean ± SD (n=3), *P<0.05 versus control. (B) Transwell invasive assay was performed by cell counting. Data were expressed as mean±SD (n=3), **P<0.05 versus control. |
Loss of MTSS1 enhances GC growth
Having proved that upregulated MTSS1 resulted in less proliferative, invasive and migratory phenotype in AGS cells, we next constructed MTSS1 silenced GC cells to further substantiate the functional significance of MTSS1 in GC. MGc80-3 cells with relatively high level of MTSS1 were transfected with ShRNA431 (shRNA-MTSS1 group) or negative control shRNA (NC group) to establish a transient knockdown of MTSS1 expression. The MTSS1 expression was dramatically reduced in shRNA-MTSS1 cells versus control cells (Figure 4A). Next, cell proliferation was evaluated by MTT assays. As shown in Figure 4B, silenced expression of MTSS1 promoted cell growth in shRNA431-803 cells. Furthermore, the colony formation assay showed that the shRNA431-803 cells possessed a significantly higher colony forming efficiency (Figure 4C). Meanwhile, MGc80-3 cells transfected with shRNA431 were injected subcutaneously into nude mice to assess tumor growth. On the contrary, in silencing MTSS1 model, shRNA431-803 group had more tumorigenic activity and higher amount of tumor mass and volume compared to negative control group (Figure 4D and E). The results demonstrated that loss of MTSS1 expression had a positive effect on tumor growth in GC.
 |
Figure 4 Loss of MTSS1 promotes tumor growth in vitro and in vivo. MGc80-3 cells were transfected with 20 nM of shRNA, control vector or transfection reagent for 6–12 hrs. (A) Significant reduction of MTSS1 expression was observed by Western blot and real-time PCR. (B) MTT assay to determine cell proliferation by cell growth curve. (C) Colony formation assay to verify the colony forming efficiency. Data were expressed as mean ± SD (n=3), *P<0.05 versus control. (D) shRNA-MTSS1 implanted nude mice to measure the tumor size. (E) Tumor masses and volumes for three groups are compared. Data were expressed as mean ± SD (n=3), **P<0.05 versus control. |
Inhibition of MTSS1 leads to invasive and migratory phenotype of MGc80-3 cells
We next investigated the effect of MTSS1 knockdown on cell invasion and migration. As shown in Figure 5A, shRNA431-803 cells had significantly elevated migratory ability (2.2-fold, 2.1-fold, respectively) compared to MGc80-3 and NC cells. Additionally, similar to the results seen in the migratory ability, silencing MTSS1 exhibited significance of 3.1-fold and 3.6-fold increase in invasion compared with untreated and NC cells, respectively (Figure 5B). These results suggested that loss of MTSS1 promoted cell migration and invasion.
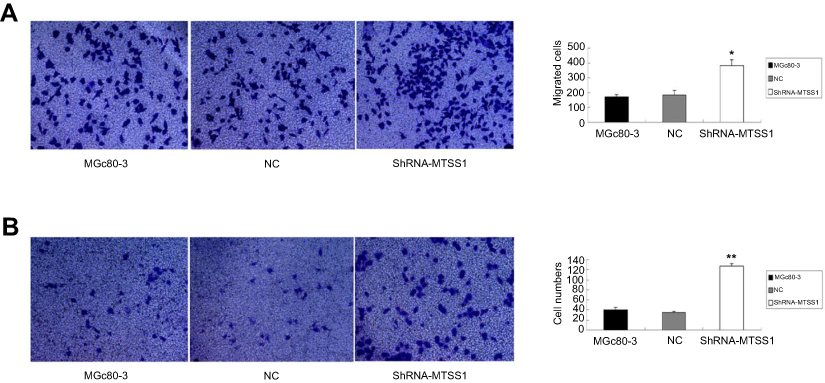 |
Figure 5 Inhibition of MTSS1 leads to invasive and migratory phenotype of MGc80-3 cells. MGc80-3 cells were transfected with 20 nM of shRNA, control vector or transfection reagent for 6–12 hrs. (A) Transwell migration assay was determined. Data were expressed as mean±SD (n=3), *P<0.05 versus control. (B) Transwell invasive assay was performed by cell counting. Data were expressed as mean ± SD (n=3), **P<0.05 versus control. |
MTSS1 acts as tumor suppressor by arrest cell cycle progression at G2/M phase
Previous results suggested that MTSS1 participated in the growth, migration and invasion of gastric tumor. To further explore the underlying mechanism of MTSS1-induced tumor restrain, cell cycle was assessed by flow cytometry. The result showed that MTSS1-AGS cells transfected with pEGFP-N1-MTSS1 had higher number of cells in G2/M phase compared with the empty vector or untreated control (Figure 6A). However, in MGc80-3 cells transfected with shRNA431, cell cycle detection showed no significant statistical difference compared with control groups. To further validate whether MTSS1 could induce cell cycle arrest at the G2/M phase, we focused on the effect of MTSS1 on Cdc2 phosphorylation and cyclin B1 location. Cdc2 is identified to be a representative cyclin-dependent kinase directly regulating G2-M transition, and it is phosphorylated at Tyr-15 in the G2 phase but is dephosphorylated in the M phase. Cdc25c is M-phase inducer phosphatase 3, which could direct dephosphorylation of Cdc2 and triggers entry into mitosis. Another important biomarker of G2-M phase is cyclin B1, which is localized in the cytoplasm in the G2 phase but translocated to the nucleus in the M phase. Then, we determined the protein expression level of Cdc2, p-Cdc2, Cdc25c as well as cyclinB1 between the transfected cells and controls. As shown in Figure 6B, Western blot showed that phosphorylated Cdc2 was significantly higher when MTSS1 was overexpressed. And other G2/M related proteins such as Cdc25C and cyclinB1 levels were found to decrease modestly after MTSS1 transfection. These results suggested that MTSS1 might participate in the regulation of gastric carcinomas through affecting the G2/M checkpoint.
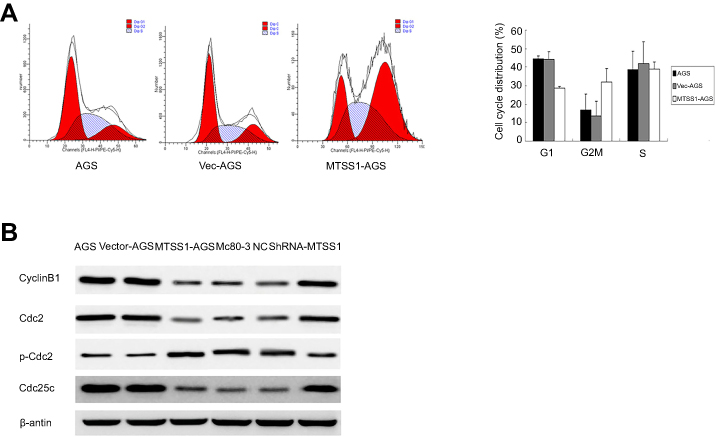 |
Figure 6 The effect of MTSS1 on the cell cycle. (A) Flow cytometry analysis to verify the G2/M phase populations of MTSS1-AGS cells compared with control AGS or Vec-AGS cells. (B) Western blot analysis was performed to determine cell cycle protein. |
Discussion
Our previously intriguing findings demonstrated that MTSS1 was downregulated in GC tissue and associated with patients’ survival. To address the functional effect of MTSS1 on GC, we performed the present study to explore the effect of MTSS1 on the growth, migration and invasion of GC cell and elucidate the potential mechanism. First, we found that overexpression of MTSS1 could suppress cell growth in vivo and in vitro, whereas loss of MTSS1 could enhance cell growth. Second, overexpression of MTSS1 by transfecting with pEGFP-N1-MTSS1 could inhibit migration and invasion of cancer cell both in GC cell line and in nude mice model. Conversely, shRNA-mediated knockdown of MTSS1 has opposite effect on GC cell migration and invasion. Besides, we further analyzed the effect of MTSS1 on cell cycle to elucidate the underlying mechanism on how MTSS1 could inhibit GC growth, and the results demonstrated MTSS1 could cause G2/M cell cycle arrest. Altogether, these observations clearly highlight the critical role of MTSS1 as a tumor suppressor in GC.
In 2002, Lee etal firstly identified a gene deleted from metastatic bladder cancer cell lines by mRNA differential display technique, and sequenced to transcript mapped to 8q24.1, which then was named as MIM, as known as MTSS1.5 It remained controversial about the role of MTSS1 in cancer development. Some studies have demonstrated that MTSS1 played a significant role in inhibiting cancer development, and MTSS1 was identified to be an indicator of prognosis and good survival such as prostate cancer, bladder cancer and breast cancer.6–8,15–19 More recently, several studies yielded opposite results that elevated level of MTSS1 was associated with poor prognosis such as colorectal cancer, hepatocellular carcinoma, etc.9–12,20,21 These controversial results suggest the tissue-specific effect of MTSS1 in cancer development. In 2010, our previous study observed that downregulation of MTSS1 is associated with nodal metastasis and poor outcome in Chinese patients with GC.14 However, the effect of MTSS1 on GC cell was not fully clear, then we conducted the present study to elucidate the potential role of MTSS1 in the growth, migration and invasion of GC cells. Our current study initially examined the expression of MTSS1 in different GC cell lines and found that MTSS1 expression levels were varied among different GC cell lines. The results suggested that MTSS expression level may be related to histologic differentiation grade.
Based on the MTSS1 expression level, we selected AGS cells and MGc80-3 cells to verify the effect of MTSS1 on tumor cell proliferation, migration and invasion via transfecting with pEGFP-N1-MTSS1 and shRNA, respectively. Loss and gain function analysis revealed MTSS1 could inhibit GC cell proliferation, invasion as well as migration. This inhibitory effect could be also observed in other types of tumors. Taylor et al have found that overexpression of MTSS1 in NCI-H1299 decreased in vitro lung adenocarcinoma invasion and migration, while knockdown of MTSS1 in A549 caused a significant increase in cell invasion and migration. Meanwhile, MTSS1 expression in lung adenocarcinoma was associated with decreased metastatic burden, as assessed by an in vivo orthotopic model.22 Other studies also found that overexpression of MTSS1 could reduce the growth, invasion, adhesion and migration of kidney cell and bladder cell in vitro.23,24 MTSS1 is a good candidate as a scaffold protein involved in action dynamics. Several studies have investigated the underlying mechanisms of MTSS1 on invasion and migration of cancer cell. One potential mechanism was that MTSS1 could prevent invasion and metastasis of tumor cell by increasing Rac-GTP levels in order to inhibit cell–cell junction disassembly, thereby elevating actin assembly at the cell–cell contacts and preventing cellular dissemination.25 MTSS1 also could interact with actin, preferentially ATP-bound G-actin, an active form of actin for polymerization, suggesting MTSS1 may have the potential to control the elongation of actin filaments and undesired nucleation.26 Besides, previous studies also demonstrated that MTSS1 could inhibit tumor metastasis via interacting with cortactin, cell membrane and RPTP (Receptor-type protein tyrosine phosphatase) delta.19 Meanwhile, MTSS1 may be involved in the PDGF(Platelet-derived growth factor) signaling and SHH (Sonic hedgehog) signaling pathway that regulates cell shape changes via protein tyrosine kinases.27,28 Recently, Wag has assessed the role of MTSS1 in GC. Consistent with our result, they also found MTSS1 could diminish the cell viability, attenuate the invasion ability and cause a loss of migratory potential.29 The further mechanism investigation demonstrates that MTSS1 could repress TGF-β1-induced EMT (Epithelial-Mesenchymal Transition), and MTSS1 could be positively regulated by PTEN (Phosphatase and tennis homolog) as a tumor suppressor by inactivating PI3K/AKT oncogenic pathway. In pancreatic ductal adenocarcinoma, Zeleniak reported PTEN could form a complex with MTSS1 in order to stabilize and protect MTSS1 from proteasomal degradation, eventually causinga significant decrease in cellular migration and invasion.30 Therefore, PTEN may play an important role in the influence of MTSS1 on tumor metastases. Besides, previous studies found that miR-29a and miR-182-5p could increase the proliferative and invasive capacity of tumor cells via targeting MTSS1.31,32
In the present study, we also found MTSS1 could increase p-Cdc2 level but cause a decrease in the levels of cyclin B1, Cdc2, and Cdc25c, eventually induce the G2/M phase cell cycle arrest in GC. As we know, G2-M transition is regulated by the complex of cyclin-dependent kinase 1 (cdc2) and two types of cyclin, cyclin A, regulating both G1-S and G2-M regulatory proteins, and cyclin B1, which works selectively for G2-M transition.33 Previous studies have demonstrated that these modulators also play a role in progression and can be used to predict patient prognosis in some carcinomas.34,35 Recent research suggested cyclin B1 led to uncontrolled cell growth by binding to its partner Cdc2, which then triggered phosphorylation of other substrates at inappropriate time and unregulated proliferation.36 Several studies have further demonstrated that cyclin B1 and cdc2 are overexpressed among the different types of cancers,37–39 and cyclin B1 is negatively correlated with the prognosis.38,40 Reduction of cdc2 and cyclin B1 can stop cells in the G2 phase and triggers cell death by preventing the chromosomes from condensing and aligning.40 In the present study, we showed that G2/M-related proteins, such as cyclin B1, cdc2 and cdc25c, are downregulated and pCdc2 which presented plentifully in the G2 phase is upregulated after MTSS1 overexpression, suggesting MTSS1 suppressed the proliferation, migration and invasion of the GC cells through regulating cell cycle signaling. This mechanism is firstly reported in GC, and whether it could also occur in other types of tumor is unknown, it required to be explored in the future.
Obviously, there are several limitations to the present study. First, we have observed that MTSS1 has a negative effect on the migration and invasion of GC cell, but we did not further elucidate the underlying mechanism of this inhibitory effect. Previous studies have provided some evidence to support cooperative roles of MTSS1 and PTEN, SHH pathway and PI3K/AKT pathway in preventing cancer cell invasion, but we did not conduct the experiments to seek the potential mechanisms of MTSS1 on the migration and invasion of GC cell. We will further finish this work in the next step. Second, the reason why MTSS1 is downregulated in GC remained unknown. Previous studies have demonstrated that miRNA may be involved in the regulation of MTSS1 expression such as miR-29a and miR-182-5p, and also PTEN may play a key important role in the maintenance of MTSS function. In the next step, we also could further measure miRNA expression and further analyze the association of miRNA and MTSS1 function in GC.
Conclusion
In conclusion, the present study demonstrated that MTSS1 could inhibit proliferation, invasion and migration of GC cell. Also, we provide the first evidence, to the best of our knowledge, that MTSS1 could repress GC cell proliferation via inducing G2/M cell cycle arrest. Overall, all these results suggested that MTSS1 could act as a functional tumor suppressor in GC, which could be a potential therapeutic target to prevent GC metastasis.
Acknowledgments
This research was supported by the National Natural Science Foundation of China (Grant No. 81101577), Shanghai Municipal Science and Technology Commission Foundation (Grant No.17511103403) and Shanghai Pujiang Program (Grant No.17PJ1411100).
Disclosure
The authors report no conflicts of interest in this work.
References
1. Torre LA, Bray F, Siegel RL, Ferlay J, Lortet-Tieulent J, Jemal A. Global cancer statistics, 2012. Ca. 2015;65(2):87–108. doi:10.3322/caac.21262
2. Siegel RL, Miller KD, Jemal A. Cancer statistics, 2017. Ca. 2017;67(1):7–30. doi:10.3322/caac.21387
3. Nashimoto A, Akazawa K, Isobe Y, et al. Gastric cancer treated in 2002 in Japan: 2009 annual report of the JGCA nationwide registry. Gastric Cancer. 2013;16(1):1–27. doi:10.1007/s10120-012-0163-4
4. Orditura M, Galizia G, Sforza V, et al. Treatment of gastric cancer. World J Gastroenterol. 2014;20(7):1635–1649. doi:10.3748/wjg.v20.i7.1635
5. Lee YG, Macoska JA, Korenchuk S, Pienta KJ. MIM, a potential metastasis suppressor gene in bladder cancer. Neoplasia. 2002;4(4):291–294. doi:10.1038/sj.neo.7900231
6. Parr C, Jiang WG. Metastasis suppressor 1 (MTSS1) demonstrates prognostic value and anti-metastatic properties in breast cancer. Eur J Cancer. 2009;45(9):1673–1683. doi:10.1016/j.ejca.2009.02.019
7. Xie F, Ye L, Chen J, et al. The impact of metastasis suppressor-1, MTSS1, on oesophageal squamous cell carcinoma and its clinical significance. J Transl Med. 2011;9:95. doi:10.1186/1479-5876-9-95
8. Zhou L, Li J, Shao QQ, et al. Expression and significances of MTSS1 in pancreatic cancer. Pathol Oncol Res. 2016;22(1):7–14. doi:10.1007/s12253-015-9963-2
9. Wang D, Xu MR, Wang T, Li T, Zhu J. MTSS1 overexpression correlates with poor prognosis in colorectal cancer. J Gastrointestinal Surg. 2011;15(7):1205–1212. doi:10.1007/s11605-011-1546-2
10. Huang XY, Huang ZL, Xu B, et al. Elevated MTSS1 expression associated with metastasis and poor prognosis of residual hepatitis B-related hepatocellular carcinoma. J Exp Clin Cancer Res. 2016;35(1):85. doi:10.1186/s13046-016-0361-8
11. Zhang J, Tong Y, Ren L, Li CD. Expression of metastasis suppressor 1 in cervical carcinoma and the clinical significance. Oncol Lett. 2014;8(5):2145–2149. doi:10.3892/ol.2014.2508
12. Kayser G, Csanadi A, Kakanou S, et al. Downregulation of MTSS1 expression is an independent prognosticator in squamous cell carcinoma of the lung. Br J Cancer. 2015;112(5):866–873. doi:10.1038/bjc.2015.2
13. Ling DJ, Chen ZS, Liao QD, Feng JX, Zhang XY, Yin TY. Differential effects of MTSS1 on invasion and proliferation in subtypes of non-small cell lung cancer cells. Exp Therapeutic Med. 2016;12(2):1225–1231. doi:10.3892/etm.2016.3382
14. Liu K, Wang G, Ding H, Chen Y, Yu G, Wang J. Downregulation of metastasis suppressor 1(MTSS1) is associated with nodal metastasis and poor outcome in Chinese patients with gastric cancer. BMC Cancer. 2010;10:428. doi:10.1186/1471-2407-10-663
15. Utikal J, Gratchev A, Muller-Molinet I, et al. The expression of metastasis suppressor MIM/MTSS1 is regulated by DNA methylation. Int J Cancer. 2006;119(10):2287–2293. doi:10.1002/ijc.22106
16. Loberg RD, Neeley CK, Adam-Day LL, et al. Differential expression analysis of MIM (MTSS1) splice variants and a functional role of MIM in prostate cancer cell biology. Int J Oncol. 2005;26(6):1699–1705.
17. Nixdorf S, Grimm MO, Loberg R, et al. Expression and regulation of MIM (Missing in metastasis), a novel putative metastasis suppressor gene, and MIM-B, in bladder cancer cell lines. Cancer Lett. 2004;215(2):209–220. doi:10.1016/j.canlet.2004.05.002
18. Ma S, Guan XY, Lee TK, Chan KW. Clinicopathological significance of missing in metastasis B expression in hepatocellular carcinoma. Hum Pathol. 2007;38(8):1201–1206. doi:10.1016/j.humpath.2007.01.004
19. Xie F, Ye L, Ta M, Zhang L, Jiang WG. MTSS1: a multifunctional protein and its role in cancer invasion and metastasis. Front Biosci (Schol Ed). 2011;3:621–631.
20. Milne AN, Carneiro F, O’Morain C, Offerhaus GJ. Nature meets nurture: molecular genetics of gastric cancer. Human Genet. 2009;126(5):615–628. doi:10.1007/s00439-009-0722-x
21. Mertz KD, Pathria G, Wagner C, et al. MTSS1 is a metastasis driver in a subset of human melanomas. Nature Commun. 2014;5:3465. doi:10.1038/ncomms5972
22. Taylor MD, Bollt O, Iyer SC, Robertson GP. Metastasis suppressor 1 (MTSS1) expression is associated with reduced in-vivo metastasis and enhanced patient survival in lung adenocarcinoma. Clin Exp Metastasis. 2018;35(1–2):15–23. doi:10.1007/s10585-017-9869-3
23. Du P, Ye L, Li H, Yang Y, Jiang WG. The tumour suppressive role of metastasis suppressor-1, MTSS1, in human kidney cancer, a possible connection with the SHH pathway. J Exp Ther Oncol. 2012;10(2):91–99.
24. Du P, Ye L, Ruge F, Yang Y, Jiang WG. Metastasis suppressor-1, MTSS1, acts as a putative tumour suppressor in human bladder cancer. Anticancer Res. 2011;31(10):3205–3212.
25. Dawson JC, Bruche S, Spence HJ, Braga VM, Machesky LM. Mtss1 promotes cell-cell junction assembly and stability through the small GTPase Rac1. PLoS One. 2012;7(3):e31141. doi:10.1371/journal.pone.0031141
26. Mattila PK, Salminen M, Yamashiro T, Lappalainen P. Mouse MIM, a tissue-specific regulator of cytoskeletal dynamics, interacts with ATP-actin monomers through its C-terminal WH2 domain. J Biol Chem. 2003;278(10):8452–8459. doi:10.1074/jbc.M212113200
27. Callahan CA, Ofstad T, Horng L, et al. MIM/BEG4, a Sonic hedgehog-responsive gene that potentiates Gli-dependent transcription. Genes Dev. 2004;18(22):2724–2729. doi:10.1101/gad.1221804
28. Wang Y, Zhou K, Zeng X, Lin J, Zhan X. Tyrosine phosphorylation of missing in metastasis protein is implicated in platelet-derived growth factor-mediated cell shape changes. J Biol Chem. 2007;282(10):7624–7631. doi:10.1074/jbc.M608448200
29. Wang H, Zhao Y, Cao L, Zhang J, Wang Y, Xu M. Metastasis suppressor protein 1 regulated by PTEN suppresses invasion, migration, and EMT of gastric carcinoma by inactivating PI3K/AKT signaling. J Cell Biochem. 2019;120(3):3447–3454. doi:10.1002/jcb.27618
30. Zeleniak AE, Huang W, Fishel ML, Hill R. PTEN-dependent stabilization of MTSS1 inhibits metastatic phenotype in pancreatic ductal adenocarcinoma. Neoplasia. 2018;20(1):12–24. doi:10.1016/j.neo.2017.10.004
31. Guo Y, Qiao X, Zhu L, Song R. MicroRNA-182-5p modulates oral squamous cell carcinoma migration and invasion via targeting MTSS1 gene. Pathol Oncol Res. 2019. doi:10.1007/s12253-019-00647-8
32. Liu M, Zeng X, Lu YX, et al. Study on molecular mechanism of MiRNA-29a in promoting proliferation and invasion of non-small-cell lung cancer by inhibiting MTSS1. Eur Rev Med Pharmacol Sci. 2018;22(17):5531–5538. doi:10.26355/eurrev_201809_15814
33. Guadagno TM, Ohtsubo M, Roberts JM, Assoian RK. A link between cyclin A expression and adhesion-dependent cell cycle progression. Science. 1993;262(5139):1572–1575.
34. Kaldis P, Aleem E. Cell cycle sibling rivalry: cdc2 vs. Cdk2. Cell Cycle. 2005;4(11):1491–1494. doi:10.4161/cc.4.11.2124
35. Nakayama Y, Yamaguchi N. Role of cyclin B1 levels in DNA damage and DNA damage-induced senescence. Int Rev Cell Mol Biol. 2013;305:303–337. doi:10.1016/B978-0-12-407695-2.00007-X
36. Jahid S, Sun J, Edwards RA, et al. miR-23a promotes the transition from indolent to invasive colorectal cancer. Cancer Discovery. 2012;2(6):540–553. doi:10.1158/2159-8290.CD-11-0267
37. Yuan J, Kramer A, Matthess Y, et al. Stable gene silencing of cyclin B1 in tumor cells increases susceptibility to taxol and leads to growth arrest in vivo. Oncogene. 2006;25(12):1753–1762. doi:10.1038/sj.onc.1209202
38. Kawamoto H, Koizumi H, Uchikoshi T. Expression of the G2-M checkpoint regulators cyclin B1 and cdc2 in nonmalignant and malignant human breast lesions: immunocytochemical and quantitative image analyses. Am J Pathol. 1997;150(1):15–23.
39. Kushner J, Bradley G, Young B, Jordan RC. Aberrant expression of cyclin A and cyclin B1 proteins in oral carcinoma. J Oral Pathol. 1999;28(2):77–81. doi:10.1111/j.1600-0714.1999.tb02000.x
40. Dutta A, Chandra R, Leiter LM, Lester S. Cyclins as markers of tumor proliferation: immunocytochemical studies in breast cancer. Proc National Acad Sci USA. 1995;92(12):5386–5390. doi:10.1073/pnas.92.12.5386
 © 2019 The Author(s). This work is published and licensed by Dove Medical Press Limited. The full terms of this license are available at https://www.dovepress.com/terms.php and incorporate the Creative Commons Attribution - Non Commercial (unported, v3.0) License.
By accessing the work you hereby accept the Terms. Non-commercial uses of the work are permitted without any further permission from Dove Medical Press Limited, provided the work is properly attributed. For permission for commercial use of this work, please see paragraphs 4.2 and 5 of our Terms.
© 2019 The Author(s). This work is published and licensed by Dove Medical Press Limited. The full terms of this license are available at https://www.dovepress.com/terms.php and incorporate the Creative Commons Attribution - Non Commercial (unported, v3.0) License.
By accessing the work you hereby accept the Terms. Non-commercial uses of the work are permitted without any further permission from Dove Medical Press Limited, provided the work is properly attributed. For permission for commercial use of this work, please see paragraphs 4.2 and 5 of our Terms.