")
Back to Journals » OncoTargets and Therapy » Volume 11
MTBP promotes migration and invasion by regulation of ZEB2-mediated epithelial–mesenchymal transition in lung cancer cells
Authors Pan B, Han H , Wu L, Xiong Y, Zhang J, Dong B, Yang Y, Chen J
Received 12 March 2018
Accepted for publication 9 July 2018
Published 10 October 2018 Volume 2018:11 Pages 6741—6756
DOI https://doi.org/10.2147/OTT.S167963
Checked for plagiarism Yes
Review by Single anonymous peer review
Peer reviewer comments 4
Editor who approved publication: Dr Jianmin Xu
Bo Pan,1,2 Haibo Han,1,3 Lina Wu,1,4 Ying Xiong,1,2 Jianzhi Zhang,1,2 Bin Dong,1,4 Yue Yang,1,2 Jinfeng Chen1,2
1Key Laboratory of Carcinogenesis and Translational Research (Ministry of Education/Beijing), Beijing, China; 2Department of Thoracic Surgery II, Peking University Cancer Hospital & Institute, Beijing, China; 3Department of Biobank, Peking University Cancer Hospital & Institute, Beijing, China; 4Department of Central Laboratory, Peking University Cancer Hospital & Institute, Beijing, China
Background: It is clearly necessary to discover prognostic biomarkers to identify stage I patients at risk of recurrence and give them timely postoperative treatment.
Materials and methods: Data of stage I lung adenocarcinoma were retrieved from four gene series in Gene Expression Omnibus (GEO) database (GSE50081, GSE30219, GSE37745, and GSE13213). Partek Genomics Suite software was used to identify survival-related genes for finding candidate indicators for early-stage patients at risk of recurrence. Differential expression of MTBP (MDM2 binding protein) in early-stage lung adenocarcinoma tissues was determined by immunohistochemical staining. The effects of MTBP interference expression and overexpression on viability, migration, and invasion capacity of lung cells were evaluated using Cell Counting Kit-8, wound healing, and Transwell assays. The tumor growth and lung metastasis in vivo were observed in chick embryo chorioallantoic membrane model. Human Exon 2.0 ST Array was used to analyze downstream regulation genes of MTBP in lung cancer cells. Involvement of ZEB2 and epithelial–mesenchymal transition (EMT) markers was investigated by Western blot.
Results: By mining GEO database, we identified MTBP as a poor prognostic indicator of stage I lung adenocarcinomas. In addition, increased expression of MTBP was also associated with poor survival in our early-stage lung adenocarcinoma cohort. Further experiment suggested that knockdown of MTBP suppressed the migration and invasion of A549 and H1975 cells in vitro and in vivo, whereas overexpression of MTBP in HCC827 and PC9 cells promoted the migration and invasion in vitro and in vivo. Furthermore, ZEB2 upregulation directly activated EMT to mediate the downstream effects of MTBP involved in lung cancer cells metastasis.
Conclusion: MTBP is an independent indicator for poor prognosis in stage I lung adenocarcinomas and might promote the aggressive phenotype of non-small-cell lung cancer by inducing the EMT process through upregulating ZEB2 expression.
Keywords: stage I lung cancer, MTBP, metastasis, ZEB2
Corrigendum for this paper has been published
Introduction
Lung cancer is the leading cause of cancer-related death worldwide.1 According to the clinical outcome predicted by pathological stage, the 5-year survival rate of stage I cases without metastases ranges from 60% to 70%.2 Obviously, there are about 30%–40% of patients with stage I lung cancer who are at risk for disease recurrence and metastasis. According to the National Comprehensive Cancer Network guidelines version 2.2018 for the treatment of non-small-cell lung cancer (NSCLC), patients with stage I cancer are not recommended to undergo postoperative chemotherapy. However, the survival rate of patients with early-stage NSCLC could be improved if postoperative adjuvant chemotherapy is applied.3 Thus, it is clearly necessary to identify those stage I patients at risk of recurrence and give them timely postoperative treatment.
For the past several decades, researchers have been concentrating on identifying molecular prognostic biomarkers for patients with stage I lung cancer. In 1989, it was found that cytofluorometry could be used as a measuring tool for nuclear DNA contents for predicting prognosis in stage I adenocarcinoma.4 Since then, molecules that are related to the prognosis of stage I lung cancer have been emerging endlessly. In 2007, Bianchi et al proposed the utilization of multiple markers (eg, a ten-gene predictive model) to forecast the prognosis of patients with stage I lung adenocarcinoma with an accuracy of approximately 75%.5 Recently, cell cycle progression score (calculated by the average of 31 cell cycle genes normalized by the average of 15 housekeeping genes) identified by Takashi was used as an independent high-risk marker for predicting stage I lung cancer-specific mortality and quantitative risk assessment.6 In addition, a number of molecular prognostic indicators have been reported in the literature.7–9 These were examined to have association with the prognosis of stage I patients; however, only a few of them were utilized in subsequent studies.3 Therefore, searching for potential prognostic biomarkers is necessary to gain insights into further therapeutic options for early-stage patients.
The Gene Expression Omnibus (GEO) database is an international repository that archives and freely distributes high-throughput gene expression data, and provides free access to download and analyze the data relevant to specific interests.10 In this study, microarray gene expression profiles of patients with stage I lung adenocarcinoma were extracted from GEO database, and were analyzed for relationship between the expression level of genes and prognostic status. Totally, six candidate genes were identified to be associated with patients’ prognosis. Among them, MTBP (MDM2 binding protein) was selected for further study. Based on evidence from the scientific literature, the function of MTBP in tumor cell proliferation and metastasis in different cancer types still remains controversial.11–14 On the one hand, MTBP functions as an oncogene and promotes malignancy of breast cancer,14 triple-negative breast cancer,15 and squamous cell carcinoma of the head and neck (SCCHN).16 On the other hand, MTBP functions as a suppressor gene and inhibits cell migration in human osteosarcoma cells12 and hepatocellular carcinoma (HCC).17 As for lung cancer, especially stage I lung adenocarcinoma, the function of MTBP has not been elucidated. Hence, in this study, we aimed to elucidate the function of MTBP in lung cancer, especially in the early stage of the disease. We examined MTBP expression in stage I lung adenocarcinoma by immunohistochemical staining and explored the relationship between MTBP expression and clinical characteristics. We utilized gene overexpression and shRNA approach to examine the role of MTBP in human NSCLC cell line.
Materials and methods
Mining GEO database
A pipeline was established to obtain the prognostic biomarker for early-stage lung adenocarcinoma (Figure 1A). The gene expression profile and related clinical pathological information of stage I lung adenocarcinoma in four gene series, including GSE50081, GSE30219, GSE37745, and GSE13213, were extracted from GEO (https://www.ncbi.nlm.nih.gov/geo/). To select the suitable cases for our analysis, the inclusion/exclusion criteria were: 1) stage I lung adenocarcinoma; 2) death; 3) with records of overall survival (OS) information. Among the four gene series, GSE50081, GSE30219, and GSE37745 were utilized to explore the prognostic genes, while GSE13213 was used to verify the reliability in terms of relationship between gene expression and prognostic outcome. Based on the average survival time of each dataset, the recruited patients were categorized into short-survival group and long-survival group. The original microarray signal files were input into Partek Genomics Suite software (Partek Inc., St Louis, MO, USA) for differentially expressed genes (DEGs) analysis between short-survival group and long-survival group by one-way ANOVA. The patients were then categorized into low-expression group and high-expression group on the basis of average gene expression level in each dataset, and Kaplan–Meier (K-M) survival analysis was performed to validate the prognostic value of each DEG.
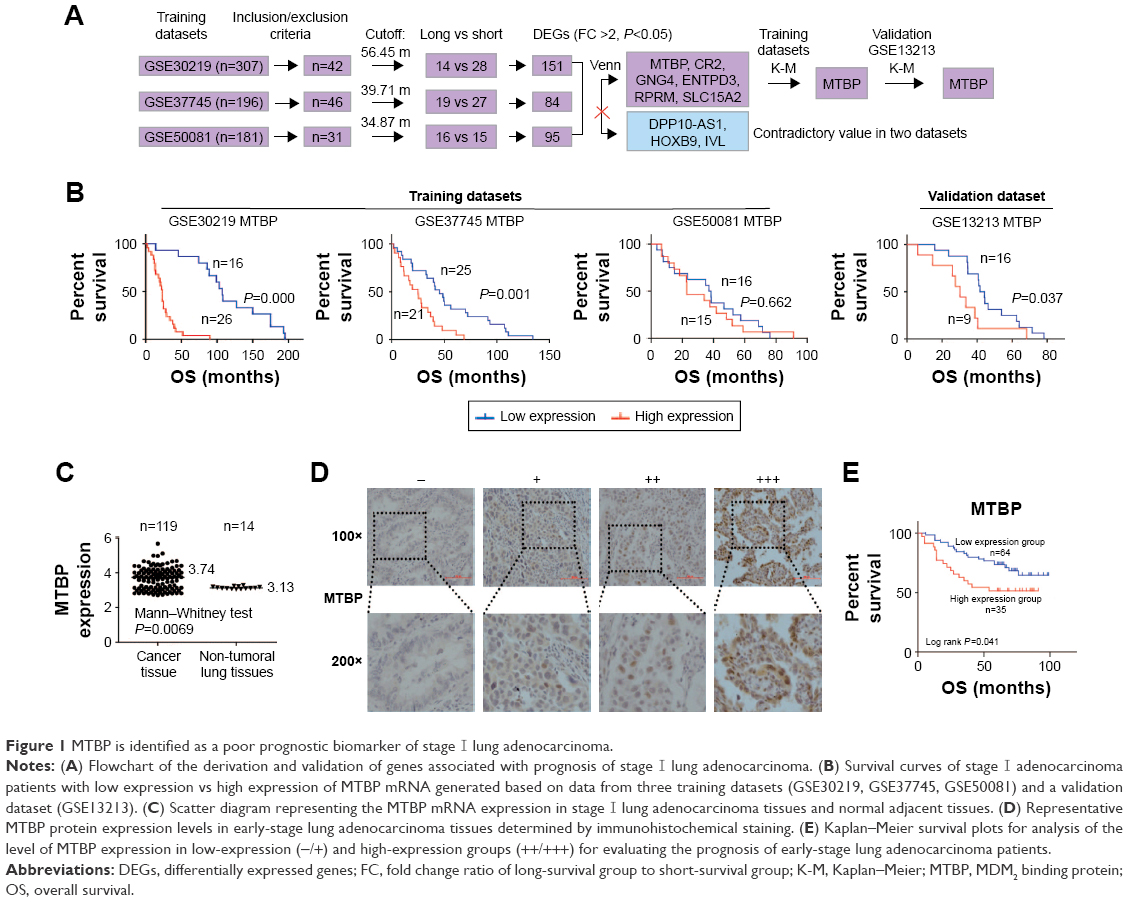 | Figure 1 MTBP is identified as a poor prognostic biomarker of stage I lung adenocarcinoma. |
Patients and samples
In total, 99 patients with stage I lung adenocarcinoma who underwent radical lobectomy without any other treatment prior to surgery at Peking University Cancer Hospital between 2005 and 2012 were selected for this study. The histopathologic grade of lung cancer at the time of diagnosis was determined according to the eighth edition of the International Union Against Cancer TNM staging system.2 Detailed information about the tumor is provided in Table S1. Tumor samples were fixed in 10% formaldehyde overnight at room temperature and embedded in paraffin. Paraffin-embedded tumors were cut into 4 μm thick sections.
Immunohistochemistry
Sections were immersed in xylene to remove the paraffin, washed in a graded series of ethanol, and immersed in citrate buffer (pH 6.0) in a high-pressure sterilization oven for antigen retrieval for 3 minutes at 100°C. Endogenous peroxidase activity was blocked with 3% H2O2 in PBS for 10 minutes at room temperature, and then the sections were incubated with PBS containing 1% BSA for 60 minutes at room temperature to block nonspecific binding. Sections were incubated with anti-MTBP (1:400 dilution; Sigma-Aldrich Co., St Louis, MO, USA) or anti-ZEB2 antibody (1:500 dilution; Abcam, Cambridge, UK) for overnight at 4°C, followed by incubation with horseradish peroxidase (HRP)-conjugated goat anti-rabbit or anti-mouse IgG (ZSGB-BIO, Beijing, China) for 1 hour at room temperature. Then, the sections were visualized with 0.1% 3,3-diaminobenzidine (Sigma-Aldrich) for 2 minutes, and counterstained with 1% hematoxylin for 10 minutes at room temperature. According to the percentage of positive tumor cells, sections were classified into four groups (−, +, ++, and +++), with “−” indicating <25%, “+” 25%–49%, “++” 50%–74%, and “+++” >75%. Based on the gene expression, sections were defined as either low-expression group (− and +) or high-expression group (++ and +++).
Cell culture
All cell lines, including A549, H1299, H1650, H1975, HCC827, and PC9, were purchased from the American Type Culture Collection (Manassas, VA, USA) or Chinese Academy of Medical Sciences & Peking Union Medical College (Beijing, China) and cultured in RPMI-1640 medium, with 10% FBS, 100 U/mL penicillin, and 100 μg/mL streptomycin in a humidified atmosphere of 5% CO2 at 37°C.
Plasmids, siRNAs, and lentiviruses
MTBP overexpression plasmids, inserted into a plasmid pCMV6-Entry vector, were achieved from OriGene Technologies (Rockville, MD, USA). The siRNAs targeting MTBP were synthesized by Guangzhou RiboBio Co., Ltd. (Guangzhou, China). The lentiviruses containing shRNA for MTBP or scramble lentiviruses were purchased from Shanghai Genechem Company. These lentiviruses were directly mixed with cells at a 10:1 multiplicity-of-infection ratio, followed by selection with 1 μg/mL puromycin for 14 days.
Real-time qPCR
Total RNA was extracted from cells with TRIzol reagent (Invitrogen; Thermo Fisher Scientific, Inc., Waltham, MA, USA) according to the manufacturer’s protocol. Then, 2 μg total RNA was reverse-transcribed to cDNA with the Reverse Transcription Kit (TransGen Biotech, Beijing, China; http://www.transgen.com.cn) as per manufacturer’s instructions. Quantitative PCR (qPCR) was performed using SYBR Green I Master Mix (Invitrogen; Thermo Fisher Scientific, Inc.) on an ABI 7500 Fast Real-Time PCR System. The PCR primers used were as follows: MTBP forward, 5′-ACTGAGAATCAGCCGGACTT-3′ and reverse, 5′-CTGCACTGCAAAGAACCACT-3′; GAPDH forward, 5′-TGAAGGTCGGAGTCAACGG-3′ and reverse, 5′-CTGGAAGATGGTGATGGGATT-3′. Data were calculated based on 2−ΔCt where ΔCt = Ct (Target) − Ct (Reference). Relative quantification of mRNA expression was performed using 2−ΔΔCt method.
Protein extraction and Western blotting
Proteins were extracted with RIPA lysis buffer (CWBiotech, Beijing, China) on ice for 30 minutes. Protein quantity was determined using bicinchoninic acid kit purchased from Solarbio Science & Technology Co., Ltd. (Beijing, China). Equivalent amounts of proteins (30 μg) were separated by 10% SDS-PAGE and transferred to a polyvinylidene fluoride membrane (EMD Millipore, Billerica, MA, USA). Membranes were blocked with 5% nonfat milk in Tris-buffered saline containing 0.1% Tween 20 for 1 hour at room temperature and then incubated with the following specified antibodies for 1 hour at room temperature: anti-MTBP (1:2,000 dilution; Sigma-Aldrich), anti-ZEB2 (1:5,000 dilution; Abcam), anti-E-cadherin (1:5,000 dilution; Cell Signaling Technology, Danvers, MA, USA), anti-N-cadherin (1:5,000 dilution; Cell Signaling Technology), anti-β-catenin (1:5,000 dilution; Cell Signaling Technology), anti-Vimentin (1:5,000 dilution; Cell Signaling Technology), and anti-GAPDH (1:5,000 dilution; Cell Signaling Technology). The membranes were then incubated with HRP-conjugated goat anti-mouse or anti-rabbit IgG (ZSGB-BIO) for 1 hour at room temperature. Signals were visualized using an enhanced chemiluminescence reagent and captured using AI600 version 1.2.0 on Amersham Imager 600 (GE Healthcare, Chicago, IL, USA).
Transwell assay
For Transwell assay, 1×10⁵ cells in 250 μL of serum-free RPMI-1640 was added to the upper chamber of 8 μm Transwells (both gel-containing and gel-free; Costar Inc, Boston, MA, USA), and 750 μL of RPMI-1640 solution containing 10% serum was added to the lower chamber of Transwells. After 24 hours, cells on the Transwells were fixed with 4% paraformaldehyde and stained with 1% crystal violet staining solution (Solarbio Science & Technology Co., Ltd.). Migrated or invasive cells (coated with matrigel) were counted in five random microscopic fields.
Wound healing assay
Cells were placed on a six-well plate for 12 hours at 80% confluency, and scratched with 200 μL tips. After removing the detached cells carefully with PBS, the wounded area was photographed at 0, 6, 24, and 48 hours (Leica, Wetzlar, Germany).
Cell viability assay
Cells (1,000–5,000 cells/well) were placed on 96-well plates and cultured for 24, 48, 72, and 96 hours. Before measurement of the absorbance at 450 nm, each well was added with 10 μL Cell Counting Kit-8 solution and incubated for 2 hours. A Bio-Rad microplate reader was used to measure the absorbance at 450 nm.
Chick embryo chorioallantoic membrane (CAM) assay
Chick embryos were purchased from Merial Vital Laboratory Animal Technology Company (Beijing, China). The growth and metastatic characteristics of the cells were measured by a modified chick embryo CAM assay as previously described.18 Briefly, 1×10⁷ cells tracked with Dil-CM (Invitrogen; Thermo Fisher Scientific, Inc.) were inoculated on the CAM of 10-day-old chick embryos. Seven days later, tumors were taken away from CAM for photographing and weighing. Embryonic lungs were also dissected, and the tumor metastases were photographed by a confocal laser scanning microscope (Leica).
Microarray analysis
Human Exon 2.0 ST Array (Affymetrix Inc., Santa Clara, CA, USA) was used to analyze exon-level expression profiles in different cells. Total RNA extracted from each kind of cell sample was quantified by NanoDrop ND-2000 (Thermo Fisher Scientific, Inc.), and tested for completeness on Agilent Bioanalyzer 2100. Microarray hybridization, washout, and staining were performed according to Affymetrix standard protocol. Original picture was scanned by Affymetrix Scanner 3000 (Affymetrix 7G), and the original document data were processed by Expression Console (version 1.4.1; Affymetrix). Signal value of the original probe was screened and calculated by Robust Multiarray Average (RMA) to do background correction and standardization.
Statistical analysis
F-test in one-way ANOVA was used to analyze DEGs between short-survival and long-survival groups by Partek Genomics Suite software. For continuous variable with Gaussian distribution, data were represented by mean ± SD, and independent samples t-test was utilized to analyze the difference between two groups. For the categorical variables, Pearson’s chi-squared test was performed. Survival data were analyzed by K-M analysis, and P-values were calculated with log-rank test. Cox proportional hazard model was built in order to identify the potential risk factors associated with prognosis. Spearman’s rank correlation analysis was used to investigate the association between MTBP and ZEB2 expression. All statistical tests were two tailed, and α=0.05 was used to define statistical significance (*P<0.05; **P<0.01; ***P<0.001).
Results
MTBP was identified as a prognostic gene of stage I lung adenocarcinoma by screening GEO database
A pipeline was established to obtain prognostic biomarkers to identify early-stage lung cancer patients with poor prognosis (Figure 1A). Briefly, we downloaded the GSE30219, GSE37745, and GSE50081 datasets and then selected 42, 46, and 31 usable cases in the three datasets, respectively, who met our inclusion criteria. The corresponding average OS time was 56.45 months for GSE30219, 39.71 months for GSE37745, and 34.87 months for GSE50081. Based on the average OS time, recruited cases were then categorized into long-survival and short-survival groups according to the cutoff value of mean OS of each dataset. Then, we analyzed the DEGs in long-survival and short-survival groups of each dataset by F-test in one-way ANOVA using the Partek Genomics Suite software with the criteria of the fold change ratio of long-survival group to short-survival group (FC) >2.0 and P<0.05. In total, nine genes, identified as DEGs at least in two datasets, were selected as candidate genes, including MTBP, CR2, GNG4, ENTPD3, RPRM, SLC15A2, DPP10-AS1, HOXB9, and IVL (Figure 1A and Table S2). Among the nine genes, DPP10-AS1, HOXB9, and IVL were excluded due to contradictory FC value in two datasets. Therefore, gene expression data of six candidate genes were extracted from each dataset, and patients were then classified into high-expression and low-expression groups based on the cutoff value of average mRNA expression levels of each gene for each dataset. Based on the survival information recorded in the GEO, K-M survival curves were drawn for each gene in each dataset. MTBP was the only gene which showed a statistical difference in K-M survival analysis in two of the three training datasets (log-rank test, P<0.001 for GSE30219 and P=0.001 for GSE37745; Figure 1B), while the other five candidate genes showed a statistical difference only in one of the three training datasets (Figure S1A). Hence, we selected MTBP for further study. To further confirm the significance of MTBP expression in the prognosis of OS, we performed K-M survival analysis in another validation GEO dataset, GSE13213. Consistent with our prediction, patients with high expression of MTBP showed shorter OS than those with low expression of MTBP by cutoff value of average MTBP expression levels (log-rank test, P=0.037; Figure 1B, right panel), indicating that MTBP might be a poor prognostic indicator for early-stage patients. We also retrieved the data on expression level of MTBP in the non-tumoral lung tissues. As shown in Figure 1C, MTBP expression in the stage I lung adenocarcinoma tissues was higher than that in the non-tumoral lung tissues (Mann–Whitney test, P=0.0069), indicating that MTBP might play an important role in the early stage of lung adenocarcinoma.
High expression of MTBP was detected in early-stage lung adenocarcinoma and predicted short OS in our cohort
Furthermore, we detected the level of MTBP protein in 99 cases of our cohort with stage I lung adenocarcinoma by immunohistochemical (IHC) analysis (Figure 1D). Based on the IHC results, patients were categorized into low-expression group (−/+) and high-expression group (++/+++). K-M survival analysis suggested that patients with high expression of MTBP showed shorter OS time than those with low-expression of MTBP (log-rank test, P=0.041; Figure 1E).
Cox regression model suggested that tumor differentiation degree and MTBP expression level were independent factors of prognosis in stage I patients in both univariate and multivariate analyses (P<0.05; Table 1). In Cox multivariate analysis, high level of MTBP expression was associated with poor survival (HR =2.493, 95% CI 1.273–4.880, P=0.048; Table 1), indicating that MTBP is an independent poor prognostic indicator of OS of stage I patients.
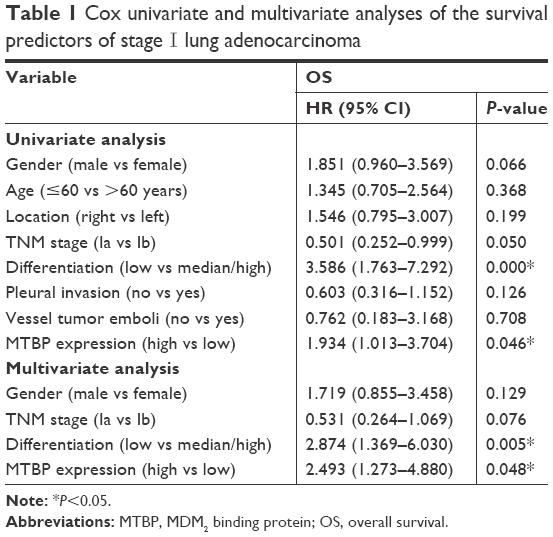 | Table 1 Cox univariate and multivariate analyses of the survival predictors of stage I lung adenocarcinoma |
Knockdown of MTBP expression decreased cell migration and invasion in A549 and H1975 cells
To select the suitable lung adenocarcinoma cells to carry out the functional experiments, we first examined the expression of MTBP in the six lung adenocarcinoma cell lines by both Western blotting (Figure 2A) and qPCR (Figure S1B). Our data suggested that the MTBP proteins were highly expressed in A549, H1299, H1650, and H1975 cells, whereas expression was low in HCC827 and PC9 cells (Figure 2A). Hence, we selected A549 and H1975 cells featuring high MTBP expression to perform the MTBP RNA interference analysis, and HCC827 and PC9 cells featuring low MTBP expression to perform the MTBP overexpression analysis.
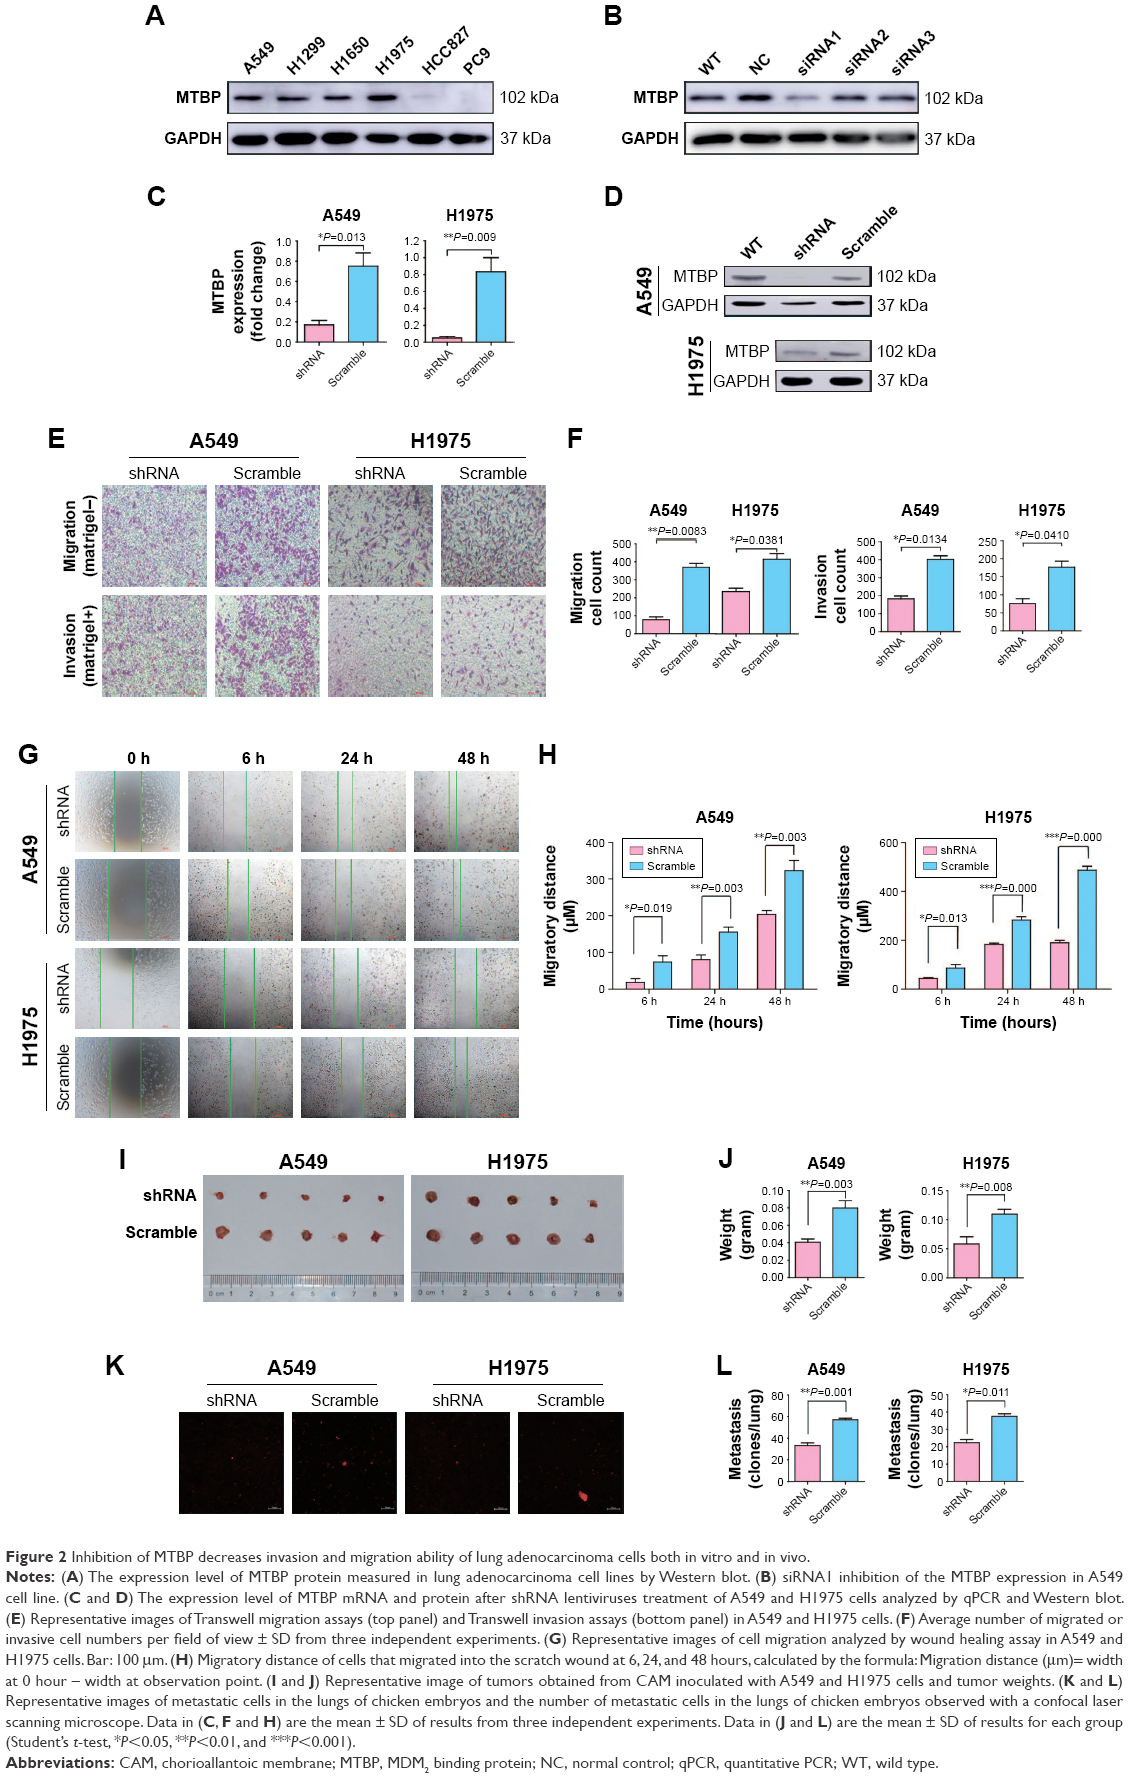 | Figure 2 Inhibition of MTBP decreases invasion and migration ability of lung adenocarcinoma cells both in vitro and in vivo. |
To select the effective target for MTBP RNA interference, we designed three siRNAs (siRNA1, siRNA2, and siRNA3), targeting 5′-CCATGTACCATTAGTAACA-3′, 5′-CGTCTTATTCGTTATGAAA-3′, and 5′-CCTGTAGTTTCGTCAGATC-3′ sequences of MTBP mRNA, respectively. Among the three siRNAs, siRNA1 inhibited MTBP expression significantly (Figure 2B). Then, we constructed shRNA expression vectors according to siRNA1 target sequences. shRNA and scramble lentiviruses were produced using HEK293T cells following co-transfection with packaging plasmids, and then A549 and H1975 cells were infected followed by selection with 1 μg/mL puromycin for 14 days. We found that compared with scramble cells, the MTBP mRNA (Figure 2C) and protein expression (Figure 2D) were remarkably suppressed by shRNA in both A549 and H1975 cells, indicating the successful interference of MTBP expression in the two cell lines. The ability of migration and invasion of the cell lines A549 and H1975 after knockdown of MTBP was measured by Transwell assay (Figure 2E), and our result showed that migration and invasion abilities were obviously decreased after inhibition of expression of MTBP (migration ability decreased by 78.89% and invasion ability by 54.48% in A549 cells, and migration ability decreased by 43.39% and invasion ability by 56.94% in H1975 cells; Student’s t-test, P<0.05; Figure 2F). Wound healing assay also showed obvious decline in migration ability of cell lines A549 and H1975 after knockdown of MTBP at 6, 24, and 48 hours, compared with scramble cells at each observation point (Student’s t-test, P<0.05; Figure 2G and H). However, there was no significant change in cell viability of A549 and H1975 cells after knockdown of MTBP (two-way ANOVA, P>0.05; Figure S1C).
Knockdown of MTBP expression decreased tumor growth and metastasis in vivo
The above experiments indicated that inhibition of MTBP expression suppressed cell migration and invasion in vitro. Herein, we performed chick embryo CAM assay to detect the function of MTBP in vivo. After interference of MTBP expression by shRNA, the weights of tumor grown on CAM were significantly decreased in both A549 and H1975 cells compared with the scramble cells (decreased by 49.01% in A549 cells and by 46.81% in H1975 cells; Student’s t-test, P<0.05; Figure 2I and J), and at the same time, the metastasis of cancer cells in the lungs of chicken embryos was also reduced in both A549 and H1975 cells (decreased by 41.52% in A549 cells and by 40.44% in H1975 cells; Student’s t-test, P<0.05; Figure 2K and L). Taken together, knockdown of MTBP suppressed the migration and invasion of A549 and H1975 cells in vitro and in vivo.
MTBP overexpression promoted cell migration and invasion in HCC827 and PC9 cells
To further confirm the above results, we overexpressed MTBP in HCC827 and PC9 cells with low MTBP expression. MTBP expression vectors or blank vectors were transfected into HCC827 and PC9 cells by Lipofectamine 2000 reagent according to the manufacturer’s guidelines, followed by selection with 500 μg/mL G418 for 28 days. qPCR and Western blotting revealed a dramatic overexpression of MTBP in both HCC827 and PC9 cells (increased by 8.9-fold in HCC827 cells and 4.2-fold in PC9 cells; Figure 3A and B). Consistent with the results obtained from MTBP interference analysis, the ability of migration and invasion of HCC827 and PC9 cells after overexpression of MTBP was significantly improved as shown by Transwell assay (migration increased by 1.56-fold and invasion by 2.74-fold in HCC827 cells, and migration increased by 2.2-fold and invasion by 2.74-fold in PC9 cells; Student’s t-test, P<0.05; Figure 3C and D). Wound healing scratch assay also showed increased ability of migration in HCC827 and PC9 cells after MTBP overexpression (Student’s t-test, P<0.05; Figure 3E and F).
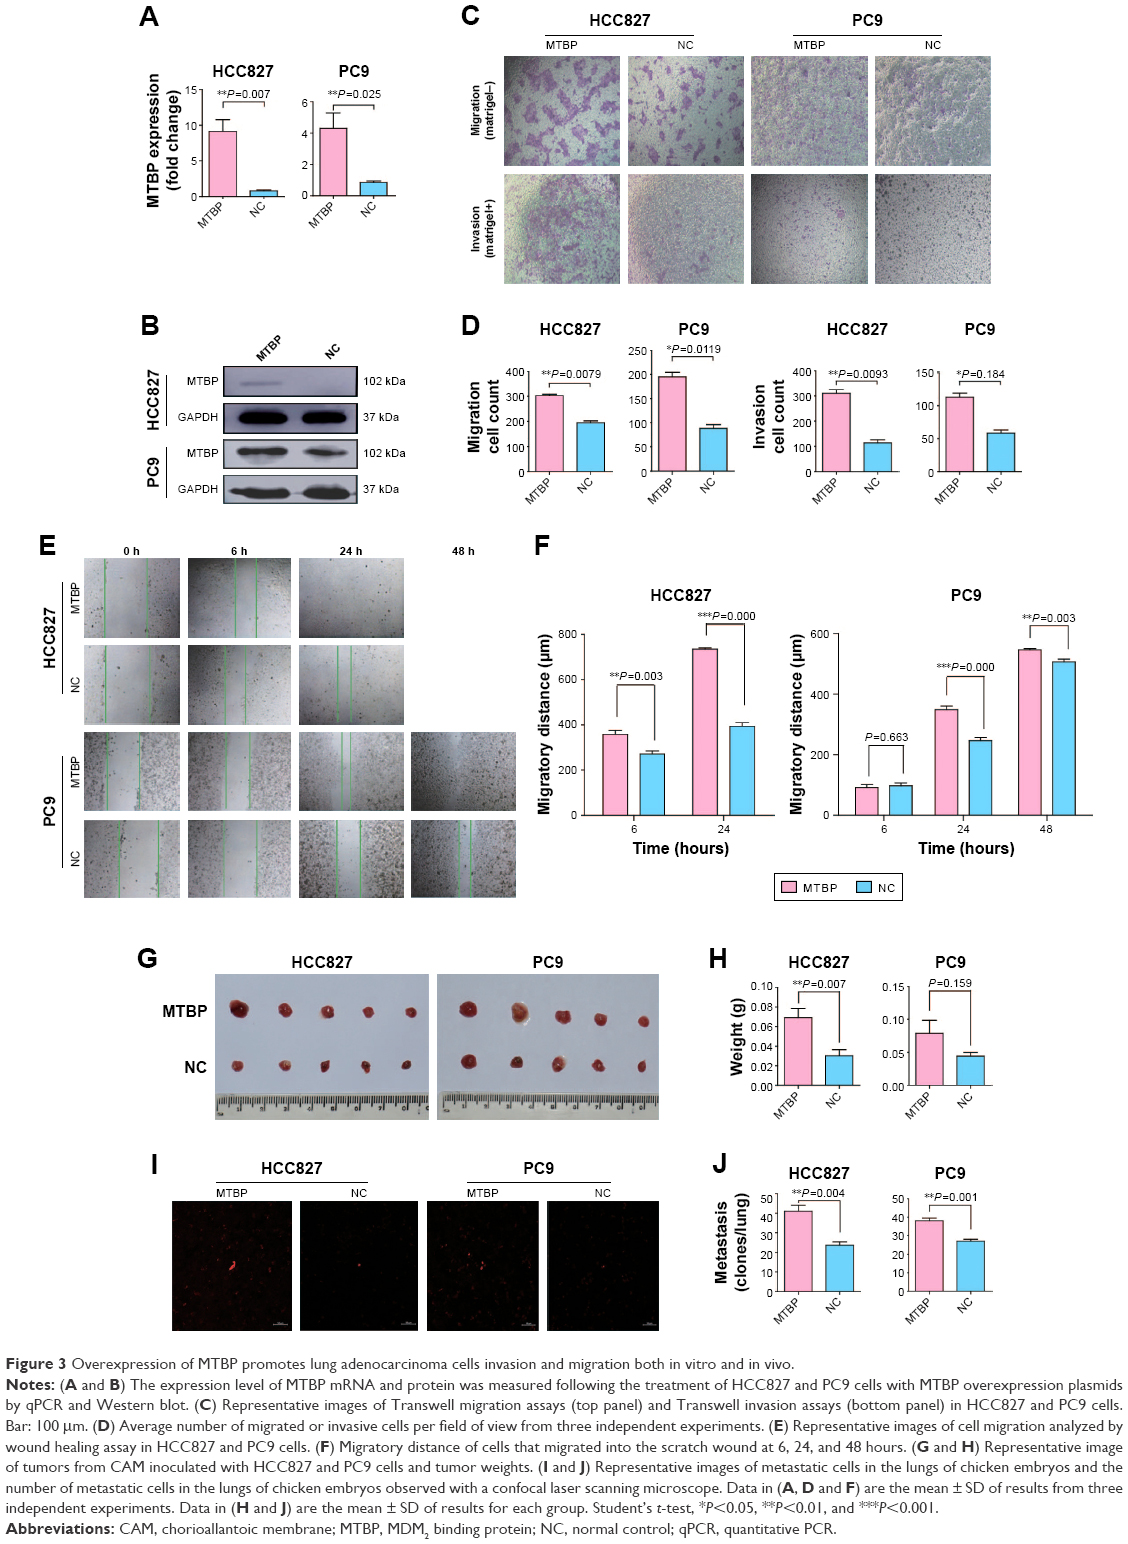 | Figure 3 Overexpression of MTBP promotes lung adenocarcinoma cells invasion and migration both in vitro and in vivo. |
MTBP overexpression promoted tumor growth and metastasis in vivo
Since MTBP overexpression promoted cell migration and invasion in vitro, we performed CAM assay to detect its role in vivo. The results from CAM assay showed increased tumor weights (average tumor weight increased by 2.28-fold in HCC827 cells and by 1.77-fold in PC9 cells; Student’s t-test, P<0.05; Figure 3G and H) and tumor metastasis in the lungs of chicken embryos after inoculation of MTBP-overexpressing HCC827 and PC9 cells (lung metastasis increased by 1.74-fold in HCC827 cells and by 1.41-fold in PC9 cells; Student’s t-test, P<0.05; Figure 3I and J). Collectively, overexpression of MTBP in HCC827 and PC9 cells promoted the migration and invasion in vitro and in vivo.
MTBP promoted tumor metastasis through ZEB2-mediated epithelial–mesenchymal transition (EMT)
To determine the underlying mechanism of MTBP in promoting lung cancer cell metastasis, we performed transcriptomes analysis using Human Exon 2.0 ST Array. We selected those DEGs with the criteria of P<0.05 and FC >1.5. Venn diagram was used to intersect those consistent DEGs in different cells with knockdown or overexpression of MTBP (Figure 4A), and a total of 80 genes (31 protein-coding genes, 21 microRNAs, 22 noncoding RNAs, and six pseudogenes) were discovered (Table S3). Among the 31 protein-coding genes, ZEB2, MMP13, SMAD4, and UBC were identified as tumor growth-related genes and ZEB2, DDIT4, and TNFSF18 as tumor metastasis-related genes by gene ontology analysis (Figure 4A). To analyze the potential regulation of these genes by MTBP, we performed Spearman’s rank correlation analysis between the expression of MTBP and the above six genes according to their expression level in the GEO datasets. As indicated in Figure 4B, MTBP expression showed significant positive correlation with the expression of five genes, including ZEB2, TNFSF18, MMP13, SMAD4, and UBC, indicating the potential regulation of these five genes by MTBP. Furthermore, we performed functional protein interaction network analysis of the 30 protein-coding genes based on data from the STRING database, and a highly interconnected protein cluster as ZEB2-SMAD4-UBC (Figure 4C) was identified, suggesting ZEB2 as a key regulator gene of MTBP.
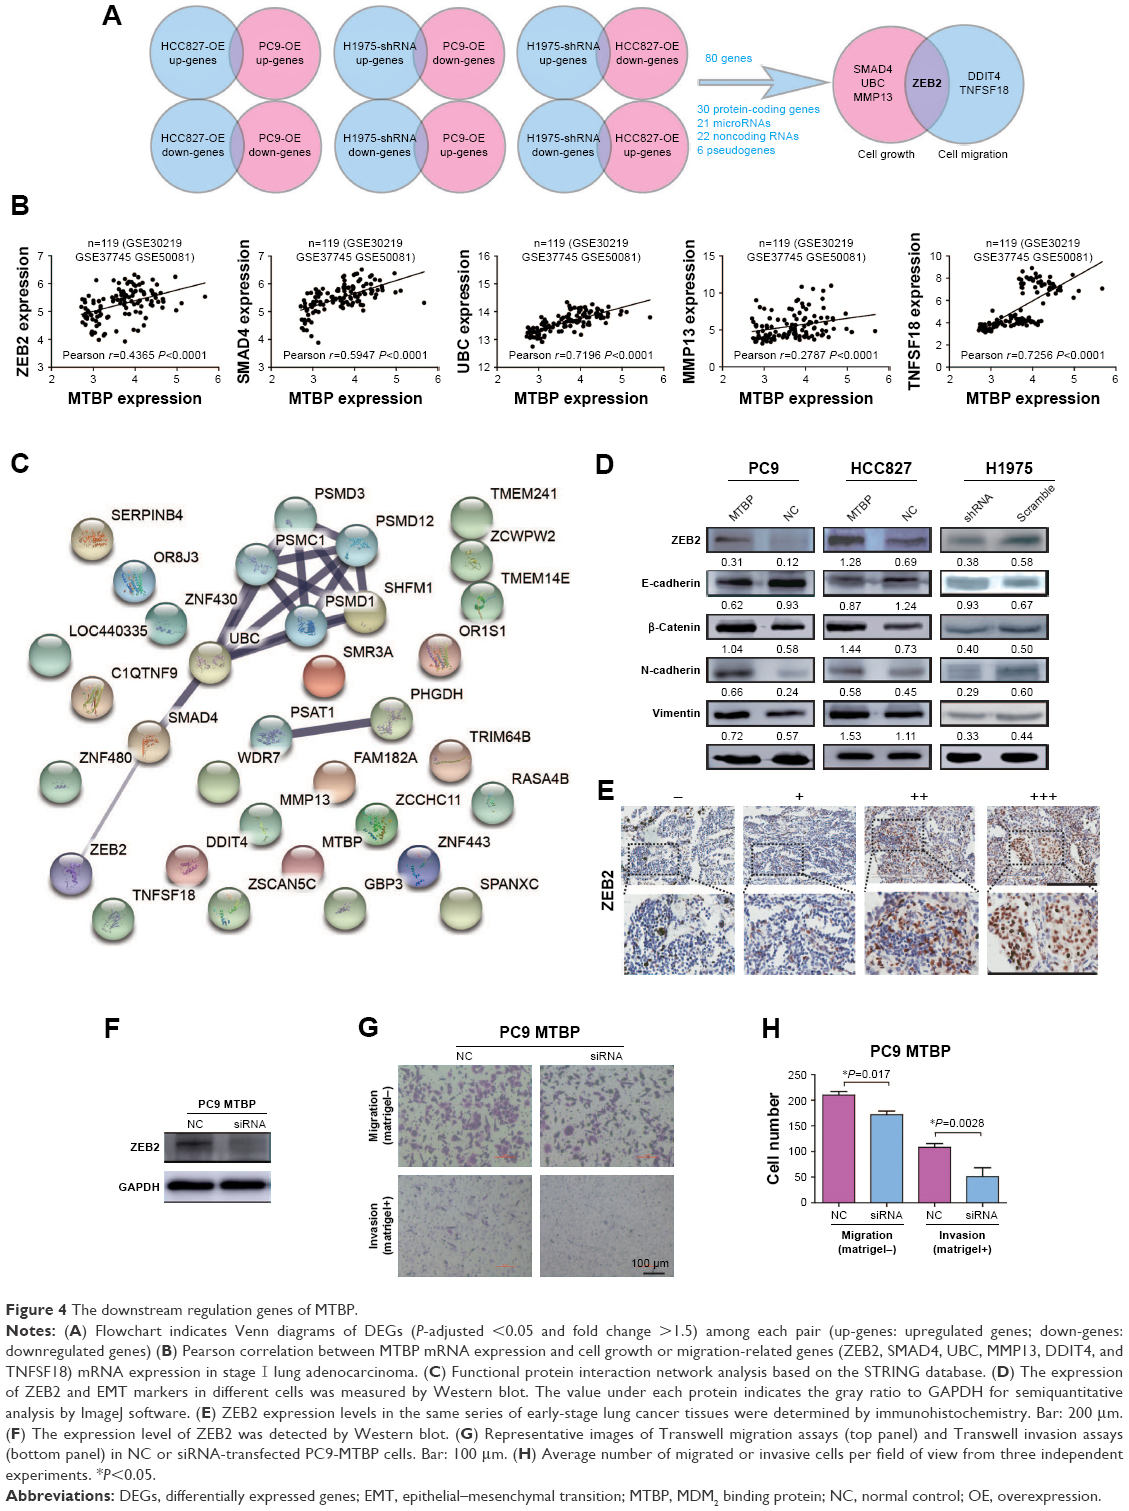 | Figure 4 The downstream regulation genes of MTBP. |
We then demonstrated ZEB2 dynamics in the cells after alteration of MTBP expression. As it was expected, the ZEB2 expression was indeed decreased after knockdown of MTBP expression in H1975 cells, while expression increased after overexpression of MTBP in HCC827 and PC9 cells (Figure 4D, upper panel). Considering that ZEB2 promoted tumor invasion and metastasis by driving EMT in cancer cells, we further analyzed the downstream EMT target molecules of ZEB2. As shown in Figure 4D, followed by ZEB2 dynamics, ectopic overexpression of MTBP increased the expression levels of mesenchymal cell markers N-cadherin, Vimentin, and β-catenin, but decreased the expression of epithelial cell marker E-cadherin in both HCC827 and PC9 cells (Figure 4D, left and middle panels). On the other hand, inhibition of MTBP by shRNA inhibited the expression of mesenchymal cell markers N-cadherin, Vimentin, and β-catenin, but promoted the expression of epithelial cell marker E-cadherin in H1975 cells (Figure 4D, right panel).
To further confirm the relationship between MTBP and ZEB2 expression, we also detected ZEB2 expression in the same series of early-stage lung cancer tissues. As shown in Figure 4E and Table 2, MTBP expression was significantly correlated with ZEB2 expression (Spearman correlation, r=0.367, P<0.001), indicating that MTBP promoted the invasion and metastasis potentially by upregulation of ZEB2 in early-stage lung adenocarcinoma.
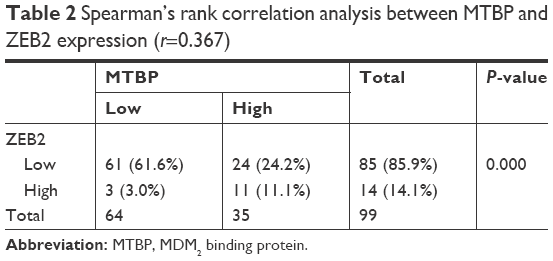 | Table 2 Spearman’s rank correlation analysis between MTBP and ZEB2 expression (r=0.367) |
We then inhibited ZEB2 expression in PC9-MTBP cells (Figure 4F) by siRNA, and observed the altered cell migration and invasion. As indicated in Figure 4G and H, after interference of the ZEB2 expression, the migration and invasion were both suppressed in the PC9-MTBP cells, suggesting that ZEB2 upregulation mediated the downstream effects of MTBP and ZEB2 was at least partially responsible for the role of MTBP in promoting aggressive phenotype.
Discussion
In 2000, MTBP was first identified by Boyd et al19 through a yeast two-hybrid assay, and named as MDM2-binding protein. Then, the authors found that MTBP promoted proteasomal degradation of p53 by MDM2-mediated ubiquitination.20 It was noteworthy that much controversy existed regarding the role of MTBP in different types of cancer. On the one hand, a number of reports supported the role of MTBP in suppressing tumor progression. By categorizing 198 specimen tissues of patients according to p53 and MDM2 staining, Boyd et al found that low MTBP expression was significantly associated with a reduced survival in SCCHN,16 providing evidence that MTBP could suppress disease progression by p53 status-dependent function in delaying disease progression. Iwakuma et al21 reported that MTBP was a metastasis suppressor in osteosarcoma cells. Agarwal et al12 also provided evidence that MTBP suppressed metastasis in vivo and attenuated cell migration and filopodia formation through inhibiting ACTN4. On the other hand, several other reports suggested an oncogenic role for MTBP. According to the findings from Grieb et al,15 an increase in gene transcription and amplification of MTBP resulted in a significantly decreased OS in patients with breast cancer, and inducible knockdown of MTBP expression significantly impaired tumor growth in triple-negative breast cancer cells. MTBP was also reported to be overexpressed in multiple cancer types, including cervical carcinoma, colorectal carcinoma, and gastric adenocarcinoma.14 It is still a controversy whether MTBP functions as a suppressor or a promoter of cancer progression even in the same kind of cancer. For example, Bi et al17 reported the suppressive metastasis function of MTBP in HCC. In marked contrast, Lu et al22 reported that MTBP promoted invasion and metastasis in HCC cells through the enhancement of MDM2-mediated degradation of E-cadherin. Considering the uncertainty about the role of MTBP in tumor metastasis, it is clearly necessary to define its function in stage I lung adenocarcinoma. In this study, we first showed that MTBP high expression was a poor prognostic biomarker for patients with stage I lung adenocarcinoma, and reported the promotion effect of MTBP on cell migration and invasion as an oncogene in lung cancer. However, the clinical significance of MTBP as a poor prognostic biomarker for early-stage lung cancer needs to be confirmed by a multicenter study with a large sample cohort.
In this study, either overexpression or inhibition of MTBP had no effect on cell viability in vitro. However, in vivo experiment suggested that MTBP served as a promoter of tumor growth. That might be because the microenvironment in vivo was more complicated than that of cell culture in vitro. There were more factors that can influence the tumor growth of xenograft, such as adhesion and pro-angiogenic factors, which were very different from cell culture in vitro.23 Similar results were also reported by Ota et al that ADAM23 increased tumor growth in vivo, whereas it played no role in cell proliferation in lung cancer cells in vitro.24 Moreover, the underlying mechanism through which MTBP affects the tumor growth in vivo is still undetermined. Thus, it is not surprising that there were inconsistencies between the in vivo results and the in vitro results.
In the big-data era, free data on the public databases provide a reliable way to search for key genes in a specific field. Here, we focused on the prognosis biomarkers of early-stage lung cancer. So, we mined the GEO database and identified MTBP, providing a new successful strategy for searching biomarkers. However, a prospective study is still needed to confirm whether MTBP could be regarded as a determinant factor in early-stage lung adenocarcinoma.
As for the mechanism of MTBP, it was reported that MTBP interacted with Treslin/TICRR as a binding factor to regulate cell cycle,13 interacted with MDM2 followed by p53 pathway,20 and interacted with MYC protein.14 Therefore, MDM2 and c-MYC proteins were also detected in our samples of lung adenocarcinoma to explore the potential mechanism of MTBP. We found out that there was a significant correlation between MTBP and MDM2 expression as revealed by tumor tissue staining (data not shown) but there was no correlation between MTBP and c-MYC expression (data not shown), suggesting that MTBP might still interact with MDM2 to perform its function in lung cancer. However, in our microarray analysis, there was no significant difference in the expression of either MDM2 or p53 after alteration of MTBP expression in lung cancer cells. Therefore, further investigation is still needed to understand whether the effect of MTBP on tumorigenesis in lung adenocarcinoma is dependent upon MDM2 or not. In our microarray analysis, 80 genes were identified as DEGs after change in the expression of MTBP in lung cancer cells, which contained six new downstream genes (DDIT4, TNFSF18, ZEB2, MMP13, SMAD4, and UBC) of MTBP correlative with tumor metastasis or proliferation. In NSCLC, ZEB2 is involved in cancer migration and invasion as a mediator of many molecules in inducing EMT, such as transcription factor E2F1,25 miR-154,10 miR-218,26 and miR-200c.27 Here, we first confirmed ZEB2-mediated EMT as an important upregulation mechanism of MTBP which is involved in tumor migration and invasion in lung cancer. However, the exact mechanism by which MTBP affects the expression of ZEB2 is still unknown and worthy of further study. Whether the regulation of MTBP on ZEB2 is dependent upon known co-factors, such as Treslin/TICRR, MDM2, or MYC, needs to be confirmed by further experiments. It can still be considered that MTBP promotes the aggressive phenotype of NSCLC by other candidate downstream genes (DDIT4, TNFSF18, MMP13, SMAD4, and UBC) as indicated in our microarray analysis.
The objective of this study was to search for prognostic biomarkers to identify patients with stage I lung adenocarcinoma at risk of recurrence and give them timely treatment. By GEO database mining, we first extracted DEG profile of those early-stage patients with poor prognosis. Then, we identified MTBP as a prognostic indicator of stage I lung adenocarcinoma, and confirmed its promotion role in migration and invasion of lung cancer cells by forced expression and interference expression. Overall, our data suggested that upregulation of ZEB2-mediated EMT might be a partial underlying mechanism behind the promotion effect of MTBP on cell metastasis. Thus, this study provided an insight that MTBP is a poor prognostic indicator of early-stage lung cancer.
Ethical approval
This study was approved by the ethical committee of Peking University Cancer Hospital & Institute. Written informed consent was obtained from all the patients included in this study.
Acknowledgments
This study was supported by Beijing Science New Star Plan (grant no Z11111005450000), National Natural Science Foundation of China (grant nos 81101598, 81202106, 81772494, 81772632, and 81773144), Beijing Municipal Administration of Hospitals Clinical Medicine Development of Special Funding Support (grant no ZYLX201509), Peking University (PKU) 985 Special Funding for Collaborative Research with PKU Hospitals (grant no 2013-5-05), and the interdisciplinary medicine Seed Fund of Peking University (grant no BMU2018MX019).
Disclosure
The authors report no conflicts of interest in this work.
References
Siegel RL, Miller KD, Jemal A. Cancer statistics, 2017. CA Cancer J Clin. 2017;67(1):7–30. | ||
Goldstraw P, Chansky K, Crowley J, et al; International Association for the Study of Lung Cancer Staging and Prognostic Factors Committee, Advisory Boards, and Participating Institutions; International Association for the Study of Lung Cancer Staging and Prognostic Factors Committee Advisory Boards and Participating Institutions. The IASLC Lung Cancer Staging Project: Proposals for Revision of the TNM Stage Groupings in the Forthcoming (Eighth) Edition of the TNM Classification for Lung Cancer. J Thorac Oncol. 2016;11(1):39–51. | ||
Burotto M, Thomas A, Subramaniam D, Giaccone G, Rajan A. Biomarkers in early-stage non-small-cell lung cancer: current concepts and future directions. J Thorac Oncol. 2014;9(11):1609–1617. | ||
Asamura H, Nakajima T, Mukai K, Shimosato Y. Nuclear DNA content by cytofluorometry of stage I adenocarcinoma of the lung in relation to postoperative recurrence. Chest. 1989;96(2):312–318. | ||
Bianchi F, Nuciforo P, Vecchi M, et al. Survival prediction of stage I lung adenocarcinomas by expression of 10 genes. J Clin Invest. 2007;117(11):3436–3444. | ||
Eguchi T, Kadota K, Chaft J, et al. Cell cycle progression score is a marker for five-year lung cancer-specific mortality risk in patients with resected stage I lung adenocarcinoma. Oncotarget. 2016;7(23):35241–35256. | ||
Ohba T, Toyokawa G, Osoegawa A, et al. Mutations of the EGFR, K-ras, EML4-ALK, and BRAF genes in resected pathological stage I lung adenocarcinoma. Surg Today. 2016;46(9):1091–1098. | ||
Chang PM, Yeh YC, Chen TC, et al. High expression of CHRNA1 is associated with reduced survival in early stage lung adenocarcinoma after complete resection. Ann Surg Oncol. 2013;20(11):3648–3654. | ||
Zou F, Seike M, Noro R, Kunugi S, Kubota K, Gemma A. Prognostic significance of ABCB1 in stage I lung adenocarcinoma. Oncol Lett. 2017;14(1):313–321. | ||
Clough E, Barrett T. The Gene Expression Omnibus Database. Methods Mol Biol. 2016;1418:93–110. | ||
Odvody J, Vincent T, Arrate MP, et al. A deficiency in Mdm2 binding protein inhibits Myc-induced B-cell proliferation and lymphomagenesis. Oncogene. 2010;29(22):3287–3296. | ||
Agarwal N, Adhikari AS, Iyer SV, Hekmatdoost K, Welch DR, Iwakuma T. MTBP suppresses cell migration and filopodia formation by inhibiting ACTN4. Oncogene. 2013;32(4):462–470. | ||
Boos D, Yekezare M, Diffley JF. Identification of a heteromeric complex that promotes DNA replication origin firing in human cells. Science. 2013;340(6135):981–984. | ||
Grieb BC, Gramling MW, Arrate MP, et al. Oncogenic protein MTBP interacts with MYC to promote tumorigenesis. Cancer Res. 2014;74(13):3591–3602. | ||
Grieb BC, Chen X, Eischen CM. MTBP is overexpressed in triple-negative breast cancer and contributes to its growth and survival. Mol Cancer Res. 2014;12(9):1216–1224. | ||
Vlatković N, El-Fert A, Devling T, et al. Loss of MTBP expression is associated with reduced survival in a biomarker-defined subset of patients with squamous cell carcinoma of the head and neck. Cancer. 2011;117(13):2939–2950. | ||
Bi Q, Ranjan A, Fan R, et al. MTBP inhibits migration and metastasis of hepatocellular carcinoma. Clin Exp Metastasis. 2015;32(4):301–311. | ||
Wang S, Han H, Hu Y, et al. MicroRNA-130a-3p suppresses cell migration and invasion by inhibition of TBL1XR1-mediated EMT in human gastric carcinoma. Mol Carcinog. 2018;57(3):383–392. | ||
Boyd MT, Vlatkovic N, Haines DS. A novel cellular protein (MTBP) binds to MDM2 and induces a G1 arrest that is suppressed by MDM2. J Biol Chem. 2000;275(41):31883–31890. | ||
Brady M, Vlatkovic N, Boyd MT. Regulation of p53 and MDM2 activity by MTBP. Mol Cell Biol. 2005;25(2):545–553. | ||
Iwakuma T, Tochigi Y, van Pelt CS, et al. Mtbp haploinsufficiency in mice increases tumor metastasis. Oncogene. 2008;27(13):1813–1820. | ||
Lu S, Zhou W, Wei H, He L, Li L. MTBP Promotes the Invasion and Metastasis of Hepatocellular Carcinoma by Enhancing the MDM2-Mediated Degradation of E-Cadherin. Dig Dis Sci. 2015;60(12):3681–3690. | ||
de Sousa É, Walter LT, Higa GS, Casado OA, Kihara AH. Developmental and functional expression of miRNA-stability related genes in the nervous system. PLoS One. 2013;8(5):e56908. | ||
Ota M, Mochizuki S, Shimoda M, et al. ADAM23 is downregulated in side population and suppresses lung metastasis of lung carcinoma cells. Cancer Sci. 2016;107(4):433–443. | ||
Wang T, Chen X, Qiao W, Kong L, Sun D, Li Z. Transcription factor E2F1 promotes EMT by regulating ZEB2 in small cell lung cancer. BMC Cancer. 2017;17(1):719. | ||
Shi ZM, Wang L, Shen H, et al. Downregulation of miR-218 contributes to epithelial-mesenchymal transition and tumor metastasis in lung cancer by targeting Slug/ZEB2 signaling. Oncogene. 2017;36(18):2577–2588. | ||
Jiao A, Sui M, Zhang L, et al. MicroRNA-200c inhibits the metastasis of non-small cell lung cancer cells by targeting ZEB2, an epithelial-mesenchymal transition regulator. Mol Med Rep. 2016;13(4):3349–3355. |
Supplementary materials
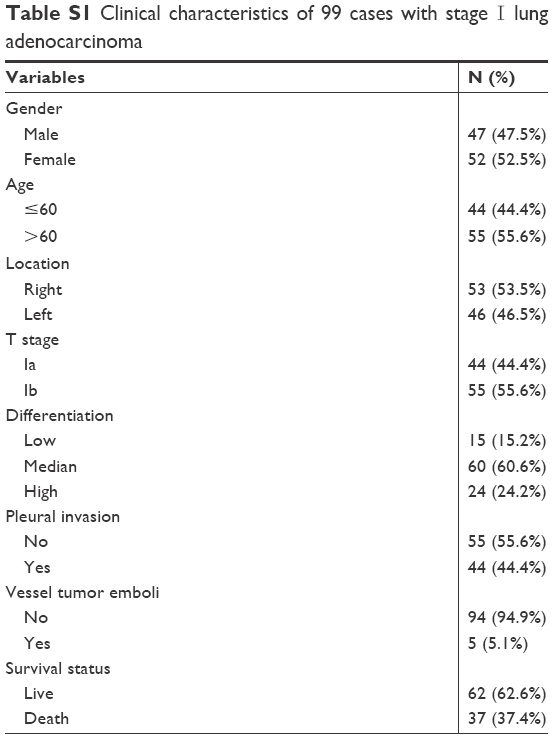 | Table S1 Clinical characteristics of 99 cases with stage I lung adenocarcinoma |
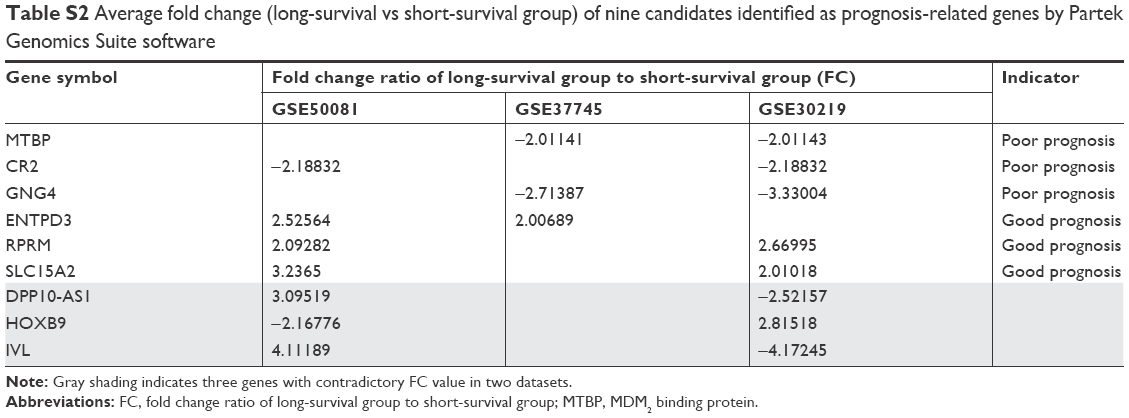 | Table S2 Average fold change (long-survival vs short-survival group) of nine candidates identified as prognosis-related genes by Partek Genomics Suite software |
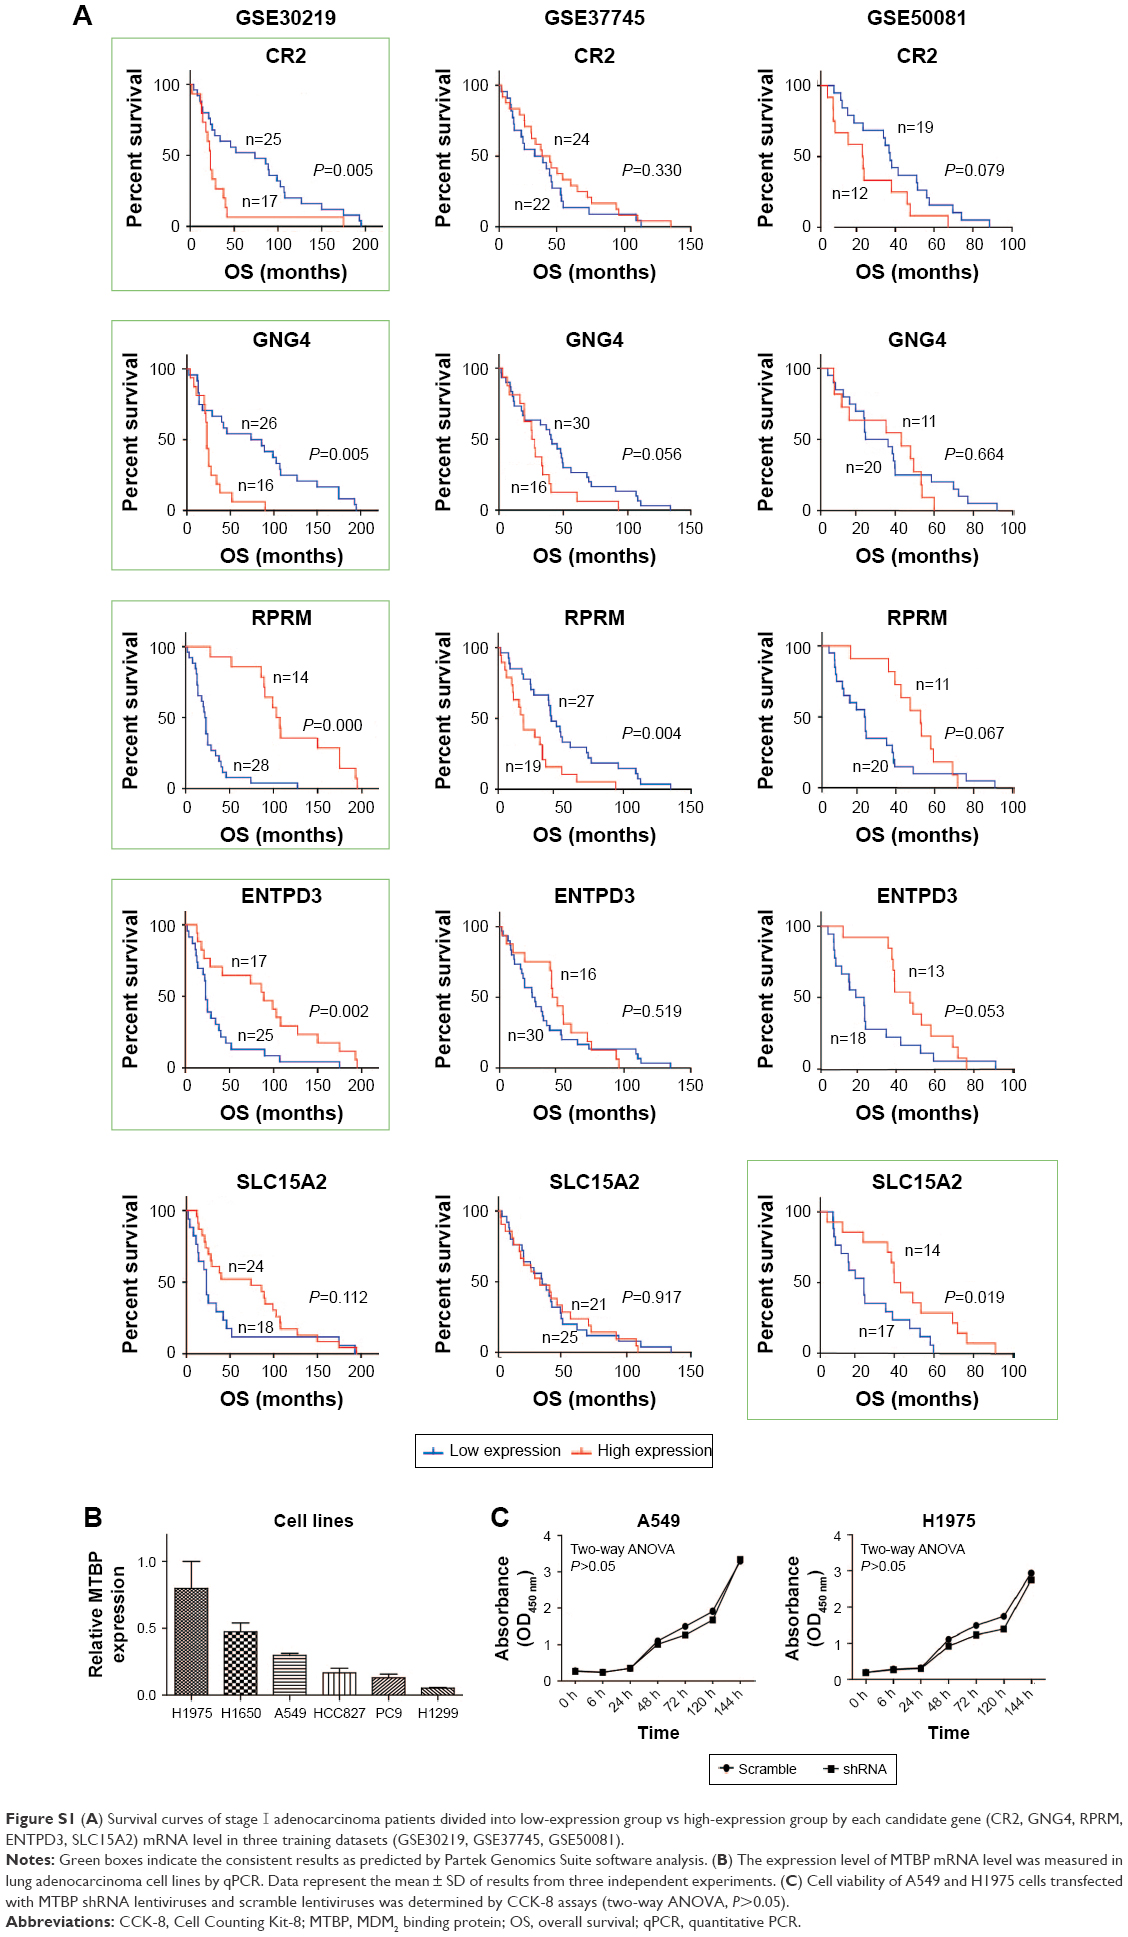 | Figure S1 (A) Survival curves of stage I adenocarcinoma patients divided into low-expression group vs high-expression group by each candidate gene (CR2, GNG4, RPRM, ENTPD3, SLC15A2) mRNA level in three training datasets (GSE30219, GSE37745, GSE50081). |
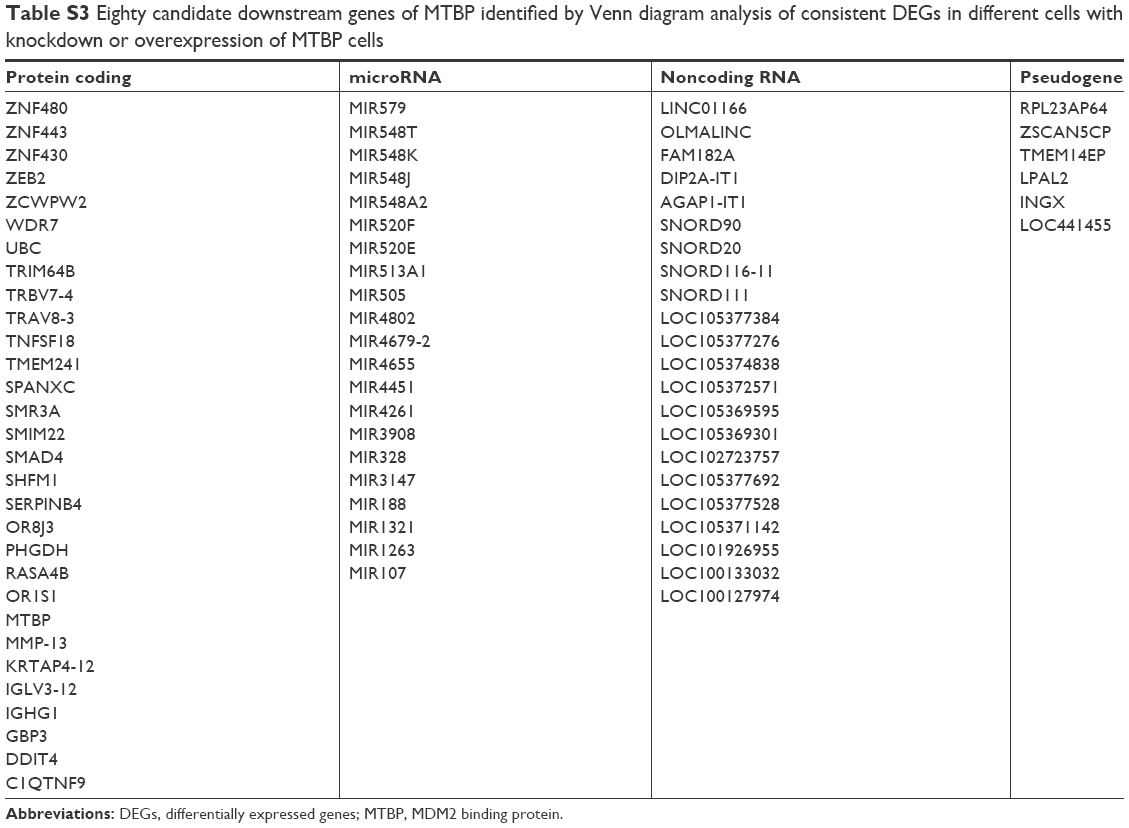 | Table S3 Eighty candidate downstream genes of MTBP identified by Venn diagram analysis of consistent DEGs in different cells with knockdown or overexpression of MTBP cells |
 © 2018 The Author(s). This work is published and licensed by Dove Medical Press Limited. The full terms of this license are available at https://www.dovepress.com/terms.php and incorporate the Creative Commons Attribution - Non Commercial (unported, v3.0) License.
By accessing the work you hereby accept the Terms. Non-commercial uses of the work are permitted without any further permission from Dove Medical Press Limited, provided the work is properly attributed. For permission for commercial use of this work, please see paragraphs 4.2 and 5 of our Terms.
© 2018 The Author(s). This work is published and licensed by Dove Medical Press Limited. The full terms of this license are available at https://www.dovepress.com/terms.php and incorporate the Creative Commons Attribution - Non Commercial (unported, v3.0) License.
By accessing the work you hereby accept the Terms. Non-commercial uses of the work are permitted without any further permission from Dove Medical Press Limited, provided the work is properly attributed. For permission for commercial use of this work, please see paragraphs 4.2 and 5 of our Terms.