")
Back to Journals » OncoTargets and Therapy » Volume 13
MRPL13 is a Prognostic Cancer Biomarker and Correlates with Immune Infiltrates in Breast Cancer
Authors Tao Z , Suo H, Zhang L, Jin Z, Wang Z, Wang D, Wu M , Peng N, Zhao Y , Chen B
Received 4 July 2020
Accepted for publication 13 October 2020
Published 27 November 2020 Volume 2020:13 Pages 12255—12268
DOI https://doi.org/10.2147/OTT.S263998
Checked for plagiarism Yes
Review by Single anonymous peer review
Peer reviewer comments 2
Editor who approved publication: Dr Federico Perche
Zuo Tao,* Huandan Suo,* Lei Zhang, Zining Jin, Zhen Wang, Danyu Wang, Ming Wu, Nanxi Peng, Yujie Zhao, Bo Chen
Department of Breast Surgery, The First Hospital of China Medical University, Shenyang, Liaoning Province 110001, People’s Republic of China
*These authors contributed equally to this work
Correspondence: Zuo Tao; Bo Chen
Department of Breast Surgery, The First Hospital of China Medical University, 155 North Nanjing Street, Heping District, Shenyang, Liaoning Province 110001, People’s Republic of China
Email [email protected]; [email protected]
Objective: To study the expression of MRPL13 in breast cancer tissues using TCGA database, analyze the correlation between the expression and clinicopathological characteristics of patients, and explore the role of MRPL13 in the development of breast cancer (BC).
Methods: The BC mRNA data and clinical information were downloaded from TCGA database. The correlation between MRPL13 expression and clinicopathological parameters was analyzed. Cox regression multivariate analysis was used to explore the factors affecting the prognosis of BC patients. The UALCAN database was used to analyze the expression level of MRPL13 in BC and its relationship with clinical pathological factors. The GSEA method was used to predict the possible regulatory pathways of MRPL13. Immune responses of MRPL13 expression were analyzed using TISIDB and CIBERSORT. Additionally, GEPIA, K-M survival analysis and data from the HPA were used to validate the outcomes.
Results: The expression of MRPL13 in BC tissues was significantly higher than normal counterparts, patients with low MRPL13 expression had a better survival prognosis, also indicated an independent prognostic factor. GSEA analysis showed that the regulation of cell migration, positive regulation of endothelial cell migration, and Notch signaling pathway were enriched in tissues with low expression of MRPL13. Additionally, depleting MRPL13 expression inhibited invasion in MCF-10A and MCF-7 cells. Furthermore, PCR showed that MRPL13 affected VEGFA and MMP gene expression. CIBERSORT analysis revealed that the amount of NK cells decreased when MRPL13 expression was high.
Conclusion: The expression of MRPL13 mRNA is upregulated in BC tissues, and the expression level of MRPL13 is significantly related to the clinicopathological factors of patients. High MRPL13 expression is a poor prognostic factor for BC, and it can be used as a molecular marker for prognosis judgment and as a potential therapeutic target.
Keywords: cancer genome map, breast cancer, MRPL13, clinical significance
Introduction
Breast cancer (BC) is one of the most common malignant tumors in women. Its incidence rate ranks first among the common tumors of women, and its mortality rate ranks second.1 In recent years, the survival of BC patients has been greatly improved, but there are still some patients with a poor prognosis and the incidence has been increasing yearly.2 Therefore, an in-depth study of the pathogenesis of BC and identification of a highly sensitive molecular marker can be of great significance for the early diagnosis and prognosis of BC.
Despite advances in screening and diagnosis and treatment technologies in recent years that have largely improved the survival rate of BC patients, it remains one of the major diseases with the highest female mortality rate and huge individual differences exist in the treatment results.3 Most current genetic prognosis prediction schemes are based on gene chips, which, while lacking specificity, may cause additional economic burden to patients.4 Therefore, it is of great clinical significance to discover more accurate and economical new biomarkers for prognosis prediction.
Multiple studies have found that mitochondrial dysfunction or disorders can cause various diseases.5 Depending on the degree of dependence of different tissues and organs on the mitochondria, different tissue-specific manifestations occur, such as tumors, cardiovascular diseases, hearing disorders, neurological diseases, developmental disorders, sensory disorders, and metabolic disorders.6–8 Mitochondria are organelles that produce the energy required by cells and play a key role in cell energy metabolism.9 Mitochondrial ribosomal proteins (MRPs) exist in the mitochondria of eukaryotic cells.10 After synthesis in the cytoplasm, they are transported from the cytoplasmic matrix to the mitochondria to complete the assembly of mitochondrial ribosomes and participate in the translation process of mitochondrial proteins.11,12 Mitochondrial ribosomal proteins are also involved in various cell life activities, including mitochondrial homeostasis regulation, cell differentiation, cell information transmission, and apoptosis.13,14 Mitochondrial dysfunction is closely related to tumorigenesis and development.15 Many MRPs have been found to be elevated in tumors.12 For example, high MRPL35 expression in colon cancer related to shorter overall survival and depletion of MRPL35 led to increased production of reactive oxygen species correlated with DNA damage, loss of cell proliferation, G2/M arrest, a decrease in mitochondrial membrane potential, apoptosis, and autophagy induction.16 MRPL41 protein stabilizes p53 and enhances its translocation to the mitochondria to induce apoptosis. Additionally, MRPL41 stabilizes Kip1 and arrests the cell cycle at the G1 phase in the absence of p53.17 Another study showed that MRPL41 arrests the cell cycle by increasing p21 and p27 levels under growth-inhibitory conditions.18
The Cancer Genome Atlas (TCGA) database is a multi-omics database that contains the genome, transcriptome, proteomics, and epigenomics data, as well as the associated clinical data, of different cancers. This study demonstrated the expression of mitochondrial ribosomal protein L13 (MRPL13) in BC tissues using The Cancer Genome Atlas (TCGA) database, analyzed its impact on patient prognosis, and explored its clinical value.
Materials and Methods
Data Collection
The Bioconductor/TCGA biolinks function package was used to download the BC RNA seq expression profile data from the TCGA database (https://portal.gdc.cancer.gov/). We used Perl script to combine the RNA seq data and transform the gene symbols. The BC mRNA data set comprised 1066 samples, of which 112 were paired samples adjacent to the tumor. The matched tumor and adjacent samples were selected according to the number of paired samples for the analysis of differential mRNA. The EdgR package in R software was used to normalize the data and screen for differential mRNAs. The screening conditions were P value <0.05 and | logFC |>2. The relative expression of MRPL13 was analyzed, and the clinical data of BC were downloaded from the TCGA database; the gender, age, TNM stage were selected for later screening. The gene expression value of MRPL13 was matched with the clinical data according to the sample number, and then the data were sorted using R software to obtain a baseline table of clinical data for subsequent Cox univariate and multifactor analyses. The project protocol was approved by the Institutional Ethics Committee of China Medical University before initiation of the study, and all patients provided a written informed consent for the use of the tumor tissues for clinical research.
Analysis of Clinicopathological Parameters and Gene Set Enrichment
By screening clinical data, cases with unknown or incomplete clinicopathological parameters and cases lacking prognostic follow-up data were excluded, and only those cases that included clinical parameters and survival data in the TCGA data set were retained. Finally, the data of 860 cases containing complete clinicopathological parameters and survival data were obtained. According to the mRNA sequencing data, the MRPL13 mRNA expression level greater than the median value in BC tissue was defined as high MRPL13 expression; otherwise, it was defined as low MRPL13 expression; gene set enrichment analysis (GSEA) software was used for analysis. According to the method in 1.2, the cases were divided into the MRPL13 high expression group and MRPL13 low expression group according to the expression level of MRPL13. In this study, the c2.cp.kegg.v7.0.symbols.gmt, c5.all.v7.0.symbols.gmt, and c7.all.v7.0.symbols.gmt data sets were obtained from the MsigDB database of the GSEA website. Next, enrichment analysis was performed according to the default weighted enrichment statistics method, and the number of random combinations was set to 1000 times.
Quantitative Real-Time PCR (SYBR Green Method)
Quantitative real-time PCR was performed using SYBR Green PCR master mix (Applied Biosystems) in a total volume of 20 µL using the 7900HT fast real-time PCR system (Applied Biosystems) as follows: 50°C for 2 min, 95°C for 10 min, 40 cycles of 95°C for 15 s, and 60°C for 60 s. The sequences of the primer pairs were as follows: matrix metalloproteinase 2 (MMP-2) forward, 5ʹ-ACGAATTTGCCGACAGAGATG-3ʹ, MMP-2 reverse, 5ʹ-GGGTATCCGTGTAGCACATTCT-3ʹ; vascular endothelial growth factor A (VEGFA) forward, 5ʹ- GGCCTCCGAAACCATGAACT-3ʹ, VEGFA reverse, 5ʹ- TCGTGATGATTCTGCCCTCC −3ʹ; GAPDH forward, 5ʹ- ATAGCACAGCCTGGATAGCAACGTAC −3ʹ, GAPDH reverse, 5ʹ- CACCTTCTACAATGAGCTGCGTGTG-3ʹ; MRPL13 forward 5ʹ-CCACAATGACACCAGAATAC-3ʹ MRPL13 reverse, 5ʹ-GAAGCCAACAGGACAGATA-3ʹ.
Real-time PCR was then performed for each sample using the Human Tumor Metastasis RT2 Profiler TM PCR Array (No. 330231; Super Array Bioscience) in a Thermal Cycler Dice Real-Time System (Applied Biosystems® 7900HT) according to the manufacturer’s instructions. The data were normalized to the GAPDH levels using the 2−ΔΔCt method.
Western Blotting
The total protein fractions from tumor tissues and cultured cells were extracted using the Nuclear and Cytoplasmic Protein Extraction Kit (Beyotime, China). The protein concentrations were detected using the BCA protein assay kit (Beyotime, Haimen, China). Twenty-five micrograms of total nuclear protein was subjected to SDS-PAGE and then were electrotransferred onto PVDF membranes (Millipore, Billerica, MA, USA). After blocking with milk (5%) for 2 h, the membranes were incubated overnight at 4°C with diluted (1:2000) primary antibodies as follows: polyclonal rabbit anti-MRPL13 (1:500, Novus Biologicals, NBP2-32572), polyclonal rabbit anti-MMP9 (Santa Cruz, 1:800), mouse monoclonal antibody against VEGFA (1:500; Santa Cruz Biotechnology, Santa Cruz, CA, USA), mouse monoclonal antibody against MMP-2 (1:500; Santa Cruz Biotechnology) and vinculin (keygen, China, 1:1000). Each corresponding secondary antibody was incubated at room temperature for 1 h at 37°C. The protein bands were identified using an ECL system (Millipore, Bedford, MA, USA). The relative protein levels were calculated based on vinculin protein as a loading control.
Cell Culture and RNA Transfection
MRPL13-targeting siRNA-1 (sc-77761) and negative siRNA (sc-37007) were obtained from Santa Cruz Biotechnology, siRNA-2 was from the published literature:19 MRPL13 (5′-GUCUAGAUGAGUACACACA and 5′-UGUGUGUACUCAUCUAGAC). Human BC cell lines (MCF-10A and MCF-7) were purchased from the American Type Culture Collection (Manassas, VA, USA). Both cell lines were plated at a density of 8× 10⁴ cells each per well in a 24-well plate and were maintained in RPMI 1640 medium (Gibco, USA) without antibiotics and supplemented with fetal bovine serum (FBS, HyClone, USA) for 24 h before the experiment. The cells were then transfected with MRPL13 siRNAs for 36 h using Lipofectamine LTX reagent (Invitrogen) according to the manufacturer’s recommendation.
Transwell Method to Detect Cell Invasion Activity
For the invasion assay, polycarbonate filters were coated with 20 μL of Matrigel (1:5; BD Bioscience) and placed in a Transwell Permeable chamber (Costar, USA). MCF-10A and MCF-7 cells were plated into 96-well plates at 4×10⁴ cells/mL for each well for the invasion assay; 1×10⁵ cells were counted and suspended in 100 µL of serum-free medium and then were added to the Transwell upper chamber (Costar, Corning, NY, USA) after transfection; Next, 600 µL of complete medium (DMEM; Invitrogen; Thermo Fisher Scientific, Inc., Waltham, MA, USA) was added into the lower chamber. Following a 48-h incubation, the untransferred cells and Matrigel were removed using a cotton swab. The transfected cells were fixed using 4% paraformaldehyde for 30 min, permeabilized with 0.2% Triton X-100 (KeyGen, Nanjing, China) for 15 min, and stained using 0.05% gentian violet (KeyGen) dye for 5 min. The cells in five random regions were counted, and the average count was calculated. The experiment was performed in triplicate.
Immune Infiltrate Analysis
The TISIDB correlation module was used to evaluate potential relationships between MRPL13 expression and TIICs. The TISIDB database (http://cis.hku.hk/TISIDB/index.php) uses the dataset information of currently published immunotherapy cohorts and existing literature reports. It is a useful website that provides a vast amount of tumor immunity-related data and is beneficial for comprehensive study of the interaction between tumors and immunity. First, the site manually compiled 4176 records from 2530 publications and includes 988 genes related to antitumor immunity. Second, this website analyzes high-throughput screening and genomic profiling data to identify genes that are related to the resistance or sensitivity of tumor cells to T-cell-mediated killing and immunotherapy. Third, the website precalculates the association between genes and immune functions (such as lymphocytes, immune modulators and chemokines) for 30 TCGA cancer types. The website uses ten analysis directions: function, literature, high-throughput screening, immunotherapy, tumor-infiltrating lymphocytes (TIL), immunomodulators, chemokines, subtypes, clinical and drugs. Additionally, to assess the relative variations in gene expression among the sample sets, we used a deconvolution algorithm based on gene expression called CIBERSORT (http://cibersort.stanford.edu/). Using CIBERSORT, we measured the immune response of 22 TIICs to evaluate their association with MRPL13 expression in BC and to uncover correlations among TIICs. We used standard annotation files to establish gene expression datasets and used the default signature matrix at 1000 permutations. R software (including ggplot2, ggpubr, and ggExtra packages) was used to analyze the correlation between MRPL13 and immune checkpoints by TCGA data. To analyze the influence of MRPL13 on the microenvironment of the immune system, we utilized 846 tumor samples that we classified into 2 groups. To determine the types of lymphocytes affected by MRPL13, we set up the p-value <0.05.
The human protein atlas database (HPA) (www.proteinatlas.org) was used to analyze the protein expression of MRPL13 between normal and BC tissues. The HPA provides access to 32 human tissues and their protein expression profiles and uses antibody profiling to accurately assess protein localization. Additionally, the HPA provides measurements of RNA levels.
Statistical Analysis
All statistical analyses were conducted using R (Version 3.5.3). To calculate the 95% CI and HR, we used both univariate and multivariate models of Cox analysis. A P-value <0.05 for MRPL13 expression was set as the threshold. The correlations between the clinical characteristics and MRPL13 expression were analyzed using logistic regression. The correlations between MRPL13 and immune checkpoints were used Pearson test. In GSEA, gene sets with a false discovery rate (FDR) <0.2 were taken as significantly enriched gene sets.
Results
Survival Outcomes and Variable Analysis
The TCGA database was used to identify differences in the MRPL13 mRNA levels in normal and tumor tissues. In total, 1066 tumor files and 112 normal files were transformed to convert the count data to values more similar to those obtained from microarrays. The expression of MRPL13 in normal and BC samples was plotted on a boxplot (Figure 1A and B). Our analysis revealed the prevalence of MRPL13 expression in tumor tissues (p-value = 2.2 × 10−48). Analysis of paired samples also revealed that MRPL13 is highly expressed in cancer tissues (P-value=2.2*10−28; Figure 1C). As shown in Table 1A, we used Cox analysis to explore connections between MRPL13 expression and OS, as well as other multivariable characteristics in BC patients. Univariate analysis of correlation revealed that some factors, including age (HR = 1.034; p-value < 0.001), pathological stage (HR = 2.114; p-value < 0.001), tumor status (T) (HR = 1.456; p-value < 0.001), metastasis status (M) (HR = 6.523; p-value < 0.001), node status (N) (HR = 1.700; p-value < 0.001) and MRPL13 expression (HR = 1.040; p-value < 0.001) were significantly correlated with OS. The distribution of MRPL13 expression, survival status of patients with BC, and expression profiles of MRPL13 are shown in Figure 1D. Our multivariate analysis, depicted as a forest boxplot in Figure 1E, revealed that MRPL13 expression (p-value = 0.002) was an independent factor for prognosis (Table 1B). Tissue expression of MRPL13 protein was visualized using immunohistochemistry via HPA or Western blotting (Figure 1F–G).
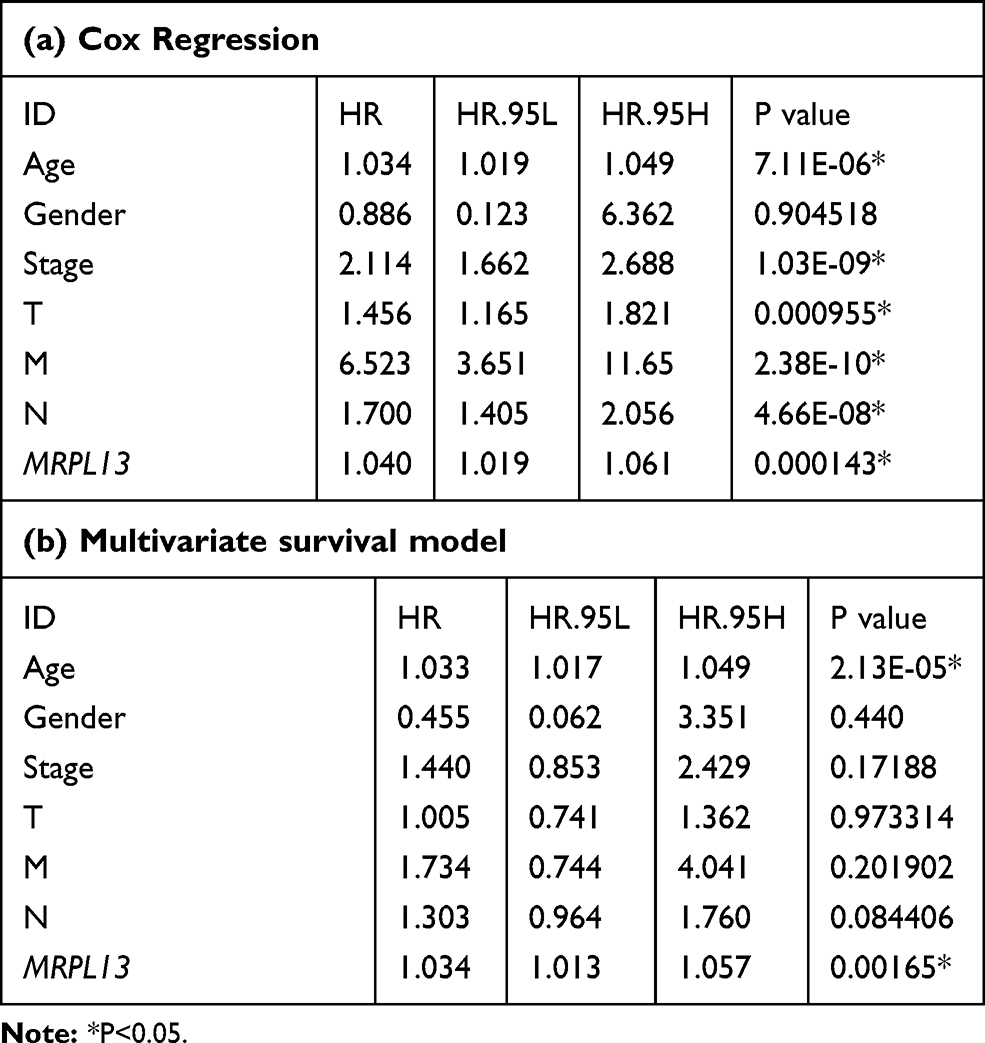 |
Table 1 Correlation Between Overall Survival and Multivariable Characteristics in TCGA Patients via (a) Cox Regression (b) Multivariate Survival Model |
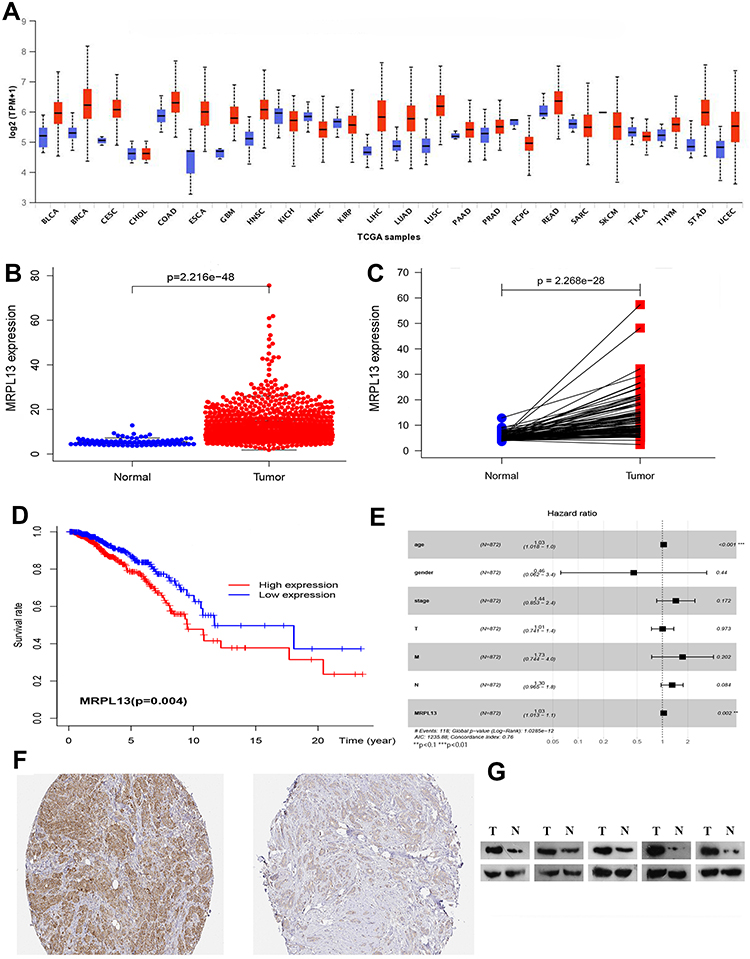 |
Figure 1 (A–C) Expression of MRPL13between normal and tumor tissues from the UALCAN website and TCGA database. (D) Levels of MRPL13 mRNA expression and overall survival based on data obtained from TCGA. (E). Multivariate Cox analysis of MRPL13 expression and other clinicopathological variables. (F–G) The expression of MRPL13 protein was visualized using immunohistochemistry via HPA and analyzed by Western blotting. |
Relationship Between MRPL13 Expression and Clinic Pathology
The relationship between the MRPL13 expression levels and various clinicopathological parameters of BC patients was evaluated. TCGA contains 846 BC samples including MRPL13 expression data obtained from patients with various clinical characteristics. Increased expression of MRPL13 was significantly correlated with cancer stage (p-value < 0.001; Figure 2A), cancer subclass (p-value < 0.001; Figure 2B) and nodal metastasis status (p-value < 0.001; Figure 2C). From the UALCAN website (http://ualcan.path.uab.edu/analysis.html), univariate analysis uncovered a correlation between MRPL13 expression and poor clinicopathological and prognostic characteristics. Increased MRPL13 expression levels in BC were significantly correlated with the tumor status (III vs I; p-value = 0.019), stage (III vs I; p-value = 0.010), grade (II vs I, p-value = 0.020; III vs I, p-value = 0.000; IV vs I, p-value = 0.002), and patient age (p-value = 0.014). These results suggest that BC patients with high levels of MRPL13 expression are more prone to have tumors that are more advanced in the nodal metastasis status, cancer subclass and cancer stage than those with low levels of MRPL13 expression (Table 2).
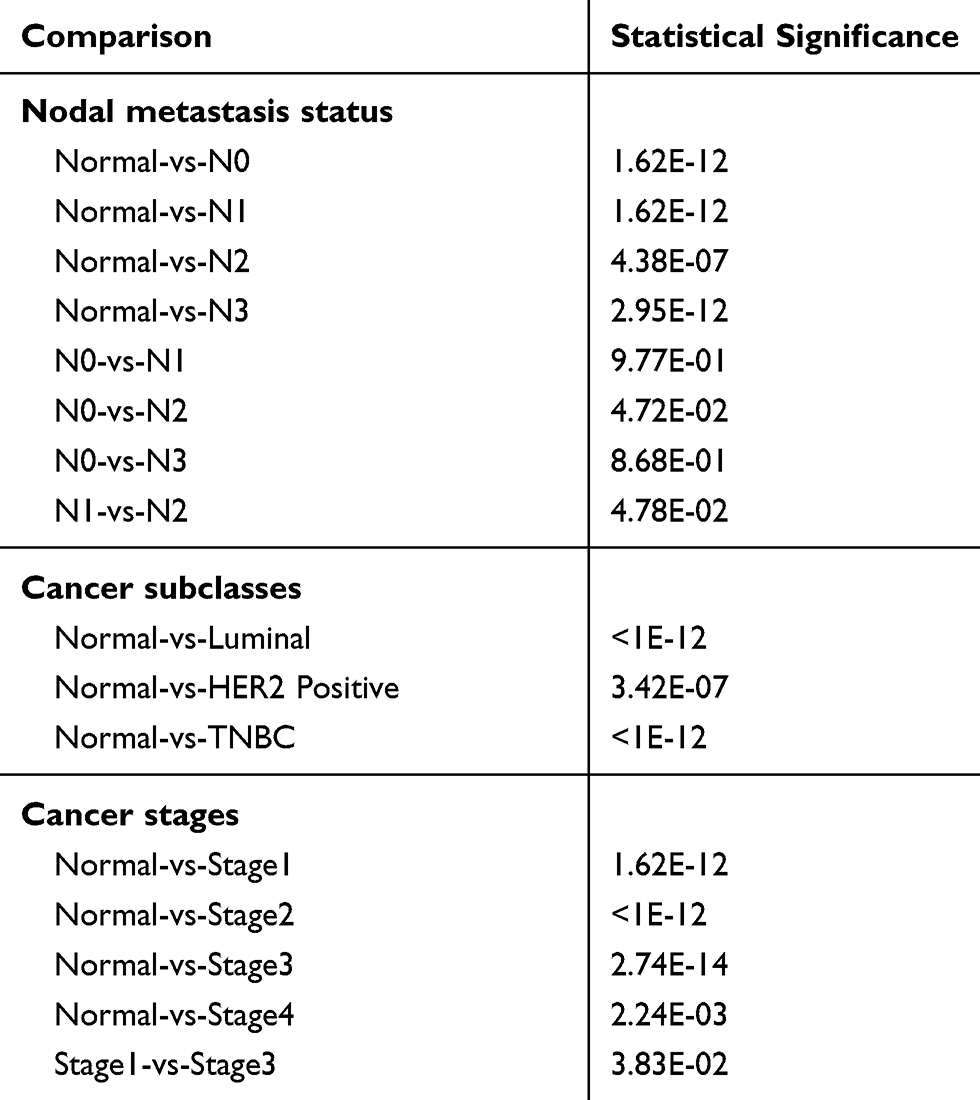 |
Table 2 Association Between MRPL13 Expression and Clinicopathological Characteristics from UALCAN Website |
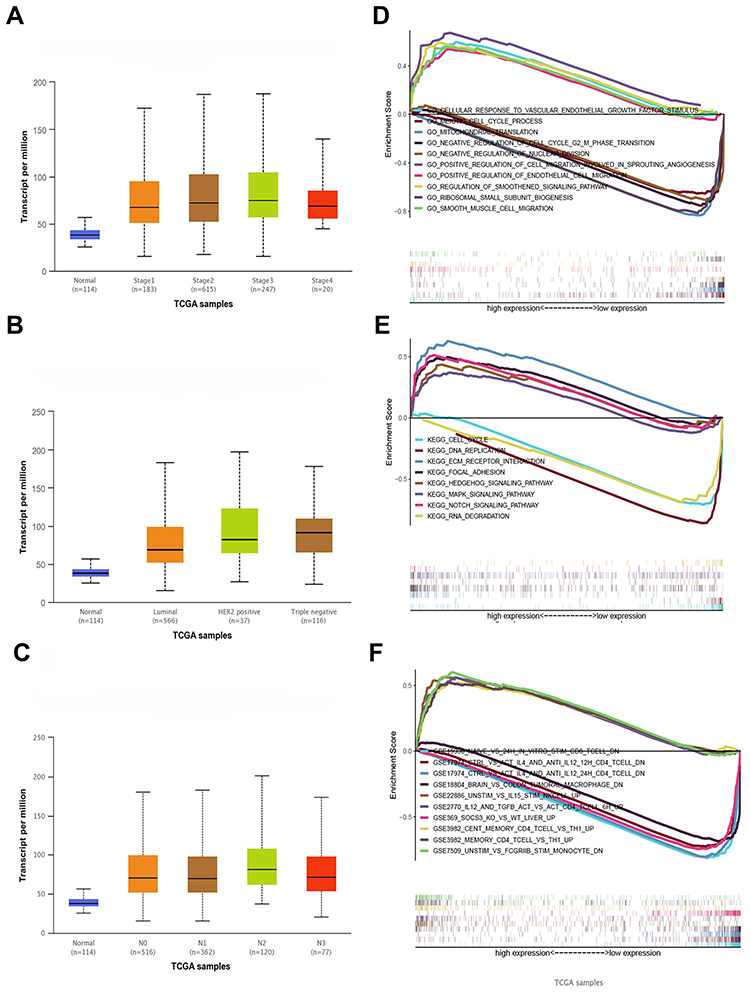 |
Figure 2 (A) MRPL13 expression is correlated significantly with cancer stage, (B) cancer subclass histological grade (C) and nodal metastasis status. (D) The KEGG pathway showed five positively correlated groups and five negatively correlated groups. (E) GO term analysis revealed five positively correlated groups and five negatively correlated groups. (F) Immunologic signatures pathway showed five positively correlated groups and five negatively correlated groups. |
GSEA Investigation of MRPL13
GO, KEGG pathway and immunologic analyses were performed to explore the potential biological functions of MRPL13. GSEA revealed significant differences (NOM p-value < 0.050) in the enrichment of GO terms, KEGG pathways and immunologic signatures in samples with high levels of MRPL13. We selected the most highly enriched signaling pathways based on their normalized enrichment score (NES).
As shown in Table 3, GO annotation revealed five categories that were positively correlated with high levels of MRPL13: regulation of cell migration involved in sprouting angiogenesis, regulation of smoothened signaling pathway, cellular response to vascular endothelial growth factor stimulus, smooth muscle cell migration, and positive regulation of endothelial cell migration. GO analysis also uncovered five negatively correlated categories: meiotic cell cycle process, mitochondrial translation, negative regulation of cell cycle G2 m phase transition, ribosomal small subunit biogenesis and negative regulation of nuclear division. The biological processes and molecular functions strongly associated with MRPL13 were cell migration, angiogenesis and smoothened signaling pathway (Figure 2D).
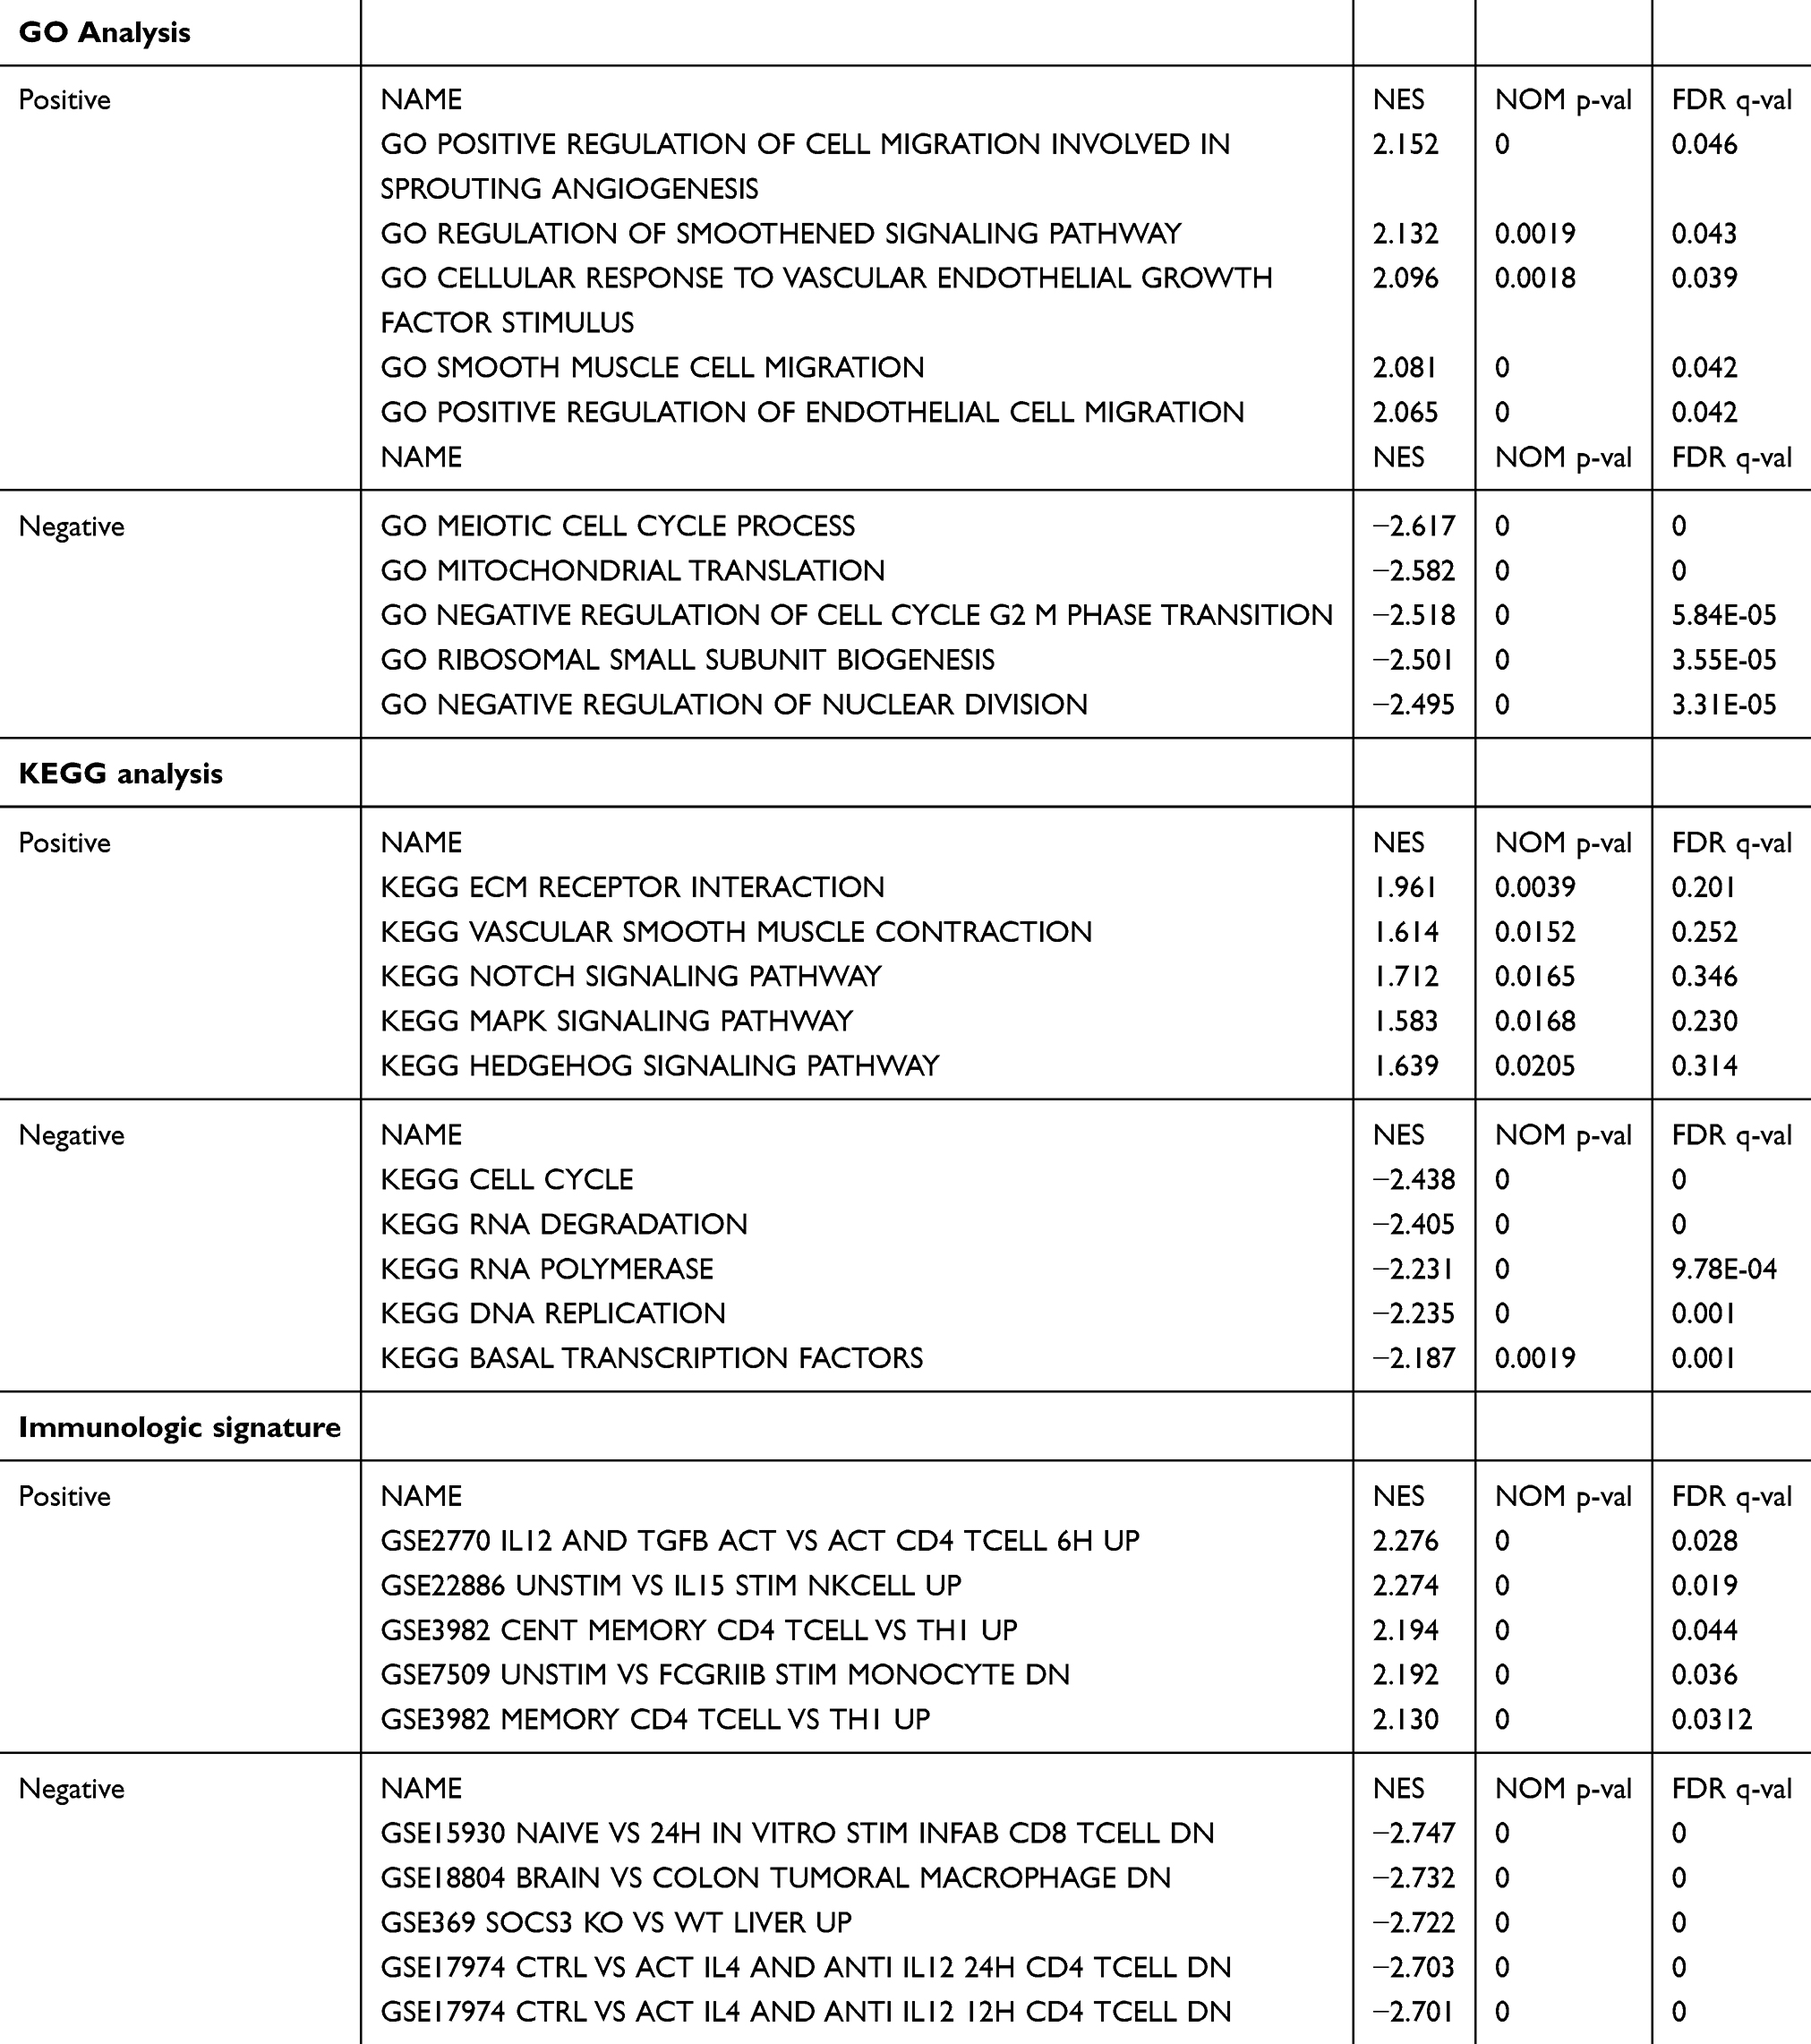 |
Table 3 Signaling Pathways (KEGG, GO, Immunologic Signatures) Most Significantly Correlated with MRPL13 Expression Based on Their Normalized Enrichment Score (NES) and p-value |
KEGG pathway analysis showed five pathways that had the strongest positive correlation with MRPL13 expression: ECM receptor interaction, vascular smooth muscle contraction, notch signaling pathway, MAPK signaling pathway, and hedgehog signaling pathway. The five pathways with the strongest negative correlation were cell cycle, RNA degradation, RNA polymerase, DNA replication and basal transcription factors (Figure 2E). These results indicate that the pathways regulating cell cycle RNA degradation and DNA replication, which are critically important in BC patients, were strongly associated with MRPL13 expression.
Immunologic signature analysis showed five pathways that had the strongest positive correlation with MRPL13 expression: IL12 and TGFB ACT vs ACT CD4 T cell 6 h up, UNSTIM vs IL15 stim NKCELL up, cent memory CD4 T cell vs TH1 up, unstim vs FCGRIIB stim monocyte dn, and memory CD4 T cell vs TH1 up. The five pathways with the strongest negative correlation were naive vs 24 h in vitro stim infab CD8 T cell dn, brain vs colon tumoral macrophage dn, SOCS3 KO vs wt liver up, ctrl vs ACT IL4 and anti IL12 24 h CD4 T cell dn, ctrl vs ACT IL4 and anti IL12 12 h CD4 T cell dn (Figure 2F). These results indicate that the pathways regulating CD4+, CD8+ and macrophage expression, which are critically important in BC patients, are strongly associated with MRPL13 expression.
MRPL13 Regulates MMPs and VEGFA Expression in BC Cells
To determine whether higher levels of MRPL13 contributed to the invasion of BC cells, we employed siRNA to knock down MRPL13 expression in MCF-10A and MCF-7 cancer cell lines. MRPL13 expression was unaffected by transient transfection of negative siRNA (Neg. siRNA), whereas MRPL13-specific siRNA-1 (MRPL13 siRNA) considerably reduced the mRNA and protein expression levels 36 h after siRNA treatment (data not shown). As shown in Figure 3, MRPL13 knockdown blocked BC cell invasion using the Matrigel invasion assay.
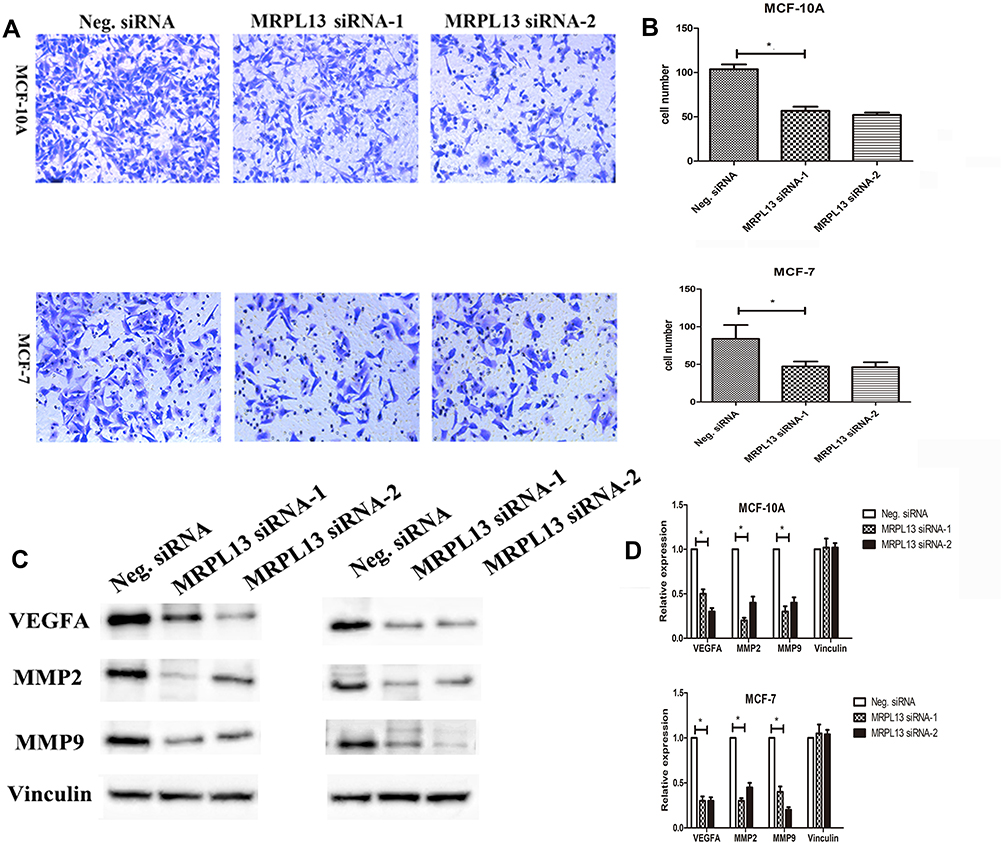 |
Figure 3 Invasion assays of MCF-10A and MCF-7 cells transfected with Neg. siRNA and MRPL13 siRNA. The MRPL13 siRNA group showed a measurable blocking effect on cell invasion in both cell lines. The numbers of cells invading into the lower surface of the filter were counted, and a significant difference was observed (A, B; *P < 0.05). Columns, mean; bars, SD; Expression of vascular endothelial growth factor A (VEGFA), matrix metalloproteinase 2 (MMP-2), and MMP-9in MRPL13-depleted MCF-10A and MCF-7 cells. (C) Western blotting and (D) real-time PCR analysis showed the expression changes after silencing MRPL13 in MCF-10A and MCF-7 cells. The expression levels of VEGFA, MMP-2, and MMP-9 were explored. (Columns, mean; bars, SD. *P < 0.05). |
To obtain further insight into the functions of MRPL13 in BC cell invasion and metastasis, the mRNA expression profile of siMRPL13-transfected MCF-10A cells was compared with that of Neg. siRNA-transfected cells using a Human Tumor Metastasis RT2 ProfilerTM PCR Array containing 84 cell metastasis-related genes. Four upregulated genes and six downregulated genes (at least 2-fold) were identified in MRPL13 siRNA-transfected MCF-10A cells but not in Neg. siRNA-transfected controls (Supplementary Table S1). Subsequently, MMP2, MMP9 and VEGFA, which showed the greatest fold change (3-fold) after MRPL13 knockdown, were selected and evaluated by Western blot analysis. We observe remarkable changes in their expression (Figure 3).
Relationship Between MRPL13 Expression and Tumor-Infiltrating Immune Cells
Independent tumor-infiltrating lymphocytes play a key role in the prediction of the overall survival rate and sentinel lymph node status. Therefore, we used TISIDB to analyze possible correlations between MRPL13 expression and the levels of immune infiltration in BC. MRPL13 expression showed a positive correlation with the levels of active_CD4+ (Act_CD4+; p-value =1.2 × 10⁻¹⁷), active_CD8+ (Act_CD8+; p-value = 7.5 × 10⁻⁹), active dendritic cells (Act DC; p-value = 1.3 × 10⁻⁵) and Tgd cells (p-value = 1.03 × 10⁻⁵): negative correlation with the levels of NK cells (p-value = 2.1 × 10⁻²²), neutrophil cells (p-value<2.2 × 10⁻¹⁶) and active B cells (p-value = 4.05 × 10⁻⁸) (Figure 4A). These results indicate that MRPL13 plays a key role in immune infiltration in BC. Additionally, the correlation between MRPL13 and commonly used immune checkpoints (CTLA4, PD-L1, LAG3, TIM3) were analyzed, the results indicated that MRPL13 was positively correlated with CTLA4 (R=0.15, p-value = 5.0 × 10⁻⁷), LAG3 (R=0.21, p-value = 1.2 × 10⁻¹³) and TIM3 (R=0.058, p-value = 0.045) (Figure 4B). Moreover, we tried to determine whether the tumor immune microenvironment was different in BC patients with high MRPL13 levels compared with that in BC patients with low MRPL13 levels. The 846 tumor samples were divided into 2 groups based on MRPL13 expression, with 423 samples in the high expression group and 423 samples in the low expression group. We used an established computational resource, CIBERSORT, to explore the gene expression profiles of downloaded samples to determine the levels of 22 types of immune cells. The CIBERSORT algorithm applied to the 22 immune cell subtypes helped to assess differences in their expression levels in the high and low MRPL13 expression groups (Figure 4C). Resting CD4 memory T cells, activated resting CD4 memory T cells, follicular helper T cells, monocytes, M0 macrophages, M1 macrophages and resting mast cells were affected by MRPL13 expression between the high and low MRPL13 groups. Compared with the low expression group, M0/M1 macrophages, T cells CD4 memory activated and T cells follicular helper were increased (p-value < 0.001) in the high expression group, whereas resting CD4 memory T cells, B cells naive and resting mast cells were decreased (p-value < 0.05). We also assessed possible correlations among the 22 types of immune cells, the resulting heat map revealed that the ratios of different tumor-infiltrating immune cell subpopulations were weakly to moderately correlated (Figure 4D).
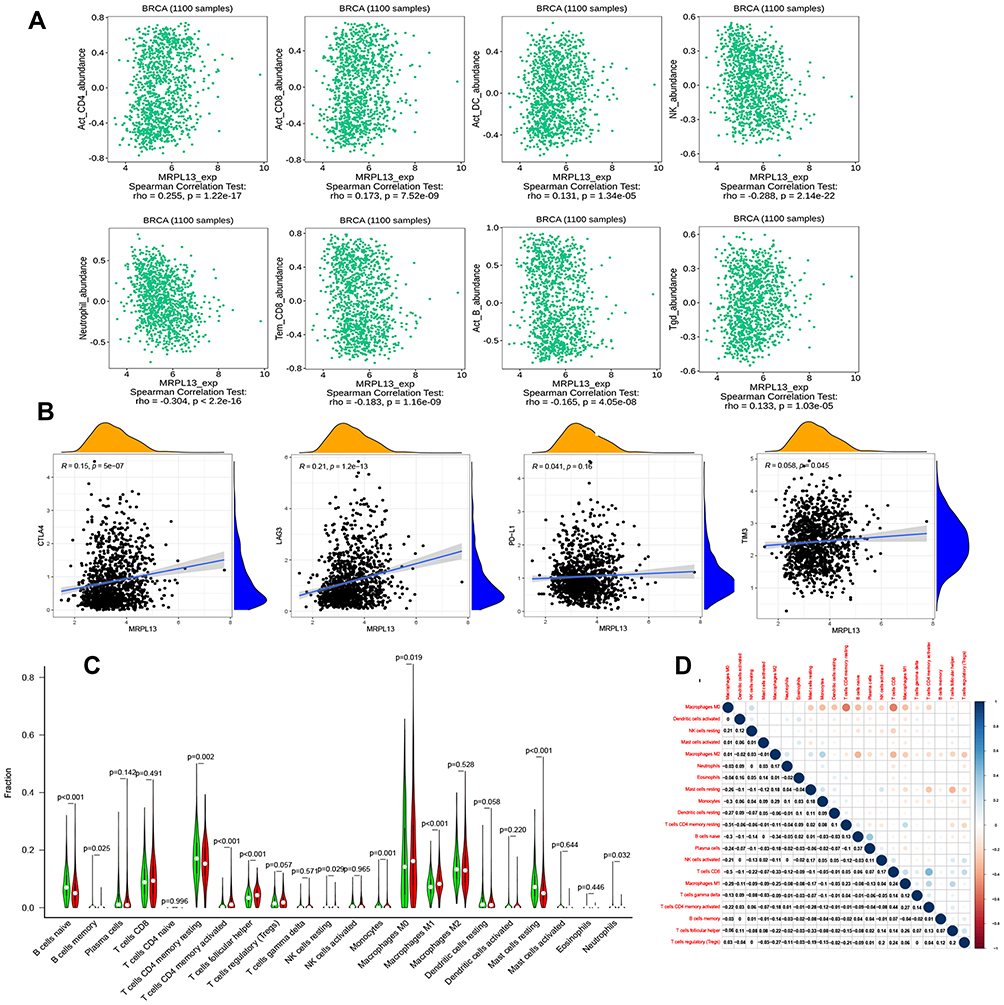 |
Figure 4 (A) Correlation between MRPL13 expression and immune infiltration levels from the TISIDB website (http://cis.hku.hk/TISIDB/index.php). (B) The correlation between MRPL13 and immune checkpoint molecules (PD-L1, CTLA4, TIM3 and LAG3). (C) Different proportions of 22 subtypes of immune cells in the high and low MRPL13 expression groups in TCGA BC samples. (D) Heatmap of 22 immune infiltration cells in tumor samples. |
Discussion
In this study, the TCGA database and multiple online analysis tools were used to analyze the mRNA and protein expression levels of MRPL13 in BC tissues and adjacent tissues, the expression levels of MRPL13 mRNA in different BC stages, and the correlation between MRPL13 mRNA and patient prognosis. Gene expression profiling, immunohistochemistry, and WB results showed that BC tissues highly expressed MRPL13 compared with adjacent tissues. Cancer subclasses were different from normal tissues, but no significant difference was found between different subclasses. Cancer stage analysis found significant differences in stage 1 vs stage 3, suggesting that MRPL13 expression is related to BC progression. MRPL13 expression was significantly related to overall survival, which was significantly lower in patients with high expression than in those with low expression (P <0.001). In summary, MRPL13 is an important molecule to promote BC progression and may be a target for BC treatment as previous studies.20
Through pathway enrichment analysis, we found that MRPL13 participates in pathways such as regulation of cell migration, positive regulation of endothelial cell migration, notch signaling pathway, and MAPK signaling pathway. Through cell invasion experiments, we confirmed that interference with BC cell invasion was decreased after interference with MRPL13 expression. Additionally, further study by PCR leads to the question of how MRPL13 promotes BC progression. Invasion experiments demonstrated that inhibition of MRPL13 expression reduces the invasive ability of BC cells. Additionally, MRPL13 knockdown decreases VEGFA, MMP-2, and MMP-9expression. VEGF can stimulate the proliferation of vascular endothelial cells and increase vascular permeability. It is also considered one of the main mediators of angiogenesis that plays a key role in tumor progression. In the early stage of hypoxia, cancer cells activate multiple signaling pathways to produce multiple VEGFs, promoting the proliferation of endothelial cells and forming new vascular endothelial cells.21,22 The higher expression of VEGFAis closely related to tumor micro vessel density, tumor recurrence and metastasis, as well as the poor prognosis of patients.23,24 Silencing VEGFA in BC can significantly inhibit cancer angiogenesis and metastasis.25,26 Therefore, anti-VEGF therapies, such as the anti-VEGFantibody bevacizumab, have been widely used clinically and have improved the survival of some patients.27 Matrix metalloproteinases are well known to play an important role in ECM degradation, tumor cell invasion and metastasis.28 Matrix metalloproteinase 2 (MMP-2) and MMP-9 have been reported to promote invasion and tumorigenesis in different cancer cells and are correlated with metastasis and poor patient prognosis in lung cancer, colorectal cancer, and prostate cancer.29–31 Thus, MRPL13 expression may affect BC progression through its effect on MMPs. We examined VEGFA, MMP-2 and MMP-9 expression before and after siRNA transfection. The result showed that MRPL13 significantly affects invasiveness by changing MMP expression.
During tumor development, immune cells in the tumor microenvironment (TME) infiltrate and secrete inflammatory mediators, forming an inflammatory microenvironment, which can assist tumor immune escape and distant metastasis as the tumor progresses.32,33 In most patients with solid tumors, abnormal blood vessels can help the tumor escape the immune system.34,35 First, the leakage of tumor blood vessels and disturbance of lymphatic drainage function will lead to an increase in TME interstitial fluid pressure, but tumor cells can overcome these conditions to obtain a stronger survival advantage.36 Abnormal blood vessels and damaged perfusion can also limit cytotoxic drugs and immune cells from circulating the tumor, thereby limiting their anticancer activity. In addition, abnormally leaking blood vessels can promote the shedding of cancer cells into the blood.37,38 After entering the systemic circulation, some tumor cells can spread to distant organs and form metastatic tumors. The infiltration of cytokines such as VEGF from the TME into the systemic circulation can also enhance the outflow and metastasis of metastatic cancer cells from blood vessels to distant organs.39,40 By contrast, although CD8+ cytotoxic T lymphocytes (CTLs) can also colonize tumors, various factors in the TME often make these cells dysfunctional or restrict their entry into tumors.41 Therefore, drugs targeting these VEGF molecules can improve the response of immunotherapy, normalize the abnormal tumor vascular system, and increase the infiltration of immune effector cells.42 When we found that MRPL13 is involved in the enrichment of vascular endothelial metastasis, we further analyzed the expression of immune-infiltrating cells. Classical immunohistochemical analysis relies on a marker to identify a specific immune cell subgroup, cannot identify more subgroups and performs poorly in capturing certain cell phenotypes, such as activated and inactivated lymphocytes. Therefore, we used CIBERSORT to infer the proportion of the 22 immune cell subpopulations from transcriptome data and used gene expression profiles to assess the relative proportions of different immune cell subpopulations. At the same time, by searching the data from the TISIDB website, we further enriched our research results, which revealed a systematic difference between theMRPL13 expression and infiltration levels of immune cell macrophages and mast cells. Our findings showed that M0/M1 macrophages were found at increased levels in the high MRPL13 expression group, whereas levels of NK cells and mast cells were decreased from TISIDB data. NK cells, as an important part of the body’s innate immune system, play a major role in the immune surveillance of BC.43 The activity of NK cells in BC patients is significantly decreased, the expression of surface receptors is altered, and the expression of activated receptors is limited.44 Additionally, inhibitory receptor levels are significantly elevated. In vitro and in vivo studies have found that 131I treatment can enhance the cytotoxicity of NK cells to BC cells, can increase the level of BC cell death receptors, and can enhance NK cell treatment by enhancing the cytotoxicity of NK cells to tumor cells.44,45 Our results indicate a possible mechanism where MRPL13 regulates the functions of NK cells in BC. However, controlled trials and multicenter clinical trials are required to more accurately understand the relationship between MRPL13 and NK cells in vivo.
Immune checkpoint molecules are regulatory molecules, which inhibit the function of immune cells and suppress the anti-tumor immune response in immune system, and eventually lead to immune escape.46 The main immune checkpoint molecules related to tumors are: PD1/PD-L1, CTLA4, TIM3 and LAG3.47 Immune checkpoint inhibitors are a class of monoclonal antibodies developed for the related immune checkpoints. Its main function is to block the connection between tumor cells and immune cells that expressing immune checkpoints, thereby relieves the inhibitory effect and allows immune cells to kill cancer cells.48
CTLA4, also known as CD152, is expressed on activated CD4 + and CD8 + T cells and has a high degree of homology with the costimulatory molecule receptor (CD28) on the surface of T cells.49 Both CTLA-4 and CD28 are members of the immunoglobulin superfamily, which bind to the same ligands CD86 (B7-2) and CD80 (B7-1). When the two signals B7-CD28 and B7-CTLA4 are activated at the same time, T cells can be activated and expressed CTLA-4. CTLA4 forms a competitive relationship with CD28, and when combined with B7, it blocks the B7-CD28 signaling pathway.50 Cancer cells take advantage of the negative regulation of the human immune system to promote the expression of CTLA4 and compete with CD28 to achieve the goal of survival. CTLA4 antibody binds to CTLA4, CD28 can bind to B7 again, the B7-CD28 signal channel is restarted, and T cells are activated.51
From Figure 4, MRPL13, positively correlated with CTLA4, is differentially expressed with T cells CD4 memory activated, T cells follicular helper and other cells. This result suggests whether we can participate in the immune checkpoint by inhibiting the expression of MRPL13. Could regulation predict the response to immune checkpoint blockade? Could it be used as an effective immune checkpoint blockade combination therapy to increase efficacy and reduce side effects? A variety of methods were used to avoid immune elimination, so a better understanding of the immune suppression in tumor microenvironment is our future focus.
In conclusion, this is the first report to identify MRPL13 as a new biomarker of BC. This work helps to elucidate the roles of cytokinesis and immune cell infiltration, as well as the proteins that regulate these processes, in the development of BC. With a better understanding of its functional range, MRPL13 could serve as an effective tool for the diagnosis and treatment of BC and may help to make biomarker therapies a promising option for the treatment of breast diseases.
Data Sharing Statement
The dataset used and/or analyzed during the current study are available from the corresponding author Zuo Tao ([email protected]) on reasonable request.
Acknowledgments
We thank all participating subjects for their kind cooperation in this study.
Disclosure
The authors declare that they have no competing interests.
References
1. Fahad Ullah M. Breast Cancer: current Perspectives on the Disease Status. Adv Exp Med Biol. 2019;1152:51–64.
2. Heger Z, Rodrigo MA, Krizkova S, Zitka O, Beklova M. Kizek R and Adam V. Identification of estrogen receptor proteins in breast cancer cells using matrix-assisted laser desorption/ionization time of flight mass spectrometry (Review). Oncol Lett. 2014;7(5):1341–1344. doi:10.3892/ol.2014.1912
3. Hortobagyi GN, Chen D, Piccart M, et al. Correlative Analysis of Genetic Alterations and Everolimus Benefit in Hormone Receptor-Positive, Human Epidermal Growth Factor Receptor 2-Negative Advanced Breast Cancer: results From BOLERO-2. J Clin Oncol. 2016;34(5):419–426. doi:10.1200/JCO.2014.60.1971
4. Ragazzi M, Bisagni A, Gasparini E, et al. Bisagni G and Gardini G. Impact of 2013 ASCO/CAP guidelines on HER2 determination of invasive breast cancer: A single institution experience using frontline dual-color FISH. Breast. 2017;34:65–72. doi:10.1016/j.breast.2017.05.001
5. Wang W, Nag S, Zhang X, Wang MH, Wang H. Zhou J and Zhang R. Ribosomal proteins and human diseases: pathogenesis, molecular mechanisms, and therapeutic implications. Med Res Rev. 2015;35(2):225–285.
6. Rooijers K, Loayza-Puch F, Nijtmans LG, Agami R. Nijtmans LG and Agami R. Ribosome profiling reveals features of normal and disease-associated mitochondrial translation. Nat Commun. 2013;4(1):2886. doi:10.1038/ncomms3886
7. Guillermet J, Saint-Laurent N, Rochaix P, et al. Susini C and Bousquet C. Somatostatin receptor subtype 2 sensitizes human pancreatic cancer cells to death ligand-induced apoptosis. Proc Natl Acad Sci U S A. 2003;100(1):155–160. doi:10.1073/pnas.0136771100
8. Raimundo N, Song L, Shutt TE, et al. Santos-Sacchi J and Shadel GS. Mitochondrial stress engages E2F1 apoptotic signaling to cause deafness. Cell. 2012;148(4):716–726. doi:10.1016/j.cell.2011.12.027
9. Wang Y, Dong L, Cui H, et al. Ye X and Yao YY. Up-regulation of mitochondrial antioxidation signals in ovarian cancer cells with aggressive biologic behavior. J Zhejiang Univ Sci B. 2011;12(5):346–356. doi:10.1631/jzus.B1000192
10. Gabriel K, Pfanner N. The mitochondrial machinery for import of precursor proteins. Methods Mol Biol. 2007;390:99–117.
11. He J, Ford HC, Carroll J. Assembly of the membrane domain of ATP synthase in human mitochondria. Proc Natl Acad Sci U S A. 2018;115(12):2988–2993. doi:10.1073/pnas.1722086115
12. O’Brien TW, O’Brien BJ, Norman RA. O’Brien BJ and Norman RA. Nuclear MRP genes and mitochondrial disease. Gene. 2005;354:147–151. doi:10.1016/j.gene.2005.03.026
13. Gordon DM, Dancis A, Pain D. Dancis A and Pain D. Mechanisms of mitochondrial protein import. Essays Biochem. 2000;36:61–73. doi:10.1042/bse0360061
14. Ades IZ. Transport of newly synthesized proteins into mitochondria - a review. Mol Cell Biochem. 1982;43(2):113–127. doi:10.1007/BF00423100
15. Liu L, Luo C, Luo Y, et al. Wu G and Feng Y. MRPL33 and its splicing regulator hnRNPK are required for mitochondria function and implicated in tumor progression. Oncogene. 2018;37(1):86–94. doi:10.1038/onc.2017.314
16. Zhang L, Lu P, Yan L, et al. Sun G and Yang T. MRPL35 Is Up-Regulated in Colorectal Cancer and Regulates Colorectal Cancer Cell Growth and Apoptosis. Am J Pathol. 2019;189(5):1105–1120. doi:10.1016/j.ajpath.2019.02.003
17. Yoo YA, Kim MJ, Park JK, Chung YM, Lee JH, Chi SG. Kim JS and Yoo YD. Mitochondrial ribosomal protein L41 suppresses cell growth in association with p53 and p27Kip1. Mol Cell Biol. 2005;25(15):6603–6616. doi:10.1128/MCB.25.15.6603-6616.2005
18. Kim MJ, Yoo YA, Kim HJ, Kang S, Kim YG. Kim JS and Yoo YD. Mitochondrial ribosomal protein L41 mediates serum starvation-induced cell-cycle arrest through an increase of p21(WAF1/CIP1). Biochem Biophys Res Commun. 2005;338(2):1179–1184. doi:10.1016/j.bbrc.2005.10.064
19. Lee YK, Lim JJ, Jeoun UW, Min S, Lee EB, Kwon SM. Lee C and Yoon G. Lactate-mediated mitoribosomal defects impair mitochondrial oxidative phosphorylation and promote hepatoma cell invasiveness. J Biol Chem. 2017;292(49):20208–20217. doi:10.1074/jbc.M117.809012
20. Wang K, Li L, Fu L, Yuan Y, Dai H, Zhu T. Zhou Y and Yuan F. Integrated Bioinformatics Analysis the Function of RNA Binding Proteins (RBPs) and Their Prognostic Value in Breast Cancer. Front Pharmacol. 2019;10:140. doi:10.3389/fphar.2019.00140
21. Agrawal V, Kim DY, Kwon Y-G. Kim DY and Kwon YG. Hhip regulates tumor-stroma-mediated upregulation of tumor angiogenesis. Exp Mol Med. 2017;49(1):e289. doi:10.1038/emm.2016.139
22. Mangani D, Weller M, Seyed Sadr E, et al. Binder H and Schneider H. Limited role for transforming growth factor-beta pathway activation-mediated escape from VEGF inhibition in murine glioma models. Neuro Oncol. 2016;18(12):1610–1621. doi:10.1093/neuonc/now112
23. Rak J, Yu JL, Klement G, Kerbel RS. Klement G and Kerbel RS. Oncogenes and angiogenesis: signaling three-dimensional tumor growth. J Investig Dermatol Symp Proc. 2000;5(1):24–33. doi:10.1046/j.1087-0024.2000.00012.x
24. Yu S, Sun J, Zhang J, et al. Ma D and Ji C. Aberrant expression and association of VEGF and Dll4/Notch pathway molecules under hypoxia in patients with lung cancer. Histol Histopathol. 2013;28(2):277–284.
25. Tang L, Ma X, Tian Q, Cheng Y, Yao H, Liu Z. Qu X and Han X. Inhibition of angiogenesis and invasion by DMBT is mediated by downregulation of VEGF and MMP-9 through Akt pathway in MDA-MB-231 breast cancer cells. Food Chem Toxicol. 2013;56:204–213. doi:10.1016/j.fct.2013.02.032
26. Chen JS, Zhang YJ. Hu SE and Zhang HQ. [Effects of VEGF-A/VEGF-C antisense oligodeoxynucleotide on angiogenesis, lymphangiogenesis, and tumor growth of breast cancer]. Ai Zheng. 2007;26(9):972–976.
27. Alvarez RH, Guarneri V, Icli F, et al. Conte P and Hortobagyi GN. Bevacizumab treatment for advanced breast cancer. Oncologist. 2011;16(12):1684–1697. doi:10.1634/theoncologist.2011-0113
28. Itoh Y, Nagase H. Matrix metalloproteinases in cancer. Essays Biochem. 2002;38:21–36. doi:10.1042/bse0380021
29. Roeb E, Matern S. [Matrix metalloproteinases and colorectal cancer]. Med Klin (Munich). 2003;98(12):763–770. German. doi:10.1007/s00063-003-1322-5
30. Shin YJ, Kim JH. The role of EZH2 in the regulation of the activity of matrix metalloproteinases in prostate cancer cells. PLoS One. 2012;7(1):e30393. doi:10.1371/journal.pone.0030393
31. Merchant N, Nagaraju GP, Rajitha B, Lammata S, Jella KK, Buchwald ZS. Lakka SS and Ali AN. Matrix metalloproteinases: their functional role in lung cancer. Carcinogenesis. 2017;38(8):766–780. doi:10.1093/carcin/bgx063
32. Yuan Y, Jiang YC. Sun CK and Chen QM. Role of the tumor microenvironment in tumor progression and the clinical applications (Review). Oncol Rep. 2016;35(5):2499–2515.
33. Zhou Z, Lu ZR. Molecular imaging of the tumor microenvironment. Adv Drug Deliv Rev. 2017;113:24–48. doi:10.1016/j.addr.2016.07.012
34. Gonzalez H, Hagerling C, Werb Z. Hagerling C and Werb Z. Roles of the immune system in cancer: from tumor initiation to metastatic progression. Genes Dev. 2018;32(19–20):1267–1284. doi:10.1101/gad.314617.118
35. Mendez-Garcia LA, Nava-Castro KE, Ochoa-Mercado TL, et al. Metastasis: are Cytokines Important Players During Its Development and Progression? J Interferon Cytokine Res. 2019;39(1):39–55. doi:10.1089/jir.2018.0024
36. Paduch R. The role of lymphangiogenesis and angiogenesis in tumor metastasis. Cell Oncol. 2016;39(5):397–410. doi:10.1007/s13402-016-0281-9
37. Goel S, Duda DG, Xu L, Munn LL, Boucher Y. Fukumura D and Jain RK. Normalization of the vasculature for treatment of cancer and other diseases. Physiol Rev. 2011;91(3):1071–1121. doi:10.1152/physrev.00038.2010
38. Zhang B. Hu Y and Pang Z. Modulating the Tumor Microenvironment to Enhance Tumor Nanomedicine Delivery. Front Pharmacol. 2017;8:952.
39. Bielenberg DR, Zetter BR. The Contribution of Angiogenesis to the Process of Metastasis. Cancer J. 2015;21(4):267–273. doi:10.1097/PPO.0000000000000138
40. Padera TP, Meijer EFJ, Munn LL. Meijer EF and Munn LL. The Lymphatic System in Disease Processes and Cancer Progression. Annu Rev Biomed Eng. 2016;18(1):125–158. doi:10.1146/annurev-bioeng-112315-031200
41. Maimela NR, Liu S, Zhang Y. Liu S and Zhang Y. Fates of CD8+ T cells in Tumor Microenvironment. Comput Struct Biotechnol J. 2019;17:1–13. doi:10.1016/j.csbj.2018.11.004
42. Fukumura D, Kloepper J, Amoozgar Z. Duda DG and Jain RK. Enhancing cancer immunotherapy using antiangiogenics: opportunities and challenges. Nat Rev Clin Oncol. 2018;15(5):325–340.
43. Muller L, Aigner P, Type SD. I Interferons and Natural Killer Cell Regulation in Cancer. Front Immunol. 2017;8:304. doi:10.3389/fimmu.2017.00304
44. Schaaf MB, Garg AD, Agostinis P. Garg AD and Agostinis P. Defining the role of the tumor vasculature in antitumor immunity and immunotherapy. Cell Death Dis. 2018;9(2):115. doi:10.1038/s41419-017-0061-0
45. Kim HW, Kim JE, Hwang MH, Jeon YH, Lee SW, Lee J. Zeon SK and Ahn BC. Enhancement of natural killer cell cytotoxicity by sodium/iodide symporter gene-mediated radioiodine pretreatment in breast cancer cells. PLoS One. 2013;8(8):e70194. doi:10.1371/journal.pone.0070194
46. Zappasodi R. Merghoub T and Wolchok JD. Emerging Concepts for Immune Checkpoint Blockade-Based Combination Therapies. Cancer Cell. 2018;34(4):690.
47. Barrueto L, Caminero F, Cash L, Makris C, Lamichhane P, Deshmukh RR. Lamichhane P and Deshmukh RR. Resistance to Checkpoint Inhibition in Cancer Immunotherapy. Transl Oncol. 2020;13(3):100738. doi:10.1016/j.tranon.2019.12.010
48. Marhelava K, Pilch Z, Bajor M, Graczyk-Jarzynka A, Zagozdzon R. Targeting Negative and Positive Immune Checkpoints with Monoclonal Antibodies in Therapy of Cancer. Cancers. 2019;11(11):11. doi:10.3390/cancers11111756
49. Rowshanravan B, Halliday N, Sansom DMCTLA-4. a moving target in immunotherapy. Blood. 2018;131(1):58–67. doi:10.1182/blood-2017-06-741033
50. Srinivasan M, Lu D, Eri R, Brand DD, Haque A, Blum JS. Haque A and Blum JS. CD80 binding polyproline helical peptide inhibits T cell activation. J Biol Chem. 2005;280(11):10149–10155. doi:10.1074/jbc.M409521200
51. Grosso JF, Jure-Kunkel MNCTLA-4. blockade in tumor models: an overview of preclinical and translational research. Cancer Immun. 2013;13:5.
 © 2020 The Author(s). This work is published and licensed by Dove Medical Press Limited. The full terms of this license are available at https://www.dovepress.com/terms.php and incorporate the Creative Commons Attribution - Non Commercial (unported, v3.0) License.
By accessing the work you hereby accept the Terms. Non-commercial uses of the work are permitted without any further permission from Dove Medical Press Limited, provided the work is properly attributed. For permission for commercial use of this work, please see paragraphs 4.2 and 5 of our Terms.
© 2020 The Author(s). This work is published and licensed by Dove Medical Press Limited. The full terms of this license are available at https://www.dovepress.com/terms.php and incorporate the Creative Commons Attribution - Non Commercial (unported, v3.0) License.
By accessing the work you hereby accept the Terms. Non-commercial uses of the work are permitted without any further permission from Dove Medical Press Limited, provided the work is properly attributed. For permission for commercial use of this work, please see paragraphs 4.2 and 5 of our Terms.