")
Back to Journals » Diabetes, Metabolic Syndrome and Obesity » Volume 12
mRNAs expression profiles of high glucose-induced memory in human umbilical vein endothelial cells
Authors Jin G , Wang Q, Pei X, Li X, Hu X, Xu E, Li M
Received 24 February 2019
Accepted for publication 22 June 2019
Published 23 July 2019 Volume 2019:12 Pages 1249—1261
DOI https://doi.org/10.2147/DMSO.S206270
Checked for plagiarism Yes
Review by Single anonymous peer review
Peer reviewer comments 2
Editor who approved publication: Prof. Dr. Muthuswamy Balasubramanyam
Guoxi Jin,1,2 Qiong Wang,2 Xiaoyan Pei,2 Xiaoli Li,2 Xiaolei Hu,2 Erqin Xu,3 Minglong Li1
1Department of Endocrinology, Shandong Provincial Hospital Affiliated to Shandong University, Jinan, Shandong 250021, People’s Republic of China; 2Department of Endocrinology, The First Affiliated Hospital of Bengbu Medical College, Bengbu, Anhui 233004, People’s Republic of China; 3Room of Physical Diagnostics, Clinical College of Medicine, Bengbu Medical College, Bengbu, Anhui 233030, People’s Republic of China
Purpose: A long-term “memory” of hyperglycemic stress, even when glycemia is normalized, has been previously reported in endothelial cells. However, the molecular mechanism of “metabolic memory” (MM) remains unknown. In this report, we sought to screen at the whole transcriptome level the genes that participate in MM.
Methods: In the present research, RNA sequencing was used to determine the protein-coding mRNA expression profiles of human umbilical vein endothelial cells (HUVECs) under normal-glucose concentration (LG), high-glucose concentration (HG), and MM. A series of bioinformatic analyses was performed. HG-induced MM-involved up-regulated genes (up-HGMMGs) and HG-induced MM-involved down-regulated genes (down-HGMMGs) were identified. Afterward, based on up-HGMMGs and down-HGMMGs, the biological functions and signaling pathways were analyzed using Gene Ontology (GO) and the Kyoto Encyclopedia of Genes and Genomes (KEGG). In addition, several of the identified genes were validated by RT-qPCR.
Results: A total of 726 HGMMGs were identified, including 210 down- and 516 up-HGMMGs, which were enriched in the cell cycle (hsa04110), oocyte meiosis (hsa04114), p53 signaling pathway (hsa04115), and oxidative phosphorylation (hsa00190), among others. The protein–protein-interaction (PPI) network consisted of 462 nodes and 2656 connections, and four main modules were identified by MCODE. The cell cycle (hsa04110), oocyte meiosis (hsa04114), p53 signaling pathway (hsa04115), and oxidative phosphorylation (hsa00190), among others, could be potential therapeutic targets of HG-induced MM in endothelial cells. The real-time PCR results validated the RNA-seq data.
Conclusion: This study identified crucial mRNAs related to MM-persistent injury in endothelial cells even after switching the cells from high- glucose to normal glucose levels. Further research focusing on these mRNA may unravel new ways to modify MM in diabetes.
Keywords: diabetes, high glucose, metabolic memory, messenger RNA, RNA-sequencing
Introduction
Type 2 diabetes mellitus (T2DM) is a chronic metabolic disease with a high blood glucose level leading to several complications associated with vascular disease, including vascular endothelial cell dysfunction, cardiomyopathy, and nephropathy.1–3 Extensive research has shown that various factors play an important role in endothelial dysfunction in T2DM, including aging, obesity, hypertension, hyperlipidemia, hyperglycemia, low-grade inflammation, and insulin resistance.4–6 The most recent investigations have been focused on effective approaches to prevent hyperglycemia-induced endothelial cell injury.7–9 However, lowering glucose levels is not enough to turn off the oxidative damage in vascular endothelial cells induced by high glucose.10 This phenomenon can be partly explained by the “metabolic memory” (MM) theory, defined as the perpetuation of vascular damage despite the achievement of improved glycemic control.11 Some studies show that reactive oxygen species (ROS)-mediated vascular stress can maintain glucose normalization in DM animals and in cultured endothelial cells. Long-term maintenance of oxidative stress leads to the overactivation of pathways closely associated with DM and diabetic complications.10 However, previous investigations have failed to reveal a comprehensive profile of mRNA expression in MM induced by hyperglycemia in HUVECs, and we ignore the proteins that are the most relevant and could become targets of intervention.
To comprehensively elucidate the MM molecular mechanisms, we applied an RNA-seq strategy. First, we performed RNA-seq in HUVEC cells under control, HG and MM conditions. After a series of bioinformatics analyses, up-HGMMGs and down-HGMMGs were identified. Then clusterprofiler, GO, and pathway annotation analyses of up-HGMMGs and down-HGMMGs were performed. Next, a PPI network was structured based on the STRING database, visualization was carried out by Cytoscape, and modules were identified by MCODE. Finally, some key HGMMGs were verified by qPCR.
Materials and methods
“Memory” experiments in cells
HUVECs derived from healthy donors were purchased from the China Center for Type Culture Collection (CCTCC, Wuhan, China). Methods of cell culture and RNA preparation have been described in previous studies.12–14 In general, the high glucose-induced HUVECs were cultured with 25 mM glucose for six days, the control HUVECs were cultured with 5 mM glucose and 20 mM mannitol for the same period, and the memory HUVECs were cultured with 25 mM glucose for three days, followed by 5 mM glucose and 20 mM mannitol for the next three days. After six days, HUVECs were collected, and each group was analyzed in triplicate.
Total RNA preparation and qualification
Total RNA was isolated and purified using TRIzol reagent (Invitrogen, Carlsbad, CA, USA) following the manufacturer’s instructions. The quantity and quality of the RNA samples in each group were determined by NanoDrop 2000 (Thermo, Wilmington, DE) and Agilent 2100 bioanalyzer (Agilent Technologies, USA).
Library construction and RNA-sequencing
TruSeq® Stranded Total RNA Sample Preparation kit was used to produce libraries following the manufacturer’s instructions. The purified libraries were quantified by Qubit® 2.0 Fluorometer (Life Technologies, USA) and Agilent 2100 bioanalyzer (Agilent Technologies, USA). The cluster was generated by cBot, the library being sequenced using the Illumina HiSeq 2500 (Illumina, USA). The sequencing was performed at Origin-Biotech Inc (Ao-Ji Biotech, Shanghai, China).
Bioinformatics analysis
FastQC was conducted for Quality control (QC) of RNA-Seq reads (v. 0.11.3) (http://www.bioinformatics.babraham.ac.uk/projects/fastqc). Trimming was performed by seqtk for known Illumina TruSeq adapter sequences, poor reads, and ribosome RNA reads (https://github.com/lh3/seqtk). The trimmed reads were then mapped to the human reference genome (hg38) by the Hisat2 (version:2.0.4).15,16 Stringtie (version:1.3.0) was performed for each gene counts from trimmed reads.16,17 Gene counts were normalized by TMM,18 and FPKM was performed by Perl script.19 edgeR was performed for determining differentially expressed genes,20,21 and threshold with p-value<0.05 and |fold change| >1.2.22–24 Venny was applied to screen of up-HGMMGs (HG vs LG and MM vs LG comparisons were performed for up-regulated expression, and an HG vs MM comparison was performed for non-significant differential expression) and down-HGMMGs (HG vs LG and MM vs LG comparisons were performed for down-regulated expression, and an HG vs MM comparison was performed for non-significant differential expression). Gene Ontology (GO) and Kyoto Encyclopedia of Genes and Genomes (KEGG) pathways were enriched by clusterProfiler for a better understanding of the functions of the HGMMGs.25,26
Protein-protein interaction (PPI) network construction and module analysis
STRING is a database that provides comprehensive information about interactions between proteins, including prediction and experimental interactions data.27 In our study, the STRING tool was used to perform the PPIs among the DEGs, and interactions of a combined score of ≥0.4. Then, Cytoscape was performed to visualize the network.28 PPI network was used to filter modules based on the Molecular Complex Detection plug-in (MCOD) in Cytoscape29 with a standard set following degree cut-off=2, k-core=2, node score cut-off=0.2, and max depth=100. MCODE score ≥4 and node ≥10 were considered for functional enrichment analysis of the modules.
Validation of differentially expressed mRNAs by qRT-PCR
Total RNA was extracted and reversely transcribed into cDNA using SuperScriptTM III Reverse Transcriptase (Invitrogen). Six of the differentially expressed mRNAs related with high glucose-induced HUVECs were randomly selected to be quantified by FastStart Universal SYBR Green Master (Rox) with specific primers. PCRs were performed in triplicate according to the following temperature profile: denaturation at 95 °C for 10 min followed by an amplification composed of 40 cycles of 95 °C for 10 s and 60 °C for 1 min. The primers used for these amplifications are listed in Table 1. Glyceraldehyde phosphate dehydrogenase (GAPDH) expression was used as an internal reference. The data were analyzed using the 2−ΔΔCt method and the expression levels of each mRNAs were represented as fold change.
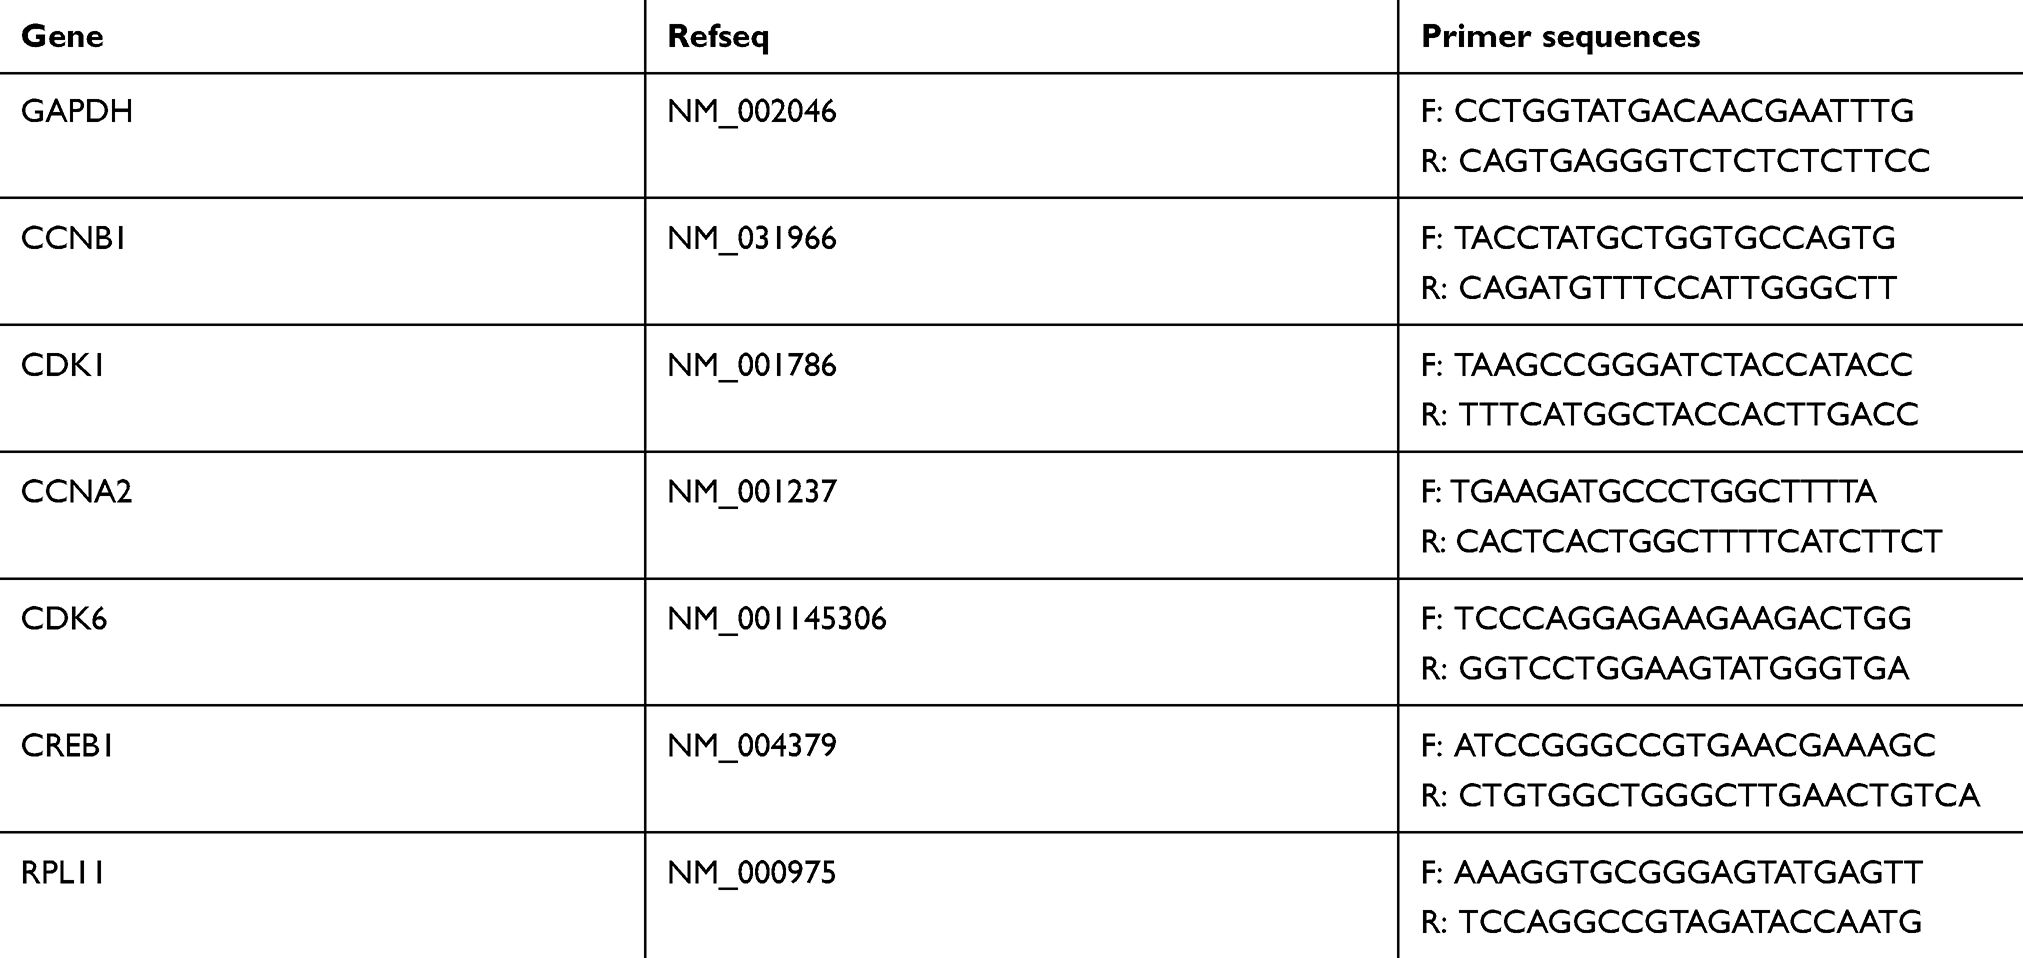 |
Table 1 Primer sequences |
Statistical analysis
Although there were three sets of samples, pairs were used for the comparisons. Thus, the data were analyzed by Student’s t-test. Results are expressed as the mean ± SEM. Significance levels were set at the 0.05 threshold. Data analysis was carried out using Statistical Program for Social Sciences (SPSS) 22.0 software (SPSS, Chicago, IL, USA).
Results
Identification of HGMMGs
To fully understand the multifaceted mechanism of HG-induced MM in HUVECs, we performed RNA-seq for the transcriptomes of LG, HG, and MM samples. By bioinformatics analysis, after filtration there were 516 up-HGMMGs and 210 down-HGMMGs. From the data in Figure 1A, it can be seen that the 516 up-HGMMGs were screened from the intersection of 3568 up-regulated mRNAs (HG vs LG, fold-change >1.2, p-value<0.05), 1201 up-regulated mRNAs (MM vs LG, fold-change >1.2, p-value<0.05), and 10,742 non-significantly differentially expressed mRNAs (MM vs HG, p-value>0.05). Meanwhile, from the data in Figure 1B, it can be seen that 210 down-HGMMGs were identified from the intersection of 2238 down-regulated mRNAs (HG vs LG, fold-change <0.833, p-value<0.05) and 708 down-regulated mRNAs (MM vs LG, fold-change <0.833, p-value<0.05), and 10,742 non-significantly differentially expressed mRNAs (MM vs HG, p-value>0.05). Hierarchical clustering of the HGMMGs can be seen in Figure 2.
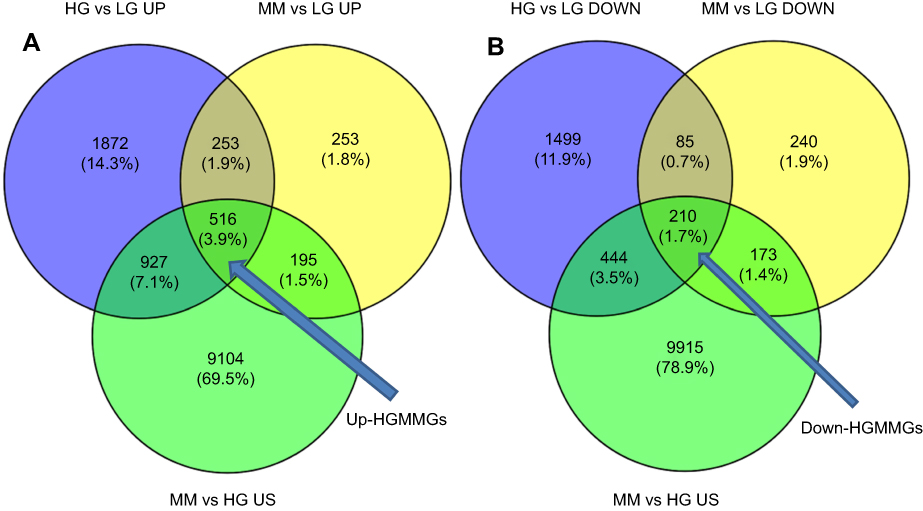 |
Figure 1 Transcriptome comparisons of the HG, LG, and MM groups. (A) up-HGMMGs (HG vs LG and MM vs LG comparisons were performed for up-regulated expression, and an HG vs MM comparison was performed for non-significant differential expression) (B) down-HGMMGs (HG vs LG and MM vs LG comparisons were performed for down-regulated expression, and an HG vs MM comparison was performed for non-significant differential expression). Abbreviations: HG, high glucose; LG, normal glucose; MM, metabolic memory; HGMMGs, HG-induced metabolic memory-involved regulated genes. |
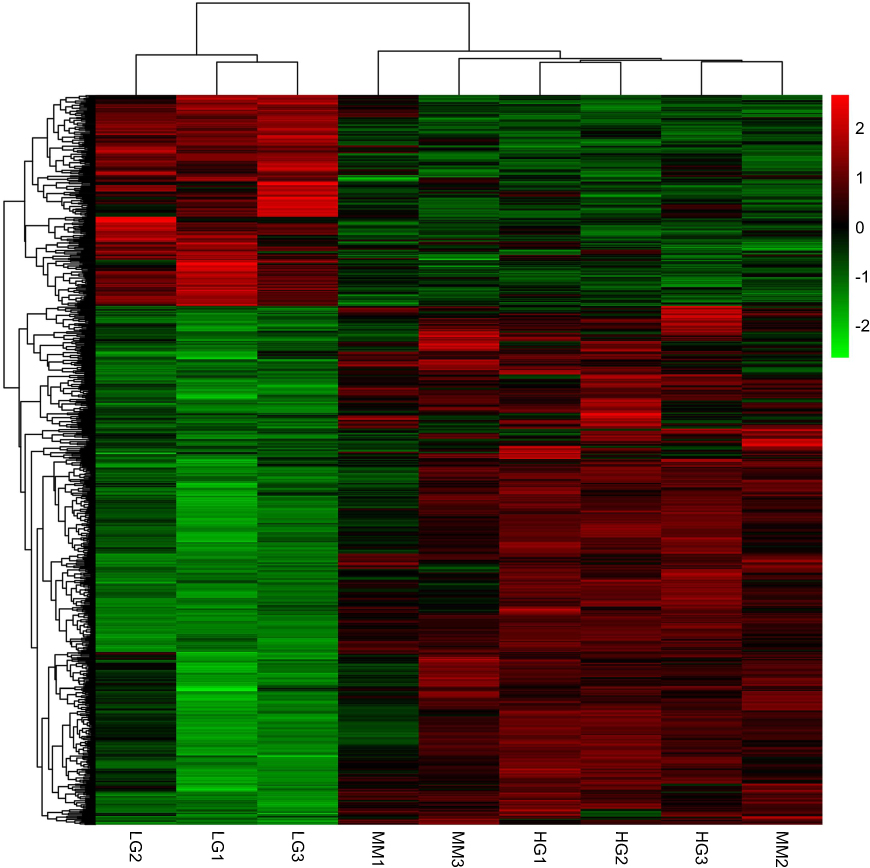 |
Figure 2 Heatmap of down-HGMMGs and up-HGMMGS with a total of 726 RNAs. LG1-LG3 refers to the control HUVECs; HG1-HG3 refers to the HG-induced HUVECs; MM1-MM3 refers to the HG-induced MM HUVECs. Abbreviations: HG, high glucose; LG, normal glucose; MM, metabolic memory. |
GO analysis of HGMMGs
To further understand the genes associated with HG-induced Metabolic Memory in HUVECs, GO enrichment analysis was performed by clusterProfiler on the 516 up-HGMMGs and 210 down-HGMMGS.
Enrichment analysis showed that a total of 421 GO-terms were significantly enriched in the 516 up-HGMMGs, 326 of which were biological processes (BP), 56 of which were cellular components (CC), and 39 of which were molecular functions (MF) with p<0.05. Mitosis, mitotic cell cycle, mitotic cell cycle process, cell division, cell cycle, chromosome segregation, cell cycle process, DNA packaging, chromosome organization, and organelle organization were the top10 enriched BP terms. The top10 enriched CC terms were chromosome, spindle, nucleosome, condensed chromosome, centromeric region, condensed chromosome kinetochore, chromosome, centromeric region, nuclear chromosome, protein-DNA complex, kinetochore, and condensed chromosome. The enriched MF terms were microtubule binding, tubulin binding, cytoskeletal protein binding, GTPase regulator activity, microtubule motor activity, protein heterodimerization activity, macromolecular complex binding, protein complex binding, GTPase activator activity, and kinase binding. These results show that cell proliferation is unbalanced, especially in chromosomal replication, segregation, and organization. The top30 GO-terms with highest enrich factor are shown in Figure 3A.
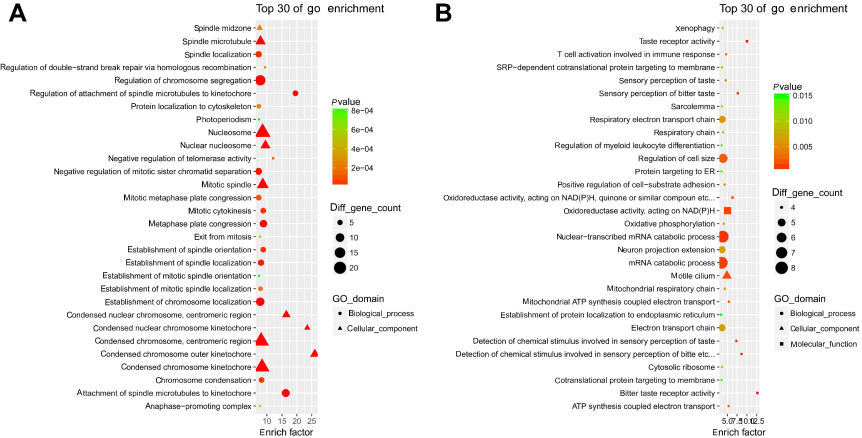 |
Figure 3 Gene Ontology enrichment analysis for MM-maintained up-HGMMGs. Results of gene ontology enrichment analysis for MM-maintained up-HGMMGs (A) and down-HGMMGs (B) in HG-induced HUVECs. |
The 210 down-HGMMGs were significantly enriched in 83 GO-terms, of which 59, 12, and 12 were BP, CC, and MF (with p<0.05). The top10 enriched GO biological processes were detection of chemical stimulus involved in sensory perception of bitter taste, sensory perception of bitter taste, detection of chemical stimulus involved in sensory perception of taste, nuclear-transcribed mRNA catabolic process, mRNA catabolic process, regulation of cell size, mitochondrial ATP synthesis coupled electron transport, ATP synthesis coupled electron transport, RNA catabolic process, and T cell activation involved in immune response. Meanwhile, motile cilium, cell projection, axon, cell leading edge, mitochondrial respiratory chain, respiratory chain, cilium, cytosolic ribosome, sarcolemma, cell-cell junction, neuron projection, and cell junction were the enriched CC. The enriched MF were bitter taste receptor activity, taste receptor activity, oxidoreductase activity, acting on NAD(P)H, quinone or similar compound as acceptor, oxidoreductase activity, acting on NAD(P)H, calcium ion binding, growth factor receptor binding, structural constituent of ribosome, ubiquitin protein ligase activity, inorganic cation transmembrane transporter activity, protein binding, bridging, RNA polymerase II core promoter proximal region sequence-specific DNA binding, and transmembrane transporter activity. The top30 GO-terms with highest enrich factor are shown in Figure 3B.
KEGG analysis of HGMMGs
Pathway enrichment analysis could provide further insights into the function of genes and their interaction.
We performed the KEGG pathway enrichment analysis for up-HGMMGs, and found 221 pathway terms including 18 pathway terms with a p-value<0.05. The Top10 pathways with the greatest enrichment were Systemic lupus erythematosus (hsa05322), oocyte meiosis (hsa04114), cell cycle (hsa04110), alcoholism (hsa05034), progesterone-mediated oocyte maturation (hsa04914), p53 signaling pathway (hsa04115), viral carcinogenesis (hsa05203), glycosaminoglycan biosynthesis - chondroitin sulfate/dermatan sulfate (hsa00532), sulfur metabolism (hsa00920), and HTLV-I infection (hsa05166). The top30 enriched pathways are presented in Figure 4A.
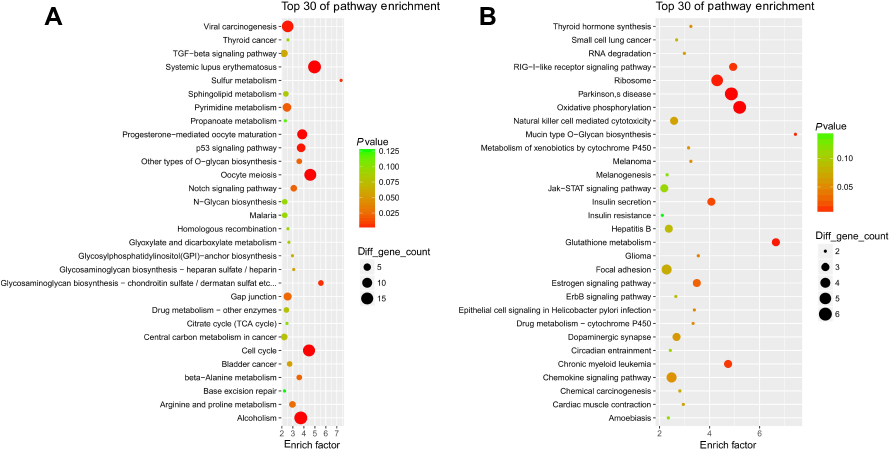 |
Figure 4 KEGG enrichment analysis for MM-maintained up-HGMMGs. Results of KEGG enrichment analysis for MM-maintained up-HGMMGs (A) and down-HGMMGs (B) in HG-induced HUVECs. |
KEGG enrichment analysis showed that a total of 143 pathway-terms were enriched with 210 down-HGMMGs, 12 of which were significant (p<0.05), including: oxidative phosphorylation (hsa00190), parkinson’s disease (hsa05012), glutathione metabolism (hsa00480), ribosome (hsa03010), mucin type O-Glycan biosynthesis (hsa00512), RIG-I-like receptor signaling pathway (hsa04622), chronic myeloid leukemia (hsa05220), insulin secretion (hsa04911), estrogen signaling pathway (hsa04915), glioma (hsa05214), epithelial cell signaling in Helicobacter pylori infection (hsa05120), and drug metabolism - cytochrome P450 (hsa00982). The top30 pathway-terms are shown in Figure 4B.
PPI network
The significant HGMMGs were used to construct PPI network. The PPI network consists of 462 nodes and 2,656 interactions, as shown in Figure 5. Dozens of gene nodes were high in connectivity degrees, including: CDK1 (cyclin-dependent kinase 1, degree=94, up-HGMMGs), CCNB1 (cyclin A2, degree=86, up-HGMMGs), CCNA2 (cyclin A2, degree=76, up-HGMMGs), AURKA (Aurora Kinase A, degree=76, up-HGMMGs), BUB1 (BUB1 mitotic checkpoint serine/threonine kinase, degree=74, up-HGMMGs), CDK6 (Cyclin-Dependent Kinase 6, degree=25, down-HGMMGs), RPL11 (Ribosomal Protein L11, degree=19, down-HGMMGs), and CREB1 (CAMP Responsive Element Binding Protein 1, degree=19, down-HGMMGs), among others. Details on the Top10 with the highest degree of down-HGMMGs and up-HGMMGs are included in Table 2.
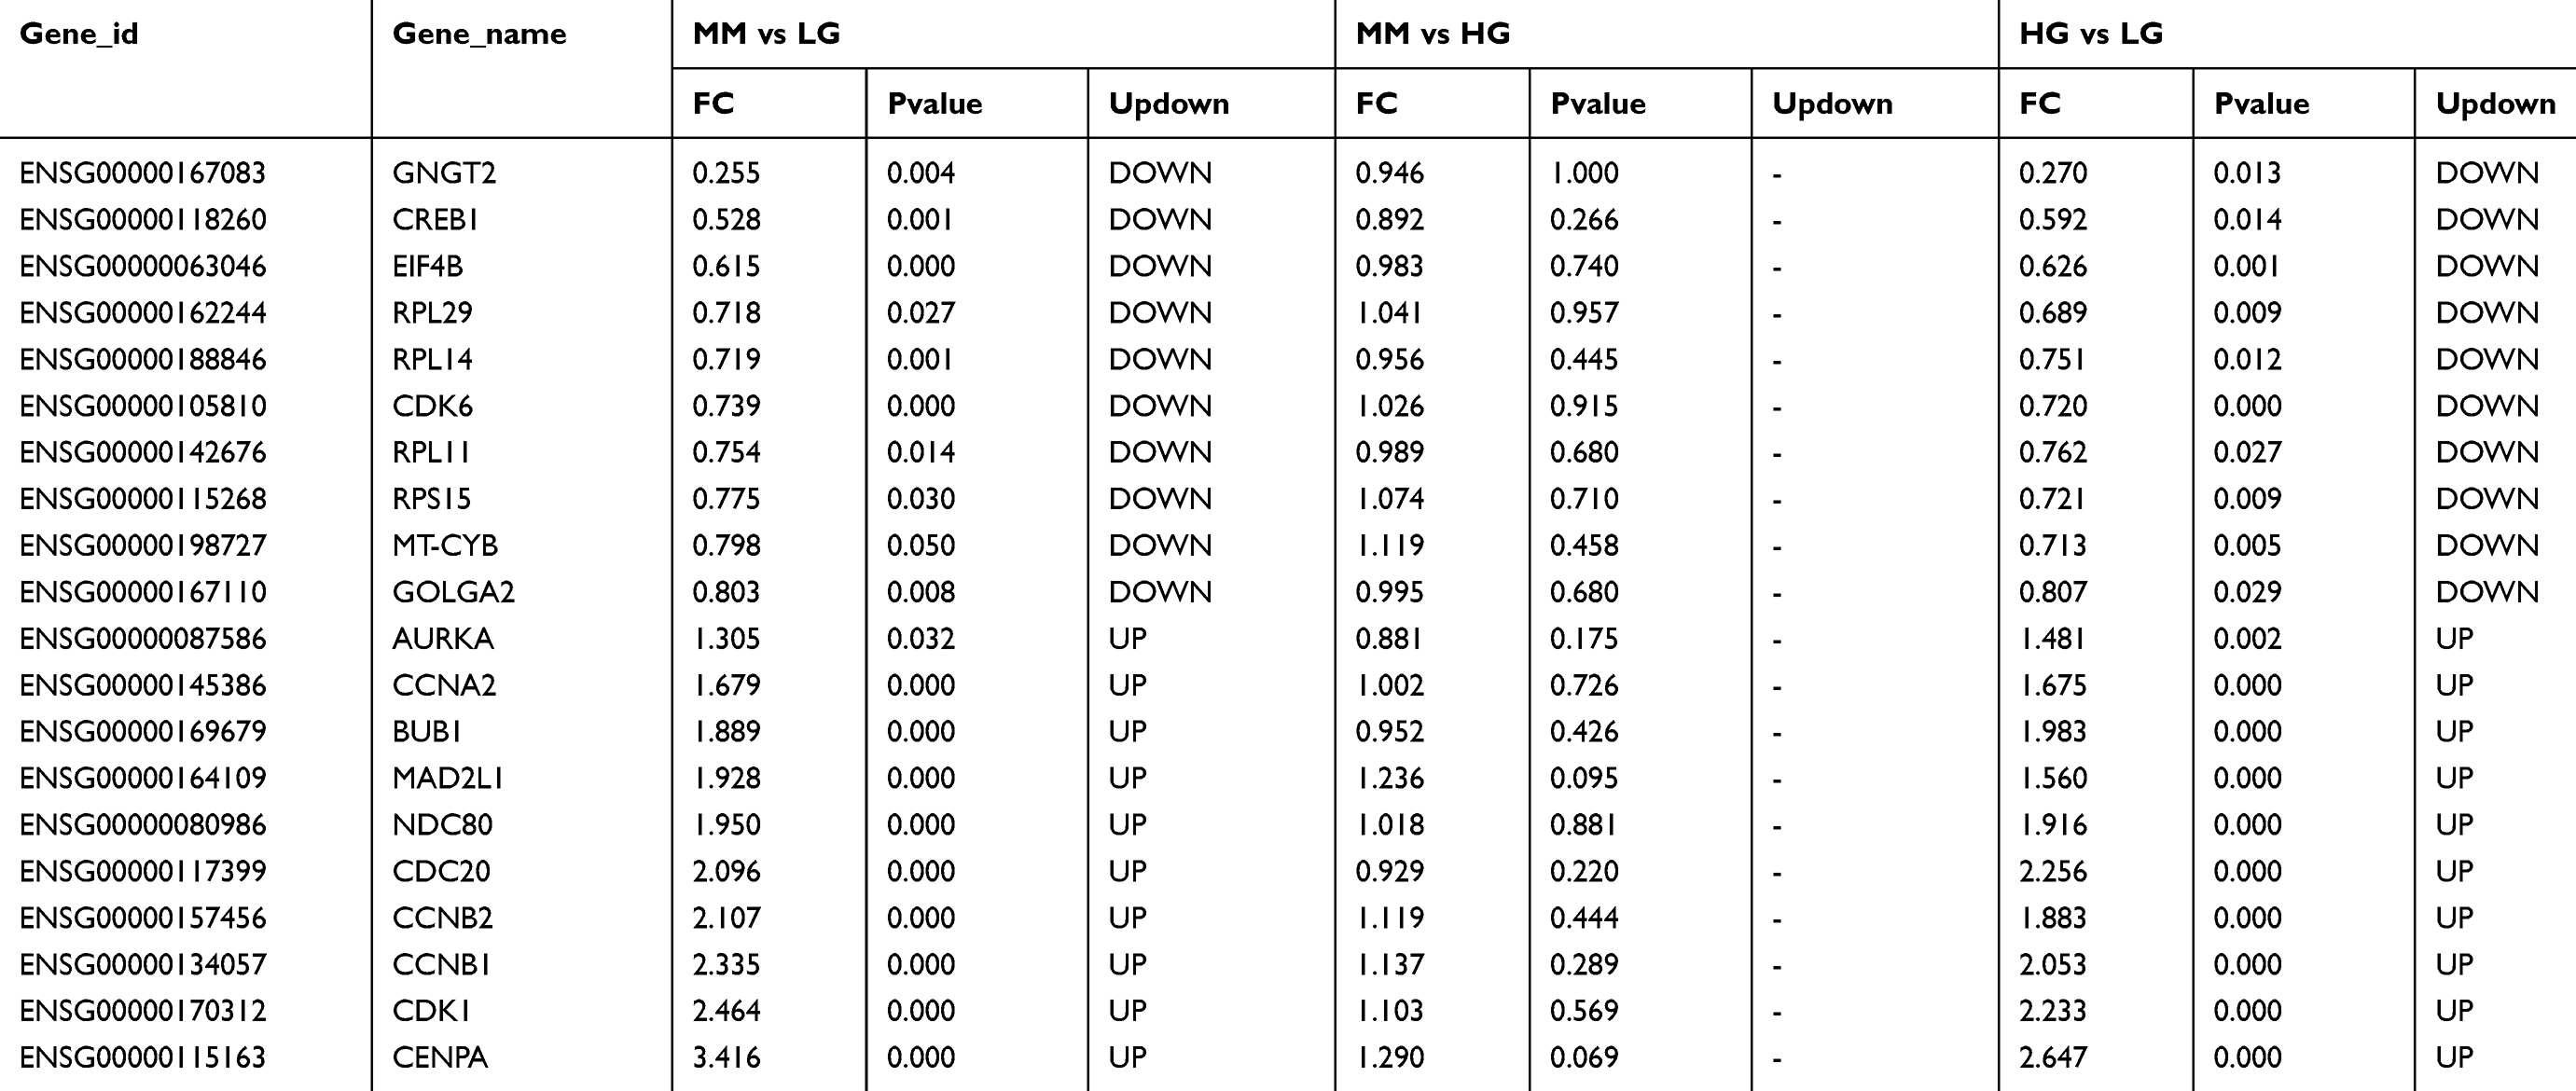 |
Table 2 Top10 of down-HGMMGs and up-HGMMGs details |
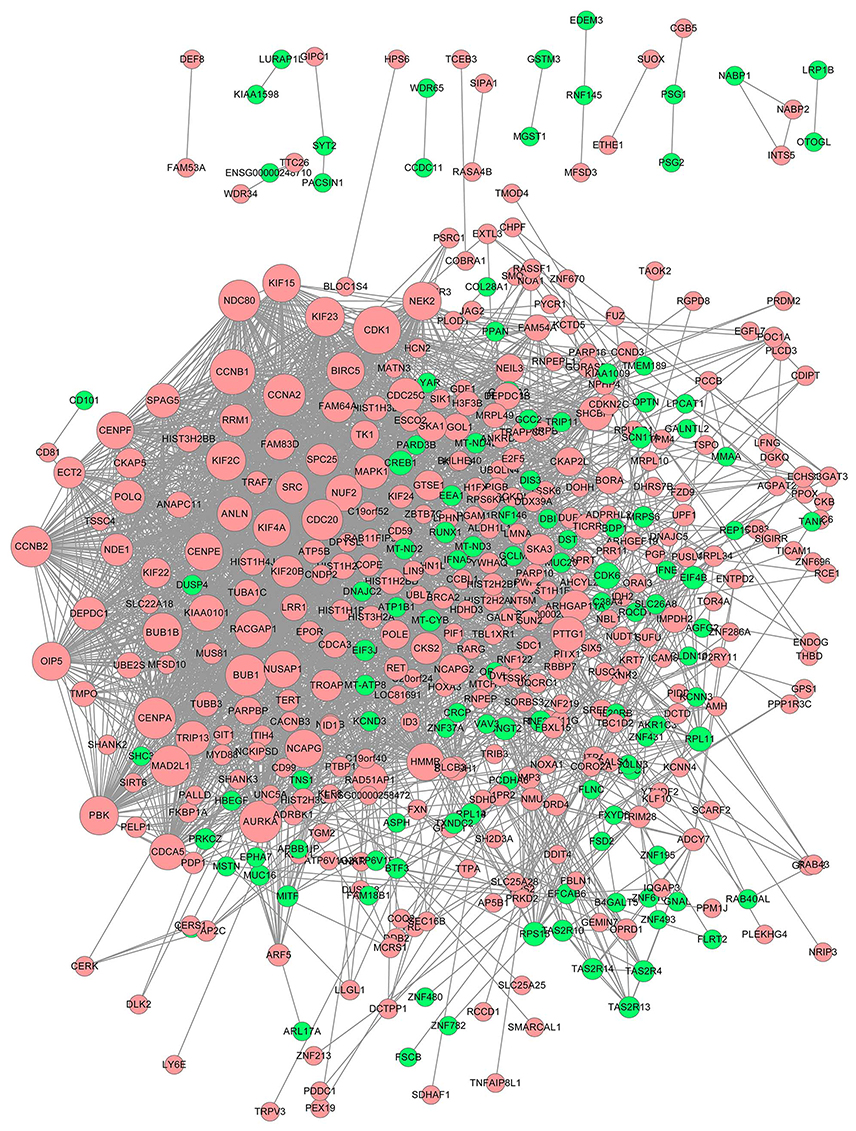 |
Figure 5 PPI network of the MM-maintained HGMMGs. The size of the nodes is positively correlated to the nodes’ degree; pink nodes denote the up-regulated genes, while green nodes denote the down-regulated genes. Abbreviations: PPI, protein–protein interaction; HGMMGs, HG-induced metabolic memory-involved genes. |
A total of 17 modules were obtained using default criteria by MCODE. Modules were listed in descending order by MCODE score (Table 3). Four modules with MCODE score ≥3 were named as module 1, module 2, module 3, and module 4. These four modules were selected for module network visualization (Figure 6A–D). Most of HGMMGs belonging to the four modules were up-regulated in the HG and MM groups.
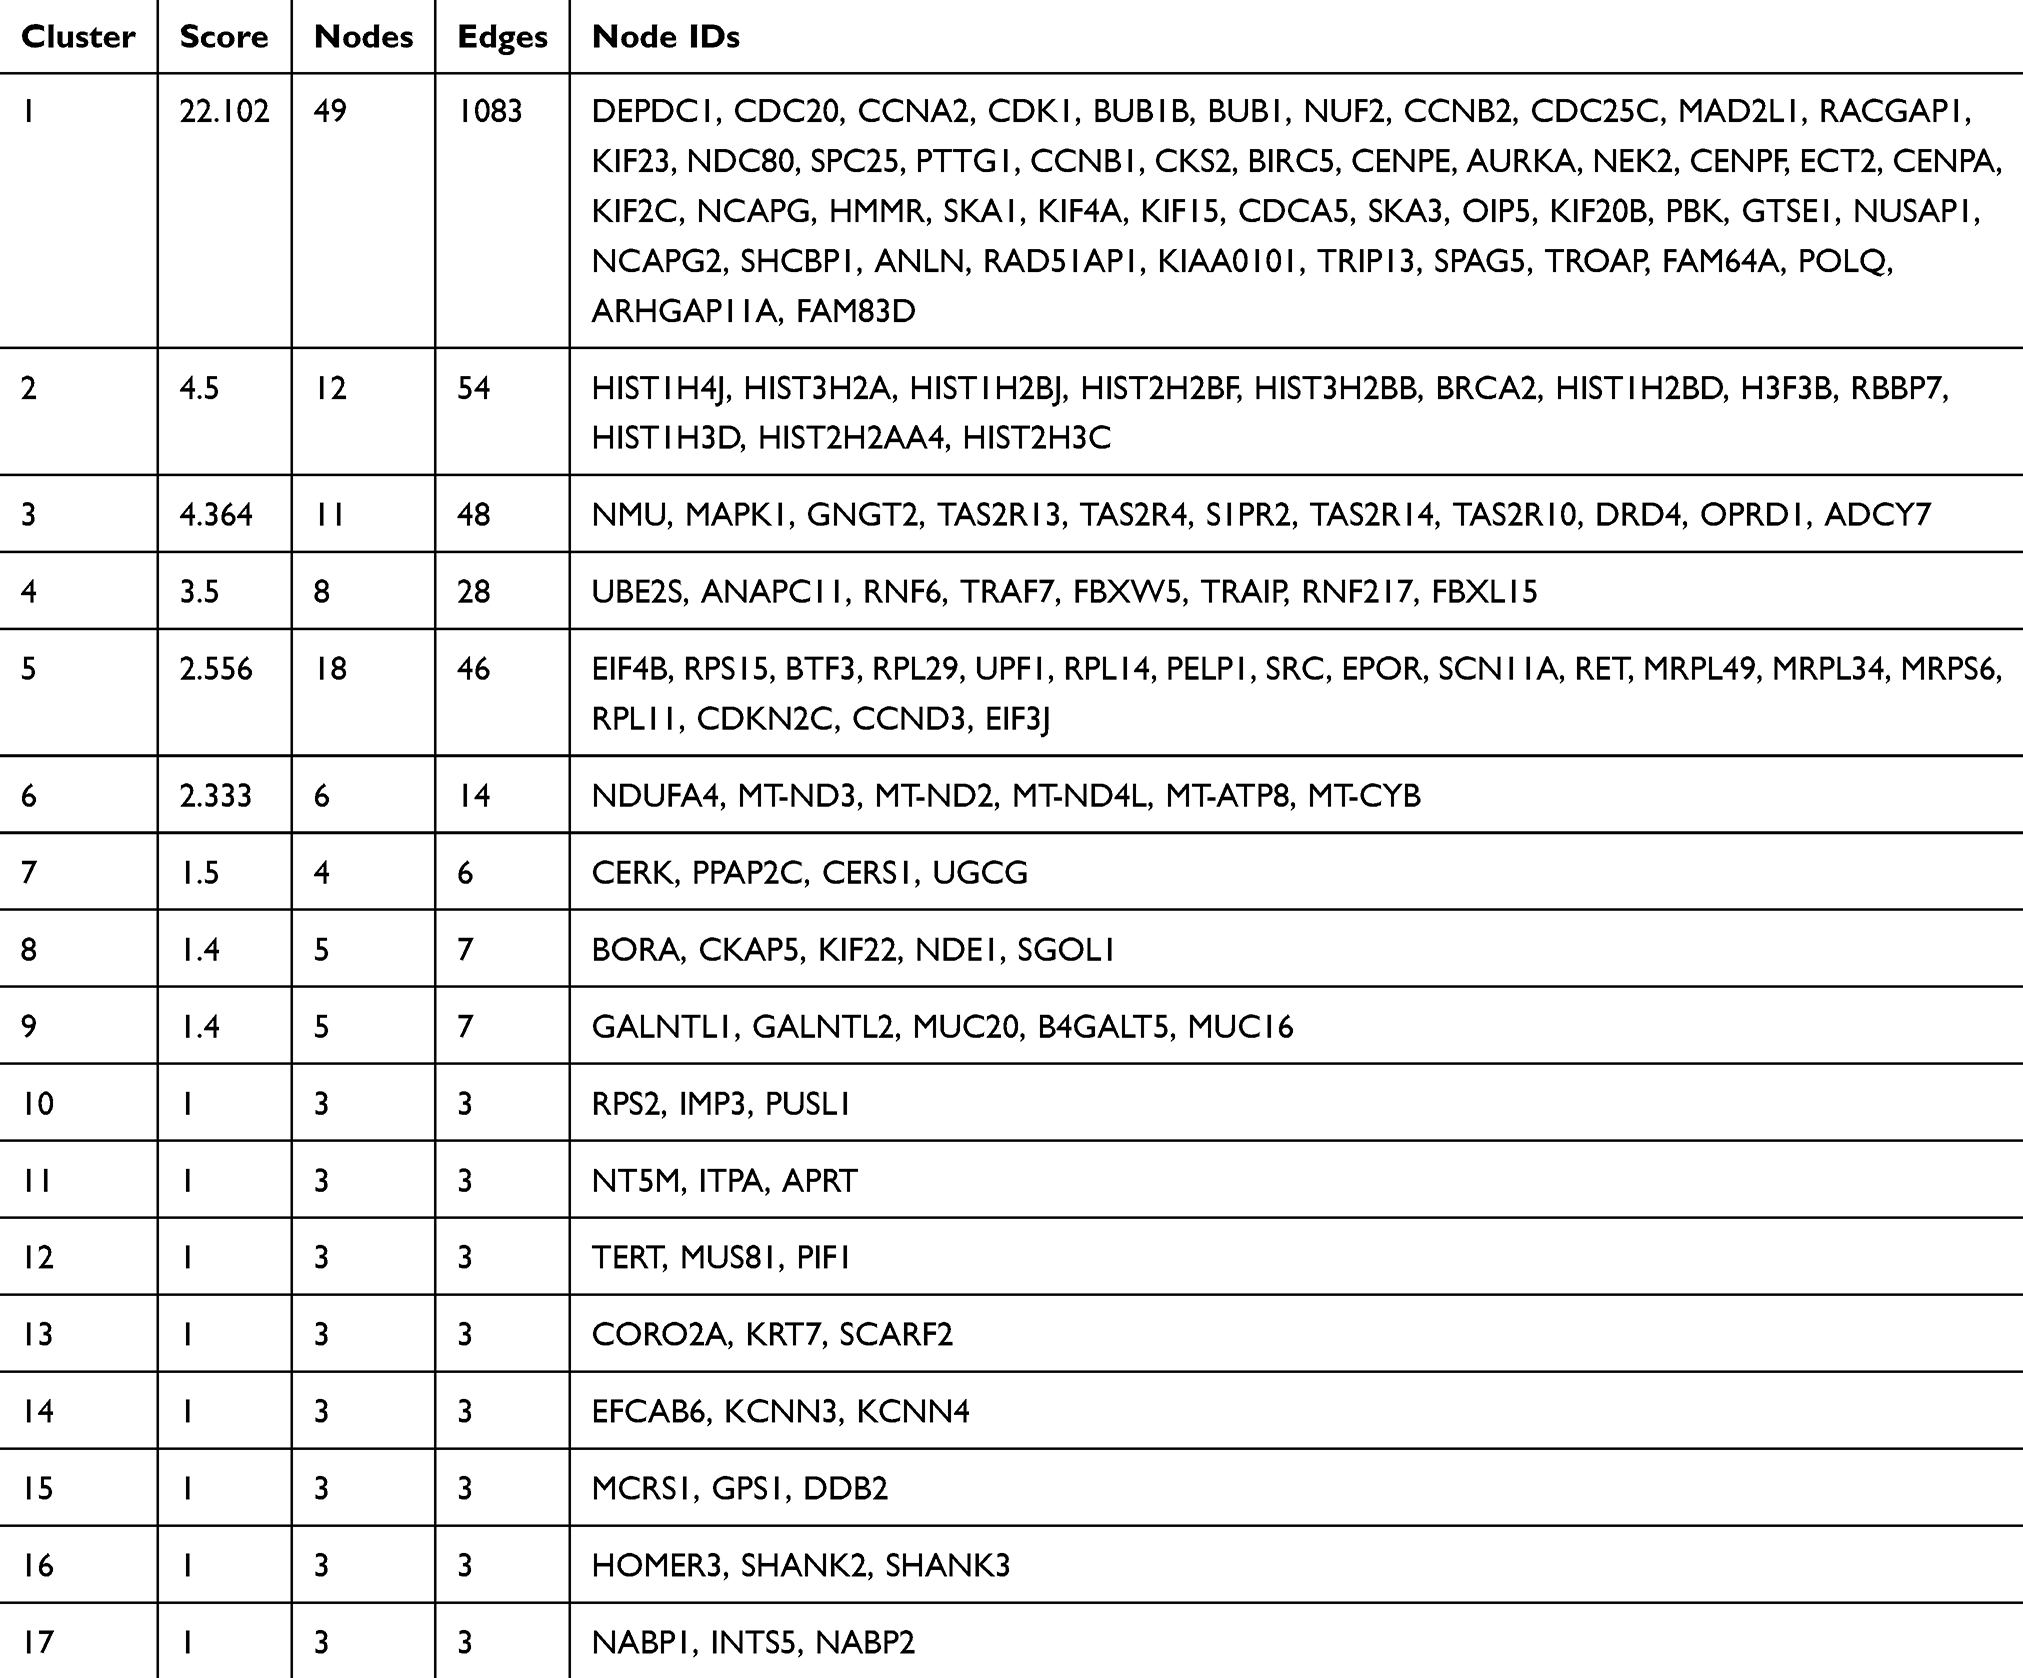 |
Table 3 List of modules exhibiting the HGMMG-related PPI |
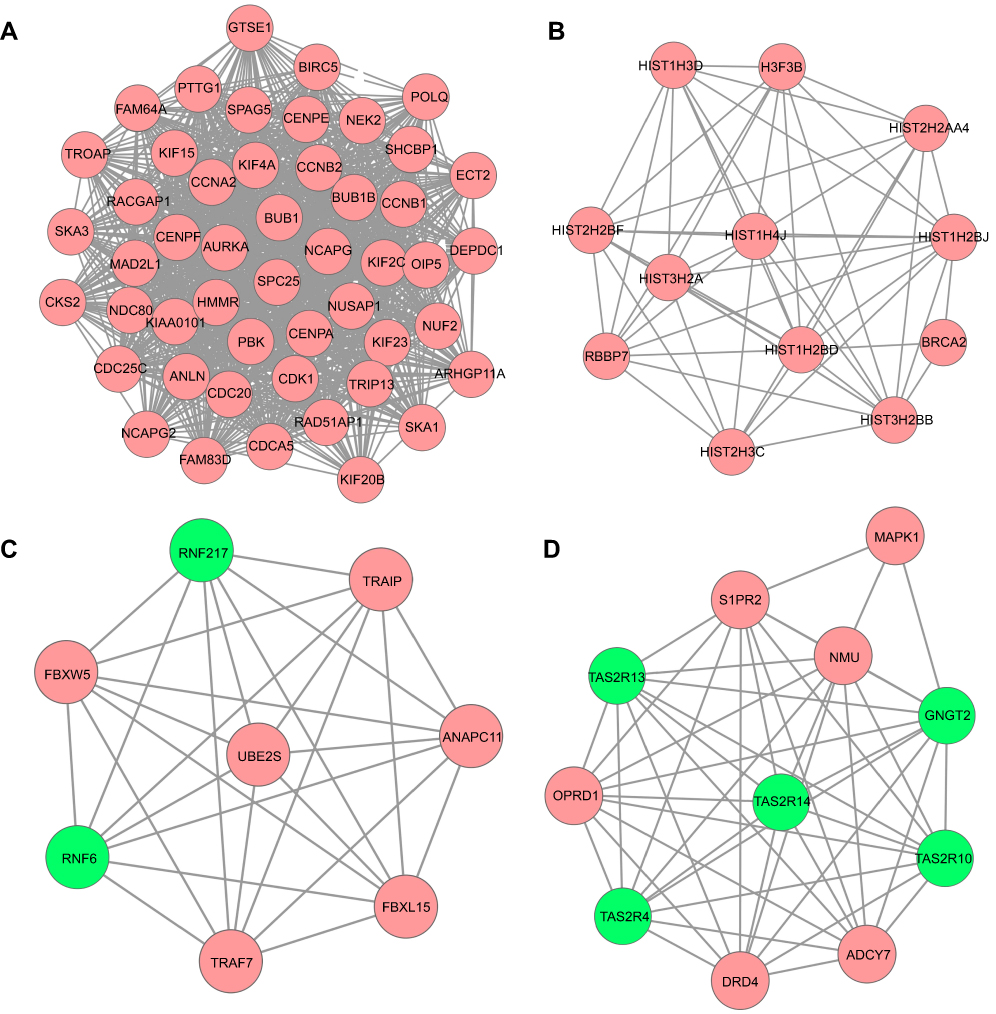 |
Figure 6 PPI network of the MM-maintained HGMMGs involved in Module 1 (A), 2 (B), 3 (C) and 4 (D). Pink nodes denote the up-regulated genes, while green nodes denote the down-regulated genes; PPI, protein–protein interaction; HGMMGs, HG-induced metabolic memory-involved genes. |
The results of qRT-PCR verification of the HGMMGs
As shown in Figure 7, real-time PCR results revealed that CDK1, CCNB1, and CCNA2 were over-expressed in the HG group compared to the LG group. Meanwhile, CDK6, RPL11, and CREB1 showed lower-expression in the HG group compared to the LG group (Figure 7, black bars). In the MM group, these genes were expressed at different levels (Figure 7, gray bars). In addition, except for CCNB1, these genes were not significantly differentially expressed in the MM group compared with the HG group (Figure 7, white bars). Overall, these results were consistent with the RNA-seq data.
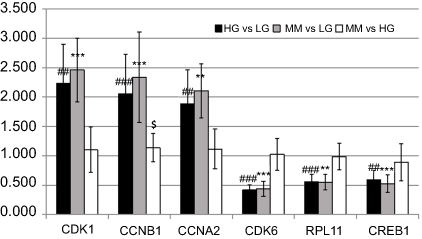 |
Figure 7 Verification of the HGMMGs by qRT-PCR. The expression of six genes in HUVECs was detected by qRT-PCR and the data are shown as fold changes. GAPDH was used as control. Black bars denote the comparison of HG vs LG, and the # symbol denotes the p-value; Gray bars denote the comparison of MM vs LG, and the * symbol denotes the p-value; White bars denote the comparison of MM vs HG, and the $ symbol denotes the p-value; one, two, and three symbols mean 0.01<p<0.05, 0.001<p<0.01, and p<0.001, respectively. Abbreviations: HG, high glucose; LG, normal glucose; MM, metabolic memory. |
Discussion
Diabetes mellitus is a serious chronic disease characterized by hyperglycemia, which is often accompanied by a series of special complications leading to a short life expectancy,30 notably vascular disease, including vascular endothelial cell dysfunction, cardiomyopathy, and nephropathy.1,2,3 A growing body of experimental evidence supports the concept that the risk for diabetes complications may be linked to oxidative stress, non-enzymatic glycation of proteins, epigenetic changes, and chronic inflammation, laying the foundation for the MM theory.30 Nigris et al. reported that dipeptidyl peptidase-4 (DPP-4) induced oxidative stress in the HUVECs and MM in retinal endothelial cells,31,32,33 which could be reduced by the inhibitor teneligliptin32,33 We analyzed the protein-coding mRNA expression profile by high throughput RNA-seq in HUVECs from the LG, HG, and MM groups. HGMMGs were identified, including 516 up-HGMMGs and 210 down-HGMMGs. Bioinformatics analysis provided us with a better understanding of the mechanism of HG-induced MM in HUVECs. In our study, we identified hundreds of genes and dozens of pathways that may play roles in the HUVECs MM, notably those related to Cell cycle and Oxidative phosphorylation.
Cell cycle
By pathway enrichment analysis, 16 HGMMGs were shown to be linked to the cell cycle, such as CDKN2C, E2F5, CCNB1, YWHAQ, ANAPC11, CCNA2, BUB1B, CCNB2, CDC25C, MAD2L1, PTTG1, BUB1, CDK1, among others. Almost all these HGMMGs were up-regulated in the HG group, and were maintained dysregulated in the MM group. During cell cycle, the ordered and normal expression of cyclin-dependent kinase 1(CDK1) and cyclin B are important for mitosis. However, sustained high expression or increased activity of CDK1/cyclin B can induce apoptosis. Following sustained Cyclin B1 (CCNB1) or B2 (CCNB2) binding and activation of CDK1, CDK1 can phosphorylate some key substrates to lead the cell to G2-phase arrest, M-phase, and cytokinesis promotion. Some studies show that activation of CDK1 has been involved in multiple neuronal death by activating the phosphorylation of BAD27, which acts as a pro-apoptotic protein through the inhibitory phosphorylation the anti-apoptotic proteins BCL-XL, BCL-2, and MCL-1.34,35 Moreover, some studies describing high glucose-induced HUVECs showed results similar to ours.36 Besides the BCL-2 family, CDK1 also phosphorylates the transcription factor FOXO3a, which also leads to cell death.37 We speculate that high glucose can induce CDK1 expression in HUVECs and CDK1-related death of HUVECs involving the BCL2 family or the FOXO3a promoting signaling pathway, and that MM can maintain these pathways.
Oxidative phosphorylation
By pathway enrichment analysis, 11 HGMMGs were enriched in oxidative phosphorylation, namely UQCRC1, ATP5F1B, ATP6V1E1, NDUFA4, MT-CYB, MT-ND2, MT-ND3, SDHD, MT-ND4L, ATP6V1G2, and MT-ATP8. Oxidative stress is a harmful stimulus to the body, resulting from excessive ROS, beyond the digestive capacity of the system. Excess of Reactive oxygen species (ROS) on cell DNA, protein, and lipids causes enormous damage.38 Oxidative stress in the vascular tissue can damage the endothelial function and lead to endothelial cell-dependent relaxation. ROS can attack unsaturated fatty acids in biofilms and form lipid peroxides. The metabolite malonaldehyde (MDA) is a harmful peroxide. In fact, some studies have found that high-glucose induced oxidative stress and endothelial dysfunction in HUVECs.39,40 Here, we found that eleven of the abnormally expressed genes during MM are involved in the oxidative response. Therefore, we speculate that during the MM period oxidative phosphorylation still maintains a certain activity, resulting in HUVEC damage.
Conclusion
We analyzed the protein-coding mRNA expression profile of HUVECs from the LG, HG, and MM groups. Abnormal expression of mRNAs associated with cell cycle and oxidative phosphorylation plays a crucial role in the long-term damage caused by MM. These findings may help us to understand the underlying molecular mechanism of high glucose-induced MM in HUVECs. Further research focusing on these mRNAs may develop new ways to control MM in diabetes.
Data Availability
The RNA-seq data used to support the findings of this study are available from the corresponding author upon request.
Acknowledgments
The authors gratefully acknowledge the financial support from the National Natural Science Foundation of China (grant no. 81770803), Science and Technology Development Fund of the First Affiliated Hospital of Bengbu Medical College (grant no. BYYFYKJ201716), and the Key Project of Natural Science Foundation of Bengbu Medical College (grant no. BYKY1736ZD). The authors gratefully acknowledge Mr. Qiang Fan (Ao-Ji Bio-Tech Co., Ltd., Shanghai, China) for providing help in data analysis.
Disclosure
The authors report no conflicts of interest in this work.
References
1. Zitman-Gal T, Green J, Pasmanik-Chor M, Golan E, Bernheim J, Benchetrit S. Vitamin D manipulates miR-181c, miR-20b and miR-15a in human umbilical vein endothelial cells exposed to a diabetic-like environment. Cardiovasc Diabetol. 2014;13:8. doi:10.1186/1475-2840-13-80
2. Lorenzen J, Kumarswamy R, Dangwal S, Thum T. MicroRNAs in diabetes and diabetes-associated complications. RNA Biol. 2012;9(6):820–827. doi:10.4161/rna.20162
3. Caporali A, Meloni M, Vollenkle C, et al. Deregulation of microRNA-503 contributes to diabetes mellitus-induced impairment of endothelial function and reparative angiogenesis after limb ischemia. Circulation. 2011;123(3):282–291. doi:10.1161/CIRCULATIONAHA.110.952325
4. Calles-Escandon J, Cipolla M. Diabetes and endothelial dysfunction: a clinical perspective. Endocr Rev. 2001;22(1):36–52. doi:10.1210/edrv.22.1.0417
5. Shen X, Li Y, Sun G, Guo D, Bai X. miR-181c-3p and −5p promotes high-glucose-induced dysfunction in human umbilical vein endothelial cells by regulating leukemia inhibitory factor. Int J Biol Macromol. 2018;115:509–517. doi:10.1016/j.ijbiomac.2018.03.173
6. Ceriello A. Postprandial hyperglycemia and diabetes complications: is it time to treat? Diabetes. 2005;54(1):1–7. doi:10.2337/diabetes.54.1.1
7. Ho FM, Lin WW, Chen BC, et al. High glucose-induced apoptosis in human vascular endothelial cells is mediated through NF-kappaB and c-Jun NH2-terminal kinase pathway and prevented by PI3K/Akt/eNOS pathway. Cell Signal. 2006;18(3):391–399. doi:10.1016/j.cellsig.2005.05.009
8. Li JY, Huang WQ, Tu RH, Zhong GQ, Luo BB, He Y. Resveratrol rescues hyperglycemia-induced endothelial dysfunction via activation of Akt. Acta Pharmacol Sin. 2017;38(2):182–191. doi:10.1038/aps.2016.109
9. Liu X, Chen D, Wu Z, et al. Ghrelin inhibits high glucose-induced 16HBE cells apoptosis by regulating Wnt/beta-catenin pathway. Biochem Biophys Res Commun. 2016;477(4):902–907. doi:10.1016/j.bbrc.2016.06.156
10. Ihnat MA, Thorpe JE, Ceriello A. Hypothesis: the ‘metabolic memory’, the new challenge of diabetes. Diabet Med. 2007;24(6):582–586. doi:10.1111/j.1464-5491.2007.02138.x
11. Ihnat MA, Thorpe JE, Kamat CD, et al. Reactive oxygen species mediate a cellular ‘memory’ of high glucose stress signalling. Diabetologia. 2007;50(7):1523–1531. doi:10.1007/s00125-007-0684-2
12. Zhang E, Guo Q, Gao H, Xu R, Teng S, Wu Y. Metformin and resveratrol inhibited high glucose-induced metabolic memory of endothelial senescence through SIRT1/p300/p53/p21 pathway. PLoS One. 2015;10(12):e0143814. doi:10.1371/journal.pone.0143814
13. Paneni F, Mocharla P, Akhmedov A, et al. Gene silencing of the mitochondrial adaptor p66(Shc) suppresses vascular hyperglycemic memory in diabetes. Circ Res. 2012;111(3):278–289. doi:10.1161/CIRCRESAHA.112.266593
14. Singh KK, Mantella LE, Pan Y, et al. A global profile of glucose-sensitive endothelial-expressed long non-coding RNAs. Can J Physiol Pharmacol. 2016;94(9):1007–1014. doi:10.1139/cjpp-2015-0585
15. Kim D, Langmead B, Salzberg SL. HISAT: a fast spliced aligner with low memory requirements. Nat Methods. 2015;12(4):357–360. doi:10.1038/nmeth.3317
16. Pertea M, Kim D, Pertea GM, Leek JT, Salzberg SL. Transcript-level expression analysis of RNA-seq experiments with HISAT, StringTie and Ballgown. Nat Protoc. 2016;11(9):1650–1667. doi:10.1038/nprot.2016.095
17. Pertea M, Pertea GM, Antonescu CM, Chang TC, Mendell JT, Salzberg SL. StringTie enables improved reconstruction of a transcriptome from RNA-seq reads. Nat Biotechnol. 2015;33(3):290–295. doi:10.1038/nbt.3122
18. Robinson MD, Oshlack A. A scaling normalization method for differential expression analysis of RNA-seq data. Genome Biol. 2010;11(3):R25. doi:10.1186/gb-2010-11-11-r110
19. Mortazavi A, Williams BA, McCue K, Schaeffer L, Wold B. Mapping and quantifying mammalian transcriptomes by RNA-Seq. Nat Methods. 2008;5(7):621–628. doi:10.1038/nmeth.1226
20. Nikolayeva O, Robinson MD. edgeR for differential RNA-seq and ChIP-seq analysis: an application to stem cell biology. Methods Mol Biol. 2014;1150:45–79. doi:10.1007/978-1-4939-0512-6_3
21. Robinson MD, McCarthy DJ, Smyth GK. edgeR: a Bioconductor package for differential expression analysis of digital gene expression data. Bioinformatics. 2010;26(1):139–140. doi:10.1093/bioinformatics/btp616
22. Sircar S, Parekh N. Meta-analysis of drought-tolerant genotypes in Oryza sativa: a network-based approach. PLoS One. 2019;14(5):e0216068.
23. Khatri B, Seo D, Shouse S, et al. MicroRNA profiling associated with muscle growth in modern broilers compared to an unselected chicken breed. BMC Genomics. 2018;19(1):683. doi:10.1186/s12864-018-5061-7
24. Wu X, Xie S, Wang L, Fan P, Ge S. A computational strategy for finding novel targets and therapeutic compounds for opioid dependence. PLoS One. 2018;13(11):e0207027.
25. Yu G, Wang LG, Han Y, He QY. ClusterProfiler: an R package for comparing biological themes among gene clusters. OMICS. 2012;16(5):284–287. doi:10.1089/omi.2011.0118
26. Ashburner M, Ball CA, Blake JA, et al. Gene ontology: tool for the unification of biology. The gene ontology consortium. Nat Genet. 2000;25(1):25–29. doi:10.1038/75556
27. Franceschini A, Szklarczyk D, Frankild S, et al. STRING v9.1: protein-protein interaction networks, with increased coverage and integration. Nucleic Acids Res. 2013;41(Databaseissue):D808–D815. doi:10.1093/nar/gks1094
28. Shannon P, Markiel A, Ozier O, et al. Cytoscape: a software environment for integrated models of biomolecular interaction networks. Genome Res. 2003;13(11):2498–2504. doi:10.1101/gr.1239303
29. Bader GD, Hogue CW. An automated method for finding molecular complexes in large protein interaction networks. BMC Bioinformatics. 2003;4:2.
30. Testa R, Bonfigli AR, Prattichizzo F, La Sala L, De Nigris V, Ceriello A. The “Metabolic memory” theory and the early treatment of hyperglycemia in prevention of diabetic complications. Nutrients. 2017;9(5). doi:10.3390/nu9050437
31. Wang Z, Zhao H, Guan W, Kang X, Tai X, Shen Y. Metabolic memory in mitochondrial oxidative damage triggers diabetic retinopathy. BMC Ophthalmol. 2018;18(1):258. doi:10.1186/s12886-018-0921-0
32. De Nigris V, Prattichizzo F, Mancuso E, Spiga R, Pujadas G, Ceriello A. Teneligliptin enhances the beneficial effects of GLP-1 in endothelial cells exposed to hyperglycemic conditions. Oncotarget. 2018;9(10):8898–8910. doi:10.18632/oncotarget.22849
33. Pujadas G, De Nigris V, Prattichizzo F, La Sala L, Testa R, Ceriello A. The dipeptidyl peptidase-4 (DPP-4) inhibitor teneligliptin functions as antioxidant on human endothelial cells exposed to chronic hyperglycemia and metabolic high-glucose memory. Endocrine. 2017;56(3):509–520. doi:10.1007/s12020-016-1052-0
34. Terrano DT, Upreti M, Chambers TC. Cyclin-dependent kinase 1-mediated Bcl-xL/Bcl-2 phosphorylation acts as a functional link coupling mitotic arrest and apoptosis. Mol Cell Biol. 2010;30(3):640–656. doi:10.1128/MCB.00882-09
35. Harley ME, Allan LA, Sanderson HS, Clarke PR. Phosphorylation of Mcl-1 by CDK1-cyclin B1 initiates its Cdc20-dependent destruction during mitotic arrest. Embo J. 2010;29(14):2407–2420. doi:10.1038/emboj.2010.112
36. Cai X, Hu Y, Tang H, et al. RNA methyltransferase NSUN2 promotes stress-induced HUVEC senescence. Oncotarget. 2016;7(15):19099–19110. doi:10.18632/oncotarget.8087
37. Guo D, Xiao L, Hu H, Liu M, Yang L, Lin X. FGF21 protects human umbilical vein endothelial cells against high glucose-induced apoptosis via PI3K/Akt/Fox3a signaling pathway. J Diabetes Complications. 2018;32(8):729–736. doi:10.1016/j.jdiacomp.2018.05.012
38. Usuki S, Tsai YY, Morikawa K, et al. IGF-1 induction by acylated steryl beta-glucosides found in a pre-germinated brown rice diet reduces oxidative stress in streptozotocin-induced diabetes. PLoS One. 2011;6(12):e28693. doi:10.1371/journal.pone.0028693
39. Chang Y, Chang TC, Lee JJ, et al. Sanguis draconis, a dragon’s blood resin, attenuates high glucose-induced oxidative stress and endothelial dysfunction in human umbilical vein endothelial cells. TheScientificWorldJournal. 2014;2014:423259. doi:10.1155/2014/423259
40. Zhou DY, Su Y, Gao P, Yang QH, Wang Z, Xu Q. Resveratrol ameliorates high glucose-induced oxidative stress injury in human umbilical vein endothelial cells by activating AMPK. Life Sci. 2015;136:94–99. doi:10.1016/j.lfs.2015.07.008
 © 2019 The Author(s). This work is published and licensed by Dove Medical Press Limited. The full terms of this license are available at https://www.dovepress.com/terms.php and incorporate the Creative Commons Attribution - Non Commercial (unported, v3.0) License.
By accessing the work you hereby accept the Terms. Non-commercial uses of the work are permitted without any further permission from Dove Medical Press Limited, provided the work is properly attributed. For permission for commercial use of this work, please see paragraphs 4.2 and 5 of our Terms.
© 2019 The Author(s). This work is published and licensed by Dove Medical Press Limited. The full terms of this license are available at https://www.dovepress.com/terms.php and incorporate the Creative Commons Attribution - Non Commercial (unported, v3.0) License.
By accessing the work you hereby accept the Terms. Non-commercial uses of the work are permitted without any further permission from Dove Medical Press Limited, provided the work is properly attributed. For permission for commercial use of this work, please see paragraphs 4.2 and 5 of our Terms.