")
Back to Journals » ClinicoEconomics and Outcomes Research » Volume 13
Mothers’ Acceptance and Willingness to Pay an Out-of-Pocket Payment for Maternal and Child Nutritional Services in Northwest Ethiopia
Authors Amare G , Yitayal M , Minyihun A , Debie A
Received 19 June 2021
Accepted for publication 7 August 2021
Published 18 August 2021 Volume 2021:13 Pages 767—776
DOI https://doi.org/10.2147/CEOR.S325617
Checked for plagiarism Yes
Review by Single anonymous peer review
Peer reviewer comments 2
Editor who approved publication: Prof. Dr. Dean Smith
Getasew Amare, Mezgebu Yitayal, Amare Minyihun, Ayal Debie
Department of Health Systems and Policy, Institute of Public Health, College of Medicine and Health Sciences, University of Gondar, Gondar, Ethiopia
Correspondence: Getasew Amare
Department of Health Systems and Policy, Institute of Public Health, College of Medicine and Health Sciences, University of Gondar, P.O. Box 196, Gondar, Ethiopia
Email [email protected]
Background: Around $3.5 trillion globally and up to $2.78 billion in Ethiopia, losses are reported annually due to malnutrition. Even if in Ethiopia nutrition services are delivered free of charge, specific public health programs may start to charge users of services that include maternal and child health services. Therefore, this study was aimed to assess mothers’ willingness to pay an out-of-pocket payment for maternal and child nutritional services and associated factors in Northwest Ethiopia.
Methods: A community-based cross-sectional study design was conducted at Yilmana Densa district from March to May 2017. The sample size was 569, and a systematic random sampling technique was used. Bi-variate, multivariable logistic regression, and Tobit econometric analysis models were done. Adjusted odds ratio (AOR) and B-coefficient with 95% confidence interval (CI) and p-value were used.
Results: A total of 545 (response rate of 95.8%) study participants were included in the study. The finding indicates that 88.8% of households were willing to pay for maternal and child nutrition services. The average amount of money to pay per visit was 19.6 ETB (CI = 18.8, 20.4) (0.84 USD). Mothers with good knowledge, good perceived family health status, medium and high perceived quality of services, and satisfaction with maternal and child nutritional services were significant variables to accept an out-of-pocket payment. In addition, the Tobit econometric model analysis reveals that knowledge, mothers’ age, pregnancy status, mothers’ educational status, wealth status, and self-reported satisfaction were identified as significant factors.
Conclusion: The majority of mothers were willing to accept out-of-pocket payments for maternal and child nutritional services with an average of 19.6 ETB. Therefore, strengthening awareness and improving the quality of nutritional services and maternal satisfaction may increase mothers’ willingness to pay an out-of-pocket payment.
Keywords: willingness to pay, Tobit model, maternal and child nutritional services, northwest Ethiopia
Background
Around $3.5 trillion per year were lost globally, and most African countries lose up to 16.5% of their Gross Domestic Product (GDP) due to malnutrition, and Ethiopia loses up to $2.78 billion annually.1,2 The 2016 global nutrition report revealed that investing $1 on nutrition will return $16, every additional centimetre of adult height is associated with a 4.5% increase in wage rate, and designs the strategy to end any form of malnutrition at the end of 2030.3,4
To overcome and solve this problem, different strategies have been designed by the global community and shared for member countries to be achieved. The 2016 global nutrition report develops the plan to end any form of malnutrition by 2030 and put some targets to be completed by 2025.
Ethiopia has tried to initiate different programs and strategies at the national level to overcome this problem, like designing national nutrition policies.5–8 In addition to this, nutritional service is included in the essential health packages of Ethiopia.9 Furthermore, Ethiopia’s maternal and child nutrition service is given for mothers by health extension workers under the packages of Health extension program at household and at health post level.10–12 The maternal and child nutrition service delivered by Health Extension Workers is focused on improving the awareness and practice of households on proper household feeding, breastfeeding, complementary feeding, feeding practice during pregnancy and child feeding practices.13 In addition, maternal and child nutrition services are targeted at mothers to revert nutrition-related national problems. These services are delivered at the primary health care level, mainly by health extension workers. The service includes counselling on proper infant feeding practice, maternal feeding practice during pregnancy and breastfeeding, infant growth monitoring, both sick baby and well-baby nutritional screening, mild malnutrition treatments.
The health policy of Ethiopia allows free-of-charge services utilization for maternal and child nutritional services, and the cost of these expenses is covered by the government and partners.14 According to Growth and Transformation Plan (GTP) II, the country will realize the national vision of becoming a lower-middle-income country by 2025.15 Therefore, Ethiopia will shift the payment mechanism of some services currently working on maternal and child nutrition to improve long-term sustainability to balance cost recovery and program attainment.16 As one component of the Ethiopian Healthcare Financing reform, the policy recommends revising the service fees based on the user’s ability to pay, service production cost, and the competitive market price with the principle of cost sharing.17–18 Willingness to accept and pay for an out-of-pocket payment for maternal and child nutritional services among current and prospective clients influences the chances for cost recovery.19–21 Therefore, assessing WTP from the beneficiaries’ perspective is very important to understand how the users value the maternal and child nutritional service and design a cost-recovery model that assures self-sustaining and high-volume nutritional services.22,23
Furthermore, long-term sustainability and designing revenue-generating mechanisms based on maternal ability and their level of willingness to pay for out-of-pocket payment have paramount importance. Therefore, this study was aimed to assess mothers’ acceptance and willingness to pay an out-of-pocket payment for maternal and child nutritional services and associated factors in Northwest Ethiopia.
Materials and Methods
Study Design and Settings
A community-based cross-sectional study design was conducted from March to May 2017 in Yilmana Densa district, Northwest Ethiopia. The district is selected randomly among the districts found in Northwest Ethiopia, which have comparable health system structures. The district is found in the West Gojjam administrative zone, Amhara National Regional State, Northwest Ethiopia. There are 28 rural and five urban Kebeles (the lowest administrative units in the county), one primary hospital, ten health centers, 33 health posts, and 78 health extension workers in the district. According to the 2016 population projection, the total population in the district was 214,852 within 49,965 households.24
Study Population and Sampling Procedures
The source population of this study was all mothers who were living in the Yilmana Densa district, whereas mothers who were living in the selected Kebeles of the district were the study population. In addition, mothers living for less than six months in the district were excluded from the study.
The sample size of the study was determined by single population proportion formula for 1st objective (prevalence) using the Epi InfoTM7 Statcalc program with the assumption of (P) = 78.6%,25 margin of error (w) = 5%, 95% confidence level with 5% level of significance, design effect =2 and 10% non-response rate.
N= (za/2)2(P) (q)/w2 =1.96*1.96*0.786*0.214/(0.05)2=258.5; after multiplying with design effect of 2 and adding 10% non-response rate; the final sample size for first objective was 569.
The sample size for the 2nd objective was calculated using the double population proportion formula, with an assumption of power = 80%, 5% non-response rate, design effect = 2 through identifying highly significant variables (wealth index and educational status) from previous studies.26,27 The proportion of willingness to pay among the non-exposed group through taking wealth index as a factor was 18.9%, OR=0.21, and for a non-exposed group of educational status was 8.2%, OR=4.5; sample sizes for these factors were 391 and 286, respectively. Therefore, the largest sample size, 561, was considered our final sample size for maintaining sample size adequacy.
First, the Kebeles of the district were stratified into urban and rural Kebeles. Then, five out of 28 rural and one from five urban Kebeles were selected using a simple random lottery method. Next, the total sample size was proportionally allocated to each selected Kebeles based on the size of the households. Finally, a systematic sampling technique was used to select the study participants after selecting the first household with a simple random lottery method.
Data Collection Tools and Procedures
Data were collected using a structured questionnaire through face-to-face interviews. The tool has socio-demographic characteristics, health-related factors, economic characteristics, and willingness to accept and pay for out-of-pocket payment sections. Six data collectors who were nurses with diploma-level qualifications and two supervisors who were public health officers were recruited. The questionnaires were first prepared in the English language, then translated to Amharic, then back to English to keep their consistency. The two-day training was given to data collectors and supervisors about the basic techniques and data collection tools. The collected data was checked by the principal investigator and the supervisors for its completeness. Double Bounded Dichotomous Choice Variant of the Contingent Valuation (CV) method was used to estimate the mothers’ willingness to pay for out-of-pocket payment of maternal and child health services. The participants were asked the maximum amount they were willing to pay for the service. The questionnaire was pretested on 29 mothers at Adet Hana kebele, one of the Kebeles found in the Yilmana Densa district with similar socio-demographic and economic status.
Measurement and Variables
Willingness to Accept Out-of-Pocket Payment for Maternal and Child Nutrition Services
Was the dependant variable measured using a single question as to whether mothers were willing to accept or not the out-of-pocket payment for maternal and child nutrition services.
Maximum Willingness to Pay (MWTP) for Maternal and Child Nutrition Services
Was the independent variable measured by questions prepared with a bidding game eliciting approach. After presenting the hypothetical scenario to assess how participants value the maternal and child nutrition services,28 the respondents were asked to accept or reject any positive price for the stated service. Then, those respondents who had accepted to pay some positive fees were asked their MWTP using the bidding format approach. The bidding game approach, a type of contingent valuation method, is used to pay studies to assess the stated preference of beneficiaries about the service and how the users value the service by subjective analysis of the utility generated from the service.29,30 The bidding game’s starting price was estimated from the pilot study done ab Bahir Dar Zuria district and expert opinion 25 Ethiopian Birr (ETB).
Those who said no or were unwilling to pay for the service were dropped for the next bidding game, which was used to assess the participants’ maximum willingness to pay for maternal and child health nutritional service. So, after presenting the case scenario, all participants were asked:
Are you willing to pay some positive price for maternal and child nutrition service?
1. Yes
2. No
Those who said yes to the first question were asked the maximum price they want to pay for the maternal and child nutritional service (Supplementary Figure 1).
Wealth Index
Household wealth was measured by asking several questions on the possession of different agricultural products, non-productive assets, and household facilities. The wealth index was derived by Principal Component Analysis (PCA).31,32
Data Processing and Analysis
The data was cleaned, coded, and entered into Epi Info version 7 software and exported to STATA version 14 for data management and analysis. The logistic regression model was used to determine the association between the willingness to accept out-of-pocket and its determinant factors for maternal and child nutritional services. Those variables having a p-value less than 0.2 during bi-variate analysis were included in the multivariable logistic regression. Crude Odds Ratio (COR), Adjusted Odds Ratio (AOR) with 95% Confidence Interval (CI), and p-value <0.05 were used to determine statistical significance.
Tobit econometric model was used to analyze the determinants of willingness to pay and the maximum amount of money that households are willing to pay. In addition, the Tobit econometrics model is used when there is a left, right, or both sides censoring from the outcome observation.33,34

if MWTP ≤0
The model estimates the marginal effect of explanatory variables on the expected value of the dependent variable. The Tobit model assumptions35,36 like normality, Multicollinearity (VIF = 1.33), and homoscedasticity using Breusch-pagan (hottest, X2 = 1.65, p = 0.19) of error terms were checked. Regression coefficients (β), 95% confidence interval, and p-value of <0.05 were used to measure a statistical association’s strength and presence.
Result
Socio-Demographic and Economic Characteristics of the Respondents
A total of 545 mothers participated in the study with a response rate of 95.8%. The Median age (IQR) of the respondents was 35 (45) years. The majority of respondents were Orthodox Christian followers (95.8%) and Amhara in Ethnicity (98.9%), housewives (88.62%), unable to read and write (76.1%), and married (92.7%). About one-third of the study participants (33.39%) were poor in wealth status (Table 1).
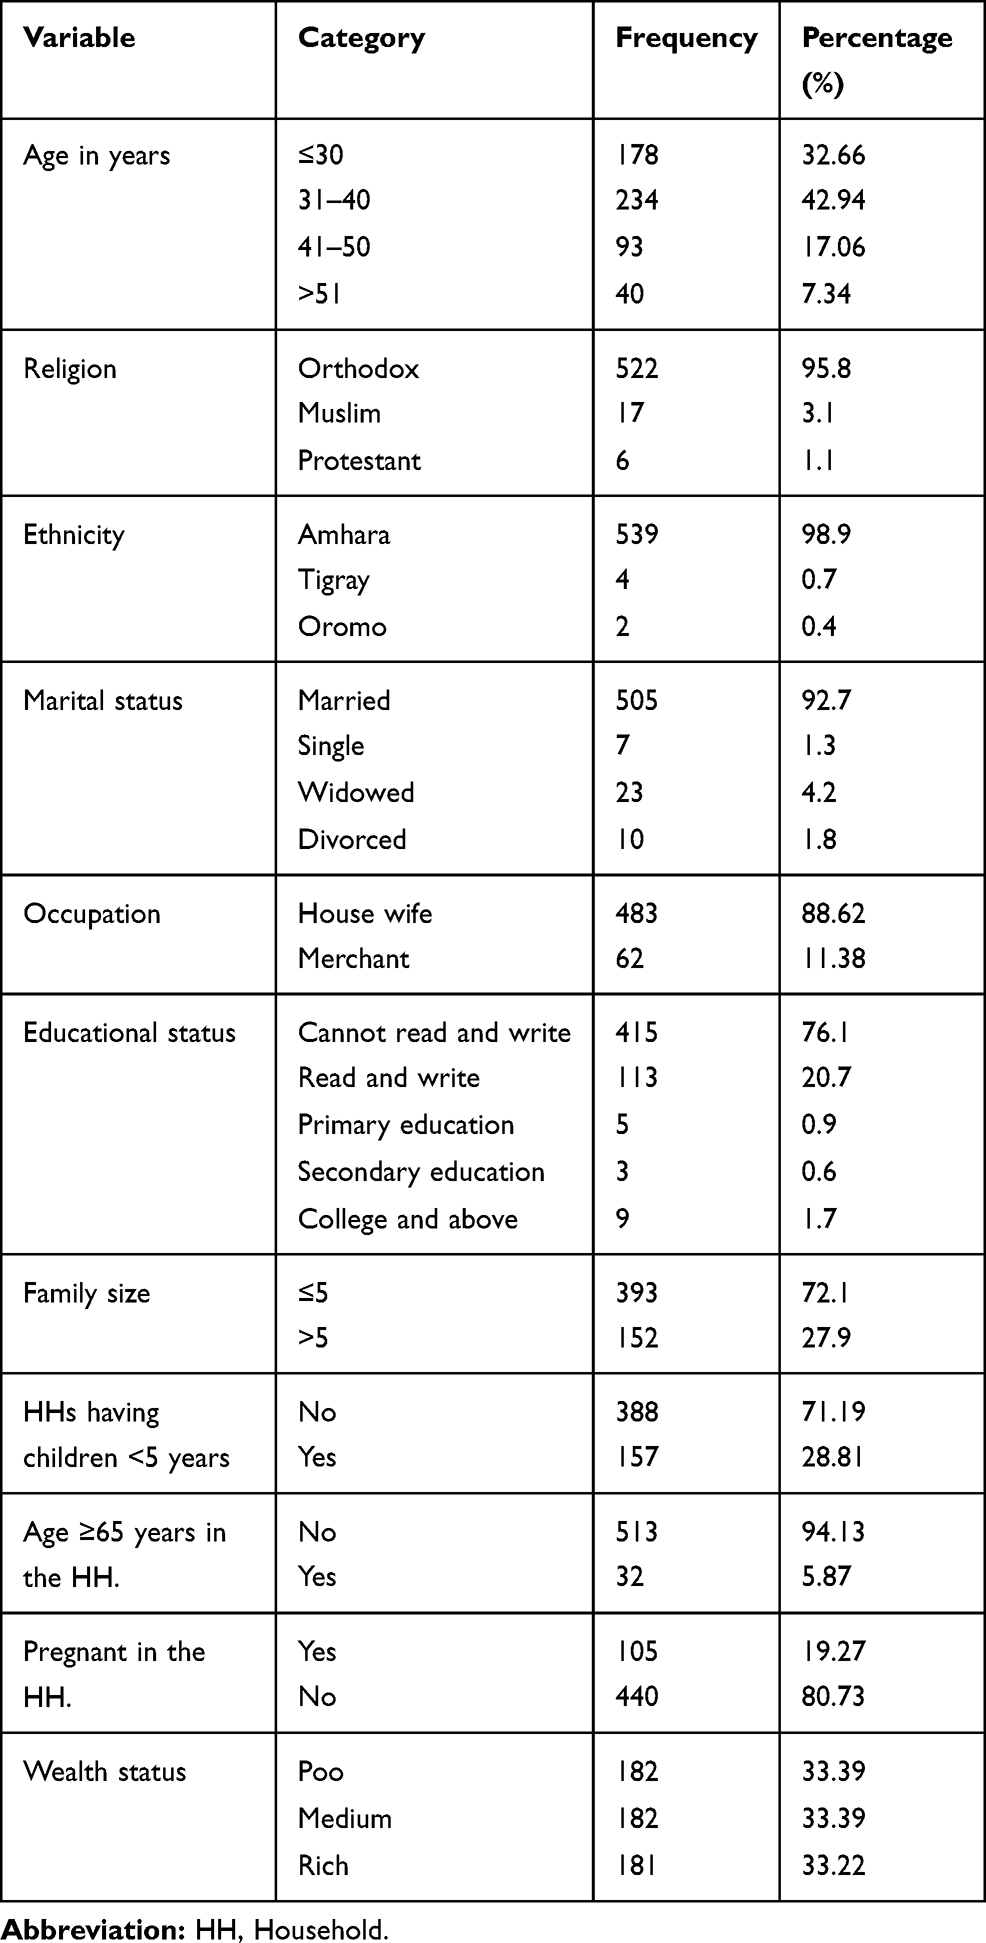 |
Table 1 Socio-Demographic and Economic Characteristics of Study Participants in Northwest Ethiopia, 2017 (n=545) |
Knowledge and Health-Related Characteristics of Respondents
Of all study participants, 69.17% of respondents were knowledgeable about maternal and child nutritional services; more than 55% of mothers got information through health extension workers; 22.39% of mothers had low perceived quality, and 62.94% were dissatisfied with maternal and child nutritional services. Moreover, 80.37% of study participants had perceived their family health status as good (Table 2).
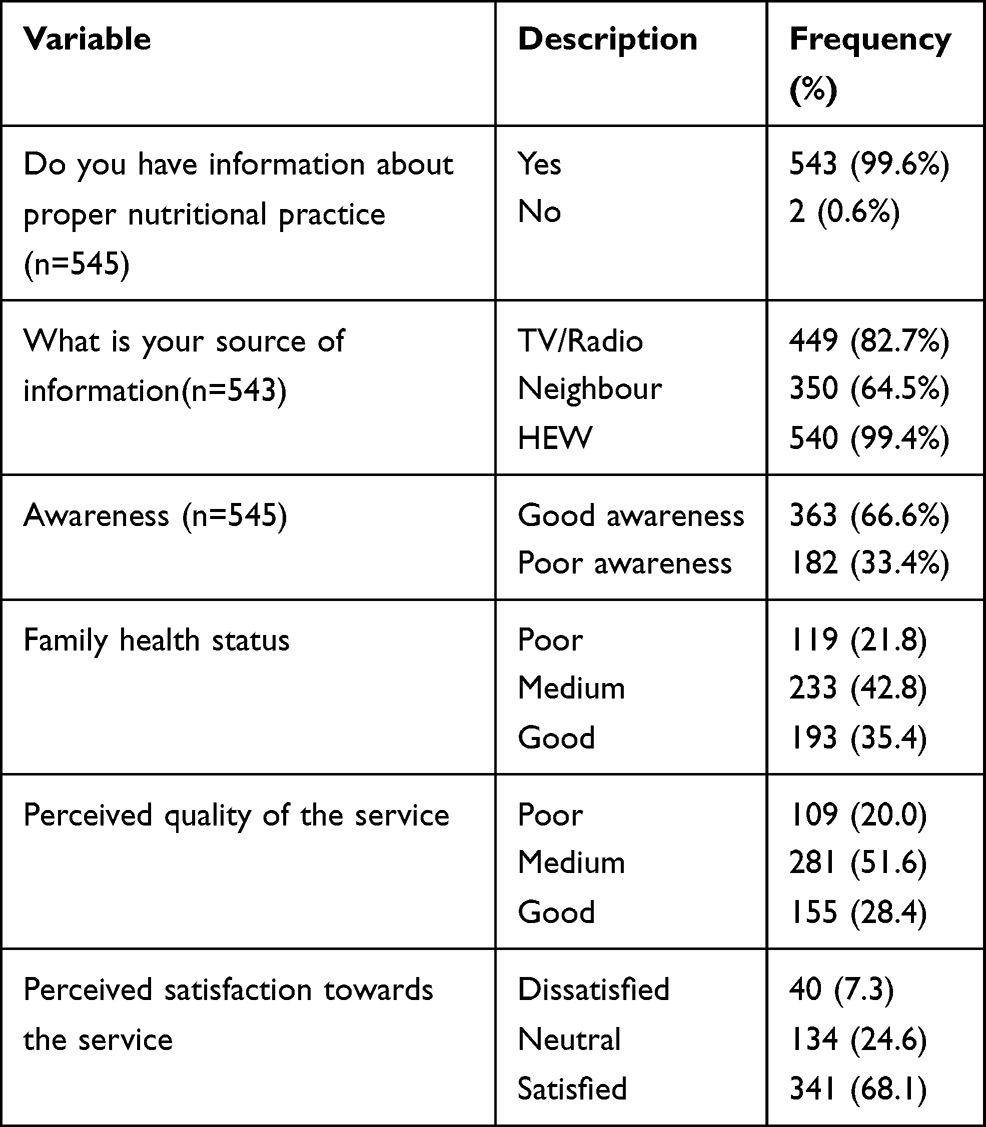 |
Table 2 Knowledge and Health-Related Characteristics of Households in Northwest Ethiopia, 2017 (N = 545) |
Mothers’ Acceptance and Maximum Willingness to Pay (MWTP) for Maternal Nutritional Service
After presenting the hypothetical scenario, participants were asked their willingness to accept and pay the out-of-pocket payment for maternal and child nutrition services. Out of the 545 participants, 88.8% (CI, 85.9, 91.4) were volunteers to accept some positive price for the maternal and child nutritional services. The mean (±SD) amount of money household heads willing to pay was 19.6 (95% CI= 18.8, 20.4) birr (±9.5) per household per visit or 0.84 $USD.
It is calculated as follows: -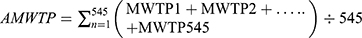
 Per visit for maternal and child nutritional service sessions
Note: - 1$USD= 23.4 ETB in May 2017 currency exchange, MWTP is an average willingness to pay; MWTP is the maximum amount of money willing to pay.
Factors Associated with Mothers’ Willingness to Accept the Out-of-Pocket Payment for Nutritional Service
Overall, 88.8% of mothers were willing to pay out of pocket for maternal and nutritional services. In addition, the study showed that perceived quality of services, maternal satisfaction, family health status, and mothers’ knowledge of proper nutritional practice were significantly associated with willingness to pay out of pocket for maternal and child nutritional services.
Mothers having good maternal and child nutritional services were 3.14 (AOR = 3.14; 95% CI: 1.98, 5.86) times more likely willing to pay out of pocket for maternal and child nutritional services than mothers having poor knowledge. Mothers who had medium and high perceived quality of services were 2.73 (AOR = 2.73; 95% CI: 1.28, 4.05) and 2.43 (AOR = 2.43; 95% CI: 1.12, 4.21) times more likely willing to pay out of pocket for maternal and child nutritional services, respectively, compared to mothers who had low perceived quality of services.
Mothers who were satisfied with maternal and child nutritional services were 2.13 (AOR=2.13; 95% CI: 1.03, 4.85) times more likely to pay out-of-pocket payments than dissatisfied mothers. Mothers who had good family health status were 3.90 (AOR = 3.90; 95% CI: 1.63, 6.18) times more likely willing to pay out of pocket for nutritional services than mothers from low-income family health status (Table 3).
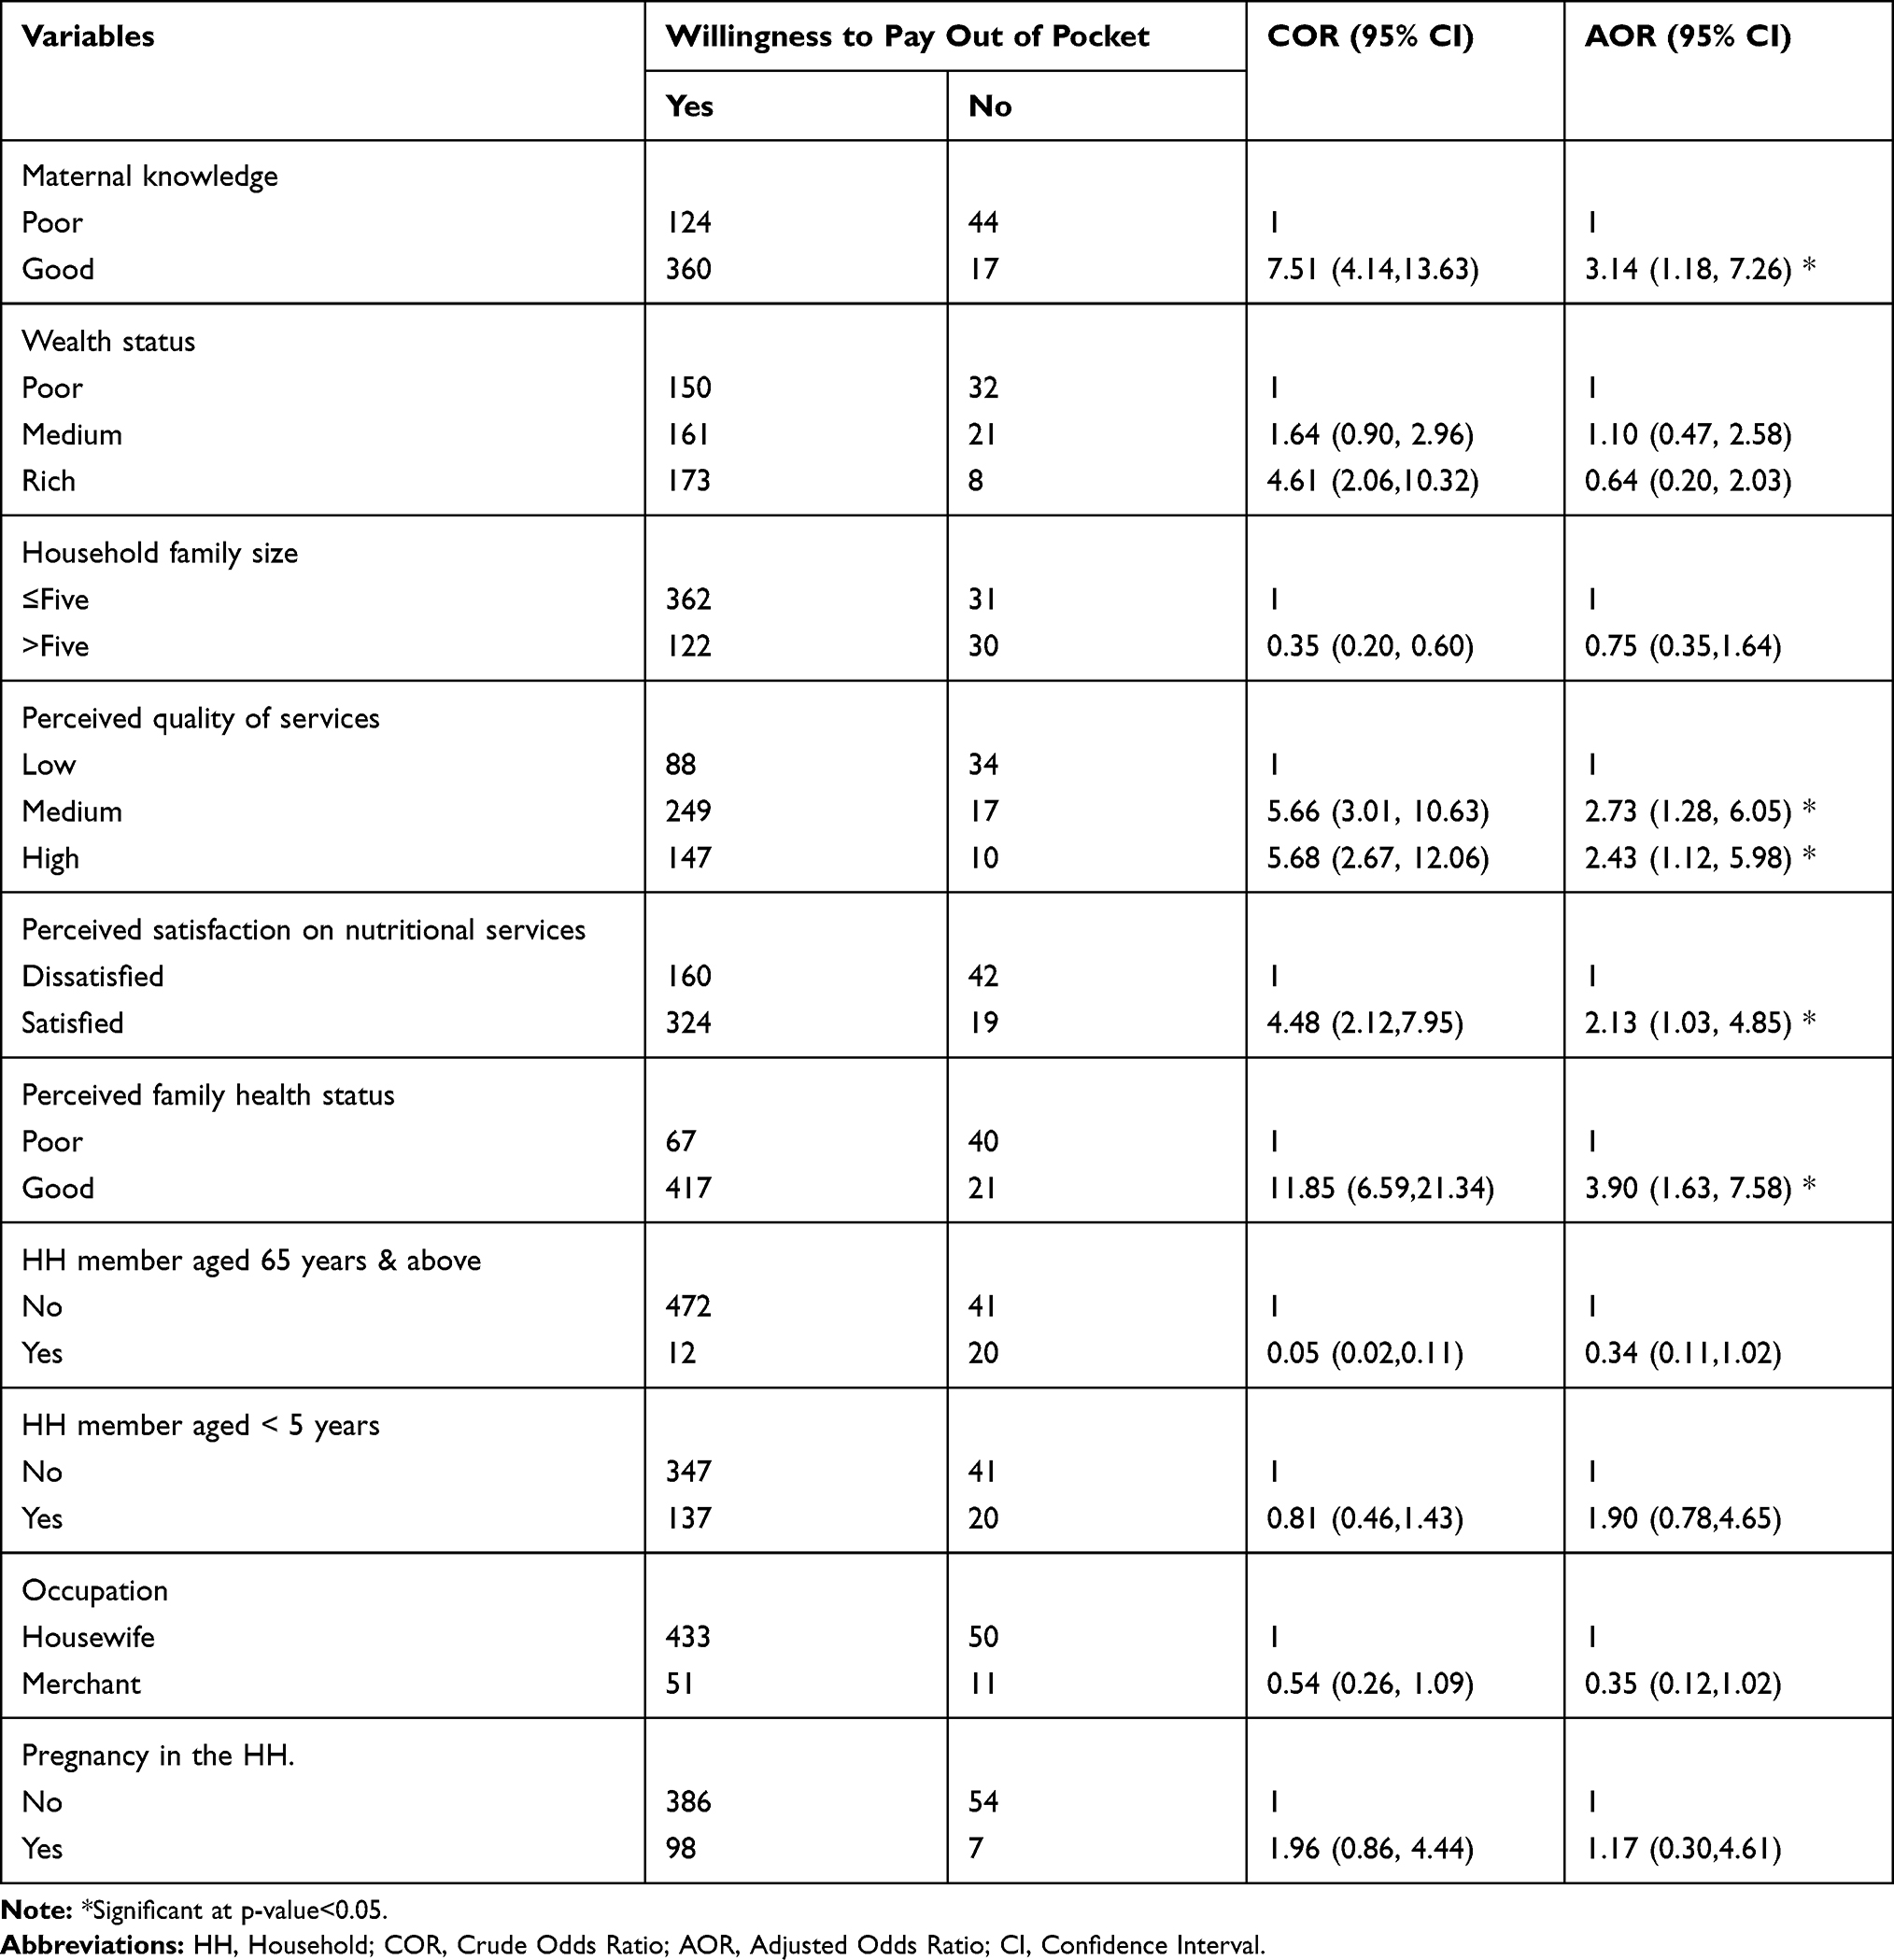 |
Table 3 Factors Associated with Mothers’ Willingness to Pay Out of Pocket for Maternal and Child Nutritional Services in Northwest Ethiopia, 2017 |
Factors Associated with Willingness to Pay for Maternal and Child Nutritional Service
The study showed that age, pregnancy status, educational status, satisfaction about the service, wealth status, and knowledge about proper nutritional service were the factors associated with willingness to pay for nutritional service in the multivariate Tobit econometrical regression model p-value ≤ of 0.05 (Table 4).
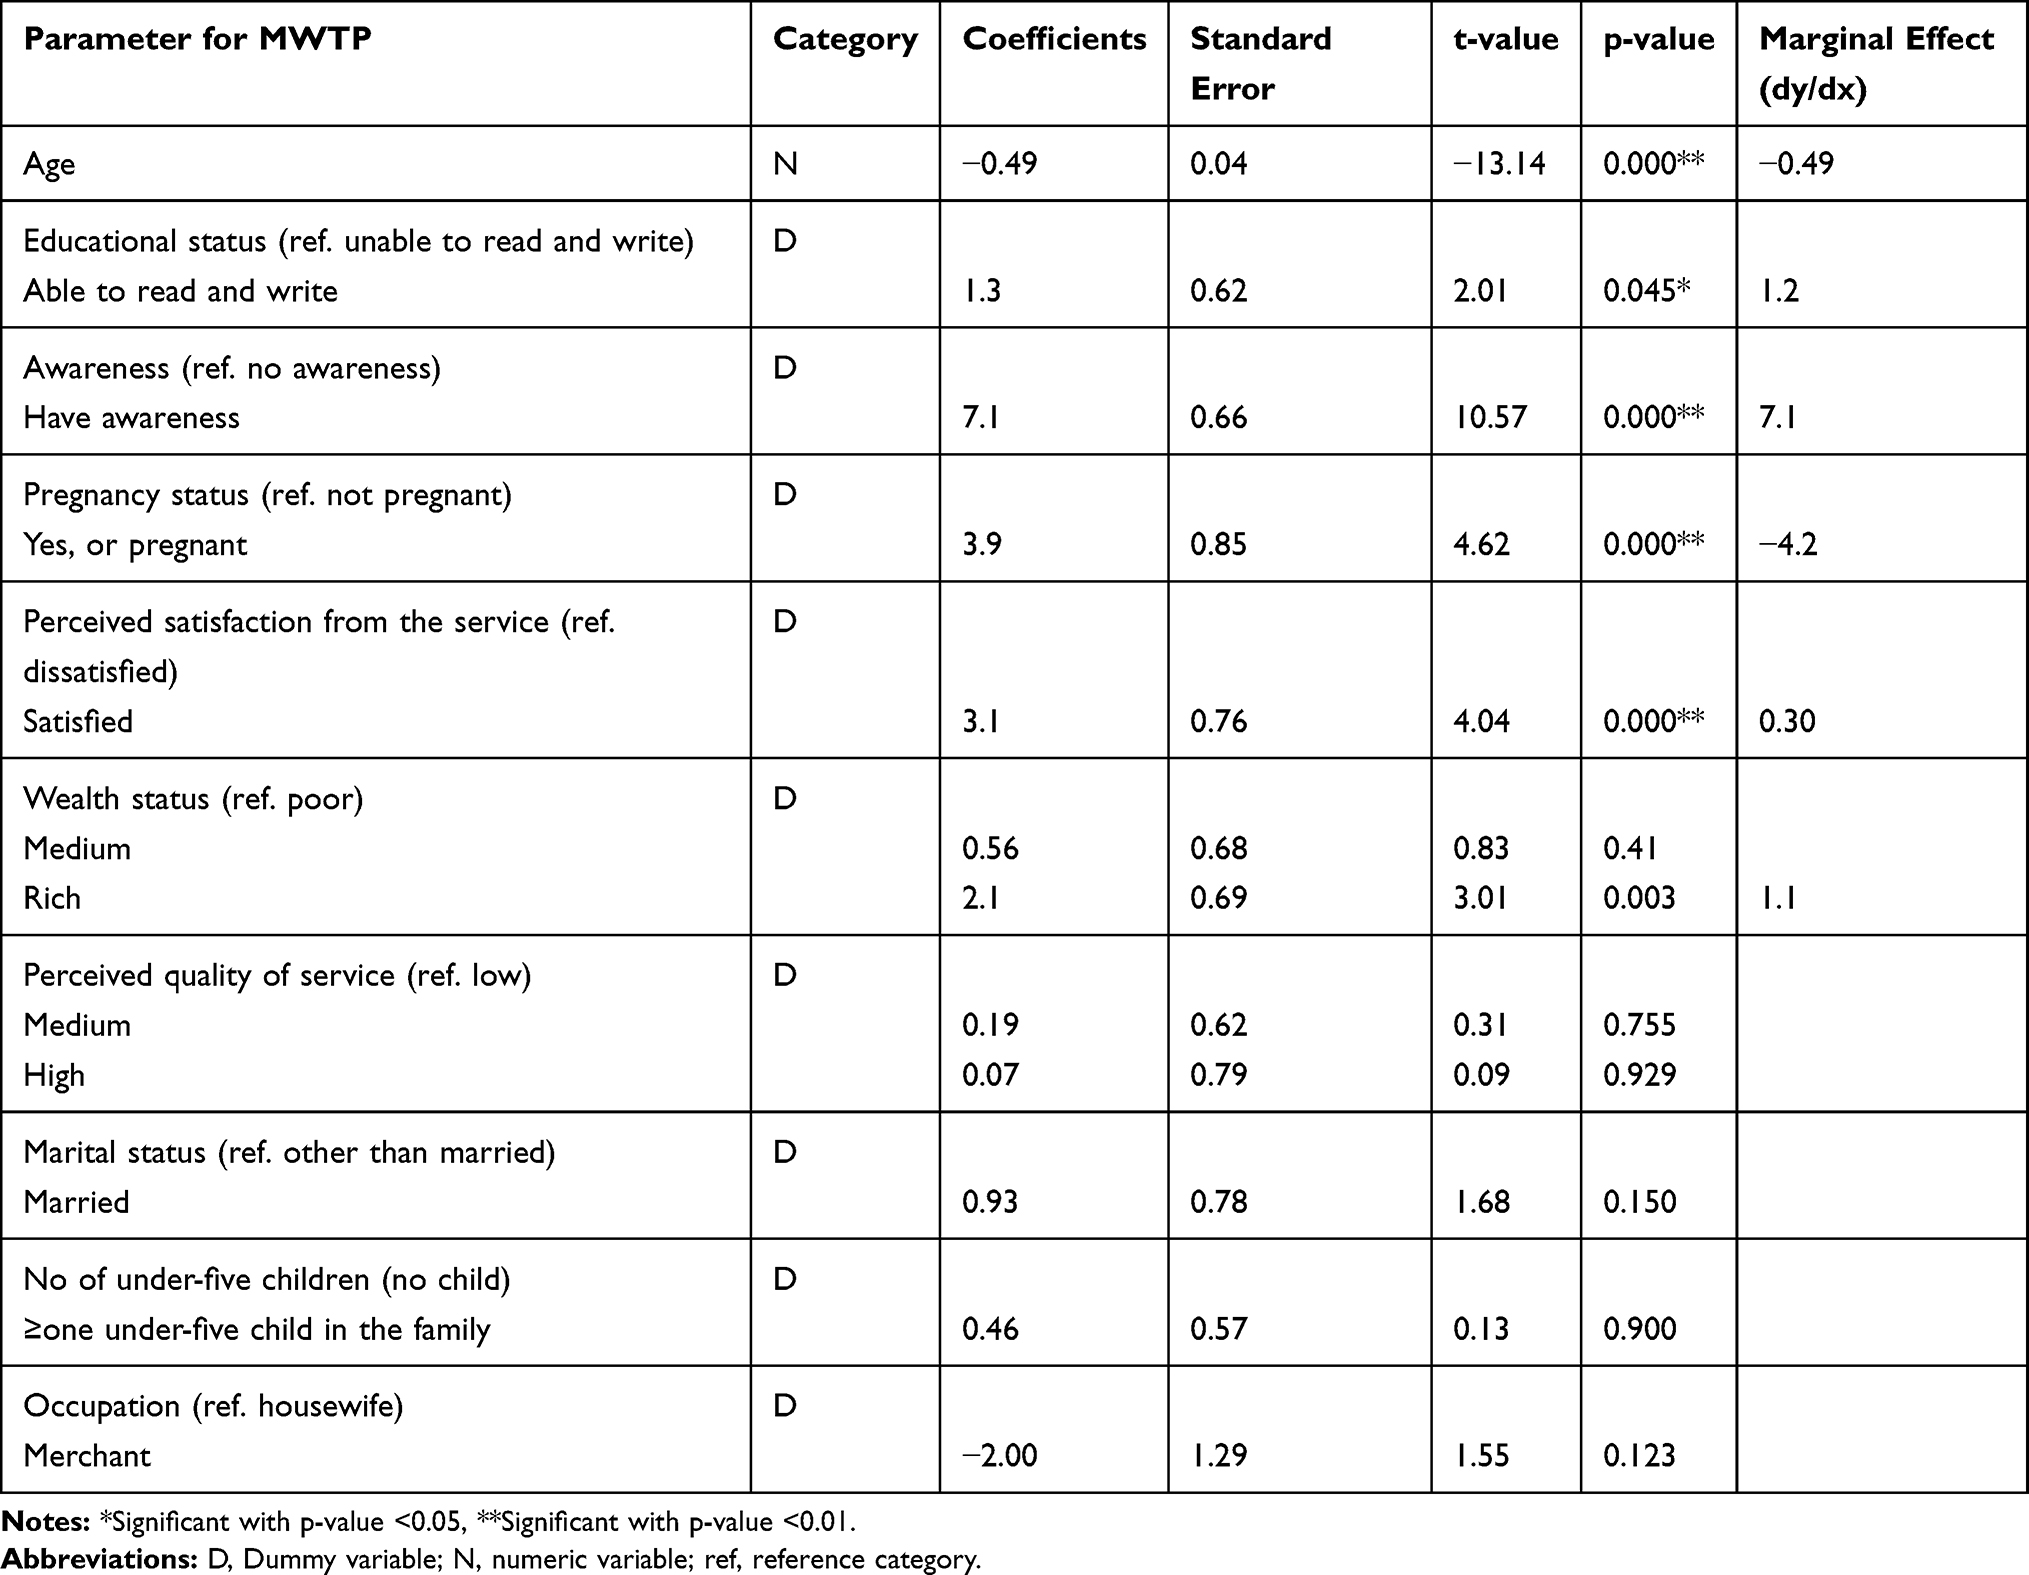 |
Table 4 Maximum Likelihood of Tobit Econometrical Analysis of Factors Associated with MWTP for Maternal and Child Nutritional Service in Northwest Ethiopia, 2017 |
As the age of respondents increased by one year, their willingness to pay for the nutritional service decrease by 0.5 ETB; other conditions were held constant. The marginal effect shows that when age increase by one unit, their willingness to pay for nutritional service decrease by 0.5 ETB (β=0.49, mean marginal effect=0.49, p-value=0.001).
The model also predicted that those satisfied by the service were willing to pay 3.1 ETB more than those dissatisfied by holding other variables constant. This study’s marginal effect reveals when dissatisfied mothers become satisfied, their willingness to pay will increase by 1.8 ETB (β=3.1, mean marginal effect=1.8, p-value=0.001).
Mothers who had good knowledge about the nutritional services were willing to pay 7.1 ETB more than those who had no awareness by keeping other variables constant. The marginal effect says when mothers who had no awareness become aware, their willingness to pay will increase by 7.1 ETB (β=7.1, mean marginal effect=7.1, p-value=0.001).
Respondents whose can read and write and above were willing to pay 1.3 ETB more than those cannot read and write keeping other variables constant. The marginal effect of this variable shows when respondents who cannot read and write can read and write, their willingness to pay for this service will increase by 1.2 ETB (β=1.3, mean marginal effect=1.2, p-value=0.011).
During the study, pregnant mothers were willing to pay 4 ETB more than those who were not pregnant by holding other variables constant. The marginal effect shows households under the rich group were willing to pay 2.1 ETB more than those under the poor group by considering other variables constant. The marginal effect of this variable reveals when households under poor group change to the rich group, their willingness to pay will increase by 1.1 ETB (β=2.1, mean marginal effect=1.1, p-value=0.001).
Discussion
This study aimed to assess the stated preference of mothers on the out-of-pocket payment for maternal and child nutrition services. In addition, the study also assessed the factors affecting the mothers’ willingness to accept and pay for maternal and child nutrition services.
This study reveals that 88.8% (CI, 85.9, and 91.4) of mothers were willing to pay out of pocket for maternal and child nutritional services. This figure is lower than the figure reported in a study done in four cities of Ethiopia (Hawassa, Mekelle, Central, and Peripheral Addis Ababa) on willingness to pay for a lipid-based nutrient supplement for young children was (96%),27 Iran (95%) and Vietnam (93%).26,37 The possible explanation for this variation might be the difference in study design, area, population, and data collection period.
Those mothers who had the medium and high perceived quality of maternal and child nutritional services were 2.73 and 2.43 times more likely willing to out-of-pocket payment for these services, respectively, compared to low perceived quality of services. The possible explanation might be that mothers who had the medium and high perceived quality of services want to be maximized getting quality services through the payment, which may increase service quality.
Mothers who were satisfied with maternal and child nutritional services were 2.13 times more likely willing to pay out of pocket than dissatisfied mothers. This might be due to the rational behaviour of customers/people that is satisfaction might maximize their utility. Mothers perceived as having good and above family health status were 3.90 times more likely willing to pay out of pocket payment for the services than those with poor perceived family health status. This might be because mothers with medium and above-perceived family health status might struggle to maintain their family health.
Those mothers with good knowledge of maternal and child national services were 3.14 times more likely to pay out of pocket for maternal and child nutritional services than their counterparts. This might be due to the ability of mothers, who have good knowledge, anticipating the cost of illness resulted from complication when nutritional status of mothers and children are not timely managed.
The Tobit econometrical regression analysis revealed that Mothers’ awareness about proper nutritional practice had strongly associated with willingness to pay (β=7.1, p-value=0.001). This finding is supported by other studies conducted in different African countries.38–40 Therefore, the possible explanation might be that the benefits of the service and its advantages increase service utilization and willingness to pay.
The household wealth status also has a positive association with the explained variable. Different studies from Ethiopia,27 Ghana,39 Vietnam26 Irian41 and Nigeria.18 This may be due to more wealth that may have additional money to be allocated to maintain family health promotion.
The other important variable identified by this study to have a significant positive association with willingness to pay is the educational status of the respondents. Studies from different parts of the world recognized as educational status positively associated with the preference and utilization of different health services in Vietnam26 and Korea.42 The possible explanation might be as educational status increases and individuals become more informative and aware of their health issues.
Another finding of this study is perceived satisfaction from the service has a significant positive association with willingness to pay. This might be customers’ interest in paying more for those services that maximize their utility.
Mothers who are pregnant are more willing to pay for maternal and child nutritional services. This may be because pregnant mothers have the opportunity to visit the health facility and health professionals frequently and be exposed to information. However, a study done in Ghana38 on willingness to pay for new maternal nutrient supplements shows the willingness of pregnant mothers has a negative association. Their possible explanation is mothers may not want to invest in their child before delivery due to uncertainty in the birth outcome.
Limitation and Strength of This Study
The limitation of this study is the contingent valuation method is prone to both interviewee and interviewer bias. Nevertheless, the method used in this study helps assess how maternal and child nutrition service is valued by mothers and indirectly how this service is efficiently implemented.
Conclusion
Eighty-eight percent of participants were willing to pay an average of 19.6 ETB (0.84 $USD) for maternal and child nutritional services. The respondent’s willingness to pay for maternal and child nutritional service was influenced by the respondent, educational status, pregnancy status, awareness about nutrition, and wealth status within the household. Therefore, strengthening awareness creation, improving the quality of nutritional services, and maternal satisfaction is paramount for increasing mothers’ willingness to pay out of pocket. Besides, researchers should conduct further researches, especially on the amount of money that mothers are willing to pay through mixed methods.
Abbreviations
ETB, Ethiopian Birr; HH, Household; MWTP, Maximum Willingness to Pay; WTP, Willingness to Pay.
Data Sharing Statement
The datasets supporting the conclusions of this article are available upon request to the corresponding author. However, we do not make participants’ data publicly available due to data protection restrictions and participant confidentiality.
Ethics Approval and Consent to Participate
This study was conducted by the Declaration of Helsinki. Ethical clearance was obtained from the Ethical Review Committee of the Institute of Public Health, College of Medicine and Health Sciences, University of Gondar. Written informed consent was taken from each participant. Moreover, verbal informed consent was obtained from those participants who could not read and write, approved by the ethical committee. Each eligible participant was informed about the purpose of the study. Participants were also assured that their name was not written on the data’s questionnaire, and confidentiality was kept at all levels.
Acknowledgments
We are very thankful to the University of Gondar to approve the ethical issue and its technical and financial support. Furthermore, we forward our appreciation to the district health office managers to conduct this research and their cooperation. Finally, we would like to thank study participants for their volunteer participation and data collectors and supervisors for their genuineness and quality of work during data collection.
Author Contributions
All authors made substantial contributions to conception and design, acquisition of data, or analysis and interpretation of data; took part in drafting the article or revising it critically for important intellectual content; agreed to submit to the current Journal; gave final approval of the version to be published; and agree to be accountable for all aspects of the work.
Funding
There is no funding to report.
Disclosure
The authors declare that they have no conflicts of interest for this work.
References
1. Global Nutrition Report 2015: Actions and accountability to advance nutrition and sustainable development. Washington, DC: International Food Policy Research Institute; 2015. doi:10.2499/9780896298835
2. African Union Commission, NEPAD Planning and Coordinating Agency, UN Economic Commission for Africa, and UN World Food Programme. The cost of hunger in Africa. Social and economic impact of child undernutrition in Egypt, Ethiopia, Swaziland and Uganda. Addis Ababa: UNECA; 2014. Available from: https://www.spring-nutrition.org/publications/resource-review/updates/cost-hunger-africa-social-and-economic-impact-child.
3. Global Nutrition Report 2016: From Promise to Impact: Ending Malnutrition by 2030. International Food Policy Research Institute; 2016. doi:10.2499/9780896295841
4. Horton S, Steckel RH. Malnutrition: global economic losses attributable to malnutrition 1900–2000 and projections to 2050; 2011. Available from: https://www.copenhagenconsensus.com/sites/default/files/malnutrition.pdf.
5. Government of the Federal Democratic Republic of Ethiopia. National Nutrition Programme June 2013 – June 2015. Available from: https://extranet.who.int/nutrition/gina/sites/default/filesstore/ETH%202013%20National%20Nutrition%20Programme.pdf.
6. The Federal Democratic Republic of Ethiopia, National School Health and Nutrition Strategy. Addis Ababa: Ministry of Education; 2012. Available from: https://www.iapb.org/wp-content/uploads/Ethiopia_National-School-Health-Nutrition-Strategy.pdf.
7. Country Programming Framework for Ethiopia 2016—2020. Addis Ababa: Food and Agriculture Organization of the United Nations; 2017. Available from http://www.fao.org/3/i7527e/i7527e.pdf.
8. The Federal Democratic Republic of Ethiopia Ministry of Health. HSTP: Health Sector Transformation Plan: 2015/16 - 2019/20 (2008-2012 EFY); 2015. Available from: https://www.globalfinancingfacility.org/sites/gff_new/files/Ethiopia-health-system-transformation-plan.pdf.
9. Wright J. Essential package of health services country snapshot: The Democratic Republic of the Congo. Bethesda, MD: Health Finance & Governance Project, Abt Associates Inc; 2015. Available from: https://www.hfgproject.org/essential-package-of-health-services-country-snapshot-the-democratic-republic-of-the-congo/.
10. Banteyerga H. Ethiopia’s health extension program: improving health through community involvement. MEDICC Rev. 2011;13(3):46–49.
11. Sebhatu A. The Implementation of Ethiopia’s Health Extension Program: An Overview; 2008. Available from: http://www.partners-popdev.org/wp-content/uploads/2017/11/ethiopiahep.pdf.
12. Wang H, Tesfaye R, Ramana GN, Chekagn CT. Ethiopia Health Extension Program: An Institutionalized Community Approach for Universal Health Coverage. The World Bank; 2016.
13. Ministry of Health, AA, Health service extension programme draft implementation guideline; January 2005. Available from: https://phe-ethiopia.org/resadmin/uploads/attachment-162-HEP_Implementation_guidline.pdf.
14. Zelelew H. Health Care Financing Reform in Ethiopia: Improving Quality and Equity. USAID; Health Systems 20/20; 2012. Available from: https://www.hfgproject.org/wp-content/uploads/2015/02/Ethiopia_Health_Care_Reform_Brief1.pdf.
15. Ethiopia, F.D.R.O. Growth and Transformation Plan II (GTP II) (2015/16–2019/20). National Planning Commission; 2016.
16. Foreit JR, Foreit KGF. The reliability and validity of willingness to pay surveys for reproductive health pricing decisions in developing countries. Health Policy (New York). 2003;63(1):37–47. doi:10.1016/S0168-8510(02)00039-8
17. Alebachew A. Ethiopia’s Progress in Health Financing and the Contribution of the 1998 Health Care and Financing Strategy in Ethiopia. MA, Addis Ababa: Harvard TH Chan School of Public Health and Breakthrough International Consultancy, PLC; 2015.
18. Olasehinde N, Olaniyan O. Determinants of household health expenditure in Nigeria. Int J Soc Econ. 2017;44(12):1694–1709. doi:10.1108/IJSE-12-2015-0324
19. Bratt JH, Foreit WM. The impact of price changes on demand for family planning and reproductive health services in Ecuador. Health Policy Plan. 2002;17(3):281–287. doi:10.1093/heapol/17.3.281
20. Ma L. Do contraceptive prices affect demand? Stud Fam Plann. 1986;17(3):126–135. doi:10.2307/1967030
21. Routh S, Kane TA. User-fees for familyplanning methods: an analysis of payment behaviour among urban contraceptors in Bangladesh. J Health Popul Nutr. 2000;18:69–78.
22. Breidert C, Hahsler M, Reutterer T. A review of methods for measuring willingness-to-pay. Innov Mark. 2006;2(4):8–32.
23. Bala MV, Mauskopf JA, Wood LL. Willingness to pay as a measure of health benefits. Pharmacoeconomics. 1999;15(1):9–18. doi:10.2165/00019053-199915010-00002
24. Summary and Statistical Report of the 2007 Population and Housing Census. Addis Ababa: Federal Democratic Republic of Ethiopia Population Census Commission; 2008. Available from: https://www.ethiopianreview.com/pdf/001/Cen2007_firstdraft(1).pdf.
25. Nguyen HV, Trinh NB, Le HT, et al. preference and willingness to pay for nutritional counseling services in urban Hanoi. F1000Research. 2017;6:223. doi:10.12688/f1000research.10974.2
26. Nguyen PH, Hoang MV, Hajeebhoy N, et al. Maternal willingness to pay for infant and young child nutrition counseling services in Vietnam. Glob Health Action. 2015;8(1):28001. doi:10.3402/gha.v8.28001
27. Segrè J, Winnard K, Abrha TH, et al. Willingness to pay for lipid‐based nutrient supplements for young children in four urban sites of Ethiopia. Matern Child Nutr. 2015;11(S4):16–30. doi:10.1111/mcn.12022
28. Blumenschein K, Johannesson M, Yokoyama K, et al. Hypothetical versus real willingness to pay in the health care sector: results from a field experiment. Value Health. 2001;4(2):79. doi:10.1046/j.1524-4733.2001.40202-36.x
29. Venkatachalam L. The contingent valuation method: a review. Environ Impact Assess Rev. 2004;24(1):89–124. doi:10.1016/S0195-9255(03)00138-0
30. Klose T. The contingent valuation method in health care. Health Policy (New York). 1999;47(2):97–123. doi:10.1016/S0168-8510(99)00010-X
31. Wold S, Esbensen K, Geladi P. Principal component analysis. Chemom Intell Lab Syst. 1987;2(1–3):37–52. doi:10.1016/0169-7439(87)80084-9
32. Verbeek M. A Guide to Modern Econometrics. John Wiley & Sons; 2008.
33. McDonald JF, Moffitt RA. The uses of Tobit analysis. In: The Review of Economics and Statistics. The MIT Press; 1980:318–321.
34. Amemiya T. Tobit models: a survey. J Econom. 1984;24(1–2):3–61. doi:10.1016/0304-4076(84)90074-5
35. Wooldridge JM. Introductory Econometrics: A Modern Approach. Nelson Education; 2016.
36. Gujarati DN, Porter DC. Essentials of Econometrics. Vol. 2. Singapore: Irwin/McGraw-Hill; 1999.
37. Haghjou M. Factors affecting consumers’ potential willingness to pay for organic food products in Iran: case study of Tabriz. J Agric Sci Technol. 2013;15(2):191–202.
38. Adams KP, Vosti SA, Lybbert TJ, Ayifah E. Integrating Economic Analysis with a Randomized Controlled Trial: Willingness-To-Pay for a New Maternal Nutrient Supplement; 2011. Available from: https://ageconsearch.umn.edu/record/103793/.
39. Owusu V. Assessing Consumer Willingness to Pay a Premium for Organic Food Product: Evidence from Ghana; 2012. Available from: https://ageconsearch.umn.edu/record/123394/.
40. Ngigi MW, Okello JJ, Lagarkvist C, Karanja N, Mburu J. Assessment of developing-country urban consumers’ willingness to pay for quality of leafy vegetables: The case of middle and high income consumers in Nairobi, Kenya; 2010 Available from: http://erepository.uonbi.ac.ke/handle/11295/37167.
41. Shahraki M, Ghaderi S. The Effect of Socioeconomic Factors on Household Health Expenditures: Heckman Two-Step Method. PAYAVARD-SALAMAT. 2019;13(2):160–171.
42. Engelhardt K, Ahn BC, Cho SI, et al. Predictors of interest in nutrition topics and willingness to participate in local nutrition programmes. J Public Health (Bangkok). 2007;29(1):9–12. doi:10.1093/pubmed/fdl024
 © 2021 The Author(s). This work is published and licensed by Dove Medical Press Limited. The full terms of this license are available at https://www.dovepress.com/terms.php and incorporate the Creative Commons Attribution - Non Commercial (unported, v3.0) License.
By accessing the work you hereby accept the Terms. Non-commercial uses of the work are permitted without any further permission from Dove Medical Press Limited, provided the work is properly attributed. For permission for commercial use of this work, please see paragraphs 4.2 and 5 of our Terms.
© 2021 The Author(s). This work is published and licensed by Dove Medical Press Limited. The full terms of this license are available at https://www.dovepress.com/terms.php and incorporate the Creative Commons Attribution - Non Commercial (unported, v3.0) License.
By accessing the work you hereby accept the Terms. Non-commercial uses of the work are permitted without any further permission from Dove Medical Press Limited, provided the work is properly attributed. For permission for commercial use of this work, please see paragraphs 4.2 and 5 of our Terms.