")
Back to Journals » International Journal of Chronic Obstructive Pulmonary Disease » Volume 11 » Issue 1
Morphological changes in small pulmonary vessels are associated with severe acute exacerbation in chronic obstructive pulmonary disease
Authors Yoshimura K, Suzuki Y , Uto T, Sato J, Imokawa S, Suda T
Received 29 February 2016
Accepted for publication 16 April 2016
Published 28 June 2016 Volume 2016:11(1) Pages 1435—1445
DOI https://doi.org/10.2147/COPD.S107424
Checked for plagiarism Yes
Review by Single anonymous peer review
Peer reviewer comments 3
Editor who approved publication: Dr Richard Russell
Katsuhiro Yoshimura,1,2 Yuzo Suzuki,1,2 Tomohiro Uto,2 Jun Sato,2 Shiro Imokawa,2 Takafumi Suda1
1Second Division, Department of Internal Medicine, Hamamatsu University School of Medicine, Hamamatsu, Japan; 2Department of Respiratory Medicine, Iwata City Hospital, Iwata, Japan
Background: Pulmonary vascular remodeling is essential for understanding the pathogenesis of chronic obstructive pulmonary disease (COPD). The total cross-sectional area (CSA) of small pulmonary vessels has been reported to correlate with the pulmonary artery pressure, and this technique has enabled the assessment of pulmonary vascular involvements. We investigated the contribution of morphological alterations in the pulmonary vessels to severe acute exacerbation of COPD (AE-COPD).
Methods: This study enrolled 81 patients with COPD and 28 non-COPD subjects as control and assessed the percentage of CSA (%CSA) less than 5 mm2 (%CSA<5) and %CSA in the range of 5–10 mm2 (%CSA5–10) on high-resolution computed tomography images.
Results: Compared with the non-COPD subjects, the COPD patients had lower %CSA<5. %CSA<5 was positively correlated with airflow limitation and negatively correlated with the extent of emphysema. COPD patients with lower %CSA<5 showed significantly increased incidences of severe AE-COPD (Gray’s test; P=0.011). Furthermore, lower %CSA<5 was significantly associated with severe AE-COPD (hazard ratio, 2.668; 95% confidence interval, 1.225–5.636; P=0.010).
Conclusion: %CSA<5 was associated with an increased risk of severe AE-COPD. The distal pruning of the small pulmonary vessels is a part of the risk associated with AE-COPD, and %CSA<5 might be a surrogate marker for predicting AE-COPD.
Keywords: chronic obstructive pulmonary disease (COPD), acute exacerbation, pulmonary vessels, cross-sectional area (CSA), computed tomography
Introduction
Chronic obstructive pulmonary disease (COPD) is a global health problem that is associated with increased morbidity and mortality. COPD is a chronic inflammatory disease that affects the airway and lung parenchyma, and it is characterized by progressive expiratory airflow limitation.1,2 The inflammation in COPD is not limited to the lung, and systemic inflammation is now considered a specific characteristic of COPD. In addition to small airway remodeling and emphysema, which are the cardinal features of COPD, vascular remodeling and arteriosclerosis caused by the systemic inflammation are also involved in the pathogenesis of COPD.3 Indeed, vascular remodeling, subsequent pulmonary hypertension, and right ventricular heart failure are associated with the severity and prognosis of COPD, which highlights the importance of pulmonary hypertension in COPD.4 However, assessing pulmonary hypertension in COPD is not as straightforward as assessing airflow limitation or the extent of emphysema, because a diagnosis of pulmonary hypertension requires direct pulmonary arterial pressure measurements that involve right heart catheterization.5
The analysis of chest computed tomography (CT) scans in COPD has contributed greatly to our understanding of the pathophysiology of COPD. Airway remodeling and emphysema analyses, which can determine airway wall thicknesses and evaluate the low-attenuation area (LAA) in the lungs, have shown significant associations with pulmonary function, and with the severity and prognosis of COPD.6–9 In addition, Matsuoka et al10 recently demonstrated that the small pulmonary vessels’ area, which were assessed by measuring the total cross-sectional area (CSA) of the small pulmonary vessels on chest CT scans, are significantly correlated with the pulmonary arterial blood pressure (Ppa), thereby indicating that the percentage of CSA (%CSA) less than 5 mm2 (%CSA<5) could be a useful surrogate marker during assessments of pulmonary vessel involvement in COPD.10–13
As consequences of the systemic inflammation in COPD, airway remodeling and pulmonary vessel involvement synergistically exacerbate airflow limitation and pulmonary hypertension, leading to an increased risk of mortality.14,15 In this complex inflammatory disease, acute exacerbation of COPD (AE-COPD) rapidly worsen lung function and reduce a patient’s health status and quality of life, resulting in major causes of mortality.2 Thus, predicting and preventing AE-COPD have been emphasized in the management of COPD. The severities of the airflow limitation and emphysema, which are represented as the forced expiratory volume in 1 second (FEV1), percent FEV1 (%FEV1)/forced vital capacity (FVC), and the percent LAA (%LAA), have been reported as significant predictors of AE-COPD.7,16,17 Although the inflammation in COPD involves both the airway and the pulmonary vessels, the impact of the involvement of the pulmonary vessels on AE-COPD is not yet fully understood. Therefore, the aim of this study was to investigate the contribution of morphological alterations in the small pulmonary vessels to severe AE-COPD by assessing %CSA.
Methods
Study population
This observational study was conducted at Iwata City Hospital and was approved by the hospital’s ethics committee. The need for patient approval and/or informed consent was waived because the study comprised reviews of the patients’ records and images. This study enrolled 81 patients (79 men and two women with a mean age of 77.0 years) with stable COPD who were eligible for simultaneous evaluations of pulmonary function tests (PFTs) and chest high-resolution CT (HRCT) between January 2007 and April 2013. This study also included 28 consecutive non-COPD subjects who were current smokers visiting smoking cessation clinic available for assessing PFT and HRCT simultaneously during the period. A diagnosis of COPD was made according to the Global Initiative for Chronic Obstructive Lung Disease (GOLD) criteria.2 Patients were excluded from the study if they met the following exclusion criteria: large abnormal lung parenchymal lesions other than emphysema, pleural effusion, sleep apnea, and cardiomegaly with unstable congestive heart failure. We also excluded patients with COPD whose HRCT did not meet quality requirements because of incomplete breath-hold.
Definitions of severe AE-COPD and clinical characteristics
AE-COPD was defined using the GOLD criteria, that is, a worsening of the respiratory symptoms for two consecutive days or more.1 Severe AE-COPD was defined as acute exacerbations that required hospital admission.18 After performing HRCT and PFTs, incidences of severe AE-COPD were assessed. Clinical data and comorbidities of individual subjects were collected based on medical records. Asthma was defined as episodes of wheezing and reversible airflow limitation by the postbronchodilator increase in FEV1. Cardiovascular diseases were defined as diseases, including ischemic heart disease, congestive heart failure, coronary heart disease, and peripheral vascular disease.19 Hypertension and diabetes were defined based on patient reports or use of medication for hypertension and diabetes. A spirometer (Chestac-8900; Chest, Tokyo, Japan) was used to measure lung function.
Assessments of the %CSA and the percent low attenuation volume (%LAV)
All of the subjects underwent noncontrast, full-lung CT scanning using a 320-multidetector scanner (Aquillion; Toshiba Medical Systems, Otawara, Japan) with the following parameters: 120 kVp, 50–350 mA, and 0.813 pitch. The 1 mm thick images were obtained at full inspiration during a single breath-hold. Patients were coached on full inspiration technique by technicians before CT scanning. The measurement of the pulmonary CSA has been described elsewhere.10 Three CT slices were selected from the HRCT images, namely, the upper slice, the medium slice, and the lower slice, which were taken at ~1 cm above the upper margin of the aortic arch, ~1 cm below the carina, and ~1 cm below the right inferior pulmonary vein, respectively. The three CT images were analyzed using a semiautomatic image processing program (ImageJ, version 1.48; National Institutes of Health, Bethesda, MD, USA) (Figure S1). The CSA measured on each CT slice were summed, and they were categorized as “CSA<5” if the total CSA of the subsubsegmental vessels was less than 5 mm2 and “CSA5–10” if the total CSA of the subsegmental vessels ranged from 5 to 10 mm2. The percentages of the CSA5–10 (%CSA5–10) and CSA<5 (%CSA<5) within the total lung area were calculated.
Quantitative analyses of the patients’ emphysema were performed on the segmented lung images using the Thoracic VCAR software (GE Medical Systems; Milwaukee, WI, USA). The extent of the emphysema, which was measured as the percent low attenuation volume (%LAV), was defined as the lung volume with a CT attenuation value of less than -950 HU relative to the total lung volume.20
Statistical analysis
The discrete variables are expressed as numbers (percentages), and the continuous variables are described as the medians (ranges), unless otherwise specified. The Mann–Whitney U-test was used for the continuous variables, and the Kruskal–Wallis test and post hoc analyses were used for the multigroup comparisons. Categorical data were analyzed using the chi-square test or Fisher’s exact probability test of independence. Receiver operating characteristic (ROC) curve analysis was employed to evaluate the performances of the prognostic parameters at predicting severe AE-COPD, and the optimal cutoff values were obtained. Cumulative incidence of severe AE-COPD was estimated using the method of Fine and Gray,21 and comparison was performed by Gray’s test. Any death was considered as a competing risk in the analysis. Univariate analyses were performed by Fine–Gray’s proportional hazards model to determine predictors of severe AE-COPD. The statistical analyses were performed using the R software (version 3.2.0, The R Foundation for Statistical Computing, Vienna, Austria).22 P-values of less than 0.05 were considered significant.
Results
Clinical characteristics
The clinical characteristics of the 81 patients with COPD are summarized in Table 1. All patients had histories of heavy smoking at a median level of 55 pack-years (range, 10–212 pack-years). Among the 81 patients with COPD, eight (9.9%) had asthma, 32 (39.5%) had cardiovascular disease, 15 (30.8%) had hypertension, and nine (11.1%) had diabetes. The proportions of the GOLD classification stages according to airflow limitation severity were 27.2% in stage I, 39.5% in stage II, 28.4% in stage III, and 4.9% in stage IV. Most of the patients were treated with long-acting muscarinic antagonists and/or long-acting β agonists, whereas 42 (51.9%) patients were administered inhaled corticosteroids. Long-term oxygen therapy was administered to eleven patients (13.8%).
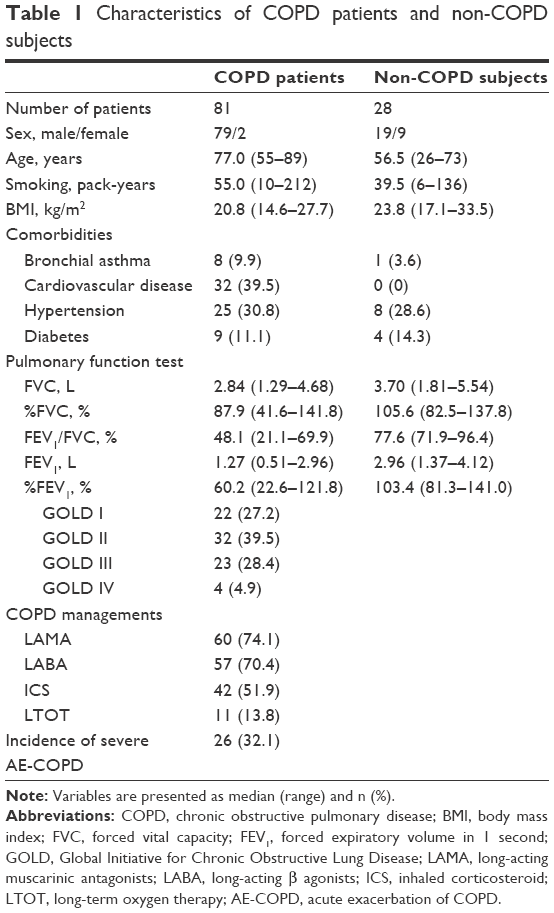 | Table 1 Characteristics of COPD patients and non-COPD subjects |
CSA measurements and clinical relationships
To assess the morphological modulations, we measured the CSA of the small pulmonary vessels on the chest CT images from the COPD patients. We also measured CSA of individuals having smoking history but who did not meet COPD criteria for evaluation of physiological alterations of COPD on small pulmonary vessels. Although our non-COPD subjects were not matched with age, sex, or comorbidities, patients with COPD had significantly lower %CSA<5 and %CSA5–10 values than non-COPD subjects (P<0.001) (Figure 1A and B). The decrease in the %CSA<5 with the COPD patients tended to be dependent on the disease severity (Figure 1C), but not %CSA5–10 (Figure 1D). %CSA<5 was positively associated with airflow limitation (%FEV1, ρ=0.491; FEV1/FVC, ρ=0.590) and negatively associated with the extent of emphysema (%LAV, ρ=−0.761) (Figures S2 and S3). Weaker relationships were also found between the %CSA<5 and age (ρ=−0.374), and the body mass index (BMI) (ρ=0.442). %CSA<5 had stronger relationships with those parameters than the %CSA5–10. %CSA<5 showed relatively stronger relationships with airflow limitation and the extent of the emphysema (Table S1).
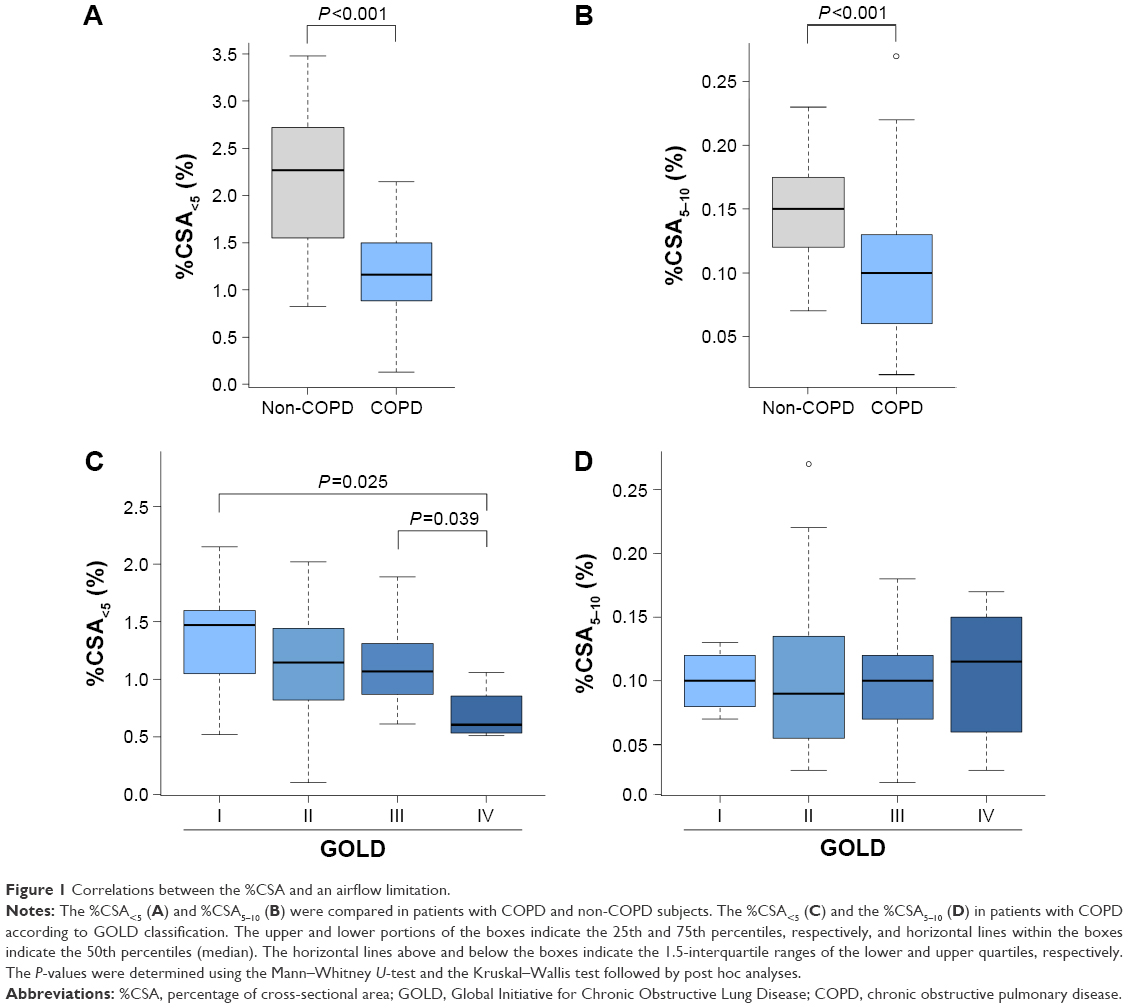 | Figure 1 Correlations between the %CSA and an airflow limitation. |
Association between the %CSA<5 and severe AE-COPD
During the observation period, which had a median duration of 29.2 months, 26 COPD patients (32.1%) experienced severe AE-COPD. To determine the optimal cutoff value of parameters for predicting severe AE-COPD, ROC analyses were performed. As shown in Table 2, the cutoff value was 1.0% for the %CSA<5 (area under the ROC curve [AUC], 0.636; sensitivity, 53.8%; specificity, 70.9%). Meanwhile, the cutoff values of %FEV1 and %LAV were 50% (AUC, 0.830; sensitivity, 69.2%; specificity, 83.6%) and 30% (AUC, 0.782; sensitivity, 76.9%; specificity, 69.1%), respectively.
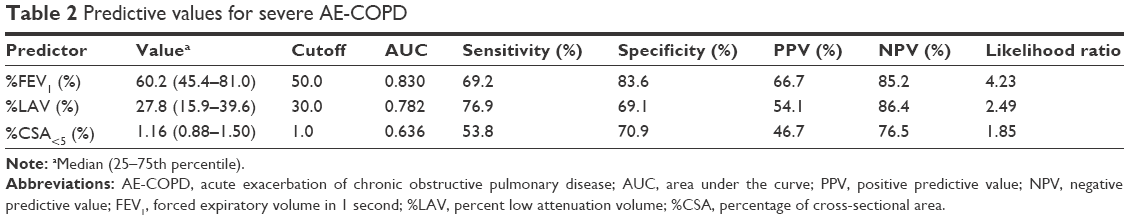 | Table 2 Predictive values for severe AE-COPD |
Using the optimal cutoff value of %CSA<5, significantly higher incidence of severe AE-COPD was observed among patients with the lower %CSA<5 than those with the higher %CSA<5 (Gray’s test, P=0.011; Figure 2). As shown in Table 3, the Fine–Gray’s proportional hazard model determined that age, BMI, %FEV1, and %LAV were significantly associated with severe AE-COPD and that the lower %CSA<5 was also significantly associated with severe AE-COPD (hazard ratio, 2.668; 95% confidence interval, 1.263–5.636; P=0.010). Multivariate analysis was not performed because of limited cases of our cohort.23 To determine clinical usefulness of %CSA<5, subgroup analysis was performed. We found that decreased %CSA<5 was associated with severe AE-COPD in COPD patients classified GOLD I and II (Table S2).
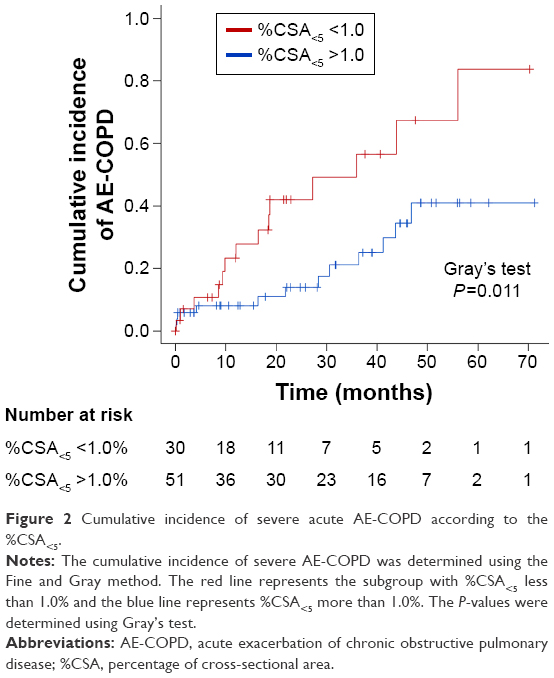 | Figure 2 Cumulative incidence of severe acute AE-COPD according to the %CSA<5. |
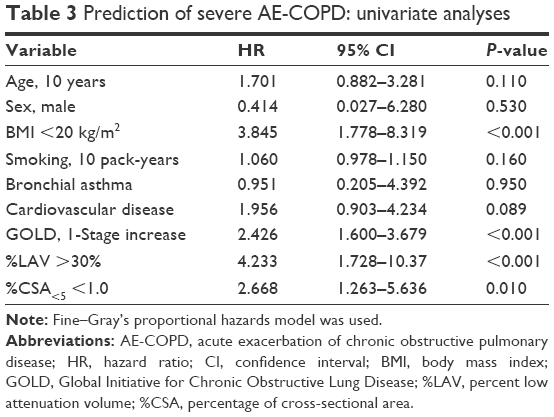 | Table 3 Prediction of severe AE-COPD: univariate analyses |
Discussion
This study evaluated modulations in the morphology of the small pulmonary vessels in patients with COPD by measuring the %CSA on chest CT images. Reductions in the sizes of the small pulmonary vessels are a cardinal feature of COPD. The %CSA<5 was positively correlated with airflow limitation and was negatively associated with the extent of the emphysema. In addition, the frequency of severe AE-COPD was significantly higher in the COPD patients who had lower %CSA<5 values, and we found an association between lower %CSA<5 and frequencies of severe AE-COPD. The findings from this study are the first to demonstrate the utility of the %CSA<5 as a surrogate marker for predicting severe AE-COPD.
In the past decade, analyses of chest CT scans have greatly improved our understanding of COPD physiology. Examinations of airway wall thicknesses and assessments of the extent of the emphysema have shown significant relationships with airflow limitation and disease severity, which have given rise to significant predictors of AE-COPD and mortality.6–9 However, compared with our accrued understanding of the airway and lung parenchyma in COPD, the complications associated with the pulmonary vessels have not been comprehensively examined. Although the presence of pulmonary hypertension, which is a common complication of COPD, is associated with an increase in mortality,24 assessing pulmonary hypertension requires right heart catheterization to be performed.5 Estimating the Ppa using echocardiographs does not reflect the Ppa results obtained from right heart catheterization. In this setting, advances in CT image analysis have partially resolved these difficulties: the %CSA<5 determined from chest CT images significantly correlates with the Ppa and was associated with airflow limitation or disease severity.11–13 In the present study, we have further advanced our understanding of the vascular involvement in COPD by assessing the %CSA<5 changes in the small pulmonary vessels and showed that the %CSA<5 is a valuable surrogate marker for predicting severe AE-COPD. Collectively, our results indicate that both airway and pulmonary vessel remodeling impact negatively upon the prognosis of COPD.
Vascular remodeling is a feature of COPD, and the narrowing of and numeric reductions of the small arteries are known.25 Histologically, the endothelial abnormalities are observed in patients with COPD from an early stage, resulting in vascular remodeling.26–28 Hueper et al29 have reported that the pulmonary microvascular blood flow assessed by dynamic contract-enhanced magnetic resonance imaging (MRI) was reduced in mild COPD. COPDGene study has demonstrated the direct association of peripheral pulmonary blood vessel volume with oxygen saturation, diffusing capacity, and St. George’s Respiratory Questionnaire (SGRQ) score.30 Another study showed that the distal pruning of small pulmonary vessels was associated with main pulmonary artery enlargements, which mediate the right ventricular dysfunction.31 These findings corroborate our data and suggest that remodeling of the distal small pulmonary vessels as opposed to the proximal small vessels is an essential component of the pathogenesis of pulmonary vascular remodeling in COPD.
We found that correlation between the %CSA and pulmonary functions was more prominent in the CSA<5 than in the %CSA5–10. The histological vascular alteration in COPD also varies according to vessel size.32 Subsubsegmental vessels represented that the CSA<5 consists of both elastic and muscular vessels, whereas the CSA5–10 consists of mainly elastic vessels.10 Vascular remodeling in COPD mainly occurred in small muscular arteries.33 Therefore, these differences might influence the values of %CSA<5 and %CSA5–10.
The relationships between airway complications, including airflow limitation and emphysema, and pulmonary vascular remodeling have been described,33–35 and it is thought that the changes in the morphology of the small vessels in COPD follow airway remodeling and that complications associated with both the airway and the vasculature affect each other.33 Indeed, compared with the FEV1, endothelial dysfunction in COPD, which is assessed using flow-mediated dilation, is more closely associated with the level of emphysema determined from CT scans.34 A recent advanced analysis that used gadolinium-enhanced MRI has shown reductions in the pulmonary microvascular blood flow in the lung without clear evidence of emphysema,36 indicating the presence of distinct pathological processes associated with airway and pulmonary vascular remodeling in COPD.
Because systematic inflammations are considered as the pathogenesis of COPD, there are various comorbidities complicated with COPD. Among those, cardiovascular disease and atherosclerosis are deeply involved with endothelial dysfunctions of COPD.37,38 In this study, 40% of COPD patients had cardiovascular disease and the reported significant associations between decreased %CSA<5 and atherosclerosis are represented as aortic calcifications.39 Importantly, increased expression of vascular endothelial growth factor in pulmonary artery and impaired release of endothelium-derived nitric oxide (NO) in mild or moderate COPD patients were reported,35,40 indicating that endothelial dysfunctions arose from the early stage of COPD. Similarly, we also detected significantly decreased %CSA<5 even with mild COPD, suggesting that assessing CSA of small pulmonary vessels might reflect endothelial dysfunctions of COPD and might determine the progressions of COPD.
Although incidences of severe AE-COPD are generally lower in mild COPD than those in severe COPD, the results from our study indicate that it was preferable to evaluate the %CSA<5 for predicting severe AE-COPD in patients with mild-to-moderate COPD, rather than in patients with severe COPD. However, there are few patients with severe COPD in our cohort, especially those with GOLD stage IV. In addition, the numbers of subjects were relatively small to enable decision making using multivariate analyses. We only retrospectively evaluated severe AE-COPD, thus the impact of %CSA<5 on mild or moderate AE-COPD remains unknown. This study has several limitations. Although associations between %CSA<5 and severe AE-COPD were independent with results from non-COPD subjects, the non-COPD subjects were not fully matched with the COPD subjects in age, sex, and comorbidities. Second, the proportion of women in COPD cohort was relatively lower. These differences were due to the retrospective nature of the study. Therefore, further large and prospective studies are required for evaluating the precise values of %CSA<5 in predicting severe AE-COPD and also disease progressions of COPD.
Conclusion
In conclusion, the present study demonstrated for the first time that decreased %CSA<5 was associated with severe AE-COPD. This study may provide new understandings for clinical implications of small vessel remodeling in COPD pathogenesis, and assessing %CSA<5 might be a surrogate marker for predicting severe AE-COPD.
Acknowledgment
The authors thank Dr Kazutaka Mori (Hamamatsu University School of Medicine) for advices on statistics.
Author contributions
All authors contributed toward data analysis, drafting, and critically revising the paper and agree to be accountable for all aspects of the work.
Disclosure
No funding bodies were involved in the study’s design, data collection and analysis, the decision to publish, or in the preparation of the manuscript. The authors report no conflicts of interest in this work.
References
Global Initiative for Chronic Obstructive Lung Disease. Global strategy for the diagnosis, management, and prevention of chronic obstructive lung disease. Available from: http://www.goldcopd.org. Accessed February 26, 2016. | ||
Vestbo J, Hurd SS, Rodriguez-Roisin R. The 2011 revision of the global strategy for the diagnosis, management and prevention of COPD (GOLD) – why and what? Clin Respir J. 2012;6(4):208–214. | ||
Minai OA, Chaouat A, Adnot S. Pulmonary hypertension in COPD: epidemiology, significance, and management: pulmonary vascular disease: the global perspective. Chest. 2010;137(6 Suppl):39S–51S. | ||
Hurdman J, Condliffe R, Elliot CA, et al. Pulmonary hypertension in COPD: results from the ASPIRE registry. Eur Respir J. 2013;41(6):1292–1301. | ||
McGoon M, Gutterman D, Steen V, et al. Screening, early detection, and diagnosis of pulmonary arterial hypertension: ACCP evidence-based clinical practice guidelines. Chest. 2004;126(1 Suppl):14S–34S. | ||
Nakano Y, Muro S, Sakai H, et al. Computed tomographic measurements of airway dimensions and emphysema in smokers. Correlation with lung function. Am J Respir Crit Care Med. 2000;162(3 Pt 1): 1102–1108. | ||
Tanabe N, Muro S, Hirai T, et al. Impact of exacerbations on emphysema progression in chronic obstructive pulmonary disease. Am J Respir Crit Care Med. 2011;183(12):1653–1659. | ||
Haruna A, Muro S, Nakano Y, et al. CT scan findings of emphysema predict mortality in COPD. Chest. 2010;138(3):635–640. | ||
Han MK, Kazerooni EA, Lynch DA, et al. Chronic obstructive pulmonary disease exacerbations in the COPDGene study: associated radiologic phenotypes. Radiology. 2011;261(1):274–282. | ||
Matsuoka S, Washko GR, Dransfield MT, et al. Quantitative CT measurement of cross-sectional area of small pulmonary vessel in COPD: correlations with emphysema and airflow limitation. Acad Radiol. 2010;17(1):93–99. | ||
Matsuoka S, Washko GR, Yamashiro T, et al. Pulmonary hypertension and computed tomography measurement of small pulmonary vessels in severe emphysema. Am J Respir Crit Care Med. 2010;181(3):218–225. | ||
Ando K, Kuraishi H, Nagaoka T, et al. Potential role of CT metrics in chronic obstructive pulmonary disease with pulmonary hypertension. Lung. 2015;193(6):911–918. | ||
Matsuura Y, Kawata N, Yanagawa N, et al. Quantitative assessment of cross-sectional area of small pulmonary vessels in patients with COPD using inspiratory and expiratory MDCT. Eur J Radiol. 2013;82(10):1804–1810. | ||
Hassoun PM, Mouthon L, Barbera JA, et al. Inflammation, growth factors, and pulmonary vascular remodeling. J Am Coll Cardiol. 2009;54(1 Suppl):S10–S19. | ||
Jeffery PK. Remodeling and inflammation of bronchi in asthma and chronic obstructive pulmonary disease. Proc Am Thorac Soc. 2004;1(3):176–183. | ||
Miravitlles M, Guerrero T, Mayordomo C, Sanchez-Agudo L, Nicolau F, Segu JL. Factors associated with increased risk of exacerbation and hospital admission in a cohort of ambulatory COPD patients: a multiple logistic regression analysis. The EOLO Study Group. Respiration. 2000;67(5):495–501. | ||
Hurst JR, Vestbo J, Anzueto A, et al. Susceptibility to exacerbation in chronic obstructive pulmonary disease. N Engl J Med. 2010;363(12):1128–1138. | ||
Rodriguez-Roisin R. Toward a consensus definition for COPD exacerbations. Chest. 2000;117(5 Suppl 2):398S–401S. | ||
Decramer M, Janssens W. Chronic obstructive pulmonary disease and comorbidities. Lancet Respir Med. 2013;1(1):73–83. | ||
Hoffman EA, Simon BA, McLennan G. State of the Art. A structural and functional assessment of the lung via multidetector-row computed tomography: phenotyping chronic obstructive pulmonary disease. Proc Am Thorac Soc. 2006;3(6):519–532. | ||
Fine J, Gray R. A proportional hazards model for the subdistribution of a competing risk. J Am Stat Assoc. 1999;94(446):496–509. | ||
Kanda Y. Investigation of the freely available easy-to-use software “EZR” for medical statistics. Bone Marrow Transplant. 2013;48(3):452–458. | ||
Peduzzi P, Concato J, Kemper E, Holford TR, Feinstein AR. A simulation study of the number of events per variable in logistic regression analysis. J Clin Epidemiol. 1996;49(12):1373–1379. | ||
Kessler R, Faller M, Fourgaut G, Mennecier B, Weitzenblum E. Predictive factors of hospitalization for acute exacerbation in a series of 64 patients with chronic obstructive pulmonary disease. Am J Respir Crit Care Med. 1999;159(1):158–164. | ||
Cordasco EM, Beerel FR, Vance JW, Wende RW, Toffolo RR. Newer aspects of the pulmonary vasculature in chronic lung disease. A comparative study. Angiology. 1968;19(7):399–407. | ||
Peinado VI, Barbera JA, Abate P, et al. Inflammatory reaction in pulmonary muscular arteries of patients with mild chronic obstructive pulmonary disease. Am J Respir Crit Care Med. 1999;159(5 Pt 1):1605–1611. | ||
Van Pottelberge GR, Bracke KR, Pauwels NS, Vermassen FE, Joos GF, Brusselle GG. COPD is associated with reduced pulmonary interstitial expression of pentraxin-3. Eur Respir J. 2012;39(4):830–838. | ||
Santos S, Peinado VI, Ramirez J, et al. Characterization of pulmonary vascular remodelling in smokers and patients with mild COPD. Eur Respir J. 2002;19(4):632–638. | ||
Hueper K, Vogel-Claussen J, Parikh MA, et al. Pulmonary microvascular blood flow in mild chronic obstructive pulmonary disease and emphysema. The MESA COPD Study. Am J Respir Crit Care Med. 2015;192(5):570–580. | ||
Estepar RS, Kinney GL, Black-Shinn JL, et al. Computed tomographic measures of pulmonary vascular morphology in smokers and their clinical implications. Am J Respir Crit Care Med. 2013;188(2):231–239. | ||
Wells JM, Iyer AS, Rahaghi FN, et al. Pulmonary artery enlargement is associated with right ventricular dysfunction and loss of blood volume in small pulmonary vessels in chronic obstructive pulmonary disease. Circ Cardiovasc Imaging. 2015;8(4):pii: e002546. | ||
Hale KA, Niewoehner DE, Cosio MG. Morphologic changes in the muscular pulmonary arteries: relationship to cigarette smoking, airway disease, and emphysema. Am Rev Respir Dis. 1980;122(2):273–278. | ||
Peinado VI, Pizarro S, Barbera JA. Pulmonary vascular involvement in COPD. Chest. 2008;134(4):808–814. | ||
Barr RG, Mesia-Vela S, Austin JH, et al. Impaired flow-mediated dilation is associated with low pulmonary function and emphysema in ex-smokers: the Emphysema and Cancer Action Project (EMCAP) Study. Am J Respir Crit Care Med. 2007;176(12):1200–1207. | ||
Santos S, Peinado VI, Ramirez J, et al. Enhanced expression of vascular endothelial growth factor in pulmonary arteries of smokers and patients with moderate chronic obstructive pulmonary disease. Am J Respir Crit Care Med. 2003;167(9):1250–1256. | ||
Chandra D, Gupta A, Strollo PJ Jr, et al. Airflow limitation and endothelial dysfunction: unrelated and independent predictors of atherosclerosis. Am J Respir Crit Care Med. Epub January 15, 2016. | ||
Schachinger V, Britten MB, Zeiher AM. Prognostic impact of coronary vasodilator dysfunction on adverse long-term outcome of coronary heart disease. Circulation. 2000;101(16):1899–1906. | ||
Heitzer T, Schlinzig T, Krohn K, Meinertz T, Munzel T. Endothelial dysfunction, oxidative stress, and risk of cardiovascular events in patients with coronary artery disease. Circulation. 2001;104(22): 2673–2678. | ||
Matsuoka S, Yamashiro T, Diaz A, et al. The relationship between small pulmonary vascular alteration and aortic atherosclerosis in chronic obstructive pulmonary disease: quantitative CT analysis. Acad Radiol. 2011;18(1):40–46. | ||
Peinado VI, Barbera JA, Ramirez J, et al. Endothelial dysfunction in pulmonary arteries of patients with mild COPD. Am J Physiol. 1998;274(6 Pt 1):L908–L913. |
Supplementary materials
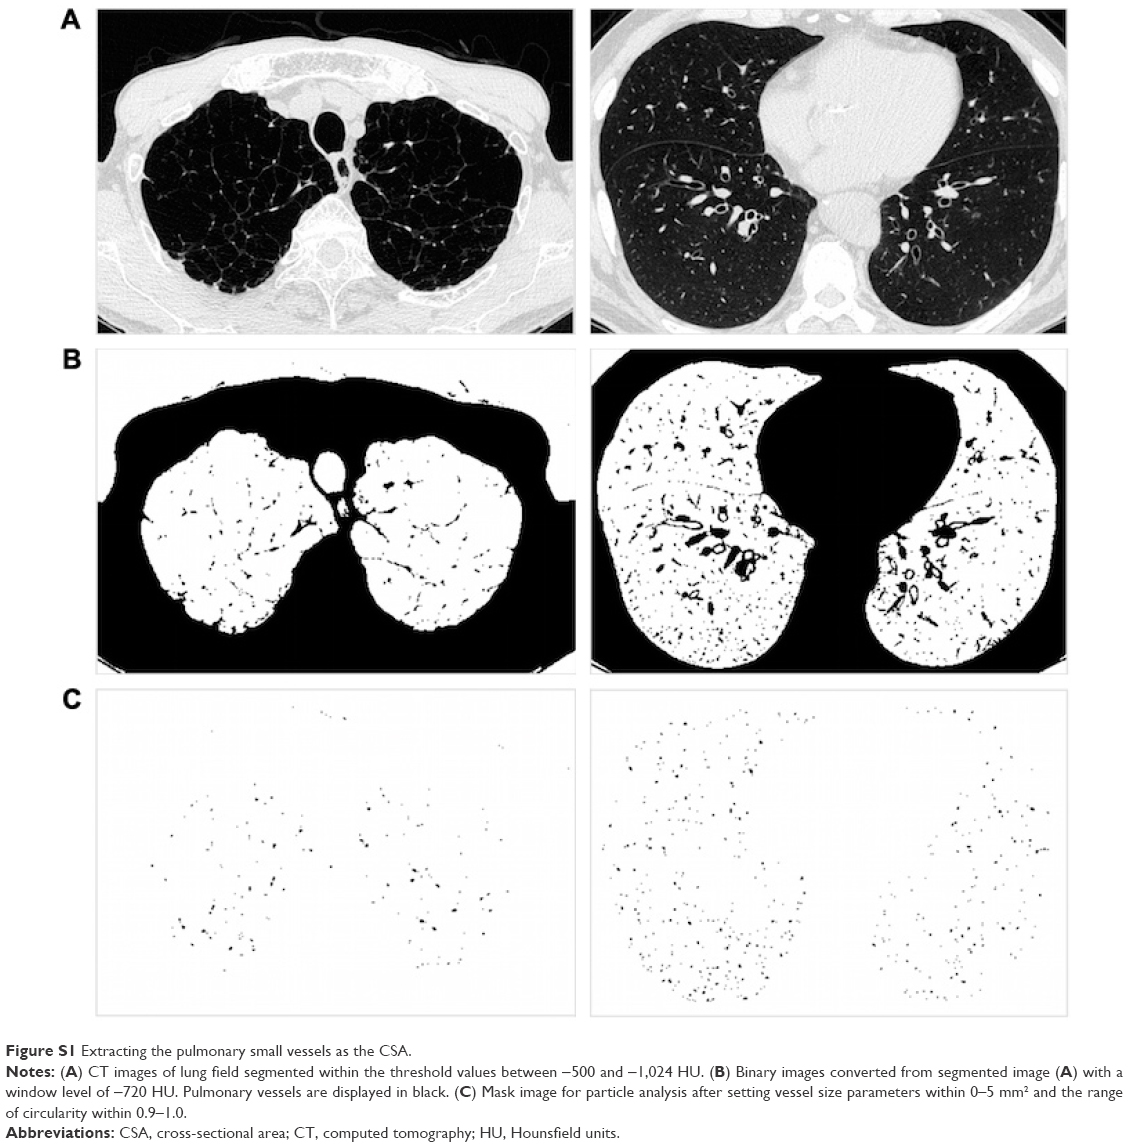 | Figure S1 Extracting the pulmonary small vessels as the CSA. |
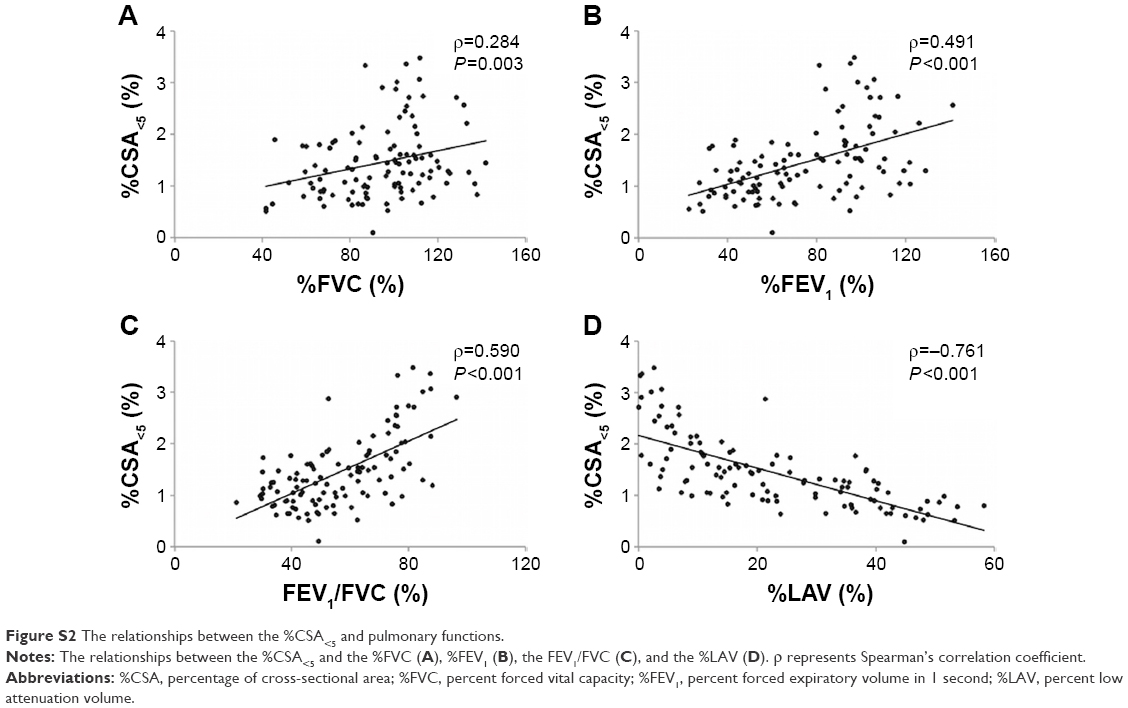 | Figure S2 The relationships between the %CSA<5 and pulmonary functions. |
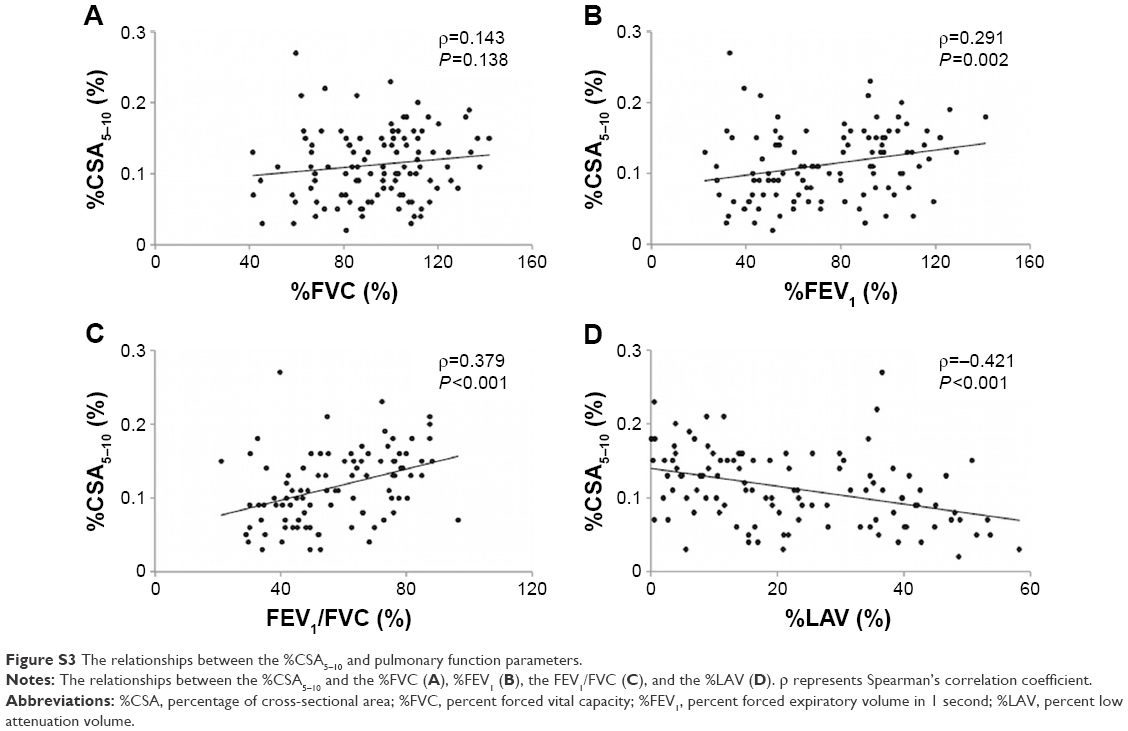 | Figure S3 The relationships between the %CSA5–10 and pulmonary function parameters. |
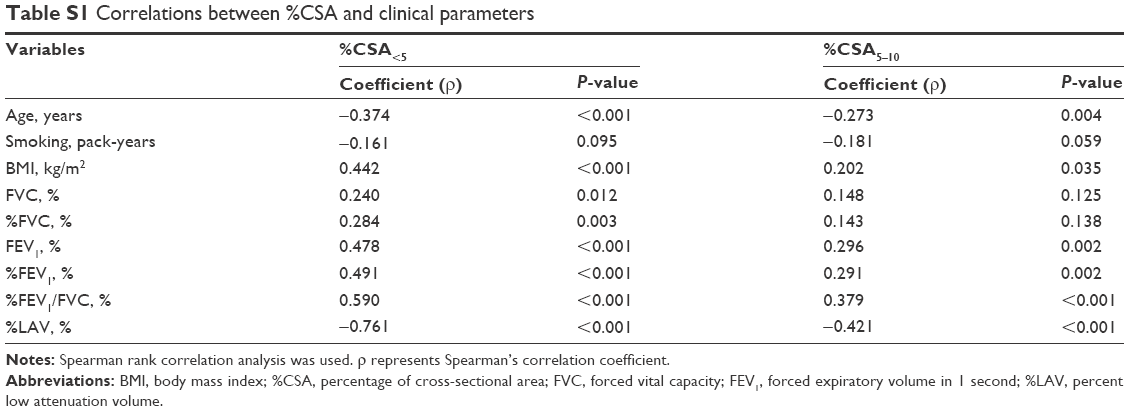 | Table S1 Correlations between %CSA and clinical parameters |
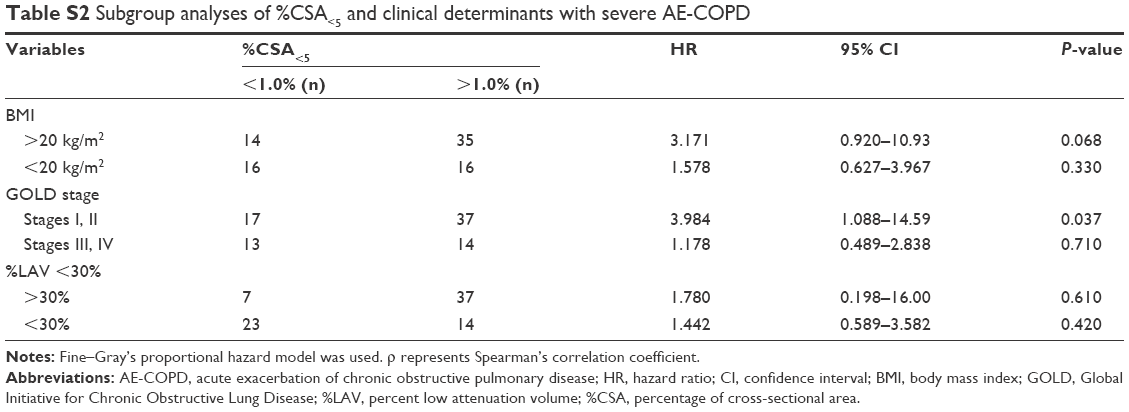 | Table S2 Subgroup analyses of %CSA<5 and clinical determinants with severe AE-COPD |
 © 2016 The Author(s). This work is published and licensed by Dove Medical Press Limited. The full terms of this license are available at https://www.dovepress.com/terms.php and incorporate the Creative Commons Attribution - Non Commercial (unported, v3.0) License.
By accessing the work you hereby accept the Terms. Non-commercial uses of the work are permitted without any further permission from Dove Medical Press Limited, provided the work is properly attributed. For permission for commercial use of this work, please see paragraphs 4.2 and 5 of our Terms.
© 2016 The Author(s). This work is published and licensed by Dove Medical Press Limited. The full terms of this license are available at https://www.dovepress.com/terms.php and incorporate the Creative Commons Attribution - Non Commercial (unported, v3.0) License.
By accessing the work you hereby accept the Terms. Non-commercial uses of the work are permitted without any further permission from Dove Medical Press Limited, provided the work is properly attributed. For permission for commercial use of this work, please see paragraphs 4.2 and 5 of our Terms.