")
Back to Journals » OncoTargets and Therapy » Volume 13
MORC4 Promotes Chemoresistance of Luminal A/B Breast Cancer via STAT3-Mediated MID2 Upregulation
Authors Luo J , Zeng S, Tian C
Received 29 April 2020
Accepted for publication 1 July 2020
Published 12 July 2020 Volume 2020:13 Pages 6795—6803
DOI https://doi.org/10.2147/OTT.S260509
Checked for plagiarism Yes
Review by Single anonymous peer review
Peer reviewer comments 2
Editor who approved publication: Dr Arseniy Yuzhalin
Jing Luo,1,* Shiyan Zeng,2,* Chao Tian2
1Department of Breast Surgery, Sichuan Academy of Medical Science and Sichuan Provincial People’s Hospital, Chengdu 610072, Sichuan, People’s Republic of China; 2Department of Breast Surgery, Sichuan Cancer Hospital and Institute, Sichuan Cancer Center, School of Medicine, University of Electronic Science and Technology of China, Chengdu 610041, Sichuan, People’s Republic of China
*These authors contributed equally to this work
Correspondence: Chao Tian
Sichuan Cancer Hospital and Institute,Sichuan Cancer Center,School of Medicine, University of Electronic Science and Technology of China, Chengdu 610041, Sichuan, People’s Republic of China
Email [email protected]
Purpose: MORC4 has recently been characterized as a breast cancer-associated anti-apoptotic oncoprotein. In the current study, we explored its downstream regulation in luminal A/B breast tumors.
Materials and Methods: Bioinformatic prediction was performed using data from The Cancer Genome Atlas (TCGA)-breast cancer (BRCA). Cellular and molecular studies were conducted using luminal A/B representative MCF-7 and BT-474 cell lines.
Results: ENST00000355610.8 (encoding MORC4a isoform) was the dominant transcript in breast cancer. ChIP-qPCR and dual-luciferase assay confirmed two STAT3-binding sites in the MID2 promoter in both MCF-7 and BT-474 cells. Co-IP confirmed an interaction between MORC4 and STAT3. ChIP-qPCR data indicated that MORC4 inhibition led to remarkably decreased enrichment of the STAT3-binding MID2 promoter segments. MORC4 overexpression significantly elevated BCL-2 expression in MCF-7 cells and increased their resistance to adriamycin (ADM), 5-fluorouracil (5-FU), and cisplatin (DDP). MID2 inhibition largely abrogated MORC4-induced drug-resistance. However, the drug-resistant phenotype was rescued by overexpressing MID2-MT that was resistant to MID2 siRNA.
Conclusion: This study revealed a novel regulatory mechanism of MORC4 on MID2 expression via STAT3-mediated transcriptional activation. This regulatory axis might confer increased chemoresistance to breast cancer cells.
Keywords: MORC4, STAT3, MID2, chemoresistance, luminal A/B breast cancer
Introduction
Currently, chemotherapy is still the standard therapeutic strategy applied for breast cancer patients with triple-negative, HER2-positive, or advanced luminal tumors when resistance to endocrine therapy occurs.1 The basic mechanism of anti-cancer drugs is to induce apoptosis-related cell death networks to eliminate tumor cells.2 However, activation of anti-apoptotic signalings and subsequent chemoresistance often occur in the ongoing treatment, leading to therapeutic failure and eventually death.3 Therefore, a thorough understanding of the endogenous factors leading to intrinsic or acquired chemoresistance is critical for improving therapeutic outcomes.
MORC family CW-type zinc finger proteins are a highly conserved nuclear protein superfamily constituting of four members (MORC1/2/3/4). These proteins have nuclear matrix binding domains and thus have been considered as putative transcriptional regulation factors.4 Some recent studies observed that they might act as critical regulators during cancer development.4,5 Among the family members, MORC4 upregulation might serve as a biomarker of some diffuse large B‐cell lymphomas.6 The oncogenic effects of MORC4 were also reported in breast cancer. Its overexpression confers malignant phenotypes to breast cancer cells, including increased cell viability, migration, and invasion, as well as decreased apoptosis of multiple breast cancer cell lines.7,8 By upregulating BCL-2 and downregulating BAD expression, MORC4 reduces the apoptosis of breast cancer cells.7,8 Therefore, its dysregulation might be an important contributor to chemoresistance. However, the downstream regulation network of MORC4 in breast cancer is still mysterious.
Midline2 (MID2) is an ubiquitin-conjugating E2 enzyme that is involved in tumor development and has a physical interaction with breast cancer 1, early-onset (BRCA1).9 One previous study found that MID2 is overexpressed in breast cancer and might be a prognostic biomarker.10 MID2 knockdown resulted in decreased proliferation rates of MCF-7 and MDA-MB-231 cells in vitro and in vivo10 In this work, we explored the regulatory network of MORC4 in breast cancer by bioinformatic prediction and following molecular/cellular studies. Our findings suggested that MORC4 could recruit STAT3 to the promoter region of MID2 and drive its expression. Activation of this pathway enhanced the chemoresistance to breast cancer cells.
Materials and Methods
Bioinformatic Analysis Using Data from the Cancer Genome Atlas-Breast Cancer (TCGA-BRCA) and the Genotype-Tissue Expression (GTEx)
Data extraction from TCGA-BRCA and GTEx was as described in our previous study.11
Prediction of Genes Co-Expressed and Proteins Interacted with MORC4
The proteins that might physically interact with MORC4 and genes co-expressed with MORC4 were predicted using GeneMANIA.12
Cell Culture and Treatment
MCF-7 (luminal A representative) and BT-474 (luminal B representative) cell lines were cultured as we previously described.11 Lentiviral MORC4 expression plasmid (MORC4-OE); lentiviral MORC4 expression plasmid with FLAG tag (MORC4-FLAG); lentiviral STAT3 expression plasmid with HA tag (STAT3-HA); lentiviral MID2 shRNA based on a validated inhibiting sequence from Sigma Aldrich (sh-MID2, 5ʹ-CGAGCGAATTGCTTGCCAATT-3ʹ); lentiviral MID2 expression plasmid with silent mutations of shRNA binding sites (MID2-MT-OE); MORC4 siRNAs (#1, 5ʹ-GCTTTGGCTTTACAGATAA-3ʹ; #2, 5ʹ-GCAAGAAACACATGGGTTA-3ʹ and #3, 5ʹ-CCATCCATGTTACCTGCAA-3ʹ), STAT3 siRNAs (#1, 5ʹ-GCAACAGATTGCCTGCATT-3ʹ; #2, 5ʹ-CCCGTCAACAAATTAAGAA-3ʹ and #3, 5ʹ-GGTACAACATGCTGACCAA-3ʹ) were produced by GeneChem Co., Ltd. (Shanghai, China). Empty lentiviral plasmids (Vector), vector carrying scramble shRNA (Sh-NC), and scramble siRNA were used as controls. Recombinant lentiviruses production was described previously.11
For si-RNA transfection, cells were co-transfected using either 20 pmol siRNA and 1 μg of different PGL3 promoter constructs (24-well plate) or 75 pmol siRNA only, using Lipofectamine 3000 (Invitrogen). Adriamycin (ADM), 5-fluorouracil (5-FU), and cisplatin (DDP) were purchased from Sigma-Aldrich (Sigma, MO, USA).
Western Blot Analysis
Conventional Western blot analysis was conducted, as we described previously.11 Primary antibodies used include anti-MORC4 (1:2500, HPA000395, Merck, Darmstadt, Germany); anti-p-STAT3 (pTyr705, 1:1000, SAB4504541, Merck), anti-STAT3 (1:1000, SAB4300327, Merck), anti-BCL-2 (1:1000, ab59348, Abcam, Cambridge, MA, USA), anti-MID2 (1:1000, ab14749, Abcam). Protein band intensities were quantified using ImageJ (National Institutes of Health, Bethesda, MD, USA). The intensity of each band was normalized to the value of β-actin. Each Western blot analysis was repeated in triplicate.
Quantitative RT-PCR (qRT-PCR) Analysis
Total RNA extracted from cells were subjected to reverse transcription and were subjected to qRT-PCR analysis, as we described previously.11 The following primers were used: human MORC4, 5ʹ-TGACCTTTACCGATGATGGATGT-3ʹ (forward) and 5ʹ- CAAAGACCCCAATGGGACACT-3 (reverse); human STAT3, 5ʹ-ATCACGCCTTCTACAGACTGC-3ʹ (forward) and 5ʹ- CATCCTGGAGATTCTCTACCACT-3 (reverse); human MID2, 5ʹ-GGGGGCGTAGCATCATAGTA-3ʹ (forward) and 5ʹ-TGTGAGCTGGCTTCATTGAG-3 (reverse); human ACTB, 5ʹ-CACCATTGGCAATGAGCGGTTC’-3 (forward) and 5ʹ-AGGTCTTTGCGGATGTCCACGT-3ʹ (reverse). Relative gene expression was analyzed and calculated using the 2−ΔΔCT method.
Prediction of STAT3-Binding Site in the Promoter Region of MID2
The promoter sequence of MID2 was acquired from the MID2 promoter clone in GeneCopoeia (ID: HPRM47307). Then, the promoter sequence was scanned using JASPAR (http://jaspar.genereg.net/) to identify potential STAT3-binding sites, by setting the relative profile score threshold to 80%.
Chromatin Immunoprecipitation (ChIP)-qPCR
Chromatin Immunoprecipitation Kit (17–295, Merck Millipore) was used according to the recommended protocol. The lysates were incubated with anti-STAT3 or IgG. Immunoprecipitated DNA was collected using Protein A beads and was purified after phenol extraction and was used for qRT-PCR. Five sets of primers, including two sets covering two STAT3-binding sites and three sets without STAT3-binding sites were designed.
Co-Immunoprecipitation (Co-IP) Assay
The two breast cancer cell lines were co-infected with MORC4-FLAG and STAT3-HA vectors for overexpression. 48 hrs later, cells were lysed for co-IP analysis to detect their physical interaction. Co-IP procedures followed the protocol introduced in our previous study.11
Dual-Luciferase Assay
The promoter region of MID2 and the truncated promoter sequences were cloned in pGL3 basic vector (Promega, Madison, WI, USA). MCF-7 and BT-474 cells were seeded in 24-well plates at a density of 2 × 10⁵ cells per well. 24 hrs later, the cells were then transfected with either 1 μg of empty pGL3 basic vector or the recombinant vectors carrying MID2 promoter fragments, using Lipofectamine 3000 (Invitrogen). 0.05 μg of pRL-CMV vector was co-transfected. Then, cells were further cultured for 48 h. After that, cells were lysed for detecting the activity of firefly luciferase and Renilla luciferase, using a dual-specific luciferase assay kit according to manufacturer’s instruction (#E1910, Promega), with a luminometer (Promega).
Flow Cytometric Analysis
FITC Annexin V Apoptosis Detection Kit (BD Pharmingen, Franklin Lakes, NJ, USA) was used to test the apoptosis rate, following the recommended protocol. 48 hrs after drug treatment, cells were collected, rinsed, resuspended in binding buffer, and stained with Annexin V and PI solution. Then, apoptosis was analyzed by BD FACSCelesta (Becton Dickinson, San Jose, CA).
In vitro Drug Sensitivity Assay
Cell Counting Kit-8 (CCK-8) assay (Dojindo, Kumamoto, Japan) was conducted to assess drug cytotoxicity, following the method introduced in one previous study.13 In brief, MCF-7 cells were seeded into 96-well plates at a density of 3000 cells/well and were incubated for 48 h in 100 μL of medium with different concentrations of anti-cancer drugs. The optical density (OD) at 450 nm was measured. Drug concentration lethal to 50% of the cells (IC50) was calculated. Each treatment was performed in three replicate wells, with three parallel experiments.
Statistical Analysis
Data were reported as mean±SD, with GraphPad Prism 8.1.2 (GraphPad Inc., La Jolla, CA, USA) and SPSS Statistics 25.0 (SPSS Inc., Chicago, IL, USA) used for data analysis. One-way ANOVA with post hoc Tukey’s multiple comparison test and Welch’s unequal variances t-test were performed for multiple- and two-group comparisons, respectively. Kaplan-Meier OS curves were generated to compare the survival differences of patients with the top and bottom quartile of gene expression. The Log-rank test was applied for survival comparison. p<0.05 was considered statistically significant.
Results
Bioinformatic Prediction of the Potential Regulatory Network of MORC4 in Breast Cancer
Alternative transcripts of MORC4 encoding different protein isoforms have been reported.6 Using RNA-seq data from GTEx-normal breast and TCGA-BRCA, we examined the transcription profile of MORC4. Results showed that ENST00000355610.8 (encoding MORC4a isoform) was the dominant transcript in both normal and tumor tissues (Figure 1A). Its expression was significantly upregulated in basal-like, HER2+, luminal A and luminal B tumors compared to normal breast tissues (Figure 1B). To explore the potential functional partners of MORC4, we predicted its co-expressed genes and interacting proteins using GeneMANIA (Figure 1C). The nine predicted co-expressed genes were subjected to validation using RNA-seq in TCGA (Figure 1D). By setting |Pearson’s r|≥0.4 as the cutoff, we found that only MID2 was correlated with ENST00000355610.8 expression. Subgroup analysis showed that MID2 was only upregulated in luminal A/B tumors compared to normal breast (Figure 1E). Correlation analysis confirmed a moderate positive correlation (Person’s r >0.4) in these two subgroups (Figure 1F). STAT3 is a predicted MORC4 interacting protein (Figure 1C). Interestingly, correlation analysis also confirmed a moderate positive correlation between STAT3 and MID2 expression in luminal A/B tumors (Pearson’s r=0.44, Figure 1G). K-M survival analysis confirmed that luminal A/B patients with the top quartile of ENST00000355610.8 or MID2 expression had significantly worse OS compared to the respective bottom quartile group (Figure 1H and I). Previous studies reported that MID2 could promote the proliferation of breast cancer cells both in vitro and in vivo.10 These findings triggered our interest to explore the potential regulation network among MORC4, MID2, and STAT3 in luminal A/B tumor cells.
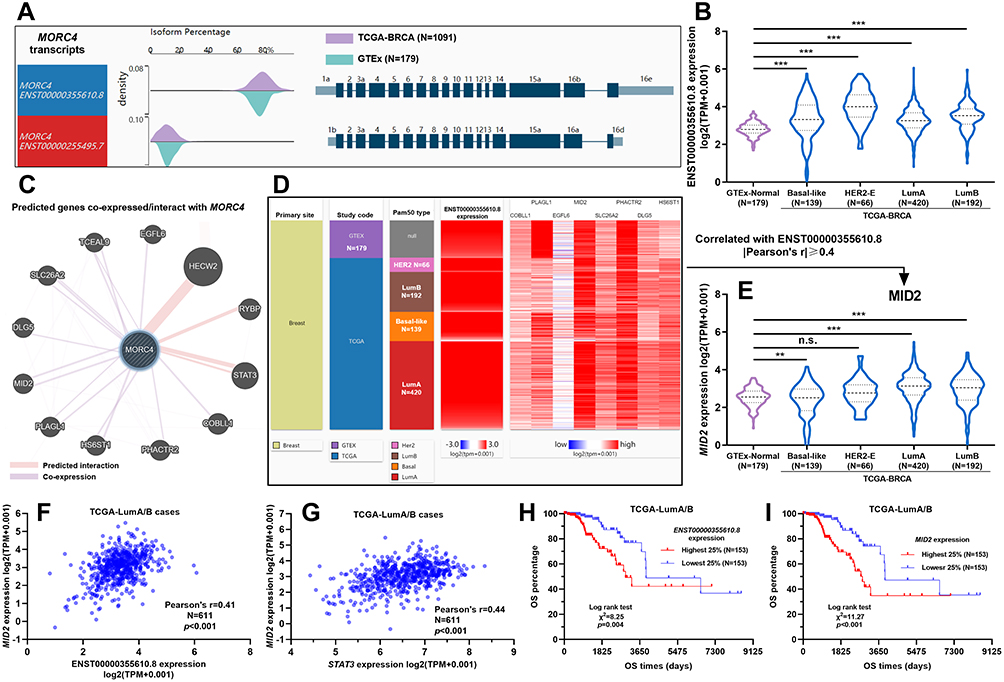 |
Figure 1 Bioinformatic prediction of the potential regulatory network of MORC4 in breast cancer. (A) Comparison of the ratio of two MORC4 transcript isoforms in breast cancer and normal breast tissues, using data from TCGA-BRCA and GTEx-normal breast. (B) Subgroup analysis of ENST00000355610.8 expression in normal breast and basal-like, HER2+, luminal A, and luminal B tumors. (C) Prediction of genes co-expressed/proteins interact with MORC4. (D) Validation of the correlation between 9 predicted co-expressed genes and ENST00000355610.8 expression, using data from TCGA-BRCA. (E) Subgroup analysis of MID2 expression in normal breast and basal-like, HER2+, luminal A, and luminal B tumors. (F and G) A plot chart showing the correlation between ENST00000355610.8 and MID2 (F) and between STAT3 and MID2 (G) expression in luminal A/B tumors. (H and I) K-M survival analysis of OS between luminal A/B patients with the top and bottom quartile of ENST00000355610.8 (H) or MID2 (I) expression. **p<0.01; ***p<0.001. Abbreviation: n.s., not significant. |
MORC4 and STAT3 Positively Regulate MID2 Expression in Luminal A/B Breast Cancer Cells
To explore the potential influence of MORC4 and STAT3 on MID2 expression, the two cell lines were subjected to MORC4 or STAT3 inhibition, respectively (Figure 2A and B). QRT-PCR analysis confirmed that MORC4 or STAT3 inhibition significantly reduced MID2 transcription and translation in both MCF-7 and BT-474 cells (Figure 2C–H). However, there was no mutual regulation between MORC4 and STAT3 in these cell lines (Figure 2E–H).
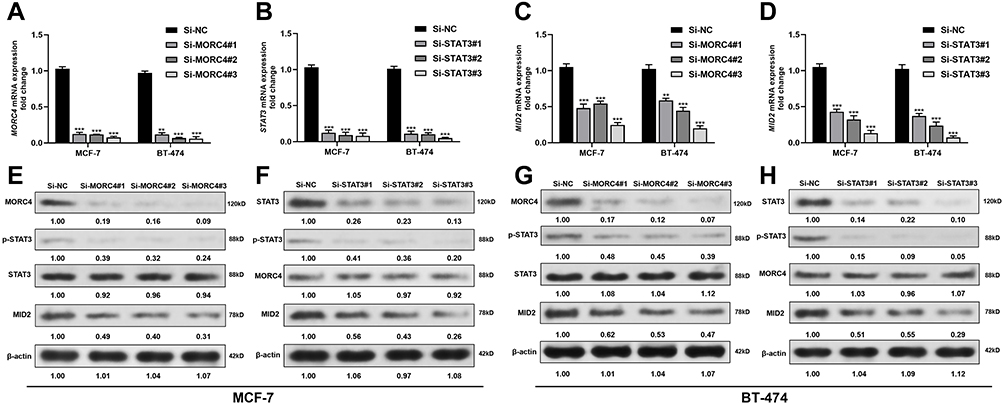 |
Figure 2 MORC4 and STAT3 positively regulates MID2 expression in luminal A/B breast cancer cells. (A–D) QRT-PCR analysis of MORC4 (A), STAT3 (B) and MID2 (C and D) mRNA expression in MCF-7 and BT-474 cells subjected to MORC4 (A and C) or STAT3 (B and D) inhibition. E-H. Western blot analysis of MORC4, p-STAT3, STAT3 and MID2 protein expression in MCF-7 (E and F) and BT-474 (G and H) cells subjected to MORC4 or STAT3 inhibition. **p<0.01; ***p<0.001. Abbreviation: n.s., not significant. |
STAT3 Binds to and Activates MID2 Promoter
By prediction using JASPAR, we found two high potential STAT3-binding sites in the MID2 promoter (Figure 3A). By performing ChIP-qPCR assay, we found that the two predicted regions were enriched upon anti-STAT3 immunoprecipitation in both MCF-7 and BT-474 cells (Figure 3B–D), suggesting that STAT3 might exert regulatory effects on MID2 expression. To validate our hypothesis, different lengths of the 5ʹ flanking region of MID2, including –1461/+179, −1100/+179, and −400/+179 were cloned into the pGL3-basic plasmid and transiently transfected into MCF-7, and BT-474 cells. The luciferase constructs carrying STAT3-binding sites exhibited higher luciferase comparing to the pGL3-basic plasmid (Figure 3E). pGL3-(1461/+179) with two STAT3-binding sites showed the highest luciferase activity, whereas pGL3-(−1100/+179) had a reduced luciferase activity (Figure 3E). These findings suggest STAT3 could activate the MID2 promoter via the two binding sites. To further validate the influence of STAT3 on the MID2 promoter activity, MCF-7 and BT-474 cells were co-transfected with STAT3 siRNA or si-NC and recombinant pGL3 constructs with different MID2 promoter fragments. Results showed that STAT3 inhibition significantly reduced the luciferase activity of pGL3-(1461/+179) and pGL3-(−1100/+179) (Figure 3F and G), but did not change the activity of pGL3-(−400/+179) (Figure 3H).
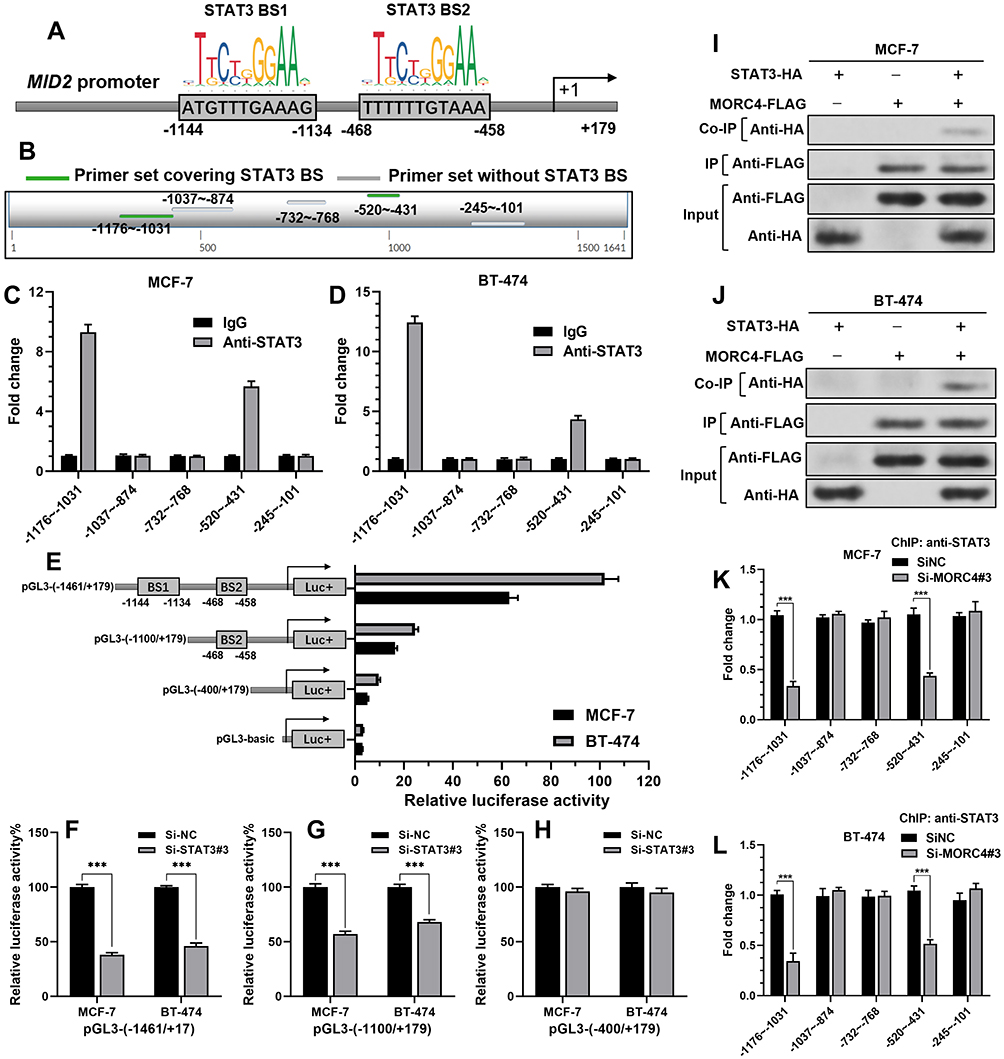 |
Figure 3 MORC4 is required for STAT3-induced MID2 promoter activation and MID2 mRNA expression. (A) Schematic image showing the predicted STAT3-binding sites (BS) in the promoter region of MID2. (B) Schematic image showing the location of the designed primer sets for ChIP-qPCR assay, by anti-STAT3 immunoprecipitation. (C and D) ChIP-qPCR assays were performed using anti-STAT3 and control IgG antibodies in MCF-7 (C) and BT-474 (D) cells. Fold enrichment of the indicated regions of the MID2 promoter was calculated. (E) The promoter activity of the MID2 gene was measured using a dual-luciferase reporter assay. MCF-7 and BT-474 cells were transfected with pGL3-basic or reporter constructs carrying different lengths of the 5ʹ-flanking region of the MID2 promoter as indicated. (F–H) STAT3 depletion reduced the activity of the MID2 promoter. MCF-7 and BT-474 cells were co-transfected with si-STAT3#3 or si-NC and reporter constructs carrying pGL3-(−1461/+179) (F), pGL3-(−1100/+179) (G) and pGL3-(−400/+179). 48 h later, luciferase activity was determined. (I and J) Co-IP assay to investigate the potential binding between MORC4 (with DDDDK tag) and STAT3 (with HA tag) in MCF-7 (I) and BT-474 (J) cells. (K and L) ChIP-qPCR assays were performed using anti-STAT3 in MCF-7 (K) and BT-474 (L) cells with or without MORC4 inhibition. Fold enrichment of the indicated regions of the MID2 promoter was calculated. ***p<0.001. |
MORC4 is Required for STAT3 Binding to MID2 Promoter
To validate the predicted interaction between STAT3 and MORC4, MCF-7 and BT-474 cells were infected for overexpression of STAT3-HA or MORC4-FLAG alone or in combination. Co-IP confirmed an interaction between MORC4 and STAT3 (Figure 3I and J). Then, we investigated whether MORC4 was required for the interaction between STAT3 and MID2 promoter. ChIP-qPCR assays were performed using anti-STAT3 in MCF-7 and BT-474 cells with or without MORC4 inhibition. Results showed that cells with MORC4 inhibition had remarkably decreased enrichment of the STAT3-binding MID2 promoter regions (Figure 3K and L), suggesting an essential role of MORC4 in STAT3 binding to MID2 promoter.
MID2 is a Major Downstream Modulator of MORC4 in Chemoresistance of Breast Cancer
Since both MORC4 and MID2 have well-established roles in regulating cell proliferation, we then tested whether the MORC4-MID2 regulatory axis could regulate the chemoresistance of breast cancer cells. MCF-7 cells were subjected to MORC4 overexpression alone or in combination with MID2 inhibition. MORC4 overexpression significantly increased MID2 expression, and also elevated BCL-2 expression (Figure 4A). MID2 inhibition largely abrogated MORC4-induced BCL-2 upregulation (Figure 4A), which could be rescued by the overexpression of MID2-MT (Figure 4A). To further validate the regulatory effect of the MORC4-MID2 axis on chemoresistance, MCF-7 cells were infected as indicated in Figure 4A and were treated with ADM, 5-FU, and DDP at different concentrations for 48 h. CCK-8 assay showed that MORC4 overexpression dramatically increased the IC50 of ADM, 5-FU, and DDP in MCF-7 cells (Figure 4B–D) and also significantly inhibited drug-induced apoptosis (Figure 4E–G). MID2 inhibition significantly suppressed the MORC4-induced IC50 increase and apoptosis inhibition (Figure 4B–G). However, these phenotypes were rescued by overexpressing MID2-MT (Figure 4B–G).
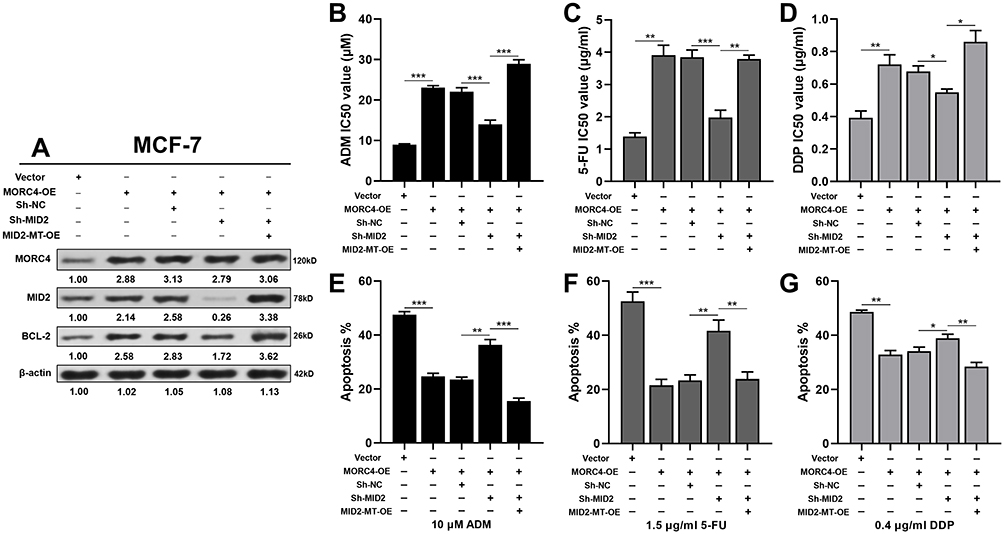 |
Figure 4 MID2 is a major downstream modulator of MORC4 in chemoresistance of breast cancer. (A) Western blot analysis of MORC4, MID2, and BCL-2 expression in MCF-7 cells 48 h after lentivirus-mediated MORC4 overexpression alone, in combination with endogenous MID2 inhibition or in combination with endogenous MID2 inhibition and MID2-MT overexpression. (B–D) Comparison of ADM (B), 5-FU (C) and DDP (D) IC50 value of MCF-7 cells with indicated treatments in Fig. 4A. (E–G) Summary of the ratio of apoptotic MCF-7 cells with indicated treatments in Fig. 4A and after 48 h treatment of 10 μM ADM (E), 1.5 μg/mL 5-FU (F) and 0.4 μg/mL DDP (G). *p<0.05; **p<0.01; ***p<0.001. |
Discussion
Although MORC4 has been demonstrated as an oncogenic protein in breast cancer, the downstream regulatory effect is still poorly understood. Via performing bioinformatic prediction, we found that both MORC4 and STAT3 were positively co-expressed with MID2 in luminal A/B breast tumors. Using MCF-7 and BT-474 cells as luminal A/B representative models, we observed that inhibiting MORC4 or STAT3 could significantly decrease the expression MID2 at both mRNA and protein levels, suggesting a potential modulative effect of MORC4 and STAT3 on MID2 expression.
STAT3 is transiently activated under normal physiological conditions but is frequently overexpressed and activated in breast cancer.14 There is growing evidence showed that STAT3 is one of the critical regulators of tumor-associated signaling pathways in breast cancer. It modulates the transcriptional intensity of a series of genes involved in breast cancer cell proliferation, angiogenesis, epithelial-mesenchymal transition and drug resistance, such as Bcl-X, Survivin, p21CIP1, Cyclin D1, c-Myc, VEGF, Vimentin, TWIST, MMP- and MMP-9.15 Therefore, targeting STAT3 has been considered as a potential therapeutic strategy in breast cancer.16–18 In some cases, STAT3 does not exert regulatory effects alone but acts as a transcription co-activator. For example, STAT3 acts as a PR coactivator and is required for PR binding in Bcl-X, p21CIP1, and c-Myc promoters.18 It also co-opts ErbB-2 nuclear function to induce miR-21 expression, a metastasis-promoting miRNA in breast cancer.14
Using ChIP-qPCR and dual-luciferase assay, we confirmed that STAT3 directly bound to and activated the promoter of MID2, suggesting that MID2 is a novel target gene of STAT3 in luminal A/B breast tumors. The direct physical interaction between MORC4 and STAT3 was also confirmed. Notably, MORC4 was required for STAT3 binding to the MID2 promoter. These findings collectively suggest a MORC4-STAT3-MID2 regulatory pathway in luminal A/B tumors. These three proteins all exert anti-apoptotic properties in breast cancer cells.8,10,19 Thus, this pathway was supposed to have an essential role in regulating the chemosensitivity of breast cancer cells. IC50 and Annexin V/PI apoptotic assay confirmed that MORC4 could increase the chemoresistance of MCF-7 cells, the effects of which were weakened by MID2 inhibition but were restored by MID2-MT overexpression. Although adjuvant endocrine therapy and chemotherapy treatment have been used for patients with a high risk of relapse, both early and late relapses still occur.20 Primary or acquired chemoresistance is a common cause of mortality.21,22 Therefore, it would be meaningful to explore the potential of these proteins as therapeutic targets of luminal A/B breast cancer in the future.
Altogether, this study revealed a novel regulatory mechanism of MORC4 on MID2 expression via STAT3-mediated transcriptional activation. This regulatory axis might confer increased chemoresistance to breast cancer cells.
Disclosure
The authors have no conflict of interest.
References
1. DeMichele A, Yee D, Esserman L. Mechanisms of resistance to neoadjuvant chemotherapy in breast cancer. N Engl J Med. 2017;377(23):2287–2289. doi:10.1056/NEJMcibr1711545
2. Mohammad RM, Muqbil I, Lowe L, et al. Broad targeting of resistance to apoptosis in cancer. Semin Cancer Biol. 2015;35(Suppl):S78–S103. doi:10.1016/j.semcancer.2015.03.001
3. Ji X, Lu Y, Tian H, Meng X, Wei M, Cho WC. Chemoresistance mechanisms of breast cancer and their countermeasures. Biomed Pharmacother. 2019;114:108800. doi:10.1016/j.biopha.2019.108800
4. Hong G, Qiu H, Wang C, et al. The emerging role of MORC family proteins in cancer development and bone homeostasis. J Cell Physiol. 2017;232(5):928–934. doi:10.1002/jcp.25665
5. Ding QS, Zhang L, Wang BC, et al. Aberrant high expression level of MORC2 is a common character in multiple cancers. Hum Pathol. 2018;76:58–67. doi:10.1016/j.humpath.2018.03.011
6. Liggins AP, Cooper CD, Lawrie CH, et al. MORC4, a novel member of the MORC family, is highly expressed in a subset of diffuse large B-cell lymphomas. Br J Haematol. 2007;138(4):479–486. doi:10.1111/j.1365-2141.2007.06680.x
7. Duan X, Guo G, Pei X, et al. Baicalin inhibits cell viability, migration and invasion in breast cancer by regulating miR-338-3p and MORC4. Onco Targets Ther. 2019;12:11183–11193. doi:10.2147/OTT.S217101
8. Yang Z, Zhuang Q, Hu G, Geng S. MORC4 is a novel breast cancer oncogene regulated by miR-193b-3p. J Cell Biochem. 2019;120(3):4634–4643. doi:10.1002/jcb.27751
9. Corominas R, Yang X, Lin GN, et al. Protein interaction network of alternatively spliced isoforms from brain links genetic risk factors for autism. Nat Commun. 2014;5:3650. doi:10.1038/ncomms4650
10. Wang L, Wu J, Yuan J, Zhu X, Wu H, Li M. Midline2 is overexpressed and a prognostic indicator in human breast cancer and promotes breast cancer cell proliferation in vitro and in vivo. Front Med. 2016;10(1):41–51. doi:10.1007/s11684-016-0429-z
11. Tian C, Zeng S, Luo J. MCTS1 directly binds to TWF1 and synergistically modulate Cyclin D1 and C-Myc translation in luminal A/B breast cancer cells. Onco Targets Ther. 2020;13:5353–5361. doi:10.2147/OTT.S255675
12. Warde-Farley D, Donaldson SL, Comes O, et al. The GeneMANIA prediction server: biological network integration for gene prioritization and predicting gene function. Nucleic Acids Res. 2010;38:W214–220. doi:10.1093/nar/gkq537
13. Yang M, Li Y, Shen X, et al. CLDN6 promotes chemoresistance through GSTP1 in human breast cancer. J Exp Clin Cancer Res. 2017;36(1):157. doi:10.1186/s13046-017-0627-9
14. Venturutti L, Romero LV, Urtreger AJ, et al. Stat3 regulates ErbB-2 expression and co-opts ErbB-2 nuclear function to induce miR-21 expression, PDCD4 downregulation and breast cancer metastasis. Oncogene. 2016;35(17):2208–2222. doi:10.1038/onc.2015.281
15. Banerjee K, Resat H. Constitutive activation of STAT3 in breast cancer cells: a review. Int J Cancer. 2016;138(11):2570–2578. doi:10.1002/ijc.29923
16. Liu Z, Ge X, Gu Y, et al. Small molecule STAT3 inhibitor, 6Br-6a suppresses breast cancer growth in vitro and in vivo. Biomed Pharmacother. 2020;121:109502. doi:10.1016/j.biopha.2019.109502
17. Zhou D, Springer MZ, Xu D, et al. Small molecules inhibit STAT3 activation, autophagy, and cancer cell anchorage-independent growth. Bioorg Med Chem. 2017;25(12):2995–3005. doi:10.1016/j.bmc.2017.03.048
18. Proietti CJ, Izzo F, Diaz Flaque MC, et al. Heregulin co-opts PR transcriptional action via Stat3 role as a coregulator to drive cancer growth. Mol Endocrinol. 2015;29(10):1468–1485. doi:10.1210/me.2015-1170
19. Niu J, Xue A, Chi Y, et al. Induction of miRNA-181a by genotoxic treatments promotes chemotherapeutic resistance and metastasis in breast cancer. Oncogene. 2016;35(10):1302–1313. doi:10.1038/onc.2015.189
20. Ignatiadis M, Sotiriou C. Luminal breast cancer: from biology to treatment. Nat Rev Clin Oncol. 2013;10(9):494–506. doi:10.1038/nrclinonc.2013.124
21. Gomez-Miragaya J, Moran S, Calleja-Cervantes ME, et al. The altered transcriptome and DNA methylation profiles of docetaxel resistance in breast cancer PDX models. Mol Cancer Res. 2019;17(10):2063–2076. doi:10.1158/1541-7786.MCR-19-0040
22. Pires BRB, Panis C, Alves VD, et al. Label-free proteomics revealed oxidative stress and inflammation as factors that enhance chemoresistance in luminal breast cancer. Oxid Med Cell Longev. 2019;2019:5357649. doi:10.1155/2019/5357649
 © 2020 The Author(s). This work is published and licensed by Dove Medical Press Limited. The full terms of this license are available at https://www.dovepress.com/terms.php and incorporate the Creative Commons Attribution - Non Commercial (unported, v3.0) License.
By accessing the work you hereby accept the Terms. Non-commercial uses of the work are permitted without any further permission from Dove Medical Press Limited, provided the work is properly attributed. For permission for commercial use of this work, please see paragraphs 4.2 and 5 of our Terms.
© 2020 The Author(s). This work is published and licensed by Dove Medical Press Limited. The full terms of this license are available at https://www.dovepress.com/terms.php and incorporate the Creative Commons Attribution - Non Commercial (unported, v3.0) License.
By accessing the work you hereby accept the Terms. Non-commercial uses of the work are permitted without any further permission from Dove Medical Press Limited, provided the work is properly attributed. For permission for commercial use of this work, please see paragraphs 4.2 and 5 of our Terms.