")
Back to Journals » Cancer Management and Research » Volume 10
Monitoring of tumor vascular normalization: the key points from basic research to clinical application
Authors Li W, Quan Y, Li Y, Lu L , Cui M
Received 19 May 2018
Accepted for publication 13 July 2018
Published 3 October 2018 Volume 2018:10 Pages 4163—4172
DOI https://doi.org/10.2147/CMAR.S174712
Checked for plagiarism Yes
Review by Single anonymous peer review
Peer reviewer comments 2
Editor who approved publication: Professor Harikrishna Nakshatri
Wei Li,1 Ying-Yao Quan,2 Yong Li,3 Ligong Lu,3 Min Cui1
1Department of General Surgery, Zhuhai People’s Hospital, Jinan University, Zhuhai, Guangdong, People’s Republic of China; 2Department of Precision Medical Center, Zhuhai People’s Hospital, Jinan University, Zhuhai, Guangdong, People’s Republic of China; 3Department of Intervention, Zhuhai People’s Hospital, Jinan University, Zhuhai, Guangdong, People’s Republic of China
Abstract: Tumor vascular normalization alleviates hypoxia in the tumor microenvironment, reduces the degree of malignancy, and increases the efficacy of traditional therapy. However, the time window for vascular normalization is narrow; therefore, how to determine the initial and final points of the time window accurately is a key factor in combination therapy. At present, the gold standard for detecting the normalization of tumor blood vessels is histological staining, including tumor perfusion, microvessel density (MVD), vascular morphology, and permeability. However, this detection method is almost unrepeatable in the same individual and does not dynamically monitor the trend of the time window; therefore, finding a relatively simple and specific monitoring index has important clinical significance. Imaging has long been used to assess changes in tumor blood vessels and tumor changes caused by the oxygen environment in clinical practice; some preclinical and clinical research studies demonstrate the feasibility to assess vascular changes, and some new methods were in preclinical research. In this review, we update the most recent insights of evaluating tumor vascular normalization.
Keywords: angiogenesis, vascular normalization, time window
Background
The growth of solid tumors is closely related to active recruitment of blood vessel network – the so-called tumor angiogenesis. The tumor cells away from vessels experience hypoxia due to deficiency of blood and oxygen when the tumor is larger than 1–2 mm; as a result, tumor cells initiate the process of angiogenesis by generating excessive pro-angiogenic factors as an adaptive adjustment.1,2 Various molecules and genes have been identified to play a critical role in angiogenesis;3,4 under these circumstances, the equilibrium between angiogenic promoters and angiogenic inhibitors tilts in favor of the pro-angiogenic factors,3–6 which breaks the existing vascular silence and elicits the angiogenesis of tumor vessels.7,8 Professor Judah Folkman first proposed the theory of tumor angiogenesis in 1971,1,5 and a new therapy method that aimed to starve tumors by blocking their blood vessels was established. The first clinical trial of anti-angiogenesis was of interferon alpha for life-threatening hemangioma,9 and the first anti-angiogenesis agent approved for clinical use is bevacizumab, which is used for treating colon cancer, lung cancer, kidney cancer, and brain cancer. However, some clinical trials showed that the efficacy of anti-angiogenesis monotherapy is limited,10–12 and antivascular endothelial growth factor (anti-VEGF) therapy cannot produce sustained shrinkage in certain tumors, such as colorectal and breast cancer tumors.13 It is noteworthy that the combination of anti-angiogenesis therapy with systemic chemotherapy has often proven to be an effective strategy, with outcomes better than those of chemotherapy alone,13–19 which means that anti-angiogenesis in some way enhances the activity of cytotoxins. Why is this happening?
In response, Jain et al7,20,21 proposed the “normalization of tumor blood vessels” hypothesis in 2001. In tumors, uncontrolled angiogenesis is associated with damage of the tumor vascular maturation process, leading to a heterogenous structure with tortuous, dilated, increased endothelial cell gap, and scarcity of pericyte coverage.22,23 These structural abnormalities contribute to dysfunction in tumor vessels, characterized by hypoperfusion, hyperpermeability, increased interstitial fluid pressure, and severe hypoxia.7,22,24 As a result, blood supply deficiency and interstitial hypertension impede the delivery of cytotoxic agents to solid tumors,4,22,25 and hypoxia favors tumor progression and acquired resistance both in radiotherapy and chemotherapy.26–28 The hypothesis of tumor vascular normalization posits that judicious use of anti-angiogenic therapy restores the abnormal structure and function of the tumor vasculature toward a more normal state22 and tumor blood flow (BF) and oxygenation transiently increase, thus providing an opportunity to improve radiotherapy, chemotherapy, and immunotherapy13,21,25–30 (Figure 1).
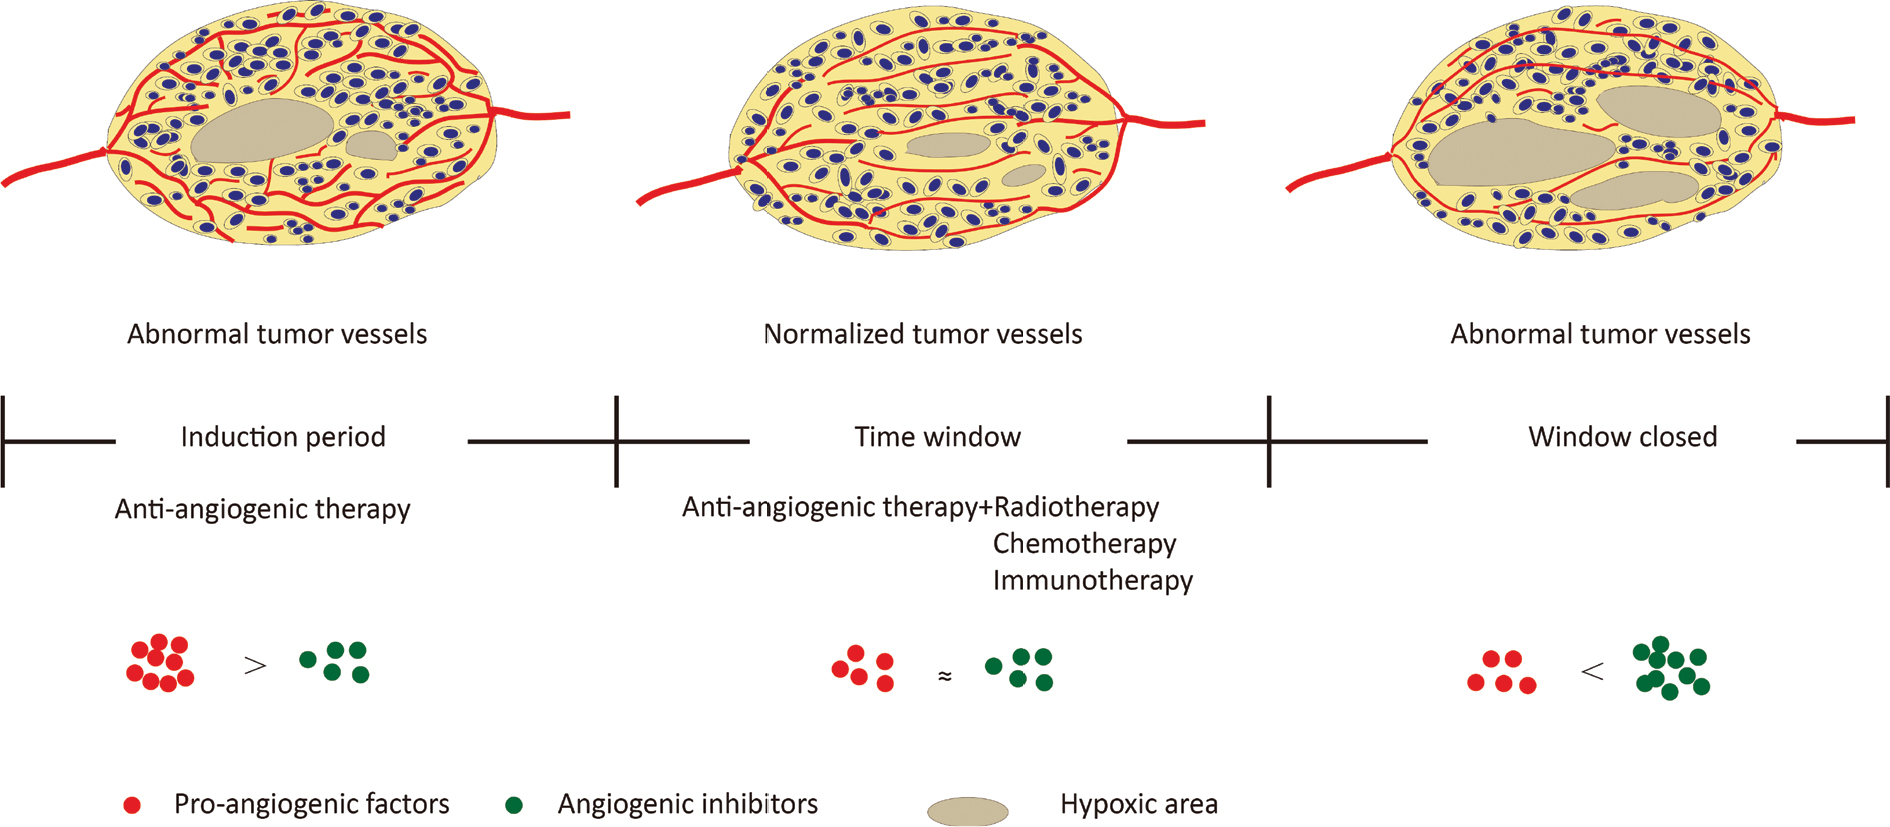 | Figure 1 Proangiogenic factors and angiogenic inhibitors tend to be in a state of equilibrium after moderate anti-angiogenesis therapy, forming a tumor vascular normalization time window; vascular structure and function are normalized, resulting in a remission of hypoxia, and increase radiotherapy, chemotherapy, and immunotherapy efficacy. |
However, limitations exist in the clinical application of tumor vascular normalization – one of which is how to detect the time window simply and repeatedly. Tumor vascular normalization manifested as reduced blood vessel density, more regular vascular distribution, integrated pericyte coverage, and increased tumor perfusion. All these changes can be determined by histological detection. Vascular endothelial cells can be marked by CD 31 and CD 34,14,15,25,31 and markers for tumor pericytes include NG2, PDGFR-β, and α-SMA,15,25,30 which are readily detected in pericytes in tumor angiogenesis. Tumor perfusion was determined by intravenous injection of fluorescein-labeled lectin or Evans blue,26 and vascular permeability was measured by fluorescein-labeled dextran.15 However, the above-mentioned methods are difficult to carry out in the clinic because it is almost unrepeatable in the same individual; thus, it is difficult to dynamically monitor the process of tumor vascular normalization, which limits the ability of guiding traditional therapy. Therefore, establishing a more convenient and repeatable detection method of vascular normalization is of great significance. In this review, we summarized the novel insights of detecting tumor vascular normalization from studies and discussed the questions that must be faced in the clinic (Table 1).
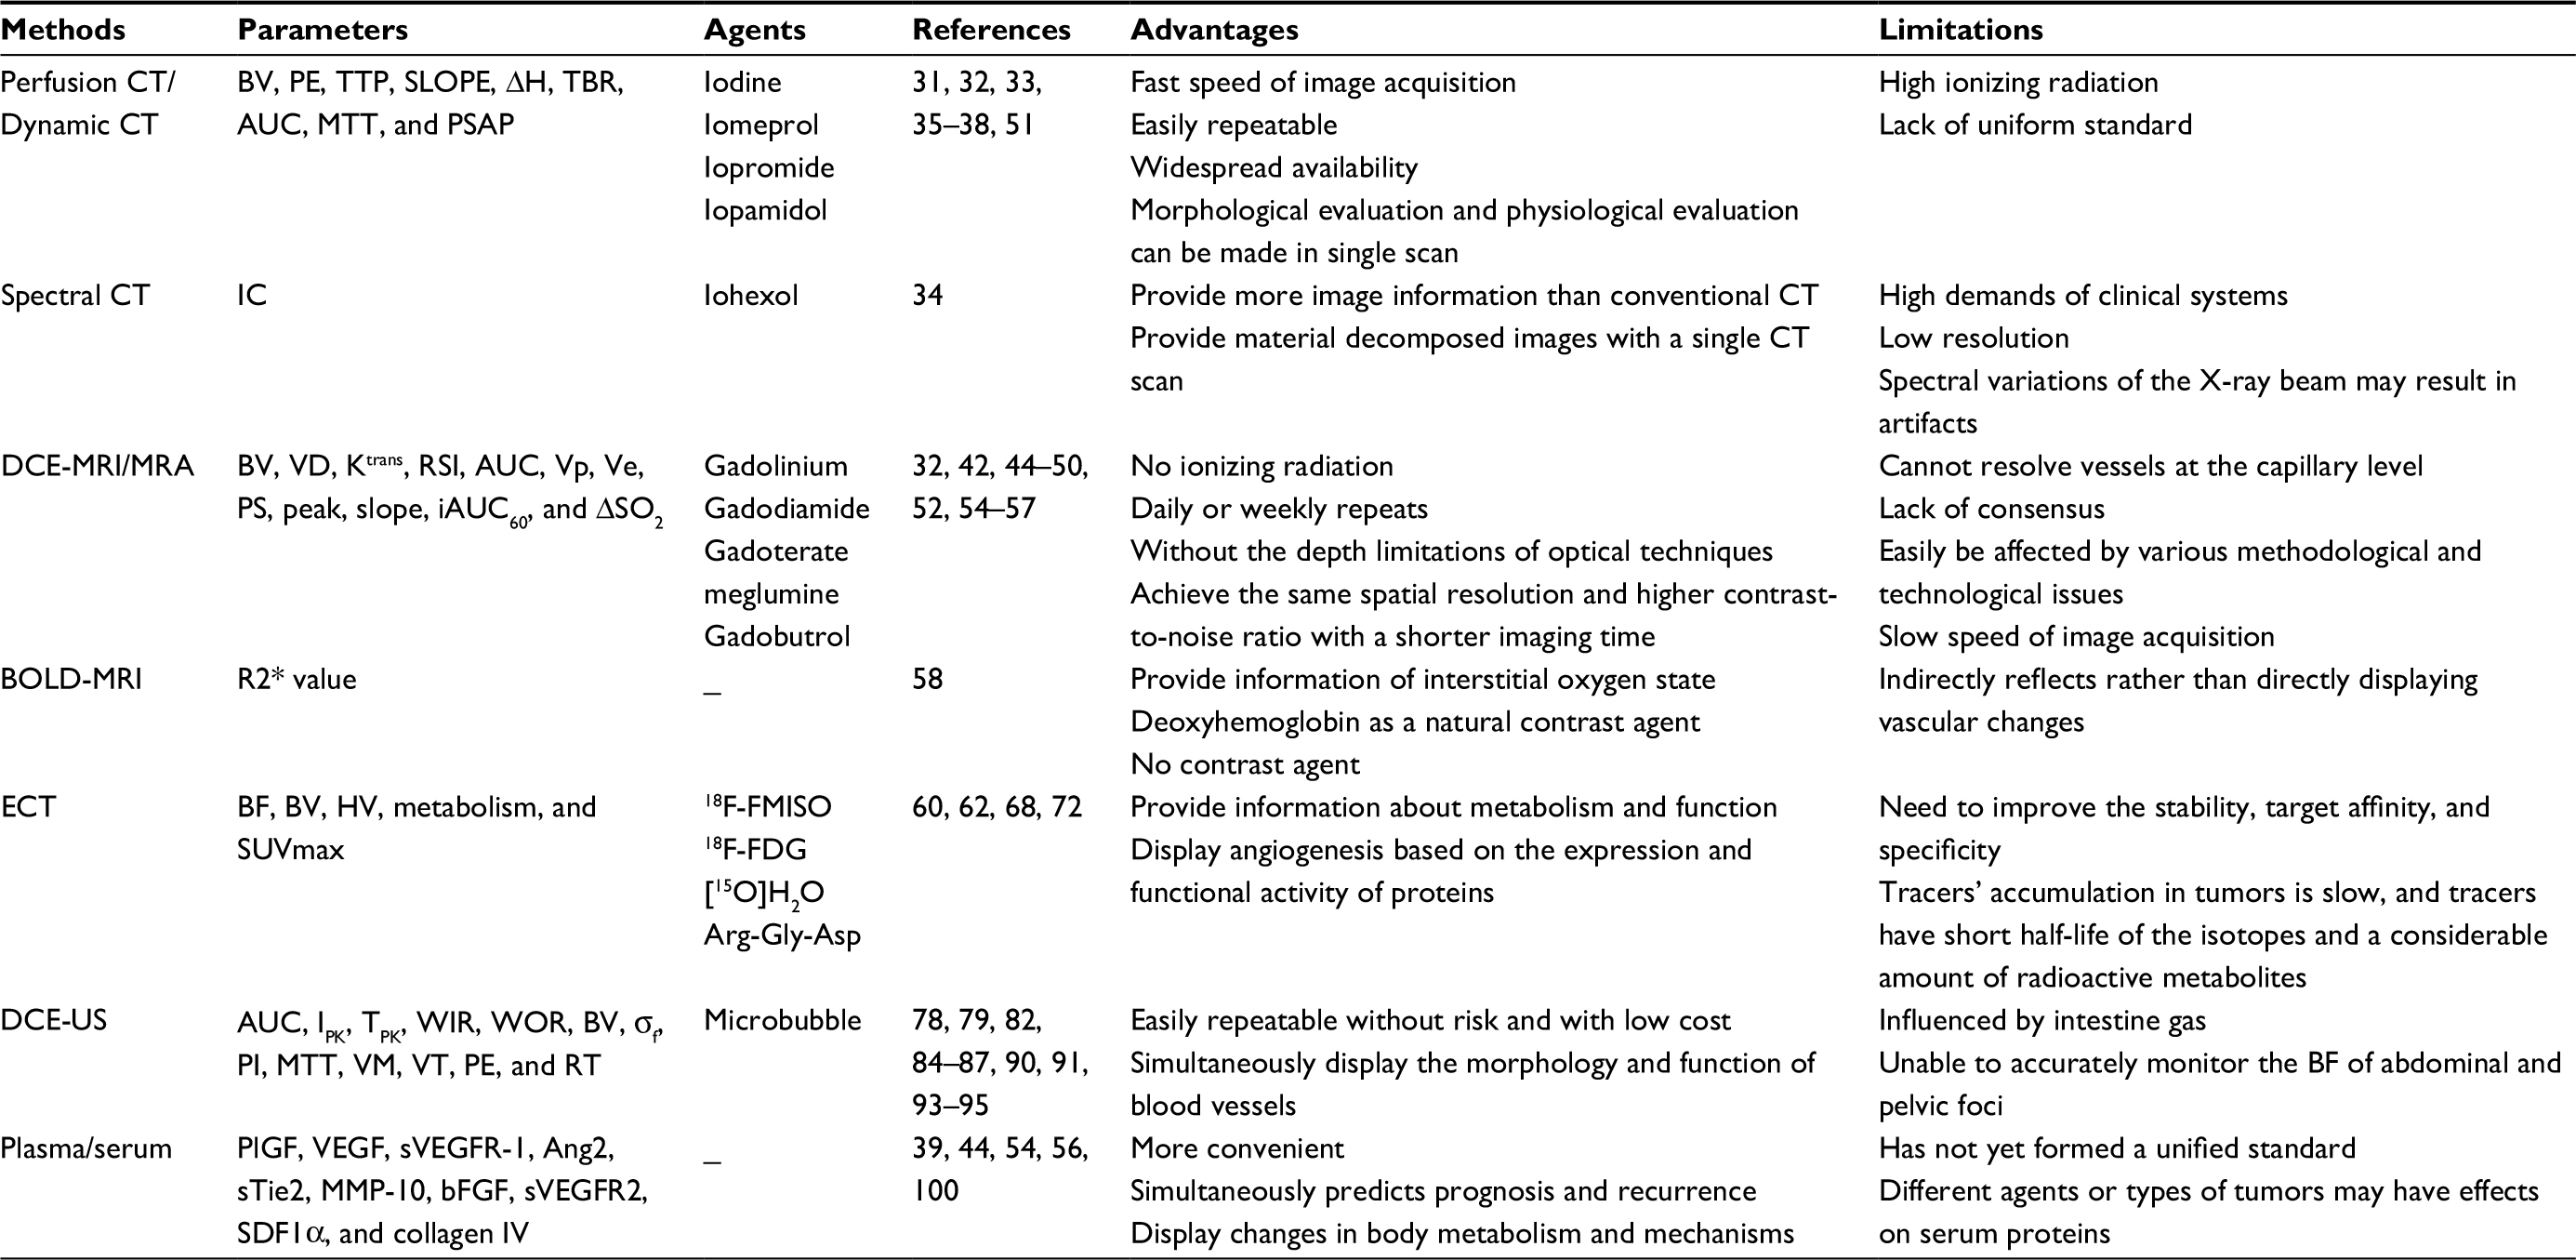 | Table 1 Summary of techniques with the advantages and limitations Notes: σf, shape parameter; ∆H, density difference before and after tissue enhancement; iAUC60, initial area under the curve for 60 seconds after injection; IPK, peak intensity; Ktrans, volume transfer constant between extracellular extravascular space and blood plasma; PS, vascular permeability; R2* value, transverse relaxation rate of water; ΔSO2, oxygen saturation levels and tissue oxygen consumption before and after treatment; SLOPE, slope of the time–density curve; SUVmax, standardized uptake values; TPK, time-to-peak intensity; Ve, fractional extravascular volume; and Vp, fractional plasma volume. Abbreviations: AUC, area under the contrast enhancement curve; BF, blood flow; BOLD-MRI, blood oxygenation level-dependent MRI; BV, blood volume; DCE-MRI, dynamic contrast-enhanced magnetic resonance imaging; DCE-US, dynamic contrast-enhanced ultrasonography; ECT, emission computed tomography; HV, hypoxic volume; IC, iodine concentration; MRA, magnetic resonance angiography; MTT, mean transit time; PE, peak enhancement; PI, peak intensity; PSAP, permeability surface-area product; ROI, region of interest; RSI, relative signal intensity; RT, retention time; soluble vascular endothelial growth factor receptor 2; TBR, tissue–blood ratio; TTP, time to peak enhancement; VD, vessel diameter; VM, vascular morphologic; VT, vascular tortuous; WIR, wash-in rate; WOR, wash-out rate. |
Computed tomography (CT)
Tumor vascular normalization is often manifested as changes in the vascular network architecture and perfusion. CT can visualize the vascular density, bifurcation, perfusion, and oxygen content of a tumor. CT for detecting tumor vessels has been proposed as early as the tumor vascular normalization proposed.20 CT perfusion imaging is used to obtain the time–density curve of the region of interest (ROI) through a continuous scan after the contrast medium of bolus injection, and the hemodynamic parameters are calculated by software using mathematical models. Perfusion CT parameters of blood volume (BV), which may be related to vascular normalization, were positively correlated with microvessel density (MVD) in gastric adenocarcinoma.32 BV and peak enhancement index (PEI) were positively correlated with MVD in lung tumor measured by pathology and CT.31 Iodine concentration (IC) was widely used in clinical diagnosis of vascular imaging and various diseases; quantitative IC value detected by spectral CT correlated with the MVD and reflected angiogenesis in advanced gastric cancer.33
With the development of functional imaging, tumor vessel assessment by contrast-enhanced CT makes the detection more comprehensive; the contrast agent provides indirect evidence for morphological and hemodynamic indices and extravasation in different tumor regions.7,34 Studies have revealed that the peak enhancement (PE) of the tumor and the enhancement ratio measured by dynamic multidetector CT correlate positively with the extent of angiogenesis, and dynamic-enhanced CT images may reflect the heterogeneity of tumor angiogenesis in view of the correlation between enhancement parameters and MVD.35–37 BV and permeability surface-area product (PSAP, measures of capillary leakage and functional vascular density) other than BF and transit time evaluated by multidetector CT correlated positively with MVD; however, there was no significant correlation between the imaging vascular parameters and the histological parameters pericyte coverage, vascular endothelial growth factor (VEGF) expression, and GLUT-1 expression.38
An open-label Phase II study evaluated dynamic CT-based vascular parameters in patients with advanced non-small-cell lung cancer, and results showed that BF, BV, and permeability-surface area were significantly decreased after the induction dose of bevacizumab, but the change in mean transit time was more heterogeneous between patients.39 Dynamic contrast-enhanced CT (DCE-CT) is a noninvasive technique to image vascular and interstitial tumor characteristics, which are used to observe tumor neo-angiogenesis and other vascular parameters. Early activity of cetuximab induced changes in tumor vascular, and interstitial characteristics were detected by DCE-CT.40 More research is needed to verify the relationship between vascularization parameters and vascular normalization.
The ability of CT to detect tumor perfusion, vessel morphology, and response to anti-angiogenic therapy has been clinically validated; however, CT perfusion imaging is influenced by many factors, such as scanning solutions, image analysis software, and personal bias; thus, the sensitivity and reliability of perfusion CT need to be verified. At present, the normalization of tumor blood vessels by CT has not been clinically confirmed, and more data are needed to support this.
Magnetic resonance imaging (MRI)
MRI is a versatile tool to noninvasively evaluate changes in tumor angiogenesis over time. MRI can be performed repeatedly to measure morphology and function of the target dynamically in the short term;41 therefore, it is an ideal platform for assessing changes in blood vessels.42 Dynamic contrast-enhanced MRI (DCE-MRI) is a functional imaging, which has been used in clinical trials to assess the role of anti-angiogenic agents.43
The MRI parameter Ktrans is a key factor displaying volume transfer coefficient of the contrast agent between plasma and extravascular space. Ktrans is used for characterizing vascular function and influenced by flow, permeability, or both.44–47 Changes in vascular heterogeneity quantified by Ktrans distribution have been shown in patients with primary rectal cancer and breast cancer.48–50 Tumor blood perfusion, which is another predictor of normalization, can also be detected using DCE-MRI by pharmacokinetic behavior of gadolinium (Gd)-based contrast agents.51 Patients with an increase in tumor perfusion measured by MRI showed significantly higher vascular normalization index (three parameters: Ktrans, microvessel volume, and plasma collagen IV) compared with patients with stable or decreased perfusion.44,45 This result offers direct clinical evidence in support of the hypothesis that vascular normalization benefits outcomes, and the vascular normalization index is a potential indicator for progression-free survival and overall survival.52 Advanced MRI showed that treatment with cediranib increased tumor blood perfusion in some patients with recurrent glioblastoma undergoing VEGF treatment, and these patients survived longer than patients whose tumor blood perfusion did not increase.45 In patients with breast cancer, doxorubicin/cyclophosphamide plus sunitinib induced functional changes in tumor vasculature. The DCE-MRI functional parameters, including Ktrans, Vp (fractional plasma volume), Ve (fractional extravascular volume), and PS (vascular permeability), were significantly increased after one cycle of combined treatment except for perfusion and the increase in Ktrans with good histological response compared with decline subset.53
In another prospective study, physiological MRI showed vascular integrity, and perfusion improved in patients with newly diagnosed glioblastoma who underwent cediranib plus chemoradiation therapy compared with those who underwent conventional chemoradiation alone.54 The relative difference in the oxygen saturation levels – one of the indicators of tumor blood vessel normalization as measured by MRI – was linked with increased perfusion. T1- and T2-weighted MRI with the cerebra BV from the DSC-MRI modality to study tumor perfusion in glioblastoma showing parameter variations predict tumor perfusion normalization.55 An intuitive description of the tumor vascular normalization by MRI in clinical practice demonstrates that relative tumor vascular size decreased in 1 day after cediranib treatment, and it remained decreased at day 28. At day 56, the relative vessel size reversed toward abnormal, suggesting the beginning of the closure of the vascular structural normalization window; at the same time, MRI detected a reduction in vascular permeability (as measured by the transfer constant Ktrans of Gd) at days 1 and 28, and vascular permeability remained decreased until day 112, indicating that vascular function normalized.56 One study determined the appropriate time of chemotherapy administration after bevacizumab therapy in metastatic brain tumors in patients with breast cancer. The result showed reductions in the mean percentage change in MRI parameters peak, slope, iAUC60, and Ktrans at 1 hour and 24 hours, and the reductions in all parameters were significantly higher at 24 hours than at 1 hour, which suggested that the appropriate time frame of vascular normalization of bevacizumab was 24 hours.57
Another hallmark of tumor vascular normalization is the alleviation of hypoxia in tumor tissue, and this change could be detected by MRI. Blood oxygenation level-dependent MRI (BOLD-MRI) is a functional MRI technique using the paramagnetic properties of deoxyhemoglobin, which can be seen as a natural contrast agent to map the local oxygen concentration. R2* values positively correlated with the level of CA IX, and HIF-1α demonstrates BOLD-MRI as a reliable predictor to reflect oxygen content.58,59 Using MRI to accurately monitor the changes in tumor tissue oxygen content can indirectly reflect the changes in vascular function.60
Overall, MRI provides a very comprehensive and versatile platform to analyze the morphology and function of vascular normalization. However, the quality of a DCE-MRI vascular normalized study can easily be affected by various methodological and technological issues, such as treatment schedule, contrast medium, analysis performed, and types of tumors; therefore, further research and a unified standard need to be developed.
Emission computed tomography (ECT)
ECT is a computer imaging method that includes positron emission tomography (PET) and single-photon emission computed tomography (SPECT). PET is a molecular imaging technology that provides information about function and metabolism, including biomolecule metabolism, cell proliferation, receptors, and nerve mediators in vivo.61 This technique is based on the high glucose metabolism in malignancies that have more accumulation of tracers labeled with radionuclides (such as 18F, 15O, and 11C). SPECT is a nuclear medicine tomographic imaging technique that uses gamma rays; it can be freely reformatted or manipulate images as required to provide true three-dimensional (3D) information.
PET with [15O]H2O/[18F] fluorodeoxyglucose (FDG) was used to analyze tumor BF and metabolism response to different doses of endostatin in clinical practice and display a biphasic concentration–BF curve.62 Using [15O]H2O/[18F]FLT PET imaging demonstrated that transient antiangiogenic treatment improves tumor BF corresponding to a transient tumor vessel normalization time window, which improved delivery of erlotinib into the tumor.63 Perfusion and metabolism changes after anti-angiogenesis treatment can be detected by dynamic [18F]-FDG PET, and the time frame of potential tumor vasculature renormalization was monitored to allow optimal timing of follow-up treatment.64 In preclinical studies, 18F-fluoromisonidazole (18F-FMISO) accumulation levels in renal cell carcinoma were significantly increased compared with the control group after sorafenib treatments, and this increase was dose-dependent, which is consistent with decreasing microvessels.65
Like BOLD-MRI, 18F-FMISO PET provides information of changes in interstitial oxygen state, a surrogate parameter of vascular normalization, and might help track the normalization time window.7,60,66–70 In addition, PET has the potential to display angiogenesis on a molecular level based on the expression and functional activity of proteins.71 One study used PET and 68Ga-NODAGA-c(RGDfK) imaging αvβ3 integrin – one of the most extensively examined targets of angiogenesis – to monitor tumor angiogenesis after bevacizumab treatment of squamous cell carcinoma xenografts. The result showed that 68Ga-NODAGA-c(RGDfK) uptake was significantly increased at day 7 of treatment and maintained until 3 weeks, accompanied with a transient normalization of blood vessel morphology and reduction of MVD and αvβ3 integrin expression.71 Arg-Gly-Asp (RGD) peptides have a high affinity and selectivity for αvβ3; RGD-based PET tracers can measure the changes in neovascular density and integrin expression during antiangiogenic therapy.72–74 Similarly, PET also accurately traced vascular normalization and improved interstitial chemotherapy delivery; when [18F]-FMISO-PET signal decreased, the tissue hypoxia reduction and the vascular structures are normalized; thus, it could be a potential biomarker in anti-angiogenic therapy.66,67
Using (99m)Tc-RGD on SPECT/CT to evaluate the tumor vessels determined the optimal dose regimen for bevacizumab and radiotherapy alone. Scintigraphic imaging showed a significantly increased RGD tumor uptake 2 hours after bevacizumab treatment compared with those 24 hours after bevacizumab treatment and controls, which identified the vascular normalization window and showed the effect of bevacizumab when administered 2 hours before radiotherapy.75 99mTc-(CO)3 His-Annexin A5 SPECT probes a significant antitumor efficacy of irinotecan during normalization of tumor blood vessels caused by bevacizumab.76
PET has been clinically used to detect the lesions of tumor metastasis and guide the staging and treatment program of the tumor. However, it failed to gain wider acceptance for routine clinical application for detecting tumor vasculature because of several limitations, for instance, the tracers’ accumulation in hypoxic tumors is slow, tracers have short half-life of the isotopes,64 and a considerable amount of radioactive metabolites.77 Data regarding SPECT in the clinical setting in response to antiangiogenic treatment are scarce. As a new advanced versatile detection platform, a large amount of clinical data and preclinical studies need to be collected and analyzed comprehensively to evaluate its value in detecting tumor vascular normalization.
Dynamic contrast-enhanced ultrasonography (DCE-US)
DCE-US is a functional technique using Doppler ultrasound with contrast medium and perfusion software, using a mathematical model to quantitatively evaluate BF and vascular morphological characteristics.78–80 For example, DCE-US has been introduced to improve the diagnosis of thyroid nodules, given the abundant vasculature of the thyroid gland.81 In solid tumors, changes in tumor vascularization can be detected earlier than changes in tumor volume, and DCE-US has been proposed as an alternative method to evaluate vascular response to anti-angiogenic therapy and targeted therapy.82–87
Microvascular morphology can be delineated by contrast-enhanced ultrasound angiography (CEUA). Cannula centerlines extracted from ultrasound images can be more conveniently acquired vascular morphology parameters, such as vascular length, density, bifurcations, junction points, and other topologic features,88 thus CEUA provides a quantitative basis for distinguishing malignant from normal tissue due to vascular heterogeneity.89 3D contrast-enhanced ultrasonography could identify benign and malignant breast tumors and correlates with MVD and VEGF expression.90 Combined analysis of quantitative vasculature, vascular morphology, and tortuosity by 3D power Doppler ultrasound can potentially serve as imaging biomarkers to predict the early response to anti-angiogenesis therapy.91 DCE-US-based vascular morphology parameters exhibit a marked reduction in tumor vessels, bifurcations, and tortuosity, which are manifestations of tumor blood vessel normalization.78
DCE-US imaging was used to estimate tissue perfusion, which is another index for tumor vascular normalization. Microbubble contrast agents (MCAs) will disintegrate and dissolve under ultrasound. The MCA reperfusion rate into the microvasculature will reflect BF. This technique has been used to map BF rate in many organs and tumors.92 DCE-US could detect considerable changes in intratumoral BV through the functional parameters of area under the curve and peak intensity (PI), BF rate by time-to-peak intensity, wash-in rate (WIR), and wash-out rate (WOR), all of which may prove useful in determining tumor response to anti-angiogenesis or chemotherapy.78 An earlier study used dynamic US to quantify dynamic changes in tumor blood vessels’ early response to bevacizumab treatment in patients with hepatocellular carcinoma, although there is no direct description of the alleviation in hypoxia and interstitial pressure due to the vascular normalization; however, the total area under the time–intensity curve that corresponds to BV and is probably the best indicator of tissue necrosis.93 A clinical trial enrolled 539 patients in which DCE-US was carried out at baseline and 7 days after anti-angiogenic treatment. The trial identified the mean transit time of at least 12 seconds was the only criterion that correlated with freedom from progression of patients treated with bevacizumab at day 7, and this criterion might be linked to vascular normalization.94 The hemodynamics of liver metastasis in patients with colorectal cancer who received anti-angiogenesis therapy was quantitatively evaluated by DCE-US. Dynamic monitoring showed that retention time (RT) increased continuously in the bevacizumab-sensitive tumors and transient reduction in bevacizumab-resistant tumor vessels. This heterogeneity might be related to the normalization of vasculature.95 A recent study provided direct evidence by 3D power Doppler ultrasound that the possible timing of the normalization window was 20–24 hours after the administration of bevacizumab in human breast cancer.96
In conclusion, tumor vascular parameters could be analyzed using various techniques. Among them, DCE-US has been proven to be safe, easily repeatable, low cost, and with reproducible results, which make it a feasible tool that can be relatively easy to implement to monitor tumor vascular normalization; however, the detection is influenced by intestine gas and is limited in its accuracy to monitor the BF of abdominal and pelvic tumors. Furthermore, in some tumors, the guidelines for evaluating the quality of results need to be established.
Plasma or serum marker
Since various proteins released by tumors are identified in the plasma or serum, blood is an ideal biological sample to predict disease progression, and blood proteomics have gained considerable interest in identification of novel reliable disease biomarkers.
Soluble vascular endothelial growth factor receptor-1 (sVEGFR-1) is an endogenous antagonist of VEGF and placenta growth factor (PlGF) and is related to tumor vascular normalization. The plasma sVEGFR-1 correlates with antitumor and systemic efficacy of bevacizumab-based chemoradiation.97 A transient decrease in plasma sVEGFR1 was measured at day 7 after the induction of bevacizumab,39 which can be used as a candidate biomarker for predicting normalization of tumor blood vessels. Angiopoietin-1/2 (Ang1/2) plays a dynamic role in vessel formation, permeability, maturation, and maintenance.98 Serum Ang2 is emerging as an endothelium activation marker in certain diseases, such as acute lung injury, hypertension-related myocardial infarction, sepsis, and many cancers,99 and it has been reported to be overexpressed in tumors after anti-angiogenic therapies;98 however, cediranib treatment induced transient decreases in Ang2 in plasma.100 In tumor tissue, the Ang1/Ang2 ratio correlated with the degree of vascular normalization and with the survival of patients with glioblastoma.101 Cediranib treatment led to transient normalization of the vasculature and was associated with a transient increase in plasma collagen IV at day 2, which reflects basement membrane thinning.102 In clinical practice, circulating collagen IV level is one of the parameters to identify the tumor vascular normalization index with MRI.44
Apelin/APJ signaling regulates pathological angiogenesis, and the secretion level of apelin was increased under hypoxic environment, which was mediated by HIF-1α;103,104 furthermore, apelin expression is upregulated in the process of new vascular formation but downregulated following vascular stabilization.105,106 A preclinical study found that apelin expression both in tumor tissue and in plasma would be transiently decreased during the vessel normalization window induced by bevacizumab and restored with the regression of vascular normalization.107 Considering the relationship between hypoxia and apelin, this change is thought to be due to a temporary alleviation of hypoxia in the time window; however, the clinical usefulness of apelin to identify the tumor vascular normalization needs to be analyzed.
In addition, a series of factors, genes, or cells that exist in both blood and tumor tissue have been demonstrated as a remarkable marker in tumor tissue. Type 1 T helper (TH1) cells are associated with vessel normalization by secreting interferon-γ, and there is a positive feedback loop between TH1 and vascular normalization, accompanied with a decrease in the expression of Angpt2 and other VEGF-signature genes.108 Moreover, Tian et al108 identified that various angiogenesis-related genes positively or negatively correlate with survival, and they defined these genes as good- and poor-prognosis angiogenesis genes (GPAGs and PPAGs). The inversion of GPAGs and PPAGs correlates with “invasive vasculature”, and thus, these genes can be used as vessel normalization indicators.
Easy accessibility and sensitivity to changes in tumor vasculature make plasma and serum as promising markers for monitoring tumor vascular normalization during anti-angiogenic treatment. These markers suggest that potential combination regimens improve the effectiveness of chemotherapy drugs, and some of them may be applicable to other tumor types and warrant further testing.
Conclusion and outlook
Preclinical or clinical studies have shown that normalization of tumor blood vessels can improve the comprehensive therapy efficacy, including radiotherapy, chemotherapy, and immunotherapy. To ensure drug administration precisely within normalized time window, it is necessary to monitor the time window accurately; however, how to conduct effective clinical monitoring of vascular normalization time window is a key constraint. Although PET, MRI, and CT perfusion imaging have been used to evaluate the therapeutic efficacy of anti-angiogenesis therapy, no consensus has yet been reached. To date, no single method has been validated for detecting the complex process of normalization. At present, MRI and ultrasound are the most reported in the clinical literature, and their reliability and stability deserve more observation. PET and CT as the platform for the observation method have been widely used. Recently, we and other researchers have been gradually looking for serum or plasma markers of interest in monitoring, combining imaging methods to establish a more effective evaluation system that deserves further study.
Disclosure
The authors report no conflicts of interest in this work.
References
Folkman J. Tumor angiogenesis: therapeutic implications. N Engl J Med. 1971;285(21):1182–1186. | ||
Cumsille P, Coronel A, Conca C, Quiñinao C, Escudero C. Proposal of a hybrid approach for tumor progression and tumor-induced angiogenesis. Theor Biol Med Model. 2015;12(1):13. | ||
Comunanza V, Bussolino F. Therapy for Cancer: Strategy of Combining Anti-Angiogenic and Target Therapies. Front Cell Dev Biol. 2017;5:101. | ||
Jain RK. Antiangiogenesis strategies revisited: from starving tumors to alleviating hypoxia. Cancer Cell. 2014;26(5):605–622. | ||
Carmeliet P, Jain RK. Angiogenesis in cancer and other diseases. Nature. 2000;407(6801):249–257. | ||
Baeriswyl V, Christofori G. The angiogenic switch in carcinogenesis. Semin Cancer Biol. 2009;19(5):329–337. | ||
Jain RK. Normalization of tumor vasculature: an emerging concept in antiangiogenic therapy. Science. 2005;307(5706):58–62. | ||
Huang D, Lan H, Liu F, et al. Anti-angiogenesis or pro-angiogenesis for cancer treatment: focus on drug distribution. Int J Clin Exp Med. 2015;8(6):8369–8376. | ||
Folkman J. Fighting cancer by attacking its blood supply. Sci Am. 1996;275(3):150–154. | ||
Jain RK, Duda DG, Clark JW, Loeffler JS. Lessons from phase III clinical trials on anti-VEGF therapy for cancer. Nat Clin Pract Oncol. 2006;3(1):24–40. | ||
Wu JM, Staton CA. Anti-angiogenic drug discovery: lessons from the past and thoughts for the future. Expert Opin Drug Discov. 2012;7(8):723–743. | ||
Shojaei F. Anti-angiogenesis therapy in cancer: Current challenges and future perspectives. Cancer Lett. 2012;320(2):130–137. | ||
Goel S, Wong AH-K, Jain RK. Vascular normalization as a therapeutic strategy for malignant and nonmalignant disease. Cold Spring Harb Perspect Med. 2012;2(3):a006486. | ||
Peterson TE, Kirkpatrick ND, Huang Y, et al. Dual inhibition of Ang-2 and VEGF receptors normalizes tumor vasculature and prolongs survival in glioblastoma by altering macrophages. Proc Natl Acad Sci U S A. 2016;113(16):4470–4475. | ||
Adapala RK, Thoppil RJ, Ghosh K, et al. Activation of mechanosensitive ion channel TRPV4 normalizes tumor vasculature and improves cancer therapy. Oncogene. 2016;35(3):314–322. | ||
Tewari KS, Sill MW, Long HJ, et al. Improved survival with bevacizumab in advanced cervical cancer. N Engl J Med Overseas Ed. 2014;370(8):734–743. | ||
Sandler A, Gray R, Perry MC, et al. Paclitaxel–Carboplatin Alone or with Bevacizumab for Non–Small-Cell Lung Cancer. N Engl J Med Overseas Ed. 2006;355(24):2542–2550. | ||
Giantonio BJ, Catalano PJ, Meropol NJ, et al. Bevacizumab in combination with oxaliplatin, fluorouracil, and leucovorin (FOLFOX4) for previously treated metastatic colorectal cancer: results from the Eastern Cooperative Oncology Group Study E3200. J Clin Oncol. 2007;25(12):1539–1544. | ||
Saltz LB, Clarke S, Díaz-Rubio E, et al. Bevacizumab in combination with oxaliplatin-based chemotherapy as first-line therapy in metastatic colorectal cancer: a randomized phase III study. J Clin Oncol. 2008;26(12):2013–2019. | ||
Jain RK. Normalizing tumor vasculature with anti-angiogenic therapy: A new paradigm for combination therapy. Nat Med. 2001;7(9):987–989. | ||
Huang Y, Goel S, Duda DG, Fukumura D, Jain RK. Vascular normalization as an emerging strategy to enhance cancer immunotherapy. Cancer Res. 2013;73(10):2943–2948. | ||
Goel S, Duda DG, Xu L, et al. Normalization of the Vasculature for Treatment of Cancer and Other Diseases. Physiol Rev. 2011;91(3):1071–1121. | ||
Viallard C, Larrivée B. Tumor angiogenesis and vascular normalization: alternative therapeutic targets. Angiogenesis. 2017;20(4):409–426. | ||
Martin JD, Fukumura D, Duda DG, Boucher Y, Jain RK. Reengineering the Tumor Microenvironment to Alleviate Hypoxia and Overcome Cancer Heterogeneity. Cold Spring Harb Perspect Med. 2016;6(12). | ||
Ning T, Jiang M, Peng Q, et al. Low-dose endostatin normalizes the structure and function of tumor vasculature and improves the delivery and anti-tumor efficacy of cytotoxic drugs in a lung cancer xenograft murine model. Thorac Cancer. 2012;3(3):229–238. | ||
Cerniglia GJ, Pore N, Tsai JH, et al. Epidermal growth factor receptor inhibition modulates the microenvironment by vascular normalization to improve chemotherapy and radiotherapy efficacy. PLoS One. 2009;4(8):e6539. | ||
Huber PE, Bischof M, Jenne J, et al. Trimodal cancer treatment: beneficial effects of combined antiangiogenesis, radiation, and chemotherapy. Cancer Res. 2005;65(9):3643–3655. | ||
Jain RK, Duda DG, Willett CG, et al. Biomarkers of response and resistance to antiangiogenic therapy. Nat Rev Clin Oncol. 2009;6(6):327–338. | ||
Lin MI, Sessa WC. Antiangiogenic therapy: creating a unique “window” of opportunity. Cancer Cell. 2004;6(6):529–531. | ||
Huang Y, Yuan J, Righi E, et al. Vascular normalizing doses of antiangiogenic treatment reprogram the immunosuppressive tumor microenvironment and enhance immunotherapy. Proc Natl Acad Sci U S A. 2012;109(43):17561–17566. | ||
Yao J, Yang Z-Gang, Chen H-Jiao, Chen T-Wu, Huang J. Gastric adenocarcinoma: can perfusion CT help to noninvasively evaluate tumor angiogenesis? Abdom Imaging. 2011;36(1):15–21. | ||
Kim E, Stamatelos S, Cebulla J, Bhujwalla ZM, Popel AS, Pathak AP. Multiscale imaging and computational modeling of blood flow in the tumor vasculature. Ann Biomed Eng. 2012;40(11):2425–2441. | ||
Ma E, Ren A, Gao B, et al. ROI for outlining an entire tumor is a reliable approach for quantification of lung cancer tumor vascular parameters using CT perfusion. Onco Targets Ther. 2016;9:2377–2384. | ||
Chen X-H, Ren K, Liang P, Chai Y, Chen K-S, Gao J-B. Spectral computed tomography in advanced gastric cancer: Can iodine concentration non-invasively assess angiogenesis? World J Gastroenterol. 2017;23(9):1666–1675. | ||
Ca Y, Lee KS, Kim EA, et al. Solitary pulmonary nodules: dynamic enhanced multi-detector row CT study and comparison with vascular endothelial growth factor and microvessel density. Radiology. 2004;233(1):191–199. | ||
Wang JH, Min PQ, Wang PJ, et al. Dynamic CT Evaluation of Tumor Vascularity in Renal Cell Carcinoma. AJR Am J Roentgenol. 2006;186(5):1423–1430. | ||
Hattori Y, Gabata T, Matsui O, et al. Enhancement patterns of pancreatic adenocarcinoma on conventional dynamic multi-detector row CT: Correlation with angiogenesis and fibrosis. World J Gastroenterol. 2009;15(25):3114–3121. | ||
Goh V, Halligan S, Daley F, Wellsted DM, Guenther T, Bartram CI. Colorectal Tumor Vascularity: Quantitative Assessment with Multidetector CT-Do Tumor Perfusion Measurements Reflect Angiogenesis? Radiology. 2008;249(2):510–517. | ||
Heist RS, Duda DG, Sahani DV, et al. Improved tumor vascularization after anti-VEGF therapy with carboplatin and nab-paclitaxel associates with survival in lung cancer. Proc Natl Acad Sci. 2015;112(5):1547–1552. | ||
Schmitz S, Rommel D, Michoux N, et al. Dynamic contrast-enhanced computed tomography to assess early activity of cetuximab in squamous cell carcinoma of the head and neck. Radiol Oncol. 2015;49(1):17–25. | ||
Yang X, Knopp MV. Quantifying tumor vascular heterogeneity with dynamic contrast-enhanced magnetic resonance imaging: a review. J Biomed Biotechnol. 2011;2011(1):732848:1–12. | ||
Hectors SJ, Jacobs I, Lok J, et al. Improved Evaluation of Antivascular Cancer Therapy Using Constrained Tracer-Kinetic Modeling for Multiagent Dynamic Contrast-Enhanced MRI. Cancer Res. 2018;78(6):1561–1570. | ||
Vriens D, de Geus-Oei L-F, Heerschap A, van Laarhoven HWM, Oyen WJG. Vascular and metabolic response to bevacizumab-containing regimens in two patients with colorectal liver metastases measured by dynamic contrast-enhanced MRI and dynamic 18F-FDG-PET. Clin Colorectal Cancer. 2011;10(1):E1–E5. | ||
Sorensen AG, Batchelor TT, Zhang W-T, et al. A “vascular normalization index” as potential mechanistic biomarker to predict survival after a single dose of cediranib in recurrent glioblastoma patients. Cancer Res. 2009;69(13):5296–5300. | ||
Sorensen AG, Emblem KE, Polaskova P, et al. Increased survival of glioblastoma patients who respond to antiangiogenic therapy with elevated blood perfusion. Cancer Res. 2012;72(2):402–407. | ||
Jackson A, O’Connor JP, Parker GJ, Jayson GC. Imaging tumor vascular heterogeneity and angiogenesis using dynamic contrast-enhanced magnetic resonance imaging. Clin Cancer Res. 2007;13(12):3449–3459. | ||
Ch L, Chen FH, Schellingerhout D, Lin YS, Hong JH, Liu HL. Flow versus permeability weighting in estimating the forward volumetric transfer constant (K(trans)) obtained by DCE-MRI with contrast agents of differing molecular sizes. Magn Reson Imaging. 2017;36:105–111. | ||
de Lussanet QG, Backes WH, Griffioen AW, et al. Dynamic contrast-enhanced magnetic resonance imaging of radiation therapy-induced microcirculation changes in rectal cancer. Int J Radiat Oncol Biol Phys. 2005;63(5):1309–1315. | ||
Padhani AR, Hayes C, Assersohn L, et al. Prediction of clinicopathologic response of breast cancer to primary chemotherapy at contrast-enhanced MR imaging: initial clinical results. Radiology. 2006;239(2):361–374. | ||
Johansen R, Jensen LR, Rydland J, et al. Predicting survival and early clinical response to primary chemotherapy for patients with locally advanced breast cancer using DCE-MRI. J Magn Reson Imaging. 2009;29(6):1300–1307. | ||
Park I, von Morze C, Lupo JM, et al. Investigating tumor perfusion by hyperpolarized 13C MRI with comparison to conventional gadolinium contrast-enhanced MRI and pathology in orthotopic human GBM xenografts. Magn Reson Med. 2017;77(2):841–847. | ||
Emblem KE, Bjornerud A, Mouridsen K, et al. T(1)- and T(2)(*)-Dominant Extravasation Correction in DSC-MRI: Part II—Predicting Patient Outcome after a Single Dose of Cediranib in Recurrent Glioblastoma Patients. J Cereb Blood Flow Metab. 2011;31(10):2054–2064. | ||
Wong ALA, Sundar R, Wang T-T, et al. Phase Ib/II randomized, open-label study of doxorubicin and cyclophosphamide with or without low-dose, short-course sunitinib in the pre-operative treatment of breast cancer. Oncotarget. 2016;7(39):64089–64099. | ||
Batchelor TT, Gerstner ER, Emblem KE, et al. Improved tumor oxygenation and survival in glioblastoma patients who show increased blood perfusion after cediranib and chemoradiation. Proc Natl Acad Sci U S A. 2013;110(47):19059–19064. | ||
Ken S, Deviers A, Filleron T, et al. Voxel-based evidence of perfusion normalization in glioblastoma patients included in a phase I–II trial of radiotherapy/tipifarnib combination. J Neurooncol. 2015;124(3):465–473. | ||
Batchelor TT, Sorensen AG, di Tomaso E, et al. AZD2171, a pan-VEGF receptor tyrosine kinase inhibitor, normalizes tumor vasculature and alleviates edema in glioblastoma patients. Cancer Cell. 2007;11(1):83–95. | ||
Chen B-B, Lu Y-S, Lin C-H, et al. A pilot study to determine the timing and effect of bevacizumab on vascular normalization of metastatic brain tumors in breast cancer. BMC Cancer. 2016;16(1):466. | ||
Wang Y, Liu M, Jin ML. Blood Oxygenation Level-dependent Magnetic Resonance Imaging of Breast Cancer: Correlation with Carbonic Anhydrase IX and Vascular Endothelial Growth Factor. Chin Med J. 2017 2017;130(1):71–76. | ||
Liu M, Guo X, Wang S, et al. BOLD-MRI of breast invasive ductal carcinoma: correlation of R2* value and the expression of HIF-1α. Eur Radiol. 2013;23(12):3221–3227. | ||
Gerstner ER, Zhang Z, Fink JR, et al. ACRIN 6684: Assessment of Tumor Hypoxia in Newly Diagnosed Glioblastoma Using 18F-FMISO PET and MRI. Clin Cancer Res. 2016;22(20):5079–5086. | ||
Ranieri G, Marech I, Niccoli Asabella A, et al. Tyrosine-Kinase Inhibitors Therapies with Mainly Anti-Angiogenic Activity in Advanced Renal Cell Carcinoma: Value of PET/CT in Response Evaluation. Int J Mol Sci. 2017;18(9):1937. | ||
Herbst RS, Mullani NA, Davis DW, et al. Development of biologic markers of response and assessment of antiangiogenic activity in a clinical trial of human recombinant endostatin. J Clin Oncol. 2002;20(18):3804–3814. | ||
Chatterjee S, Wieczorek C, Schottle J, et al. Transient antiangiogenic treatment improves delivery of cytotoxic compounds and therapeutic outcome in lung cancer. Cancer Res. 2014;74(10):2816–2824. | ||
Kristian A, Revheim ME, Qu H, et al. Dynamic 18F-FDG-PET for monitoring treatment effect following anti-angiogenic therapy in triple-negative breast cancer xenografts. Acta Oncol. 2013;52(7):1566–1572. | ||
Yu W, Zhao S, Zhao Y, et al. Changes in tumor oxygen state after sorafenib therapy evaluated by 18F-fluoromisonidazole hypoxia imaging of renal cell carcinoma xenografts. Oncol Lett. 2017;14(2):2341–2346. | ||
Bekaert L, Valable S, Lechapt-Zalcman E, et al. 18F]-FMISO PET study of hypoxia in gliomas before surgery: correlation with molecular markers of hypoxia and angiogenesis. Eur J Nucl Med Mol Imaging. 2017;44(8):1383–1392. | ||
Hernández-Agudo E, Mondejar T, Soto-Montenegro ML, et al. Monitoring vascular normalization induced by antiangiogenic treatment with 18F-fluoromisonidazole-PET. Mol Oncol. 2016;10(5):704–718. | ||
Barajas RF, Pampaloni MH, Clarke JL, et al. Assessing Biological Response to Bevacizumab Using 18F-Fluoromisonidazole PET/MR Imaging in a Patient with Recurrent Anaplastic Astrocytoma. Case Rep Radiol. 2015;2015(11):731361–4. | ||
Murakami M, Zhao S, Zhao YAN, et al. Evaluation of changes in the tumor microenvironment after sorafenib therapy by sequential histology and 18F-fluoromisonidazole hypoxia imaging in renal cell carcinoma. Int J Oncol. 2012;41(5):1593–1600. | ||
Jose Bueno M, Sanchez J, Colomer R, Quintela-Fandino M, Bueno MJ. Antiangiogenics and Hypoxic Response: Role of Fatty Acid Synthase Inhibitors. Curr Drug Targets. 2016;17(15):1735–1746. | ||
Rylova SN, Barnucz E, Fani M, et al. Does imaging αvβ3 integrin expression with PET detect changes in angiogenesis during bevacizumab therapy? J Nucl Med. 2014;55(11):1878–1884. | ||
Chen H, Niu G, Wu H, Chen X. Clinical Application of Radiolabeled RGD Peptides for PET Imaging of Integrin αvβ3. Theranostics. 2016;6(1):78–92. | ||
Shi J, Jin Z, Liu X, et al. PET Imaging of Neovascularization with 68Ga-3PRGD 2 for Assessing Tumor Early Response to Endostar Antiangiogenic Therapy. Mol Pharm. 2014;11(11):3915–3922. | ||
Terry SY, Abiraj K, Lok J, et al. Can 111In-RGD2 monitor response to therapy in head and neck tumor xenografts? J Nucl Med. 2014;55(11):1849–1855. | ||
Becker S, Bohn P, Bouyeure-Petit AC, et al. Bevacizumab enhances efficiency of radiotherapy in a lung adenocarcinoma rodent model: Role of αvβ3 imaging in determining optimal window. Nucl Med Biol. 2015;42(12):923–930. | ||
Vangestel C, van de Wiele C, van Damme N, et al. (99)mTc-(CO)(3) His-annexin A5 micro-SPECT demonstrates increased cell death by irinotecan during the vascular normalization window caused by bevacizumab. J Nucl Med. 2011;52(11):1786–1794. | ||
Bourgeois M, Rajerison H, Guerard F, et al. Contribution of [64Cu]-ATSM PET in molecular imaging of tumour hypoxia compared to classical [18F]-MISO – a selected review. Nuclear Medicine Review. 2011;14(2):90–95. | ||
Hoyt K, Umphrey H, Lockhart M, Robbin M, Forero-Torres A. Ultrasound imaging of breast tumor perfusion and neovascular morphology. Ultrasound Med Biol. 2015;41(9):2292–2302. | ||
Hudson JM, Williams R, Karshafian R, et al. Quantifying vascular heterogeneity using microbubble disruption-replenishment kinetics in patients with renal cell cancer. Invest Radiol. 2014;49(2):116–123. | ||
Lassau N, Chami L, Benatsou B, Peronneau P, Roche A. Dynamic contrast-enhanced ultrasonography (DCE-US) with quantification of tumor perfusion: a new diagnostic tool to evaluate the early effects of antiangiogenic treatment. Eur Radiol. 2007;17 Suppl 6(S6):89–98. | ||
Molinari F, Mantovani A, Deandrea M, Limone P, Garberoglio R, Suri JS. Characterization of single thyroid nodules by contrast-enhanced 3-D ultrasound. Ultrasound Med Biol. 2010;36(10):1616–1625. | ||
Lassau N, Bonastre J, Kind M, et al. Validation of dynamic contrast-enhanced ultrasound in predicting outcomes of antiangiogenic therapy for solid tumors: the French multicenter support for innovative and expensive techniques study. Invest Radiol. 2014;49(12):794–800. | ||
Lassau N, Chapotot L, Benatsou B, et al. Standardization of dynamic contrast-enhanced ultrasound for the evaluation of antiangiogenic therapies: the French multicenter Support for Innovative and Expensive Techniques Study. Invest Radiol. 2012;47(12):711–716. | ||
Lassau N, Chami L, Chebil M, et al. Dynamic contrast-enhanced ultrasonography (DCE-US) and anti-angiogenic treatments. Discov Med. 2011;11(56):18–24. | ||
Frampas E, Lassau N, Zappa M, Vullierme M-P, Koscielny S, Vilgrain V. Advanced Hepatocellular Carcinoma: Early evaluation of response to targeted therapy and prognostic value of Perfusion CT and Dynamic Contrast Enhanced-Ultrasound. Preliminary results. Eur J Radiol. 2013;82(5):e205–e211. | ||
Lassau N, Koscielny S, Albiges L, et al. Metastatic renal cell carcinoma treated with sunitinib: early evaluation of treatment response using dynamic contrast-enhanced ultrasonography. Clin Cancer Res. 2010;16(4):1216–1225. | ||
Lassau N, Coiffier B, Faivre L, et al. Study of Intrapatient Variability and Reproducibility of Quantitative Tumor Perfusion Parameters Evaluated With Dynamic Contrast-Enhanced Ultrasonography. Invest Radiol. 2017;52(3):1–154. | ||
Eisenbrey JR, Joshi N, Dave JK, Forsberg F. Assessing algorithms for defining vascular architecture in subharmonic images of breast lesions. Phys Med Biol. 2011;56(4):919–930. | ||
Gessner RC, Aylward SR, Dayton PA. Mapping microvasculature with acoustic angiography yields quantifiable differences between healthy and tumor-bearing tissue volumes in a rodent model. Radiology. 2012;264(3):733–740. | ||
Chen M, Wang WP, Jia WR, et al. Three-dimensional contrast-enhanced sonography in the assessment of breast tumor angiogenesis: correlation with microvessel density and vascular endothelial growth factor expression. J Ultrasound Med. 2014;33(5):835–846. | ||
Chang Y-C, Huang Y-H, Huang C-S, Chang R-F. Vascular morphology and tortuosity analysis of breast tumor inside and outside contour by 3-D power Doppler ultrasound. Ultrasound Med Biol. 2012;38(11):1859–1869. | ||
Feingold S, Gessner R, Guracar IM, Dayton PA. Quantitative volumetric perfusion mapping of the microvasculature using contrast ultrasound. Invest Radiol. 2010;45(10):669–674. | ||
Lassau N, Koscielny S, Chami L, et al. Advanced hepatocellular carcinoma: early evaluation of response to bevacizumab therapy at dynamic contrast-enhanced US with quantification--preliminary results. Radiology. 2011;258(1):291–300. | ||
Lassau N, Coiffier B, Kind M, et al. Selection of an early biomarker for vascular normalization using dynamic contrast-enhanced ultrasonography to predict outcomes of metastatic patients treated with bevacizumab. Ann Oncol. 2016;27(10):1922–1928. | ||
Wu Z, Yang X, Chen L, et al. Anti-angiogenic therapy with contrast-enhanced ultrasound in colorectal cancer patients with liver metastasis. Medicine. 2017;96(20):e6731. | ||
Chen DR, Lin C, Wang YF. Window of opportunity: A new insight into sequential bevacizumab and paclitaxel in two cases of metastatic triple-negative breast cancer. Exp Ther Med. 2015;10(3):885–888. | ||
Duda DG, Willett CG, Ancukiewicz M, et al. Plasma soluble VEGFR-1 is a potential dual biomarker of response and toxicity for bevacizumab with chemoradiation in locally advanced rectal cancer. Oncologist. 2010;15(6):577–583. | ||
Fueyo J, Hossain MB, Nguyen T, Gomez-Manzano C. Normalizing tumoral vessels to treat cancer: an out-of-the-box strategy involving TIE2 pathway. Transl Cancer Res. 2017;6(S2):S317–S320. | ||
Augustin HG, Young Koh G, Thurston G, Alitalo K. Control of vascular morphogenesis and homeostasis through the angiopoietin–Tie system. Nat Rev Mol Cell Biol. 2009;10(3):165–177. | ||
Batchelor TT, Duda DG, di Tomaso E, et al. Phase II study of cediranib, an oral pan-vascular endothelial growth factor receptor tyrosine kinase inhibitor, in patients with recurrent glioblastoma. J Clin Oncol. 2010;28(17):2817–2823. | ||
Sie M, Wagemakers M, Molema G, Mooij JJ, de Bont ES, den Dunnen WF. The angiopoietin 1/angiopoietin 2 balance as a prognostic marker in primary glioblastoma multiforme. J Neurosurg. 2009;110(1):147–155. | ||
Kamoun WS, Ley CD, Farrar CT, et al. Edema control by cediranib, a vascular endothelial growth factor receptor-targeted kinase inhibitor, prolongs survival despite persistent brain tumor growth in mice. J Clin Oncol. 2009;27(15):2542–2552. | ||
Zhang J, Liu Q, Fang Z, et al. Hypoxia induces the proliferation of endothelial progenitor cells via upregulation of Apelin/APLNR/MAPK signaling. Mol Med Rep. 2016;13(2):1801–1806. | ||
Wu L, Chen L, Li L. Apelin/APJ system: A novel promising therapy target for pathological angiogenesis. Clinica Chimica Acta. 2017;466:78–84. | ||
Ali YF, El-Morshedy S, Imam AA, et al. The role of serum apelin in retinopathy of prematurity. Clin Ophthalmol. 2017;11:387–392. | ||
Kidoya H, Takakura N. Biology of the apelin-APJ axis in vascular formation. J Biochem. 2012;152(2):125–131. | ||
Zhang L, Takara K, Yamakawa D, Kidoya H, Takakura N. Apelin as a marker for monitoring the tumor vessel normalization window during antiangiogenic therapy. Cancer Sci. 2016;107(1):36–44. | ||
Tian L, Goldstein A, Wang H, et al. Mutual regulation of tumour vessel normalization and immunostimulatory reprogramming. Nature. 2017;544(7649):250–254. |
 © 2018 The Author(s). This work is published and licensed by Dove Medical Press Limited. The full terms of this license are available at https://www.dovepress.com/terms.php and incorporate the Creative Commons Attribution - Non Commercial (unported, v3.0) License.
By accessing the work you hereby accept the Terms. Non-commercial uses of the work are permitted without any further permission from Dove Medical Press Limited, provided the work is properly attributed. For permission for commercial use of this work, please see paragraphs 4.2 and 5 of our Terms.
© 2018 The Author(s). This work is published and licensed by Dove Medical Press Limited. The full terms of this license are available at https://www.dovepress.com/terms.php and incorporate the Creative Commons Attribution - Non Commercial (unported, v3.0) License.
By accessing the work you hereby accept the Terms. Non-commercial uses of the work are permitted without any further permission from Dove Medical Press Limited, provided the work is properly attributed. For permission for commercial use of this work, please see paragraphs 4.2 and 5 of our Terms.