")
Back to Journals » OncoTargets and Therapy » Volume 12
Molecular subtype classification of papillary renal cell cancer using miRNA expression
Received 7 November 2018
Accepted for publication 29 January 2019
Published 29 March 2019 Volume 2019:12 Pages 2311—2322
DOI https://doi.org/10.2147/OTT.S193808
Checked for plagiarism Yes
Review by Single anonymous peer review
Peer reviewer comments 2
Editor who approved publication: Dr Sanjay Singh
Changwen Yu,* Danjing Dai,* Juan Xie
Department of Oncology, The People’s Hospital of Hanchuan City, Hanchuan 431600, Hubei, People’s Republic of China
*These authors contributed equally to this work
Background: Renal papillary cell carcinoma (KIRP) is a relatively rare renal malignancy. Although KIRP subtyping about clinical relevance has been defined, there have been scarce number of studies on the molecular characteristics of KIRP subtypes.
Method: In this study, a independent samples t-test was used to identify differentially expressed (DE) miRNAs between tumor and normal samples of KIRP. Meanwhile, we performed unsupervised clustering using DE miRNA expression data to analyze molecular characteristics of KIRP. The Partitioning Around Medoids clustering approach was used to identify molecular subtypes. The cumulative distribution function (CDF), proportion of ambiguously clustered pairs (PAC), principal component analysis (PCA) and consensus heatmaps were used to assess the optimal subtypes. In the differential molecular subtypes, we performed an integrated analysis of survival, DE genes, biological function and somatic mutations on the cohort of KIRP patients from The Cancer Genome Atlas.
Results: From solutions with 2, 3, 4, 5, 6 and 7 clusters we selected three KIRP molecular subtypes after assessing PCA, PAC, CDF and consensus heatmaps. We found that the three subtypes are associated with different overall survival and molecular characteristics. Compared with subtype1 and subtype3, subtype2 had a better prognosis in KIRP patients. After exploring their signaling pathways and biological characteristics, we identified the significantly enriched KEGG pathways and Gene Ontology terms for the three subtypes. The distribution of PARD6B, SETD2, STAG2, CUL3, TNRC18, LRBA, IGSF9B and DUNC1H1 mutations differed between the subtypes.
Conclusion: We performed unsupervised clustering using differentially expressed miRNA expression data and described the three KIRP molecular subtypes. The three subtypes differed in overall survival, molecular characteristics and gene mutation frequency.
Keywords: renal papillary cell carcinoma, unsupervised clustering, molecular subtype, prognosis
Introduction
Renal papillary cell carcinoma (KIRP) is regarded as the second histological type renal cell carcinoma (RCC) with a frequency of about 10%–14%.1 It was first recognized in 1976.2 Delahunt and Eble3 further divided KIRP into two histological subtypes, namely type 1 and type 2. Clinically and biologically speaking, there were differences in type 1 and type 2 subtypes of KIRP. Compared with type 2, the type 1 tumors presented higher Robson stage and lower Fuhrman grade.4 Prognosis analysis suggested that KIRP patients of type 2 had a worse clinical outcome than those of type 1.5 Type 1 was closely linked to alterations of the MET pathway and type 2 was associated with nuclear erythroid 2-related factor 2–antioxidant responsive element pathway activation.6
miRNAs, a type of small non-coding RNAs, became important biological biomarkers in cancer research. Dysregulated expression of miRNAs in RCC plays important roles in tumor development.7–9 For example, some studies demonstrated that overexpression of miR-203 may suppress the development of RCC.10 Some studies also revealed that miRNAs can act as good biomarkers in the diagnosis and prognosis of RCC.11,12 Heinemann et al13 demonstrated that serum miR-122-5p and miR-206 were novel non-invasive prognostic biomarkers for RCC patients.
However, the roles of miRNAs in constructing new subtypes of KIRP remain to be explored. In the present study, we performed unsupervised clustering using aberrant miRNA expression data to analyze molecular characteristics of KIRP and described three KIRP molecular subtypes. We found that the prognosis for each of the three subtypes was different. Meanwhile, we also identified the significantly enriched KEGG pathways and Gene Ontology (GO) terms for the three subtypes. Furthermore, we showed that the distribution of PARD6B, SETD2, STAG2, CUL3, TNRC18, LRBA, IGSF9B and DUNC1H1 mutations differed between the subtypes.
Method
Datasets
RNA-seq, miRNA and phenotype data of KIRP samples from The Cancer Genome Atlas (TCGA) were downloaded from UCSC Xena (http://xena.ucsc.edu/). A summary of clinical features of patients is shown in Table S1. All miRNA expression data used were log2(RPKM+1)-transformed and all RNA-seq data used were log2(FPKM+1)-transformed. TCGA mutation data of 281 KIRP patients were downloaded from Genomic Data Common (https://portal.gdc.cancer.gov/). All mutation data were stored in Mutation Annotation Format (MAF).
Differentially expressed miRNA analysis and unsupervised clustering
An independent samples t-test was used to identify differentially expressed (DE) miRNAs of 292 tumor samples and 34 normal samples of KIRP (|log2FC|>1, P<0.05). Unsupervised clustering was performed using R package “ConsensusClusterPlus” with Partitioning Around Medoids.14 We selected 80% item resampling, a maximum evaluated K of 7, 50 resamplings and 1-Pearson correlation distances. Cluster counts of 2, 3, 4, 5, 6 and 7 are evaluated. The cumulative distribution function (CDF), proportion of ambiguously clustered pairs (PAC), principal component analysis (PCA) and consensus heatmaps were used to assess the optimal K.
Identification of differentially expressed genes and enriched Gene Ontology and pathway in subtypes
To identify DE genes (DEGs) in subtypes, differential expression analysis of subtypes was performed. The DEGs were identified by independent samples t-test (|log2FC|>0.5, P<0.05). GO and the KEGG signaling pathway analyses were performed with the R package “clusterProfiler”.15 Biological process (BP), cellular component (CC) and molecular function (MF) are the three parts of GO analysis.
Mutation analysis
Mutation data in MAF available for 281 KIRP patients were used in the analysis. The mutation profiles in subtypes were shown with the R package “maftools”.16 We also used maftools to calculate the mutation rate of each gene. The significant mutation genes in different subtypes were identified by maftools (P<0.05).
Statistical analysis
All statistical analysis was performed using R-3.5.1. Survival analysis was performed with the R packages “survival” and “survminer”.17 Statistical significance of survival analysis was assessed by log-rank test. Three-dimensional PCA analysis was used with the R package “factoextra”. A heatmap was produced with the R package “ComplexHeatmap”.18 PAC was calculated with the R package “diceR”.19 P<0.05 was considered significant.
Results
Unsupervised clustering of differentially expressed miRNAs revealed three subtypes of KIRP
A total of 132 DE miRNAs were identified, among which 20 were upregulated and 112 were downregulated. The DE miRNAs were shown with a heatmap plot and a volcano plot (Figure 1A and B). PCA analysis of DE miRNAs revealed a significant differentiation between the normal and tumor samples (Figure 1C). Consensus unsupervised clustering of 288 samples from KIRP patients revealed 2–7 clusters. Compared with 2, 4 and 5 clusters, 3 clusters had a lower value for PAC, which reflected a near-perfect stable partitioning of the samples at the correct K value (Figure 2C). The relative change in the area under the CDF curve revealed a near-perfect stable partitioning of the samples beginning with the 4 clusters (Figure 2A and B). The PCA and consensus heatmaps also showed a relatively stable partitioning of the samples in the 3 clusters (Figures 2D–I and 3A–F). After assessing the relative change in the area under the CDF curve, PAC value, PCA and consensus heatmaps, we selected a three-cluster solution.
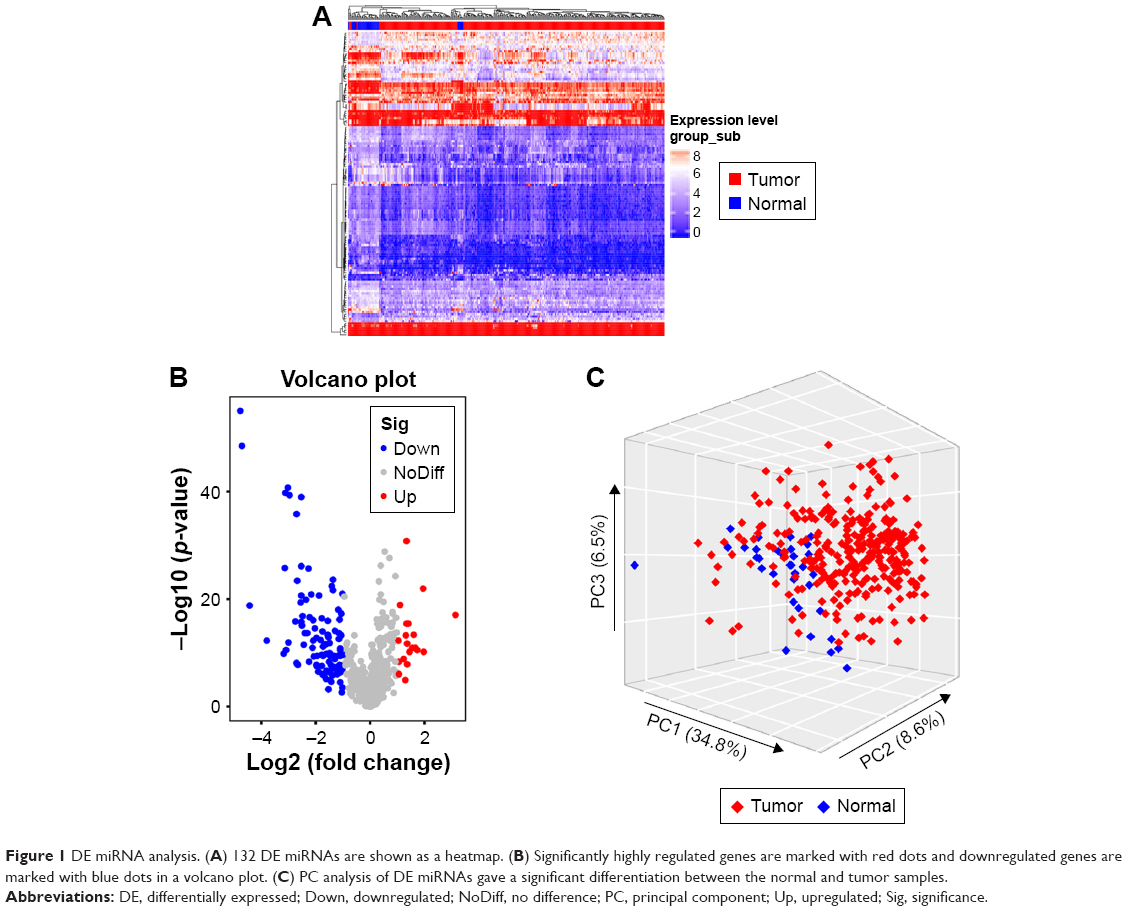 | Figure 1 DE miRNA analysis. (A) 132 DE miRNAs are shown as a heatmap. (B) Significantly highly regulated genes are marked with red dots and downregulated genes are marked with blue dots in a volcano plot. (C) PC analysis of DE miRNAs gave a significant differentiation between the normal and tumor samples. |
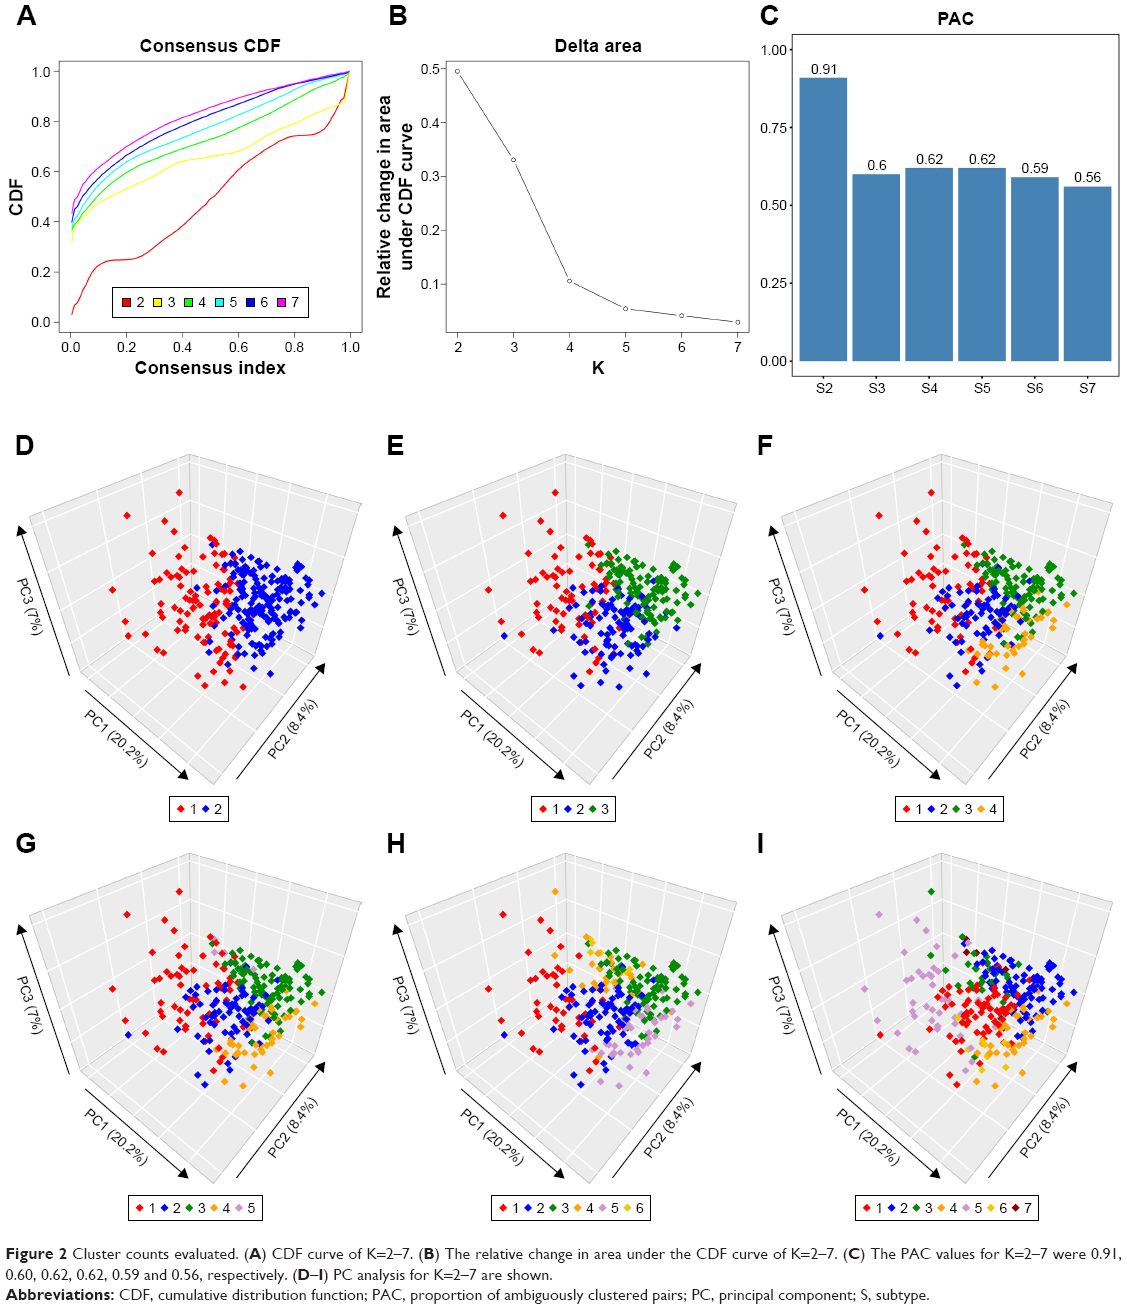 | Figure 2 Cluster counts evaluated. (A) CDF curve of K=2–7. (B) The relative change in area under the CDF curve of K=2–7. (C) The PAC values for K=2–7 were 0.91, 0.60, 0.62, 0.62, 0.59 and 0.56, respectively. (D–I) PC analysis for K=2–7 are shown. |
 | Figure 3 Consensus heatmap. (A–F) Consensus heatmaps for K=2–7 are shown. A relative stable partitioning of the samples is seen at K=3. |
Prognostic value of the different subtypes
Survival analysis was performed for 2–7 clusters and revealed that overall survival differed significantly in each cluster (Figure 4A–F, P<0.0001, log-rank test). However, the prognosis for each of the three subtypes was different. Compared with subtype1 (S1) (n=77) and subtype3 (S3) (n=120), the patients who were classified as subtype2 (S2) (n=91) had a better outcome (Figure 4B, P<0.0001, log-rank test). Multivariate Cox regression analysis was performed to assess the independent prognosis value of subtypes. Taking multiple factors including age, gender, therapy and tumor stage into consideration, patients classified as S1 and S3 still always had a worse prognosis than those classified as S2 (S1 vs S2: HR=9.469, P=0.003; S3 vs S2: HR=11.248, P=0.002) (Figure S1).
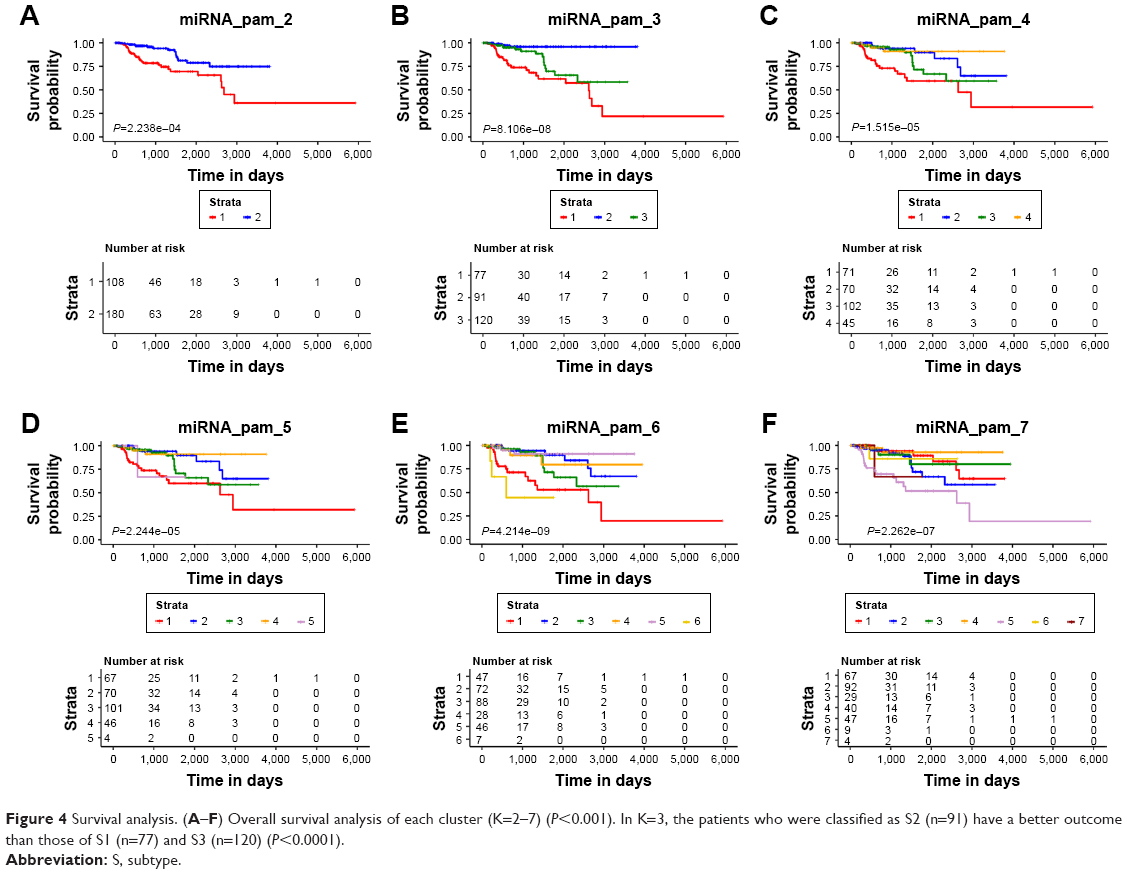 | Figure 4 Survival analysis. (A–F) Overall survival analysis of each cluster (K=2–7) (P<0.001). In K=3, the patients who were classified as S2 (n=91) have a better outcome than those of S1 (n=77) and S3 (n=120) (P<0.0001). |
Differentially expressed genes of S1, S2 and S3 subtypes
In order to explore the molecular characterization of the transcriptome of S1, S2 and S3 subtypes, DEGs (S1 vs S2, S1 vs S3 and S2 vs S3) were identified by independent samples t-test. A total of 347 DEGs were identified between S1 and S2, among which 76 were upregulated (S2>S1) and 271 were downregulated (S2<S1). We also identified 417 DEGs between S1 and S3, among which 139 were upregulated (S3>S1) and 278 were downregulated (S3<S1). Compared with S1 vs S2 and S1 vs S3, S2 vs S3 revealed fewer DEGs. Only 105 DEGs were identified between S2 and S3, among which 56 were upregulated (S3>S2) and 49 were downregulated (S3<S2). The DEGs were depicted on heatmap plots and volcano plots (Figure 5A, D, G and B, E, H). PCA analysis of DEGs showed a significant differentiation of S1, S2 and S3 samples (Figure 5C, F and I).
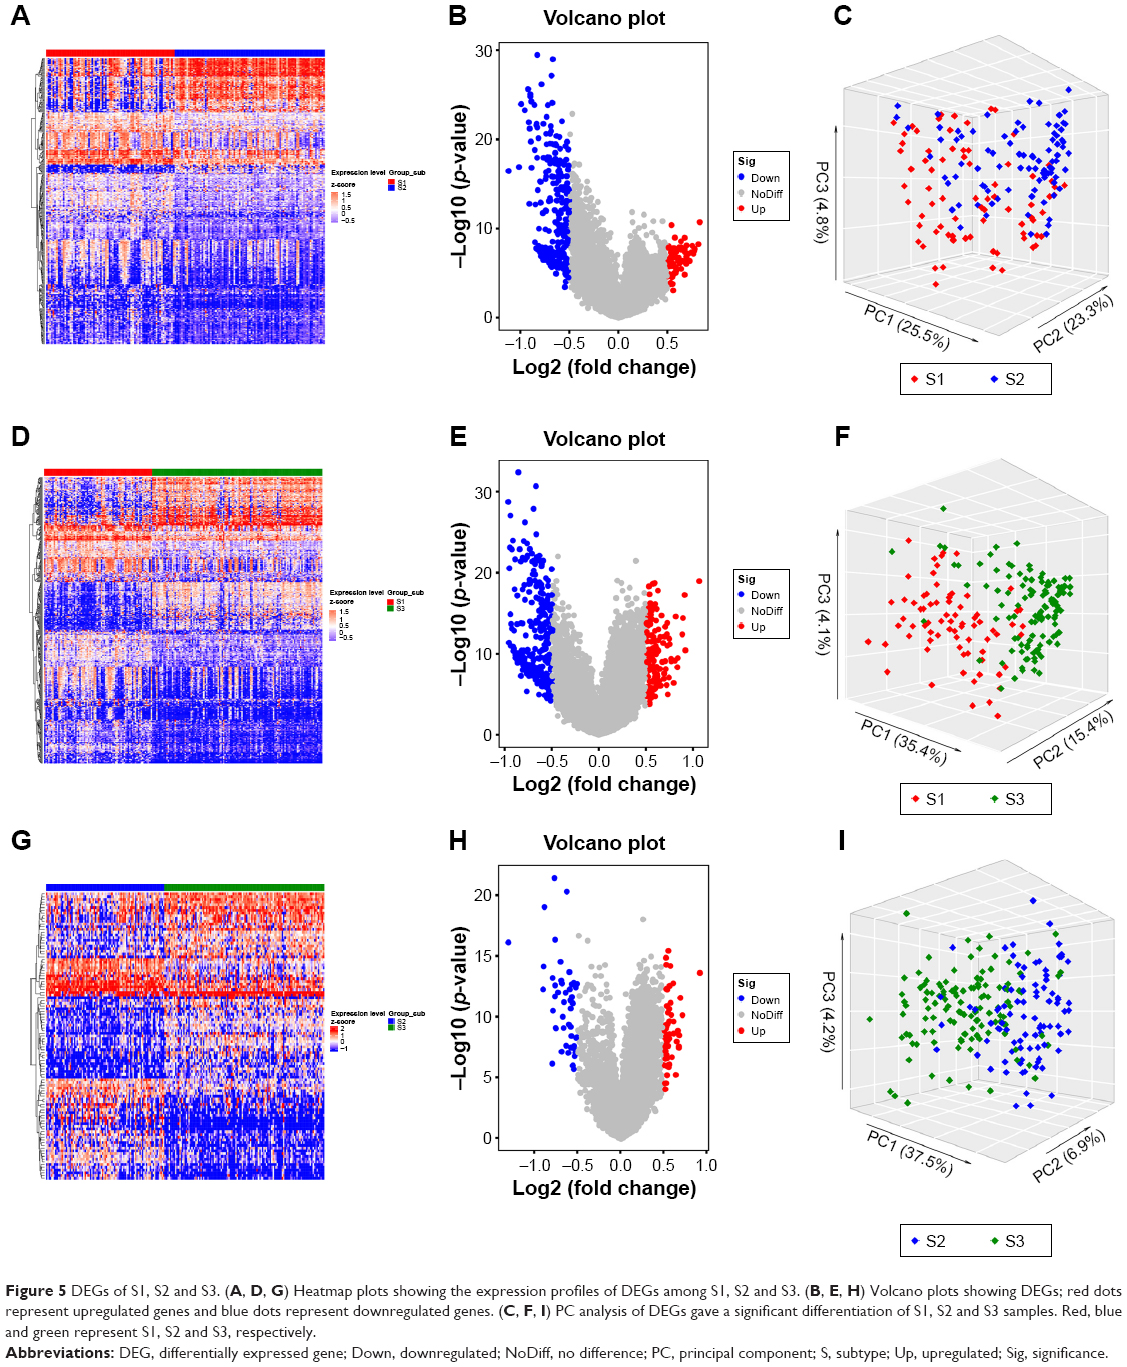 | Figure 5 DEGs of S1, S2 and S3. (A, D, G) Heatmap plots showing the expression profiles of DEGs among S1, S2 and S3. (B, E, H) Volcano plots showing DEGs; red dots represent upregulated genes and blue dots represent downregulated genes. (C, F, I) PC analysis of DEGs gave a significant differentiation of S1, S2 and S3 samples. Red, blue and green represent S1, S2 and S3, respectively. |
Pathways and biological functions differentially enriched KIRP subtypes
Enriched KEGG pathways and GO terms for 347 DEGs (S1 vs S2), 417 DEGs (S1 vs S3) and 105 DEGs (S2 vs S3) were identified. For 347 DEGs of S1 vs S2, there were 19 enriched KEGG pathways (P<0.05) (Table S2). On CC, BP and MF levels, significantly enriched GO terms were 22, 118 and 25, respectively (P-adjust<0.05) (Table S3). The top 10 enriched GO terms and KEGG pathways of DEGs of S1 vs S2 are shown in Figure 6A and D. For 417 DEGs of S1 vs S3, there were 26 enriched KEGG pathways (P<0.05) (Table S4). On CC, BP and MF levels, significantly enriched GO terms were 14, 137 and 25, respectively (P-adjust<0.05) (Table S5). The top 10 enriched GO terms and KEGG pathways of DEGs S1 vs S3 are shown in Figure 6B and E. For 105 DEGs of S2 vs S3, there were 17 enriched KEGG pathways (P<0.05) (Table S6). On CC, BP and MF levels, significantly enriched GO terms were 4, 44 and 15, respectively (P-adjust<0.05) (Table S7). The top 10 enriched GO terms and KEGG pathways of DEGs S2 vs S3 are shown in Figure 6C and F. In S1 and S2 subtypes, the association of DEGs belonging to multiple annotation categories of GO terms on BP, CC and MF levels are shown in Figure 7A–C. The results suggested that most GO terms were focused on immune response. In S1 and S3, most annotation categories of GO terms, such as “humoral immune response mediated by circulating immunoglobulin” and “immunoglobulin-mediated immune response”, were also related to immune response (Figure 7D–F). In S2 and S3, few genes were enriched in the annotation categories of GO terms on BP, CC and MF levels (Figure 7G–I). The enrichment results for DEGs of S1, S2 and S3 were constructed with an enrichment network which depicted the gene size and P-adjust of GO terms on BP, CC and MF levels (Figure 8).
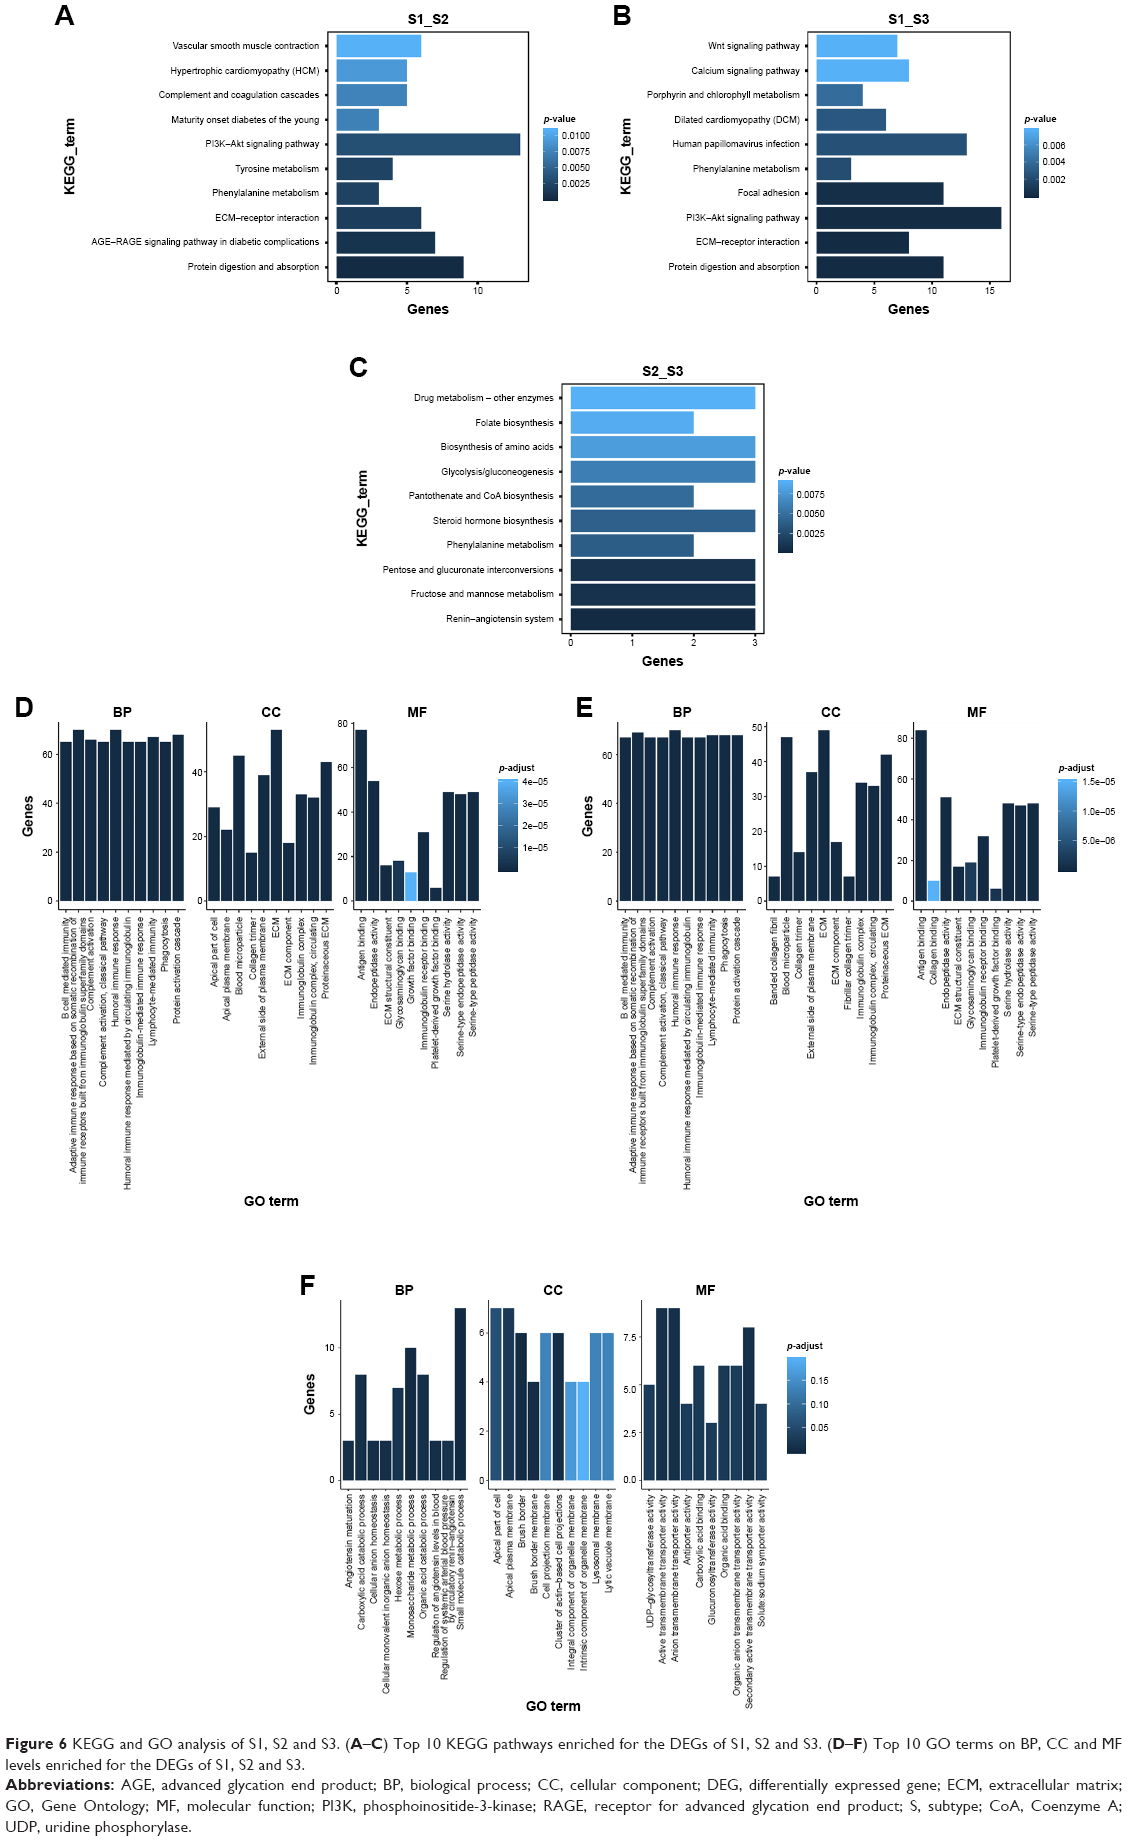 | Figure 6 KEGG and GO analysis of S1, S2 and S3. (A–C) Top 10 KEGG pathways enriched for the DEGs of S1, S2 and S3. (D–F) Top 10 GO terms on BP, CC and MF levels enriched for the DEGs of S1, S2 and S3. |
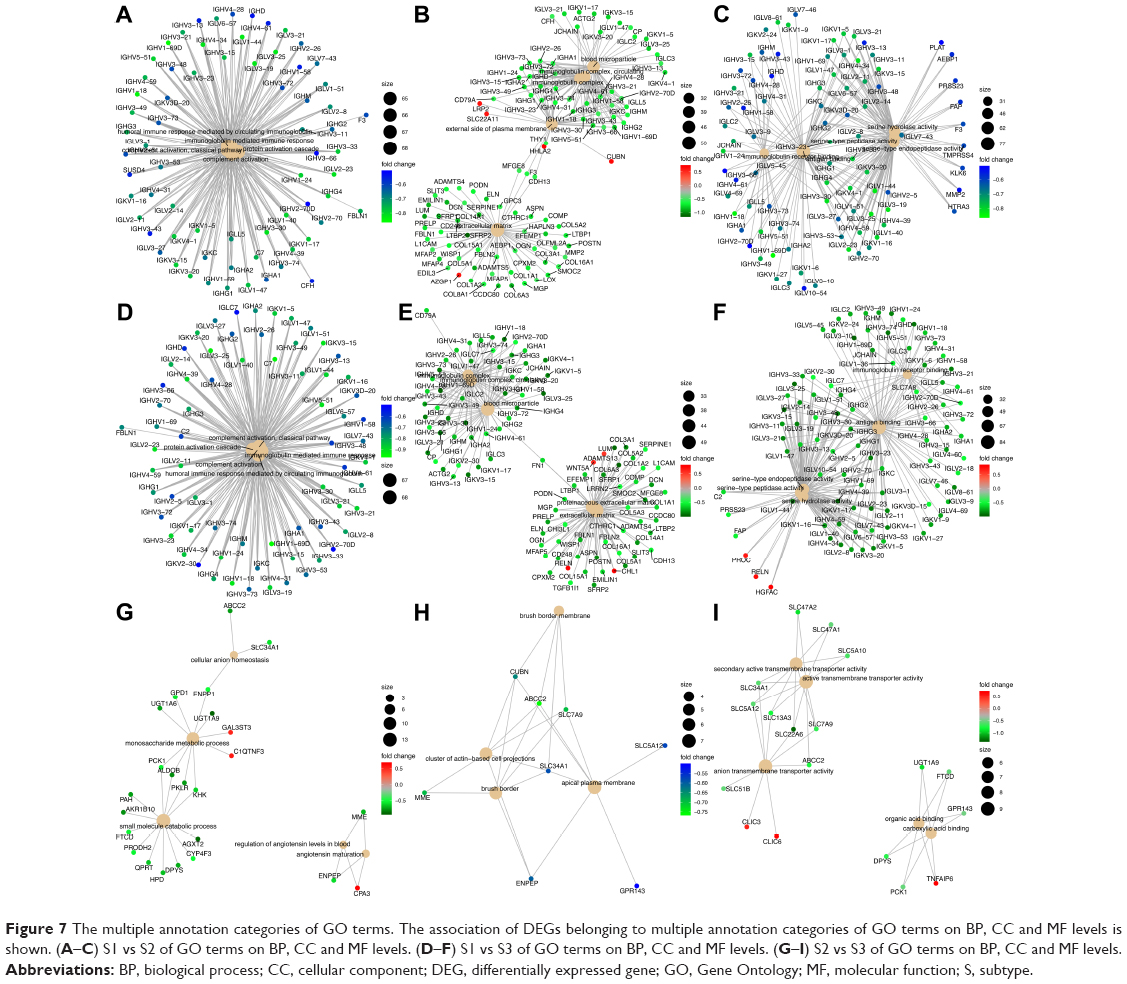 | Figure 7 The multiple annotation categories of GO terms. The association of DEGs belonging to multiple annotation categories of GO terms on BP, CC and MF levels is shown. (A–C) S1 vs S2 of GO terms on BP, CC and MF levels. (D–F) S1 vs S3 of GO terms on BP, CC and MF levels. (G–I) S2 vs S3 of GO terms on BP, CC and MF levels. |
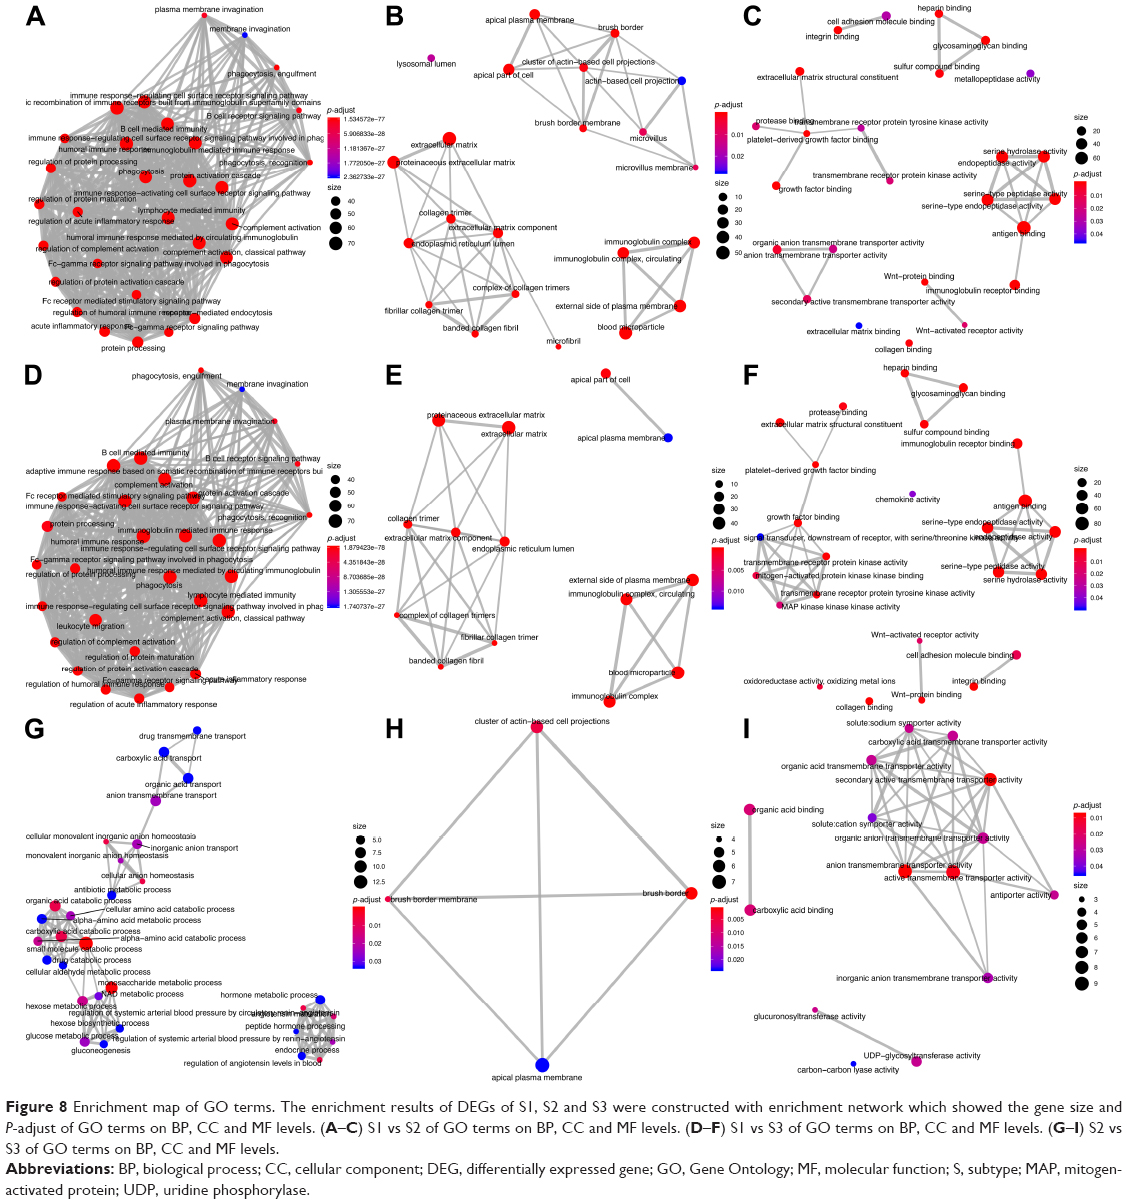 | Figure 8 Enrichment map of GO terms. The enrichment results of DEGs of S1, S2 and S3 were constructed with enrichment network which showed the gene size and P-adjust of GO terms on BP, CC and MF levels. (A–C) S1 vs S2 of GO terms on BP, CC and MF levels. (D–F) S1 vs S3 of GO terms on BP, CC and MF levels. (G–I) S2 vs S3 of GO terms on BP, CC and MF levels. |
Subtype-associated gene mutations
The 17 genes that are highly mutated were identified by maftools after three comparisons: S1 vs S2, S1 vs S3 and S2 vs S3. The comparison results are clearly shown in forest plots (Figure 9A–C). Gene mutation profiles of these highly mutated genes (ATP1B1, CSMD1, CUL3, DYNC1H1, IGSF9B, LRBA, NEB, PARD6B, PBRM1, PKHD1, RERE, SETD2, SF3B1, STAG2, TNRC18, UBR4, WDR81) are shown in Figure 9D.
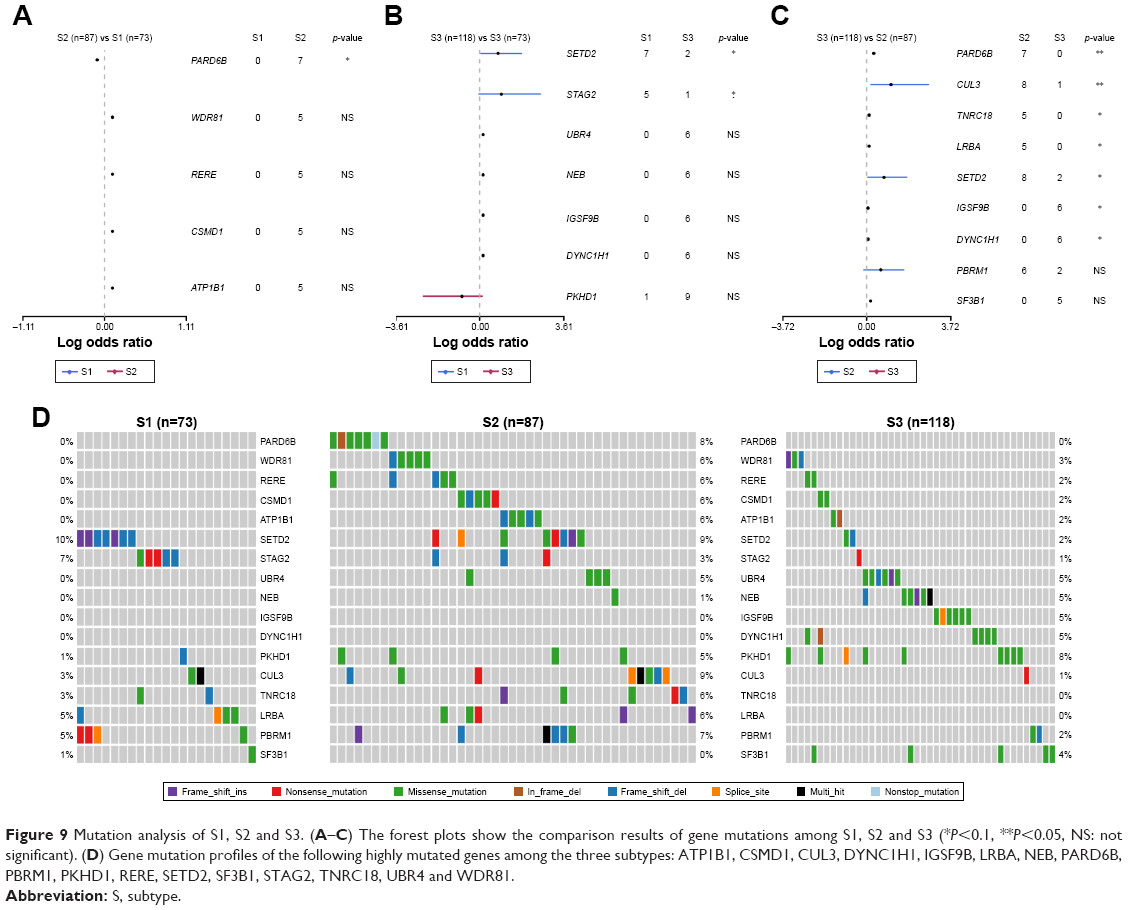 | Figure 9 Mutation analysis of S1, S2 and S3. (A–C) The forest plots show the comparison results of gene mutations among S1, S2 and S3 (*P<0.1, **P<0.05, NS: not significant). (D) Gene mutation profiles of the following highly mutated genes among the three subtypes: ATP1B1, CSMD1, CUL3, DYNC1H1, IGSF9B, LRBA, NEB, PARD6B, PBRM1, PKHD1, RERE, SETD2, SF3B1, STAG2, TNRC18, UBR4 and WDR81. |
Discussion
Recently, some large sequencing studies, such as TCGA, comprehensively characterized the genomic landscape and pathogenesis of KIRP.6 Our understanding about the molecular characteristics and genetic architecture of KIRP was enhanced. Several studies demonstrated that the molecular subtype using sequencing data played important roles in a full comprehension of malignant diseases and personalized therapeutics.20,21 Chen et al22 classified RCCs into nine major genomic subtypes and explored comprehensive molecular characterization of the nine subtypes. In KIRP, two histological subtypes type 1 and type 2 have guided the disease therapy and management.3–6 However, molecular subtypes using sequencing data, such as miRNAs, are still not available.
To enhance our understanding of the biological subtypes and molecular characteristics of KIRP and to help us construct relatively robust personalized therapeutics systems, we performed unsupervised clustering using the most aberrant expressed data of miRNAs to analyze molecular characteristics of KIRP and described three KIRP molecular subtypes. A better understanding of the biomarkers predicting clinical outcomes and the determinants of cancer progression was in urgent need for clinical benefits. In this study, we performed survival analysis and demonstrated that three subtype classifications were significantly associated with patients’ survival. Compared with patients classified as S1 (n=77) and S3 (n=120), the patients who were classified as S2 (n=91) had a better outcome (P<0.0001). Patients with the same cancer were classified into finer taxa and had differential prognosis. The differential clinical outcomes of S1, S2 and S3 pointed out that different clinical management should be adopted for different subtypes. Compared with S2, the patients classified as S1 or S3 who had a worse prognosis should receive more aggressive treatment.
We also explored the molecular characterization of the transcriptome of S1, S2 and S3 subtypes and identified DEGs (S1 vs S2, S1 vs S3 and S2 vs S3). Compared with S1 vs S2 and S1 vs S3, fewer DEGs for S2 vs S3 were identified, indicating that S2 and S3 may be similar in the molecular characterization of transcriptome (Figure 5). In order to further investigate the different characteristics of S1, S2 and S3, enriched KEGG pathways and GO terms for the DEGs of S1, S2 and S3 were identified. Compared with the results of DEGs, few genes for S2 vs S3 in the annotation categories of KEGG pathways and GO terms on BP, CC and MF levels were identified (Figures 6–8). In S1 vs S2 or S1 vs S3, we found that most annotation categories of GO terms, such as “humoral immune response mediated by circulating immunoglobulin” and “immunoglobulin-mediated immune response”, were related to immune response (Figures 6–8). The immune-related annotation categories may hold promise for finding new molecular targets and providing new ideas for the management of patients in immunotherapy.23 Meanwhile, KEGG analysis for S1 vs S2 and S1 vs S3 showed that metabolism-related pathways, such as “phenylalanine metabolism” and “glycine serine and threonine metabolism”, played different roles in S1, S2 and S3 (Figure 6). Except for metabolism-related pathways, cancer development and therapy-related pathways such as the “phosphoinositide-3-kinase (PI3K)–Akt signaling pathway” and the “Wnt signaling pathway” were also identified. The PI3K–Akt signaling pathway has been demonstrated to be involved in many of the mechanisms of targeted therapy and cancer progression.24–27 The aberrant regulation of the Wnt pathway has been indicated as the central mechanism in cancer biology.28–30
More importantly, molecular alteration of the three different subtypes and the genes with significant mutations between those three subtypes were both investigated (Figure 9). Compared with S1 and S3, PARD6B showed a higher mutation rate in S2 (S1 vs S2 vs S31: 0% vs 8% vs 0%). Marques et al demonstrated that PARD6B played a critical role in the suppression of epithelial cell proliferation.31 SETD2 recurrently mutated in KIRP was of higher mutation frequency in S1 and S2 than in S3 (S1 vs S2 vs S3: 10% vs 9% vs 2%).6 Our results provided a comprehensive basis for understanding the molecular basis of three subtypes of KIRP and may lead to more appropriate clinical management and more effective forms of personalized therapy.
Disclosure
The authors report no conflicts of interest in this work.
References
Patard JJ, Leray E, Rioux-Leclercq N, et al. Prognostic value of histologic subtypes in renal cell carcinoma: a multicenter experience. J Clin Oncol. 2005;23(12):2763–2771. doi:10.1200/JCO.2005.07.055 | ||
Mancilla-Jimenez R, Stanley RJ, Blath RA. Papillary renal cell carcinoma: a clinical, radiologic, and pathologic study of 34 cases. Cancer. 1976;38(6):2469–2480. | ||
Delahunt B, Eble JN. Papillary renal cell carcinoma: a clinicopathologic and immunohistochemical study of 105 tumors. Mod Pathol. 1997;10(6):537–544. | ||
Delahunt B, Eble JN, McCredie MR, Bethwaite PB, Stewart JH, Bilous AM. Morphologic typing of papillary renal cell carcinoma: comparison of growth kinetics and patient survival in 66 cases. Hum Pathol. 2001;32(6):590–595. doi:10.1053/hupa.2001.24984 | ||
Pignot G, Elie C, Conquy S, et al. Survival analysis of 130 patients with papillary renal cell carcinoma: prognostic utility of type 1 and type 2 subclassification. Urology. 2007;69(2):230–235. doi:10.1016/j.urology.2006.09.052 | ||
Linehan WM, Spellman PT, Ricketts CJ, et al. Comprehensive molecular characterization of papillary renal-cell carcinoma. N Engl J Med. 2016;374(2):135–145. doi:10.1056/NEJMoa1505917 | ||
Pan YJ, Wei LL, Wu XJ, et al. MiR-106a-5p inhibits the cell migration and invasion of renal cell carcinoma through targeting PAK5. Int J Cancer. 2017;8(10):e3155. | ||
Fan Y, Ma X, Li H, et al. MiR-122 promotes metastasis of clear-cell renal cell carcinoma by downregulating dicer. Int J Cancer. 2018;142(3):547–560. doi:10.1002/ijc.31050 | ||
Li T, Sun X, Xu K. The suppressing role of miR-622 in renal cell carcinoma progression by down-regulation of CCL18/MAPK signal pathway. Cell Biosci. 2018;8:17. | ||
Dasgupta P, Kulkarni P, Majid S, et al. MicroRNA-203 inhibits long noncoding RNA HOTAIR and regulates tumorigenesis through epithelial-to-mesenchymal transition pathway in renal cell carcinoma. Mol Cancer Ther. 2018;17(5):1061–1069. doi:10.1158/1535-7163MCT-17-0925 | ||
Petros FG, Wallis CJD. The utility of microRNAs as biomarkers in predicting progression and survival in patients with clear-cell renal cell carcinoma. BJU Int. 2017;120(3):305–307. doi:10.1111/bju.13931 | ||
Lokeshwar SD, Talukder A, Yates TJ, et al. Molecular characterization of renal cell carcinoma: a potential three-microRNA prognostic signature. Clin Epigenet. 2018;27(4):464–472. | ||
Heinemann FG, Tolkach Y, Deng M, et al. Serum miR-122-5p and miR-206 expression: non-invasive prognostic biomarkers for renal cell carcinoma. Clin Epigenet. 2018;10:11. | ||
Wilkerson MD, Hayes DN. Consensusclusterplus: a class discovery tool with confidence assessments and item tracking. Bioinformatics. 2010;26(12):1572–1573. doi:10.1093/bioinformatics/btq170 | ||
Yu G, Wang LG, Han Y, He QY. Clusterprofiler: an R package for comparing biological themes among gene clusters. OMICS. 2012;16(5):284–287. doi:10.1089/omi.2011.0118 | ||
Mayakonda A, Koeffler HP. Maftools: efficient analysis, visualization and summarization of maf files from large-scale cohort based cancer studies. BioRxiv. 2016:052662. | ||
Therneau TM, Grambsch PM. Modeling Survival Data: Extending the Cox Model. Berlin: Springer Science and Business Media; 2000. ISBN 0-387-98784-3. | ||
Gu Z, Eils R, Schlesner M. Complex heatmaps reveal patterns and correlations in multidimensional genomic data. Bioinformatics. 2016;32(18):2847–2849. doi:10.1093/bioinformatics/btw313 | ||
Chiu DS, Talhouk A. diceR: an R package for class discovery using an ensemble driven approach. BMC Bioinformatics. 2018;19(1):11. | ||
Saleeb RM, Brimo F, Farag M, et al. Toward biological subtyping of papillary renal cell carcinoma with clinical implications through histologic, immunohistochemical, and molecular analysis. Am J Surg Pathol. 2017;41(12):1618–1629. doi:10.1097/PAS.0000000000000962 | ||
Robertson AG, Shih J, Yau C, et al. Integrative analysis identifies four molecular and clinical subsets in uveal melanoma. Cancer Cell. 2017;32(2):204.e215–220.e215. doi:10.1016/j.ccell.2017.07.003 | ||
Chen F, Zhang Y, Senbabaoglu Y, et al. Multilevel genomics-based taxonomy of renal cell carcinoma. Cell Rep. 2016;14(10):2476–2489. doi:10.1016/j.celrep.2016.02.024 | ||
Vargas AJ, Harris CC. Biomarker development in the precision medicine era: lung cancer as a case study. Nat Rev Cancer. 2016;16(8):525–537. doi:10.1038/nrc.2016.56 | ||
Fresno Vara JA, Casado E, de Castro J, et al. PI3K/Akt signalling pathway and cancer. Oncogene. 2004;30(2):193–204. | ||
Luo J, Manning BD, Cantley LC. Targeting the PI3K-Akt pathway in human cancer: rationale and promise. Cancer Cell. 2003;4(4):257–262. | ||
Zhang Y, Kwok-Shing Ng P, Kucherlapati M, et al. A pan-cancer proteogenomic atlas of PI3K/AKT/mTOR pathway alterations. Cancer Cell. 2017;31(6):820.e823–832.e823. doi:10.1016/j.ccell.2017.04.013 | ||
Edlind MP, Hsieh AC. PI3K-AKT-mTOR signaling in prostate cancer progression and androgen deprivation therapy resistance. Asian J Androl. 2014;16(3):378–386. doi:10.4103/1008-682X.122876 | ||
Zhan T, Rindtorff N, Boutros M. Wnt signaling in cancer. Oncogene. 2017;36(11):1461–1473. doi:10.1038/onc.2016.304 | ||
Polakis P. Wnt signaling in cancer. Cold Spring Harb Perspect Biol. 2012;4:a008052. doi:10.1101/cshperspect.a008052 | ||
Uematsu K, He B, You L, et al. Activation of the wnt pathway in non small cell lung cancer: evidence of dishevelled overexpression. Oncogene. 2003;22(46):7218–7221. doi:10.1038/sj.onc.1206817 | ||
Marques E, Englund JI, Tervonen TA, et al. Par6G suppresses cell proliferation and is targeted by loss-of-function mutations in multiple cancers. Oncogene. 2016;35(11):1386–1398. |
 © 2019 The Author(s). This work is published and licensed by Dove Medical Press Limited. The full terms of this license are available at https://www.dovepress.com/terms.php and incorporate the Creative Commons Attribution - Non Commercial (unported, v3.0) License.
By accessing the work you hereby accept the Terms. Non-commercial uses of the work are permitted without any further permission from Dove Medical Press Limited, provided the work is properly attributed. For permission for commercial use of this work, please see paragraphs 4.2 and 5 of our Terms.
© 2019 The Author(s). This work is published and licensed by Dove Medical Press Limited. The full terms of this license are available at https://www.dovepress.com/terms.php and incorporate the Creative Commons Attribution - Non Commercial (unported, v3.0) License.
By accessing the work you hereby accept the Terms. Non-commercial uses of the work are permitted without any further permission from Dove Medical Press Limited, provided the work is properly attributed. For permission for commercial use of this work, please see paragraphs 4.2 and 5 of our Terms.